1. Introduction
Countries endowed with natural resources should fare better and develop faster than countries devoid of valuable natural capital. However, this is not always the case, as some countries with abundant natural resources experience higher levels of poverty, inequality, and civil unrest than others (
Ampofo et al. 2020). Existing empirical studies show that natural resource abundance has a negative effect on economic growth, a phenomenon known in most countries as the resource curse (
Sachs and Warner 1995). According to
Auty and Furlonge (
2019), abundant natural resources have not been the panacea for igniting or sustaining economic growth and development in many countries. The purely economic view of the natural resource curse is based on explaining why resource-rich countries grow more slowly than resource-poor countries (
Frankel 2010;
Sachs and Warner 1997).
The economic value derived from natural resources such as land, minerals, and water is referred to as resource rent. The difference between the market price of the resource and the cost of production can be used to calculate resource rent (
OECD 2022). The economic value of resource rent is not accounted for in the calculation of a country’s GDP. While resource rent helps a country’s economy grow, it does not directly contribute to GDP. For example, if a country extracts oil from its land, the revenue from selling the oil increases the country’s GDP, but the value of the oil itself does not. Resource rent, on the other hand, is the difference between the market price of oil and the cost of extracting it (
OECD 2022).
In recent years, after the introduction of the Sustainable Development Goals (SDG) in 2015, several governments have prioritized environmental challenges such as air pollution, poor sanitation, and significant damage to natural resource rents (
OECD 2011) and forest reserves (
Pereira-Romeiro et al. 2021). Governments are also focusing on green finance to solve environmental issues (
Bhatnagar et al. 2022b). Human health and economic well-being are jeopardized by poor environmental conditions (
Tallis et al. 2008). These aspects, including well-being, environmental and physical capital, and approaches to water, food, and land, are all susceptible to climate change (
Ibarrarán et al. 2009). These environmental concerns have generated a global movement to combat climate change (
Han and Ahn 2020). Nonetheless, the majority of the Belt and Road Initiative countries must struggle to update their manufacturing progress (
Tekdal 2018), resulting in significant fossil fuel energy consumption in the production division (
York 2012), which contributes to global warming. Carbon (CO2) emissions have historically been employed as a proxy for environmental quality in the present ecological sustainability literature (
Alola and Kirikkaleli 2019). However, numerous researchers have questioned this measure, claiming that CO2 emissions only account for a small percentage of the whole environment and do not adequately capture environmental contamination (
Han et al. 2019).
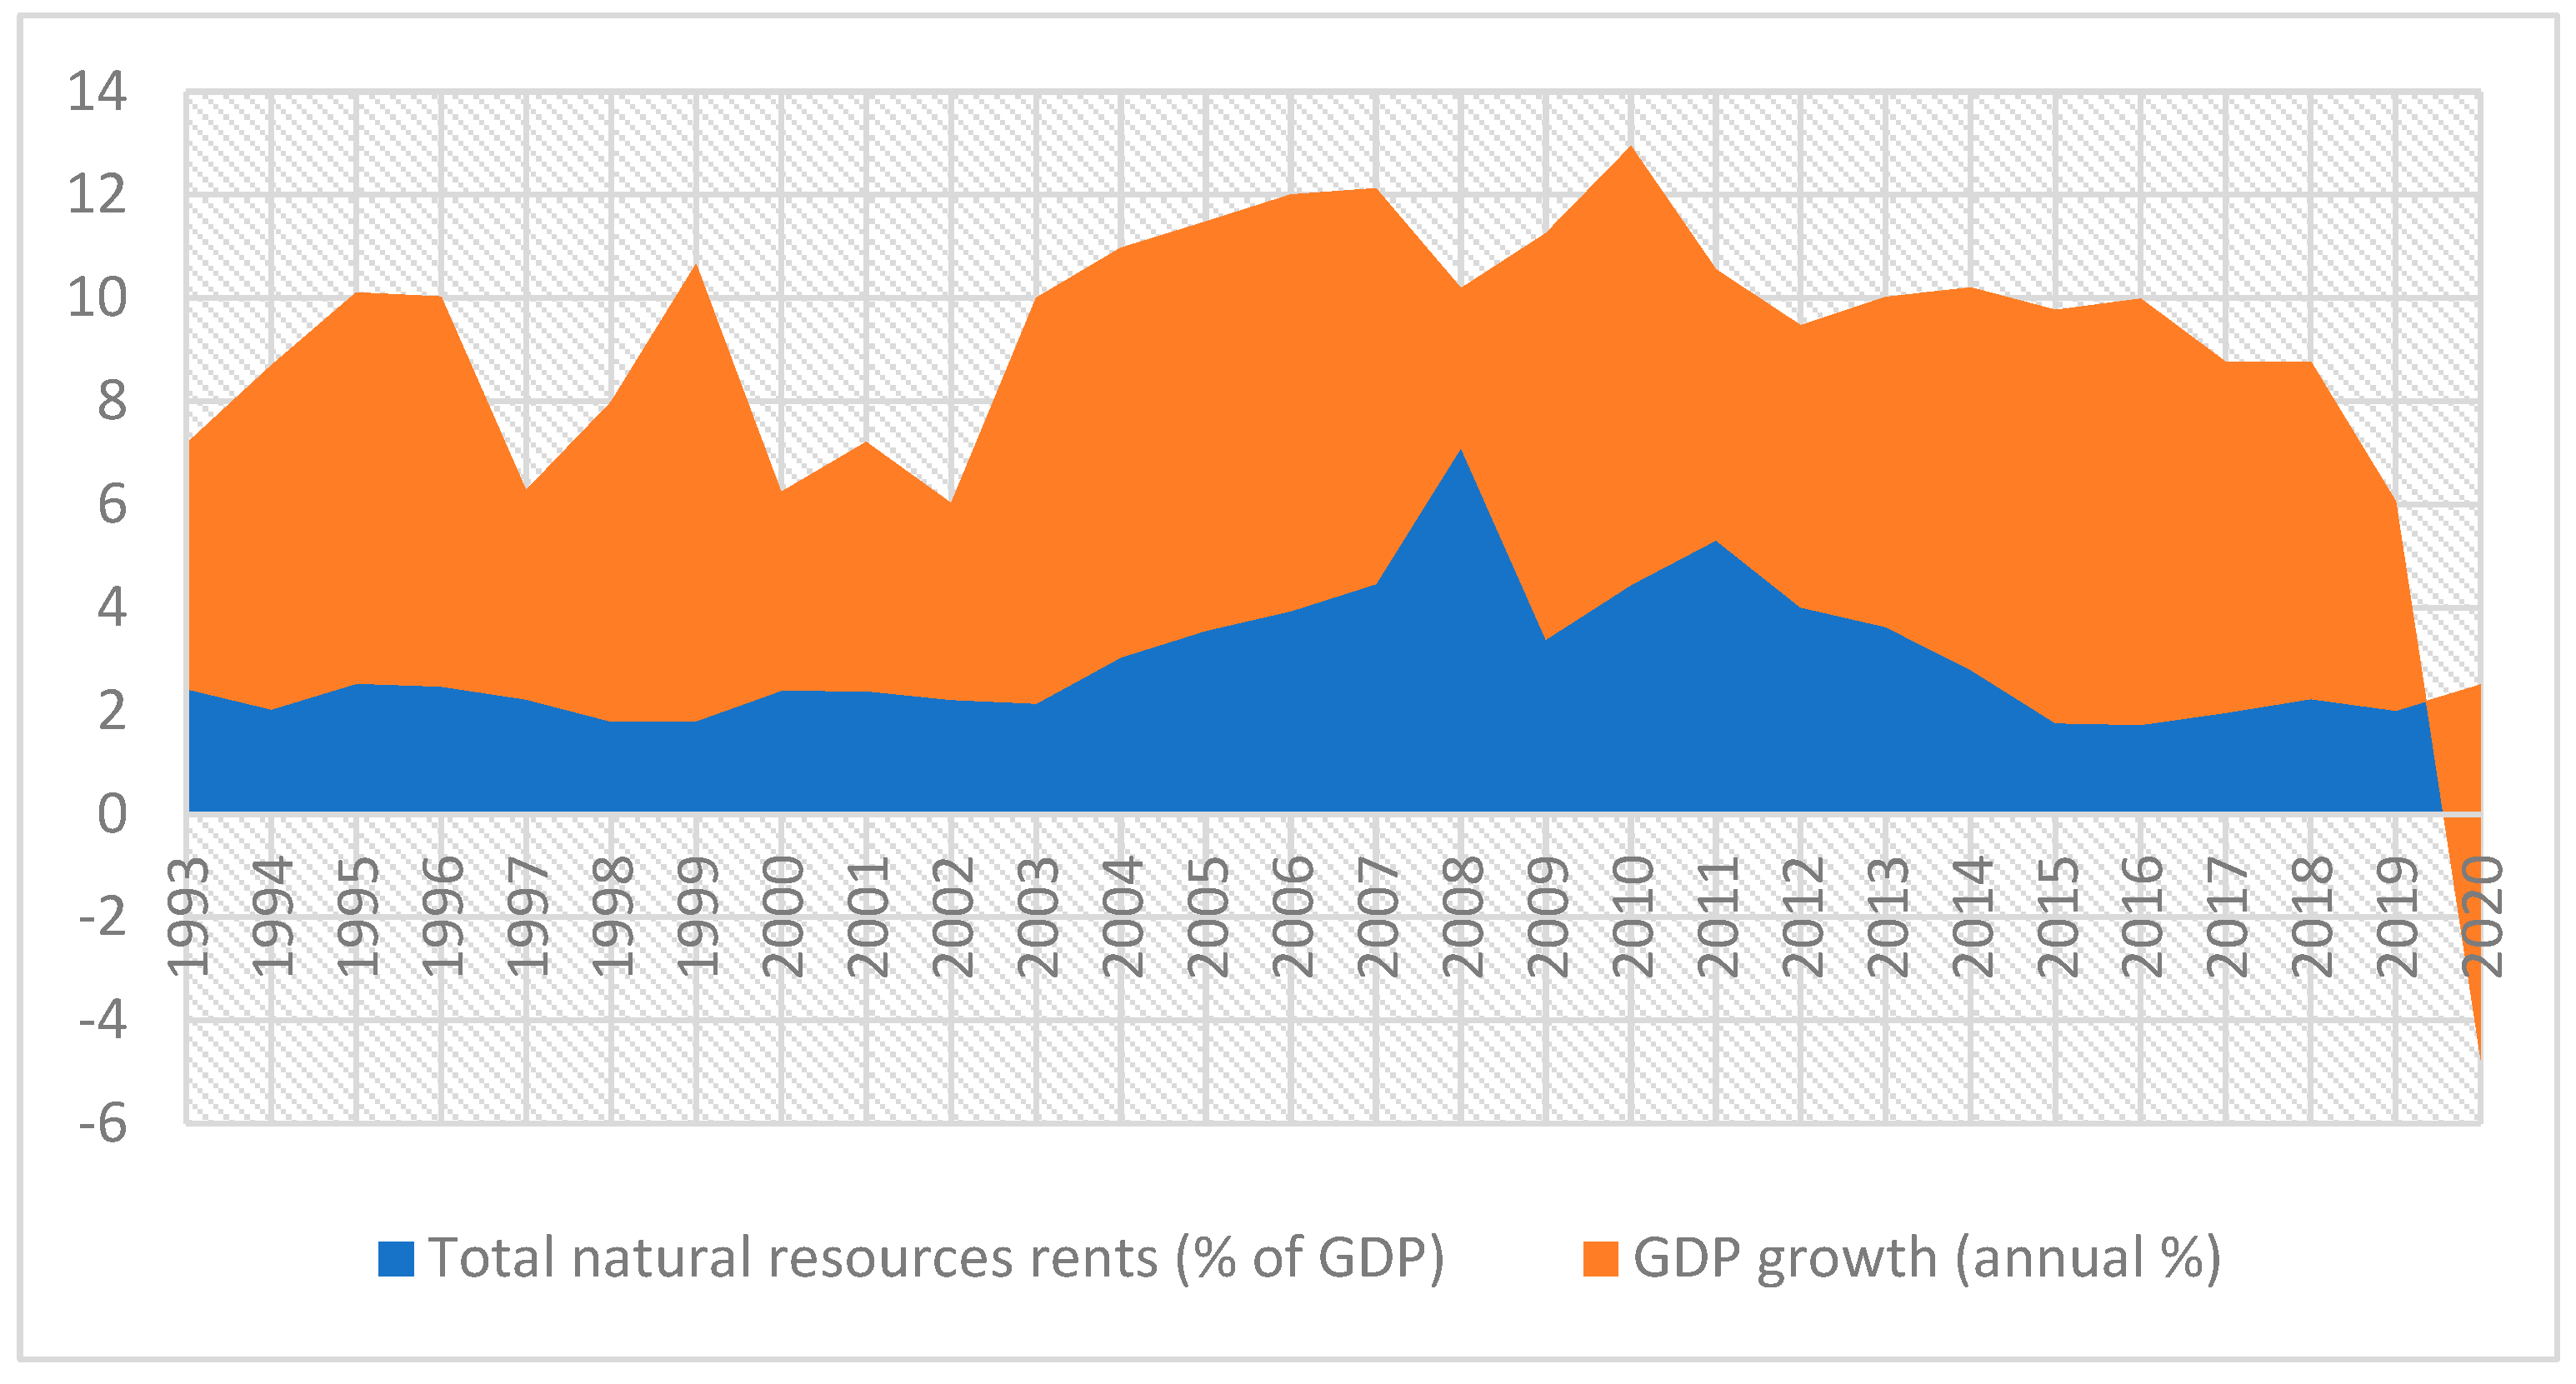
We analyzed NRR and GDP data from the World Bank’s official website collected between 1993 and 2020 to achieve the study’s aim. To identify causality between NRR and GDP, we used the Granger causality test. The augmented autoregressive distributed lag (ARDL) bound test was used to estimate the effect of NRR on GDP. We discovered that NRR has a significant short-term and long-term impact on the Indian economy’s GDP.
This study helps to determine whether an exclusive policy is necessary for the effective management of the complex interactions between various forces in the economic, political, and social environments. This study makes a contribution by emphasizing the need for India to develop standard policies to improve utility extraction efficiency from natural resources.
The article is organized as follows:
Section 2 includes a review of the literature, which we used to develop the hypotheses, and
Section 3 discusses the research methodology used. The research findings are presented in
Section 4. The scientific and practical implications of the study’s findings are discussed in
Section 5.
Section 6 summarizes the results and makes recommendations for additional study.
2. Literature Review and Hypotheses Development
Natural resource rents are calculated as the difference between an item’s value and the average cost of producing it (
Hamilton and Clemens 1999). This is accomplished by calculating the value of units of specific supplies and subtracting valuations of typical unit expenses for extraction or harvesting costs (
Hung 1993). The rents on all of these modules are then multiplied by the amount of material extracted or harvested by nations to obtain the rents on each item as a percentage of GDP (
Hamilton and Ruta 2006).
Records for the influence of natural resources on financial production is vital in establishing an systematic outline for sustainable progress (
Shi and Gill 2005). Profits from natural assets, particularly minerals and fossil fuels, account for a significant portion of GDP in some countries, and the majority of these revenues are in the form of monetary rents—income above the cost of extracting the resources (
Mehar et al. 2018). As natural resources are not created, they generate economic rents (
Mehar et al. 2018). For created services and commodities, competitive forces increase supply until revenues are pushed to zero, whereas natural assets that have a predetermined supply typically command revenues far in excess of their production costs (
Arrow and Debreu 1954). Rents from non-renewable resources such as fossil fuels and minerals, as well as rents from overharvesting of the jungle, demonstrate a “liquidation of a country’s capital stock” (
Mehar et al. 2018). When governments use such rents to fund current expenditure rather than new wealth expenditure to replenish what has been depleted, they borrow from their future prospects (
Schumpeter and Keynes 1936).
Revenue collected through taxation systems or schemes is a significant economic source for a country’s project development and the achievement of its macroeconomic goals. As a result, natural resources are important in both established and emerging economies. Rent-based resources are crucial in determining economic well-being (
Mpofu 2021).
The consequences of financial globalization on environmental dilapidation (CO2 emissions) were examined for the G7 nations from 1996 to 2017. The empirical evidence indicates that economic globalization, financial growth, and the exploitation of natural assets contribute to the rise in carbon emissions. For the long-term and short-term findings of the empirical research, this work employs innovative econometric methodologies such as CS-ARDL (
Wang et al. 2020). This study aimed to determine if NRR may amplify the positive relationship between industrial growth and human capital with a sample of 14 Sub-Saharan African nations, covering the period of 1995 to 2015. The empirical data specify that NRR has a negative and statistically negligible effect on industrial improvement. It was also disclosed that the industrial sector has yet to reap significant benefits despite the enormous rents generated by natural resources (
Bolarinwa et al. 2019).
Decentralization of fiscal policy and rent from natural resources affect CO2 emissions. The article of
Tufail et al. (
2021) accomplishes this purpose by analyzing panel data from seven highly decentralized members of the OECD nations from 1990 to 2018. At the 1st difference, all variables are shown to be stationary. Long-run results indicate that devolution and natural capital rents help the environment reduce CO2 emissions (
Tufail et al. 2021).
Given China’s severe environmental degradation, the current study establishes the different factors’ dependency trends, emphasizing the intersection of eco-revolution and biological impact throughout many quantiles of the distributions, which has not been investigated previously in the research. As experimental evidence demonstrates, growing private-sector debt and ecological benefits contribute to environmental deterioration (
Afshan and Yaqoob 2022).
Total resource rents (coal rentals, mineral rents, natural gas rental costs, and forest rents) have been evaluated in a worldwide sample of 90 countries. Economic expansion, FDI inflows, investment, government expenditures, and demographic considerations were used as control variables. The global sample consisted of 90 economies. Natural rents are influenced by economic complexity, but only in low- and lower-middle income economies and high-income economies, and not in upper-middle income economies, according to the findings (
Canh et al. 2020).
Development in underdeveloped nations is directly linked to the amount of natural resource rents they obtain from their natural resources. Research on the consequences of natural resource rents shows that this connection varies by area, income level, degree of development, and export structure. When CO2 emissions are added as an interaction variable for Africa, natural resource rents have a detrimental influence on inclusive personal expansion (
Nchofoung et al. 2021).
It is crucial for ecological progress to focus on both sustainable production and consumption (
Rupeika-Apoga and Petrovska 2022). Panel data analysis yielded robust findings by combining different econometric methodologies. Granger causality arises between two variables, particularly financing and natural resource rents. The second place indicates that a deepening of the financial markets has a favorable impact on natural resource rents (
Nguyen and Nguyen 2020).
Researchers have long been interested in what happens when natural resources are abundant and how this affects economic development, both theoretically and empirically. However, opinions differ on whether a resource surplus helps or hinders economic growth. The studies found no discernible pattern despite using a variety of samples, data sources, and approaches.
Torvik (
2002) develops a novel and relatively simple mechanism to explain how an abundance of natural resources may be detrimental to people’s well-being.
Gyamfi et al. (
2022) agree with the assertion that the majority of profits from natural resource rents go toward increasing production, which has a negative impact on the environment and a country’s economic development. A country’s stable monetary system supports economic growth, which in turn supports the growth of other industries (
Rupeika-Apoga et al. 2022). The empirical findings have important policy implications, particularly for the need to promote globalization and human capital development in order to ensure the appropriate management of natural resource rent, which is critical for financial sector growth (
Guan et al. 2020).
While most empirical results of the resource effect include how the development path is decided through the channel of institutions, the question of why resource rents frequently fail to inspire more robust governance is more important than ever for the nation’s economic development (
Fagbemi and Adeoye 2020).
The relationship between NRR and GDP is complicated and is affected by a number of factors, including the type of resource, the country’s economic policies, and its ability to diversify its economy (
Dramani et al. 2022;
Ben-Salha et al. 2021;
Ibrahim 2017). The Granger causality test is frequently used to investigate the relationship between NRR and GDP, as this statistical hypothesis test determines whether NRR is useful in forecasting GDP. The Granger causality test had an insignificant impact in Australia, Brazil, Canada, China, Saudi Arabia, the United States, and Venezuela (
Ampofo et al. 2020). Long-run Granger causality tests conducted by
Mohamed (
2020) revealed a unidirectional causal relationship running from resource rents to GDP growth, as well as development expenditure to GDP growth. The Toda–Yamamoto test method also revealed a unidirectional causality connecting oil resource rent to Ghana’s economic growth (
Adabor et al. 2022). Considering this, we proposed the following hypotheses:
H1a. Total natural resource rents (NRR) do not Granger-cause GDP in India.
H1b. GDP does not Granger-cause total natural resource rents (NRR) in India.
Natural resource rents, according to one study (
Mehar et al. 2018), have a significant impact on a country’s GDP and overall economic activity. Natural resources, according to
Stijns (
2005), are not significant determinants of economic growth due to the coexistence of positive and negative channels of effect running from natural resources to factors affecting economic growth. According to
Ben-Salha et al. (
2021), there has been a massive body of research on the impact of natural capital on GDP development over the last several decades. The research has focused on developed and emerging countries, particularly those with abundant natural resources (
Rudra and Jensen 2011). In empirical studies of the natural resources–economic growth nexus, two primary indicators, resource dependency and resource abundance, have been considered (
Xu et al. 2022). The former describes a scenario in which a country’s earnings are primarily derived from the extraction and sale of natural resources, whereas the latter describes a scenario in which such resources are abundant (
Mehlum et al. 2006). The yearly per capita rent of resource output captures the abundance of resources. Natural resource rents over GDP, the percentage of total natural resource exports in GDP, and the share of natural resources in total exports, on the other hand, are indicators of resource dependency (
Yilanci et al. 2021). According to the study by
Topcu et al. (
2020), the majority of natural resource rent earnings are invested in expanding production, which has a negative impact on the environment and slows a country’s economic growth. A country’s stable monetary system promotes economic development, which in turn encourages the expansion of other businesses (
Friedman 2017). Natural resource rent management is critical to financial sector expansion, and
Ncube et al.’s (
2014) empirical findings have important policy implications on this front. Even though most empirical data on resource impact conclude that the development path is chosen through institutions (
Khan et al. 2020), it is more important than ever for a country’s economic growth to address why resource rents frequently fail to inspire more strong governance (
Collier 2005;
Kaur et al. 2021). Therefore, we hypothesize:
H2. Total natural resources rents (NRR) have no significant impact on India’s GDP.
4. Results
Table 1 displays descriptive statistics.
Table 2 shows the unit root test for the dependent variable in the study.
Table 2 applies unit root test on GDP and NRR by using following equation:
After performing the unit root test on India’s GDP, the likelihood is greater than 0.05, which is marginally related to data stationary. Furthermore, the Dickey–Fuller test t-statistic is less than two, implying that we cannot rule out the possibility that GDP does not have a unit root. The unit root measurement has a lag length of zero, which is automatically determined from SIC with a maximum lag of six.
Table 2 shows the statistics for using the unit root test with the least squares method on the dependent variable, GDP. These calculations were performed at a level that yielded a log-likelihood of −67.75. The values in
Table 2 show that the series is not stationary at the level of India’s GDP.
Table 2 also includes the augmented Dickey–Fuller test statistics for the first difference with a leg length of zero and a maximum lag of six. It demonstrates critical test values at 1%, 5%, and 10% significance levels. The probability value is 0.0058, which is less than 0.05, and this is why the results are statistically significant. The supporting calculations regarding the augmented Dickey–Fuller test provide insight into the further analysis of whether the series chosen can be considered to have concluded. Log-likelihood and the augmented Dickey–Fuller test were used to validate the unit root test statistics calculations. The negative log-likelihood value (−66.46) is a good sign, and the F statistic (15.55) indicates a favorable Dickey–Fuller test result. The p-value of the unit root test, on the other hand, is 0.0006, which is less than 0.05. Based on this value, the series of India’s GDP can be interpreted as stationary at first difference.
The calculations regarding the augmented Dickey–Fuller to verify the presence of the unit root in the series of NRR are constructed in
Table 2. The calculation is initiated by assuming that NRR have a unit root test. The calculations were performed with a leg length of zero and a max lag of six. The probability value was less than 0.05, and the critical test values of the independent variable were tested at three levels of significance: 1%, 5%, and 10%. Based on the values given in
Table 2, the sum of the square of residuals (25.39), the log-likelihood (−36.58) and the value of F statistics (50.28) indicate a good sign for the time-series data collected as an independent variable. Moreover, the p-value shown in
Table 2 for the NRR is almost zero, less than 0.05. This value of probability results in the rejection of the null hypothesis for the NRR, which shows the series is stationary at a level. As a result, as an interpretation, the independent variable of the research is stationary at the level and the dependent variable is stationary at the first difference. Therefore, the ARDL model is an optimal model to measure the impact of an independent variable on a dependent variable.
Table 3 displays the Granger causality test results. The purpose of this test was to determine which variables are dependent and which are independent. The test revealed that unidirectional causality exists from NRR to GDP.
It means that NRR have an effect on GDP. As a result, the upcoming analysis will assess the long and short run effects of NNR on India’s GDP.
Table 4 includes statistical values for the F-bound test, which assumes no levels of relationships as the null hypothesis. In
Table 4, the value of the F statistic is analogized with a lower and upper bound at a 10%, 5%, 2.5%, and 1% level of significance for testing the significance of the continuation of a relationship between the regressor and controlled variable. On the test application, the F value is 8.629. This is greater than all of the upper bound values, which are 3.8, 4.6, 5.39, and 6.44 at 10%, 5%, 2.5%, and 1%, respectively. Hence, based on these calculations, it can be deduced that there is cointegration between the variables chosen for research.
The application of the autoregressive distributed lag model on India’s GDP as a dependent variable and NRR as an independent variable shows specific statistics exhibited in
Table 5. The test includes a total of 27 observations, which are taken into account after adjustments. Four lags are selected automatically, and the model selection criteria are conducted based on the Akaike info criterion (AIC). The t statistics and probability values show that the model is a good fit, with t-values greater than 2 and p-values less than 0.05.
Table 6 and
Table 7 contain the conditional error correction regression of ARDL long-run form and bound test. This regression test contains GDP as the dependent variable and NRR as the independent variable. The ARDL model is run as a case of restricted constant and no trend, which includes time-series data of 27 observations each of dependent and independent variables.
Table 6 shows a compatible t-Bound distribution because the p-values of both constant and NRR are less than 0.05, indicating that the results are significant in the model.
Furthermore, the level equation’s restricted constant and no trend value in
Table 7 show that the relationship is significant because the probability is less than 0.05. The coefficient value of 2.962638 indicates that the relationship is also positive. Hence, the values shown in
Table 7 reveal a direct and significant relationship between dependent and independent variables in the long run.
Table 8 contains the test application of ARDL on the error correction model. The statistical calculations shown in the table determine whether or not there is a long-term relationship between the variables. The coefficient of the cointegration equation, which has the value −0.3466 in
Table 8, is used to estimate the probability of predicting a long relationship. When this value is combined with the probability value of 0.0276, it can be deduced that the long-term adjustment is negative and significant, indicating that the model will adjust monotonically.
Table 9 displays the F-bound test values, which are computed under the assumption of the null hypothesis, which states that no levels of relationships exist between the variables. Furthermore, the statistics value is 11.62971, which is greater than the upper bound values at a 10%, 5%, 2.5%, and 1% level of significance, indicating long-run cointegration among the variables.
5. Discussion
Natural resource rent is an important component of the economy because it provides governments and people with a consistent and reliable source of income. Natural resource rent is generated by the extraction of natural resources such as oil, gas, minerals, and timber, and it can be a significant source of government revenue in resource-rich countries (
Dramani et al. 2022). The term “Dutch disease”, which is frequently used in the “resource curse” literature, was coined to describe the Dutch economic experience, in which the manufacturing sector declined and general inflation increased as a result of the booming natural gas sector (
Horsley et al. 2015). Identifying the impact of natural resource rents on GDP in India is difficult due to a lack of reliable data and research. Some findings indicate that natural resource rents have boosted India’s economic growth (
Mehar et al. 2018). While natural resource rent is a curse in India, Australia, and the Democratic Republic of the Congo, it has boosted growth in Brazil and Canada, according to
Ampofo et al. (
2020). Furthermore, according to
Dramani et al. (
2022), natural resource rent can have a double threshold effect on economic growth. When aggregate natural resource rent exceeds 6% of GDP, the negative impact on economic growth is significant; however, as rents rise above 6% to around 15% of GDP, the negative impact on economic growth decreases significantly.
In our study, we first established a causal relationship between GDP and NNR to investigate the role of NRR in the growth of India’s GDP. We discovered a statistically significant causal relationship between NRR and GDP, as the p-value of the test is less than 0.05. This means that NRR can be used to forecast India’s GDP. As a result, we were able to reject H1a, which states that total natural resource rents (NRR) do not Granger-cause GDP, implying that NRR does.
Our findings are consistent with
Mohamed’s (
2020) long-run Granger causality tests, which revealed a unidirectional causal relationship running from resource rents to GDP growth as well as development expenditure to GDP growth. The Toda–Yamamoto test method also revealed a unidirectional causality running from oil resource rent to Ghana’s economic growth (
Adabor et al. 2022).
We have not found evidence for GDP Granger-causing NRR. As a result, we failed to reject H1b, that GDP does not Granger-cause total natural resource rents (NRR) in India. When investigating a series of unit root and causality tests to detect causality between GDP and energy consumption in Turkey using Hsiao’s version of the Granger causality method for the 1950–2000 period,
Altinay and Karagol (
2004) discovered that there was no evidence of causality between GDP and energy consumption in Turkey based on detrended data. According to
Indra de Soysa (
2015), resource dependence measured by rents per GDP and resource abundance measured by rents per capita are not causally related.
Based on the results of the application of autoregressive distributed lag to the framed time series data set, it is possible to conclude that NRR have a significant impact on India’s GDP. The final result values of the ARDL bound tests in
Table 5 show that NRR have a significant short-term impact on the Indian economy’s GDP. The p-value is 0.0002 and is less than 0.05, which is used to interpret the significant short-term influence of NRR on GDP.
Table 9 also shows the F-bound test results under the null hypothesis, that there are no correlations between the variables. The statistical value of 11.62971 is greater than the upper limits of significance at 10%, 5%, 2.5%, and 1%, indicating that the variables are cointegrated in the long run. Cointegration indicates that the NRR and GDP series are linked and move in tandem over time; when one series rises or falls, the other follows suit. Cointegration can be used to forecast NRR and GDP values in the future. This means we can reject H2, which claims that NRR have no effect on India’s GDP. Our findings are supported by the
Adabor et al. (
2022) study, the main finding of which revealed that a 1% increase in oil resource rent generates a 0.84% increase in Ghana’s economic growth in the long run.
Ampofo et al. (
2020) examined the impact of total natural resource rent on economic growth using the nonlinear autoregressive distributed lag (NARDL) and nonlinear Granger causality in the case of the world’s top ten mineral-rich countries from 1981 to 2017. They discovered nonlinear cointegration between total natural resource rent, trade openness, and economic growth in Australia, Brazil, Canada, the Democratic Republic of the Congo (DRC), India, and Saudi Arabia. These findings support our findings of cointegration between total natural resource rent and economic growth. Furthermore, they discovered that total natural resource rent has a negative impact on economic growth in Australia, the Democratic Republic of the Congo, and India, confirming the resource curse phenomenon in these countries. This highlights the implications of our study findings, which suggest that Indian policymakers should consider this when developing natural resource development policies. Moreover,
Clootens and Kirat (
2017) discovered that the effect of natural resource rent on economic growth is dependent on the economic performance of different groups, demonstrating the resource curse in low-income countries.
GDP growth has been the focus of policymakers in every country, developed or developing. Long-run cointegration exists between the variables of Indian resource rent and GDP in the current study. However, when other countries are considered, different results can be observed for the United States, China, and Australia (
Ben-Salha et al. 2021). In addition, a study conducted in Nigeria discovered that the impact of natural resource rent on the country’s economic development was minimal. The study also suggested bringing strong political stability to make natural resource rent more impactful (
Fagbemi and Adeoye 2020).
Our findings have important policy implications, particularly the need for public policies and regulations focusing on resource sustainability and the prevention of over-exploitation in order to ensure the appropriate use of natural resources to boost economic growth. In order to combat environmental degradation and promote sustainability, India is implementing a new national statistical framework that measures the services provided by natural ecosystems beginning in 2021 (
UN 2021). This reflects a global shift away from treating natural resources as if they were free and limitless and toward measuring and valuing nature’s contribution to our economies.
As a result of our findings, it is possible to advocate for the use of natural resource rents to invest in clean energy for a more sustainable environment while maintaining a focused revenue goal.
6. Conclusions
The gross domestic product (GDP) is the most commonly used measure of economic performance, but it says nothing about the wealth and assets that support this income. Mineral resource extraction, for example, boosts GDP while depleting a country’s wealth. Utilizing natural resources wisely, reducing pollution, and considering other environmental factors are now critical to the prospects for long-term economic growth and, by extension, sustainable development.
Our findings allowed us to reject H1a, which states that total natural resource rents (NRR) do not Granger-cause GDP, implying that NRR does. However, we failed to reject H1b, which states that GDP does not Granger-cause total natural resource rents (NRR) in India. Furthermore, the H2 was rejected, indicating that the NRR has a significant impact on the GDP of India.
Total natural resource rents are an indicator that demonstrates the efficiency of extracting energy from natural resources at the lowest possible cost. If a country wishes to ensure macroeconomic development, all activities and policies articulated by the government must be profitable. The higher the rent value, the more profitable the use of natural resources. The advancement of technology used to extract utility from natural resources can only increase the value of this variable. The current study demonstrates that total natural resource rents have a significant impact on India’s GDP, highlighting the importance of policy formulation. In India, there is no exclusive policy regarding total natural resource rents. As a result, policymakers in the country must prioritize NRR in order to provide a significant boost to India’s GDP. Natural resources are classified into two types: nonrenewable and renewable. The government must encourage the use of renewable energy for sustainable development, but this concept can only be expanded if it is economically profitable. Furthermore, if renewable energy is primarily contributing to GDP, the government will be interested in developing renewable energy policies.
The study’s limitation is that there are numerous factors that influence a nation’s GDP, and the current study only considered the variable of natural resource rent as an independent variable, but there are other related variables that are not included in the current research. Further research can be directed toward understanding what role NRR play in green and digital transformation, as well as how natural resources can be used in a sustainable manner to achieve India’s sustainable development.


