
What Is the Effect of Oil and Gas Markets (Spot/Futures) on Herding in BRICS? Recent Evidence (2007–2022)

School of Business & Management, Royal Holloway, Egham TW20 0EX, UK
*
Author to whom correspondence should be addressed.
J. Risk Financial Manag. 2023, 16(11), 466; https://doi.org/10.3390/jrfm16110466
Submission received: 16 September 2023
/
Revised: 14 October 2023
/
Accepted: 19 October 2023
/
Published: 27 October 2023
(This article belongs to the Special Issue Financial Assets as Profit-Makers in Inflationary Periods)
Abstract
:We investigate the effect of gas/oil markets (spot/futures) on herding in stock markets in BRICS over 15 years (2007–2022). We consider the effect(s) of crises (Global financial, European debt, COVID-19, and Russia–Ukraine war), bull/bearish energy markets, volatility, and speculation. The effect of gas and oil markets on herding in stock markets is minimal, and investors herd selectively during crises. Even during the ongoing Russia–Ukraine war, the effect of energy markets on herding in BRICS is minimal. Causality tests show that oil (spot/futures) Granger causes CSAD during COVID-19 only. Gas (spot/futures) has no effect. We also find that energy (spot/futures) market states (bearish/bullish) have no effect on herding in stock markets. Low volatility in energy markets can trigger herding (consistent with previous research in US, China) in all BRICS. Speculative activities during (non)crises appear to have minimal impact on herding. However, as the degree of intensity (volatility) in speculative activities increases in oil/gas, it causes herding in all countries (India is affected mostly), except Brazil. It is not the speculation activity per se in (non)crises that causes herding, but the intensity/volatility in speculation activity. Overall, oil/gas markets (especially gas markets) appear to have a smaller impact on herding than expected, contrary to public belief; however, as the intensity/volatility in speculative activities increases, then herding also increases, which is expected given the uncertainty that speculation causes.
JEL Classifications:
G14; G15; G411. Introduction
Over the past century, behaviour finance, as a subfield of behaviour economics, has been concerned with psychological and bias effects on financial markets and the economic environment, especially on investment decisions. This subfield can be traced back over 150 years and has begun to attract more interest from researchers, practitioners, and policymakers since the recent experiencing of several crises (such as the 1997 Asian Crisis, the 2000 dotcom crash, and the 2008 global financial crisis). Within the massive ‘heuristics’ and ‘cognitive effects’ sector of this field, the topic of herding is one of the most active areas in behaviour research, which is defined as a form of regret aversion and a collective behaviour where participants adopt actions and make decisions depending solely on others’ choices rather than on their own judgements and analysis (Liao et al. 2011). Moreover, herding, as one of the representatives of emotional bias, can be utilised to explain certain anomalies (such as the occurrence of bubbles and low-beta anomaly) and somewhat indicates the failure of the efficient market hypothesis, because investors are bounded-rational subjects who use rules of thumb and acquire imperfect information instead of applying their reasoning when making decisions (Ivanov et al. 2009; Baddeley et al. 2012). As a result, herding may somewhat trigger excessive market volatility and convergence in investment directions.
Previous studies have primarily concentrated on the herding effect itself in single asset markets (such as equity or bond markets), but have ignored the effect of external factors on herding or the spillover effect between equity markets and other markets. Therefore, we will introduce a new perspective of herding research in this study. We will explore how energy markets can exert influence on investors’ behaviour in equity markets. This investigation will be carried out from a global perspective and will include five emerging markets, namely, Brazil, Russia, India, China, and South Africa (BRICS).
When it comes to the rationale behind the selection of the sample markets and this topic, there are several motivations. In the first place, a large and growing body of literature pays particular attention to the crucial role of the commodity market (especially the oil and gas market). As noted by Wang et al. (2022) and Rapier (2020), oil, as a core raw material of modern industries, remains on top, accounting for almost 33% of total energy consumption.
The second motivation for this study is the close link between the equity market(s) and the commodity market(s), from both theoretical and practical points of view (Meyer 2022; Degiannakis et al. 2018; Gatfaoui 2016; Bashir 2022; Acaravci et al. 2012). Oil can be seen as playing an important strategic and political role in the equity market and the economic cycle. To date, the literature concerning the effect of oil on the stock market has heightened. For example, Apergis and Miller’s (2009) work on the importance of oil is complemented by BenMabrouk and Litimi’s (2018) study, which emphasised that oil not only possesses an ability to predict the real economy—such as GDP, exchange rate, and CPI—but can also have great repercussions for stock prices and various sectors, including transportation, heating, and financial. On the other hand, studies have suggested that different markets present diverse behaviour when facing price fluctuations or speculative activities regarding crude oil, such as significant herding in the Gulf Arab stock market (Balcilar et al. 2014), but anti-herding in Turkey (Cakan et al. 2019a). In terms of the other side of the coin, it is fitting to discuss the connection between natural gas and the stock market. Indeed, there exist many published studies that have discussed the impact of natural gas price shocks and volatility on the equity market for developed and emerging markets (Acaravci et al. 2012; Dai and Zhu 2022; Wadhwa and Darad 2022; Cliffe 2022).
In terms of the reason for selecting the BRICS countries as the sample, it is the crucial role of BRICS in the global energy market. According to Nasir et al. (2018), BRICS countries consist of both oil-exporting countries (Russia and Brazil) and oil-importing countries (India, China, and South Africa). In 2021, Russia and Brazil were the second and tenth largest oil exporters in the world, respectively (Workman 2022a). Considering growth rates, Brazil can be regarded as one of the fastest growing crude oil exporters since 2020. Moreover, China and India can be ranked as the first and third largest economies importing crude oil in 2021, respectively (Workman 2022b). As for natural gas, all of the BRICS markets, apart from Russia, can be regarded as natural gas importers. Brazil, China, India, and South Africa’s imported gas accounts for a relatively large proportion of total natural gas consumption, specifically 50% for Brazil, 45% for China, 37% for India, and 78% for South Africa (de Oliveira 2022; Kemp 2022; Worldometer 2015a, 2015b). In addition to this, Russia is the leading country and one of the largest natural gas producers; for instance, approximately 45% of the natural gas in the European Union came from Russia (Pistilli 2022; Staff 2022). Therefore, in order to extend our current knowledge about the role of energy in BRICS countries, the issue regarding the relationship between the energy market (oil and gas) and herding will be examined.
Additionally, it is now well established, based on a variety of studies, that there exists a spillover effect between the energy market(s) and the equity markets in BRICS (Sadraoui et al. 2022; Boubaker and Larbi 2022). More specifically, Boubaker and Larbi (2022) echoed Sadraoui et al. (2022), suggesting that stock markets in BRICS are undeniably affected by risk spillovers from energy markets and such a relationship can enhance impulsiveness in stock markets, which can make investors further increase hedging. Moreover, evidence provided by Hashmi et al. (2022) served to illustrate a positive effect of oil price on the stock market, as well as an impact of volatility of the stock market on the volatility of crude oil in China. To further demonstrate the relationship between oil and the stock market, Ono (2011) utilised a VAR model and concluded that stock returns positively respond to changes in oil prices in three BRICS member markets, except for Brazil, between 1999 and 2009. With respect to the relationship between natural gas and the stock market, a weaker co-movement can be reported in BRICS countries compared to that seen in the crude oil market (Mensi et al. 2021). The relationship between energy market(s) and stock market(s) has been widely examined and investigated considering price, return, and volatility. However, there is limited evidence to explain and analyse the relationship between investors’ behaviour when it comes to trading (e.g., herding) and commodities, including oil and gas. Therefore, our study will choose the BRICS countries as sample markets, which can provide additional evidence in this field. The purpose of this work is to allow investors to better understand the commodity market’s effect on the BRICS stock markets and make it possible for those investors to select a more suitable time to invest in, or withdraw from, the BRICS equity markets.
The last motivation behind selecting the BRICS countries as the sample can be ascribed to the characteristics of their stock markets. According to statistical data from Büge et al. (2013), four members of the BRICS group have a high percentage of state (national)-owned companies (NOCs)—96% in China (ranked 1st), 81% in Russia (ranked 3rd), 59% in India (ranked 7th), and 50% in Brazil (ranked 8th). NOCs play key roles in global energy, especially for the oil and gas industry in developing markets. According to reports and predictions of the International Energy Agency (IEA), NOCs have become dominant forces in the global energy industry and are expected to account for approximately 80% of the total rise in global oil and gas production (IEA 2008). As significant players in energy projects, NOCs are estimated to provide a large proportion of oil reserves, ranging from 80% to 90%, and are more likely to become the main source of all new oil suppliers achieving a 90% share, which will dominate the markets. (The Economist 2011; Austin 2009). As energy prices rise and geopolitical crises increase, NOCs can gain more advantage over private companies due to more diplomatic and financial support acquired from home governments (Chen and Jaffe 2007). Additionally, in order to control and stabilise the domestic energy market, NOCs sometimes have to sacrifice some part of their profits due to price caps set by government(s) (Austin 2009). This measure can somewhat protect the domestic energy market from international pressures. However, NOCs are also subject to criticism for their low transparency and inefficiency, human capital, capital accumulation, and tax burden (Victor 2007). Despite some limitations and criticism, NOCs will still dominate the market, and this tendency will be intensified. Therefore, in a study that investigates the effect of energy markets on stock market herding, selecting BRICS is quite suitable due to the fact that their markets are mainly composed of NOCs. On the other hand, although the BRICS countries have made important progress in opening their markets, there remain some restrictions on investments and transactions for foreign investors, such as short selling bans in India (Segal et al. 2022), as well as A-shares for domestic investors and B-shares for foreign investors in China (Segal and Scott 2021). The energy sector can be regarded as the first industry in which Foreign Direct Investment (FDI) occurred and is welcomed on a large scale globally based on considerations of market(s) liberalisation and increased supply security (Fleischmann et al. 2022). China has relaxed some parts of investment restrictions and has allowed investment in oil and gas since 2022 (Fleischmann et al. 2022). Despite some changes and policy reformation, there are still a considerable number of restrictions that are not abolished. Due to their specific FDI characteristics, the effect of energy markets on investor behaviour in equity market(s) may be different compared to Western countries or the rest of the world. Moreover, a seminal piece of work from Konradsson and Porss (2019) suggested that the BRICS countries can share similar systematic risk factors, whilst the work further reported that the BRICS countries can present fewer long-run co-movements with each other, which can satisfy the needs of diversification and risk management for international investors. Bouoiyour and Selmi (2016) showed that BRICS equity markets tend to embody heterogenous responses to oil prices using the frequency domain approach and causality analysis. Short-run causality is reported in India and South Africa, but a long-term effect is reported in the Chinese stock market. In the meantime, Bouoiyour and Selmi (2016) view different industrial production measures, financial system efficiency, market share distribution, tax policy, and regulation effectiveness as the most important factors that cause different degrees of impact of oil on stock return in BRICS. In light of the individual characteristics of BRICS equity markets, energy market(s) are more likely to exert a diverse impact on every BRICS market. Therefore, the relationship between BRICS and energy markets is an important and meaningful topic to be examined. Additionally, Adu et al. (2015) demonstrated that there are distinctively different patterns of stock returns between mature markets and emerging markets, such as high volatility and autocorrelated observable returns, as well as long-term return predictability. In other words, the BRICS countries can be considered as candidates and alternatives when investors try to construct global portfolio(s). The reason for this may well be that portfolios consisting of BRICS countries can achieve the goal of minimising risks without sacrificing adjusted and expected portfolio returns.
The main focus of this study will be the relationship between energy markets (including oil and gas) and herding in BRICS countries, whilst it will also compare differences and/or similarities in investors’ behaviour within these five sample markets after considering energy markets as an influence medium. Since they are representatives of emerging markets, the selection of BRICS countries can serve the purpose of gaining a relatively comprehensive understanding of the behaviour patterns of emerging markets under the influence of world energy markets. Nevertheless, much of the published research concerning this issue focuses on the developed markets or Gulf Cooperation Council (GCC) countries, such as the cases of the United States (BenMabrouk and Litimi 2018; Brunetti et al. 2013; Youssef and Mokni 2020), GCC markets (Balcilar et al. 2014, 2017; Ulussever and Demirer 2017), and Saudi Arabia (Gabbori et al. 2020), or on just one or two markets of the BRICS group, such as the cases of Brazil and Russia (Cakan et al. 2019a) and Chinese Stock Exchanges (Loang 2023). Most importantly, currently, there seems to exist a variety of published literature shedding light on the influence of global energy on the local stock market, which can be divided into two categories: (1) the effect of fluctuation in various energy indicators (energy price, return, volatility, speculative activities in either spot or futures market) on the performance of the equity market (Ross et al. 2021; Bernanke 2016; Alamgir and Amin 2021; Antonakakis and Filis 2013; Gatfaoui 2016); (2) the relationship between the energy market and investment behaviour (herding or trading preferences) (Cliffe 2022; Cattlin 2021; BenMabrouk and Litimi 2018; Cakan et al. 2019a; Ghorbel et al. 2014). The following cases can be regarded as a good illustration and summary, which makes it possible to capture previous research achievement and clearly clarify differences between our study and previous literature. Important work on the US herding phenomenon was undertaken by BenMabrouk and Litimi (2018), who showed that herding is more intense in the Capital Goods and Consumer Services as a result of a falling oil market. During an investigation into herding in Saudi Arabia, Gabbori et al. (2020) observed that herding in Saudi Arabia tends to be independent of oil volatility, but not of OPEC meetings—the stock market in Saudi Arabia is reported to herd on and around the days of OPEC meetings. With regard to BRICS, Youssef and Mokni’s (2023) work was complemented by Loang’s (2023) study, which agreed that the crude oil market causes herding in China (only in the Shanghai Stock Exchange) due to its high degree of globalisation and development. Cakan et al. (2019b) confirmed that a high-volatility regime can be regarded as the only driver of investors’ herding in the real estate investment market in South Africa. When considering the degree of integration between energy markets and BRICS stock markets, previous research has concentrated on a single market or just two markets, rather than including all BRICS members in a single study. The purpose of this study is to research how commodities (oil and gas) affect investors’ behaviour and to examine whether or not investors in the BRICS countries respond differently to energy markets when those markets are in different states. Additionally, this study will raise a question pertaining to whether the spot market and the future market of energy markets have a similar impact on investor behaviour in the stock markets of the BRICS countries. In other words, this study will be the first one to compare the effects of the spot market and the futures market for all BRICS in a single study. This can, in turn, offer those interested in investing in these countries or who set the rules a good opportunity to consider the similarities and uniqueness of the BRICS countries.
Cakan et al. (2019a) identified speculative activity as the major cause of herding, and highlighted, by utilising firm-level data, more prevalent herding in Russia and Brazil when the two emerging countries were experiencing a high degree of speculative activity in the oil market. In comparison to Cakan et al. (2019a), our study will take other possible influential elements into account besides speculative activities, including volatility and different market states of the oil and gas market. Unlike Cakan et al. (2019a), Balcilar et al. (2017) argued that speculative activities can be considered as positive signals to drive investment decisions away from market consensus, which can trigger anti-herding behaviour in oil-rich Gulf Arab stock markets; indeed, they formulated this argument after employing firm-level data and the Markov switching time-varying parameter herding model. More specifically, Balcilar et al. (2017) claimed that “speculative activities in the oil market, rather than oil price movements, are positively correlated with anti-herding in the stock markets of major exporters” and further explained that “traders take the speculative signals from the oil market as a sign of positive expectation and try to generate superior profits by going against the crowd in their local market”. As regards the effect of volatility, there exist many published studies describing the role of volatility in the stock market itself, rather than focusing on the importance of the volatility of the commodity market (e.g., Balcilar et al. (2014, 2017), Huang et al. (2015), Blasco et al. (2012), and Messis and Zapranis (2014)). In other words, research studies have not addressed, in detail, the different or similar influences of the spot market and the futures market on the stock market for BRICS countries during the past decade. Finally, the current study will examine the effect of the Russia–Ukraine war on the commodity market and further clarify the nature of the relationship between the commodity market (oil market vs. natural gas market) and investors’ behaviour in the BRICS countries during this period. According to a survey by GEP (2022), the Russia–Ukraine war suddenly changed the mode of supply chains and economies by affecting the price of global oil and gas. The price of oil skyrocketed from USD 76 per barrel in January 2022 to over USD 110 per barrel on 4th March 2022 (GEP 2022). Unsurprisingly, Henry Hub natural gas spot prices surged from USD 4.38 per million btu in January 2022 to USD 5.66 per million btu in October 2022, peaking at USD 8.81 per million btu in August 2022 (EIA 2022). That is to say, the sudden fluctuation of the oil and gas market may exert influence on the stock market, which could have an effect on investors’ confidence and sentiment, whilst also subsequently leading to a change in investors’ behaviour.
To prompt the results (most important findings), herding, appears to be unconnected to crises, contrary to public belief. Only China and India appear to herd responding to the oil market at different points in time (crises). South Africa herds to gas futures. Secondly, energy markets (and, specifically, different states of those markets (up/down)) exert no influence on investors’ behaviour—no herding reported for the whole sample in the stock markets. Remarkably herding in the stock markets appears enhanced in a low volatile environment (for gas/oil, mainly when volatility is less than 25% of the total distribution) for all BRICS countries. Investors are indifferent to herding as a result of speculation during (non)crises. Finally, Brazil is immune to speculative activities in the energy markets. Conversely, the rest of the countries exhibit herding when the volatility of speculative activities increases. It is not the speculation activity per se in (non)crises that causes herding, but the intensity/volatility in speculation activity.
This work has been organised in the following way. The next section will present a brief overview of the previous studies. Subsequently, we will present the data and methodology, before then going on to discuss, in detail, results produced by quantitative analysis. The conclusion will provide a brief summary, critique of the findings, and implications.
2. Literature Review
2.1. Relationship between Stock Markets and Commodity Markets
Numerous studies and reports have attempted to explain the association between the stock market and the commodity market. According to Motilal Oswal (2018), commodity markets can exert great influence on equity prices through two different channels due to different characteristics of equities, and these are commodity companies/stocks themselves and input-sensitive companies/stocks. More specifically, “commodity companies” can be defined as “output-sensitive stocks” and refer to entities that directly produce and sell related commodity products or services, such as copper producers, oil extractors, and gold mining. These companies’ business performance tends to directly rely on the price of commodities (Motilal Oswal 2018; DailyBulls 2023), whereas the second set of companies—“input-sensitive stocks”—is used to refer to organisations that are heavily impacted by changes of commodities’ price via the channel of costs. In other words, these companies are usually not commodity-related entities, but utilise commodities as input (Motilal Oswal 2018). For example, oil is an essential input for the paint industry or automobile industry. They can be affected by changes in the price of energy. In other words, the profitability of these companies tends to reduce in periods of increased ‘input’ prices due to higher transportation and manufacturing costs, but they outperform other industries when the price of commodities is on a downswing (DailyBulls 2023). Pinho and Maldonado’s (2022) cross-market analysis revealed that there are spillover effects between commodity markets (including oil, gold, copper, and agriculture) and stock markets, whilst it also showed that the return connection is stronger in the short run than in the long term. Most importantly, commodities can be regarded as a recommended hedge investment tool against inflation that can be used by investors due to their low or even negative correlation with traditional assets (Banton et al. 2022).
In detail, oil and natural gas, as two of the hard commodities, can have a close link with the equity market. Theoretically, oil price is a significant component of the value of output products, which can change production cost(s) and increase the price of the final outputs. In a randomised controlled study of the relationship between oil prices and the stock market, Groww (2022) agreed with Jones and Kaul (1996), pointing out that an increase in oil price can increase costs (e.g., transportation, equipment maintenance, and production costs) due to more expensive fuel, which can thus result in higher prices of products and, in turn, can reduce consumption. This, in turn, tends to somewhat affect demand for, and supply of, products, thus causing declines in companies’ profits and changes in the shares of firms. Therefore, such changes can lower profit margins and have adverse impacts on the stock market (Groww 2022). Similarly, a report/survey of Monthly Bulletin (2004) analysed data of the Dow Jones EURO STOXX index and turned out that a hike in oil price triggers a decrease in the expected rate of economic growth and also drives up inflation expectation, which further lowers firms’ earnings expectations, leading to a dampening effect on stock prices. This can be explained by the psychology of investors’ uncertainty towards the future outlook of corporate profitability, which, in turn, possibly results in relatively higher risk premia, exerting additional downward pressure on stock prices (Monthly Bulletin 2004). From another point of view, a marked rise in oil prices tends to contribute to a higher inflation level (named as “cost-push inflation”) and imbalance between demand and supply, resulting in higher prices for numerous goods and services, as well as an increase in households’ budgets (Federal Reserve Bank of San Francisco (FRB) 2007). Conversely, Ross et al. (2021) forwarded the perspective that whether oil prices can affect stock markets and economic status depends on the different industries being focused on. Meanwhile, they claimed that there seems to be a weak linkage between oil prices and the stock market on account of increasingly sophisticated methods with which to forecast future movements of oil prices. Therefore, firms can implement a sufficient number of measures to compensate for added fuel costs and switch operating strategies. Nandha and Faff (2008) showed that oil price indeed exerts great influence on equity markets for all 35 sample industries, but the degree and direction of influence is different, such as a positive effect of high oil price on the mining, oil, and gas sector, but a negative effect/association between high oil price and the other 32 industries. Likewise, by investigating 38 industries, Scholtens and Yurtsever’s (2012) comparative study found that the majority of industries tend to benefit from negative oil price shocks (that is, descending oil price), except mining, oil, and gas. Commenting on the sectoral effect, Elyasiani et al. (2011) provided similar evidence and underscored that there tends to be a quite different effect of oil prices for oil-substitute industries and oil-using industries, such as a positive relationship between increasing oil price and oil-substitute sectors (i.e., coal, oil refineries, and electric-gas service), whereas a negative and indirect effect of positive oil price changes on oil-using sectors (i.e., metal, building, and air transportation).
Compared to the crude oil market, fewer researchers have been able to draw on any systematic research into the correlation between natural gas and the stock market. It is believed that hikes of natural gas can create pressure in the economy and increase the possibilities of inflation, especially for the electricity sector (Wadhwa and Darad 2022). In another major study, Acaravci et al. (2012) collected quarterly data for 15 European Union countries and underlined that the long-run relationship between natural gas and the stock market would vary with different sample countries; their results were obtained by means of the Granger causality models between 1990 and 2008. They discovered the existence of a long-term equilibrium relationship in Austria, Denmark, Finland, Germany, and Luxembourg, but found that this disappeared in the 10 remaining European Union sample countries. Overall, the relationship is not particularly straightforward.
2.2. Energy Market and Herding
Only in the past 20 years has research on herding directly addressed how the commodity market can influence investors’ behaviour, especially for energy market(s). In the context of equity markets in three oil-exporting countries (Saudi Arabia, Canada, and Russia) and three oil-importing countries (US, Japan, and China), Youssef and Mokni (2023) acknowledged that herding differed across all sample markets due to a negative correlation between oil-exporting countries and oil-importing countries. Simultaneously, the authors confirmed that a dynamic herding pattern existed by means of a time-varying parameter model, especially for China, and also supported that stronger herding occurred under the circumstance of increasing oil prices in Russia, Japan, and China. In the same vein, Balcilar et al. (2013) discovered that investors reacted by herding in oil-rich frontier markets (GCC countries), and oil price increases seemed to be associated with a movement out of ‘low’- into ‘high’-volatility states, during which herding behaviour was observed, pointing out that GCC markets tended to be well integrated with oil markets and can be easily impacted by global factors. Also, for the GCC countries, using the traditional CCK model and the Markov switching time-varying parameter model (MS-TVP), Balcilar et al. (2017) evaluated the effect of the crude oil market on investors’ behaviour in five Gulf Corporation Council (GCC) stock exchanges over the span of 10 years and identified that herding was only reported in volatile periods, disappearing during calm periods. This finding is in line with the result of a study by Balcilar et al. (2014), who highlighted that herding can also be recognised as a dynamic phenomenon and varies with changes in market states in GCC stock markets, and oil shocks can be regarded as a significant factor governing the transition to herding states.
In addition to research in oil-rich developing countries (GCCs), there is also research on renewable energy sources and herding. Trueck and Yu (2016) set out to solely investigate the renewable energy sector in the US between 2000 and 2015 and pointed out that the renewable sector seemed to switch back and forth between herding and anti-herding, given changes in oil price and investors’ beliefs. More specifically, the authors concluded that a dramatic drop in oil price can stimulate herding in the renewables sector, while “anti-herding” is more pronounced during long periods of increasing oil price, which can be explained by the belief that investors are more likely to interpret and react differently towards “good news” or “positive oil return” for renewable energy stocks. Compared to crude oil, there is limited evidence to evaluate the effect of natural gas on investors’ behaviour, especially in the field of herding.
2.3. Geopolitics, Energy Market, and Herding
2.3.1. The Effect of Geopolitics on Energy Market
To date, several studies have assessed the nature of the relationship between geopolitics and commodities. For instance, Noguera-Santaella (2016) looked into a considerable number of global geopolitical events over the span of nearly 150 years (from 1861 to 2011) and the highly sensitive oil market. Noguera-Santaella (2016) documented that geopolitical risks occurring before 2000 can exert greater influence on actual oil prices. Recently, nearly all commodities reached a peak in the weeks following the Russia–Ukraine conflict, especially natural gas and crude oil; the two commodities simultaneously experienced greater volatility compared to stock markets (Costola and Lorusso 2022; Alam et al. 2022; Boubaker et al. 2022). In an investigation regarding the price and exports of natural gas and oil after the Russia–Ukraine war, Nadig (2022) reported an increase of 54% in European costs since the second half of 2021, tripled growth in the natural gas price, and a peak of USD 105 per barrel in crude oil price for the first time since 2014. In their analysis, the energy market is one of the most affected markets due to the conflict between Russia and Ukraine. They also report a relatively high-risk contagion between the metal market and the energy market. This finding is consistent with the perspective of Sansarlioglu (2022), who supported the notion that the Russia–Ukraine war can be regarded as a driver to trigger increased volatility and rapid fluctuation in commodities prices due to an imbalance between supply and demand. Both Olayele (2015) and Siapartners (2022) highlighted that geopolitics may overshadow the market and exert great influence on economic activities via affecting policies, consumer needs, and transmission, with an example being records of a new high in oil and natural gas, especially in Europe. Additionally, a detailed examination of geopolitics effects by Bricout et al. (2022) showed that geopolitics can still contribute to triggering fluctuations of European international oil companies (IOCs), but the influence has gradually diminished due to increasing awareness of the lowering usage of oil. However, the above-mentioned authors (Bricout et al. 2022) also emphasised that the influence of geopolitics on gas can still be strong due to the fact that it is indispensable at the moment.
2.3.2. The Effect of Geopolitics on Herding
The existing literature on the relationship between geopolitics and herding has been extensive and focused particularly on the degree of the effect. Historically speaking, geopolitical risks can somewhat lead to rising volatilities in financial markets and fluctuations of economic activities due to increased uncertainty and decreased investors’ confidence; examples in this regard are the average 6.2% sell-off in the S&P 500 during various geopolitical events, as well as longer-lasting negative economic impacts and disruption of energy markets after the Arab oil embargo in 1973 (Abrahamian 2022). In a study conducted by Krishna and Suresha (2022), it was shown that herding intensified during the India–China geopolitical conflicts of 2020, with the Hurst exponent/coefficient (a representative indicator of herding behaviour) reaching 0.72 throughout the overall intensified geopolitical conflicts event window, and was prevalent in the three major National Stock Exchange sectoral indices (Auto, Energy, and Pharma) on account of high reliance on Chinese supplies and trade linkages with China.
Since the beginning of 2022, the eruption of the Russia–Ukraine crisis has rapidly become a popular topic and grabbed the whole world’s attention. In such a context, Bougatef and Nejah (2023) utilised the CSAD model to describe investors’ behaviour pattern before and during the war by selecting 40 firms listed in the Moscow stock exchange as a sample between 16 June 2021 and 30 November 2022. In their analysis of the relationship between herding and geopolitical risk, Bougatef and Nejah (2023) highlighted that the outbreak of the Russia–Ukraine tension prompted herding. This evidence seems to corroborate the psychological theory, which suggested that investors are inclined to put aside their beliefs and, in turn, herd towards the crowd when they sense a danger or face a great degree of market uncertainty (Christie and Huang 1995; Devenow and Welch 1996).
Unlike the above studies, Espinosa-Méndez (2022) reported reverse herding in Chile during civil unrest, which can be explained by the psychological factor that investors and agents start to distrust and become suspicious of the decisions made by the most informed and professional specialists when facing future uncertain market volatility. This can be explained by the ‘relative deprivation’ theory, which suggests that economic inequality and dissociation between expectations and actual experience makes people dismiss objective information and engage in subjective consideration, leading to the appearance of reverse herding (Power 2018).
This view is similar to Mertzanis and Allam’s (2018) evidence indicating the existence of anti-herding in emerging markets when investors face periods of political instability. To determine the presence of (anti-)herding in Egypt, Mertzanis and Allam (2018) employed both daily and monthly returns of the EGX30 index as a proxy from 2 January 2003 until 15 April 2014 as the sample period including the 2011 revolution. One unanticipated finding was the anti-herding phenomenon in the Egyptian stock market after the revolution, regardless of the normal/bullish/bearish market. This rather contradictory result may be due to the control of daily price fluctuation limits and the absence of short-selling, which can be regarded as the most important factors to discourage excessive herding and even preclude speculators or irrational investors re-entering the stock market (Mertzanis and Allam 2018). Another possible explanation for this result might be that investors are better aware of the true idiosyncratic risks of stocks and become more prudent regarding their future investment positions, leading to the appearance of more rational investors (Mertzanis and Allam 2018).
2.4. Speculative Activities, Energy Market, and Herding
The Effect of Speculation in Energy Market on Herding
Apart from a close connection between speculative activities and the energy market, there are a few studies that shed light on the impact of speculation in energy markets on herding. Balcilar et al. (2017) can be considered as one of the representative cases in this field. Balcilar et al. (2017), in their study, noted that speculative activities in the oil market can cause anti-herding to occur amongst major oil exporters, particularly in Saudi Arabia and Qatar. The observed anti-herding behaviour between the oil market and GCC stock markets can be explained in the following way. The speculative signal from the oil market can be interpretated as a sign of positive oil price movement, and, therefore, traders expect to generate superior profits by making independent investment decisions and trading away from the market consensus after their analysis of acquired information (Balcilar et al. 2017). However, another seminal article was published in 2019, which pointed out that a higher degree of speculative activities in the global oil market triggered more intensive herding in Russia and Brazil (Cakan et al. 2019a). There is one likely cause for the association between a high level of speculative activities and a great degree of herding, that is, investors are apt to view frequent speculative activities in the oil market as signals of increasing uncertainty towards the oil market itself, the local stock market, and future global economic expectations, which leads to a greater level of willingness to follow the crowd and mimic others’ trading behaviour instead of believing in their own judgement and confidently diagnosing acquired private information in order to gain a sense of security (Cakan et al. 2019a; Devenow and Welch 1996). Obviously, there is no consensus regarding the effect of speculative activities in the oil market on herding. Commenting on herding, Pompian (2017) summarised that herding, as a reactive phenomenon, indicates convergence of behaviour and participating in the crowd’s behaviour, which can trigger the occurrence of speculative bubbles in different markets (such as the stock market and real estate market) and result in irrational asset prices, which can stimulate numerous capital inflows into specific asset classes, creating a tsunami-like effect. A similar study by Brunetti et al. (2013) could not find strong evidence to support a connection between herding by speculative traders and the crude oil market for either swap dealers or hedge funds.
2.5. Volatility in Energy Markets, Stock Markets, and Herding
2.5.1. The Effect of Volatility in Energy Market(s) on the Stock Market(s)
It is now well established, based on a variety of studies, that there exists a spillover effect between the volatility of the oil and gas market and the volatility of the stock market. As indicated by Sadorsky (1999), there are asymmetric effects between oil price shocks and the equity market and economic activity, meaning that there is a one-way influence path from oil price shock(s) to stock returns and the economy, but there is limited impact reported on the opposite direction. More specifically, it is suggested that positive oil price shocks are very likely to depress real stock returns (Sadorsky 1999). Joo and Park (2021) and Jones and Kaul (1996) outlined that oil price shocks and uncertainty can have a negative effect on trading in global stock markets and stock returns. Their test confirmed that oil prices fluctuation has a detrimental impact on real stock returns and output in the US, Canada, and Japan during the post-war period. Additionally, Pindyck (2004) shows that crude oil volatility, to a certain degree, has predictive power when it comes to natural gas, but not the other way around. As noted by Hampton (2022) and Groves (2022), natural gas can be considered a financial instrument, and sharp swings in natural gas can bring about investment opportunities for traders, accompanied by high risks. On the other hand, a huge surge in natural gas leads to increased market volatility (Chandler 2022).
2.5.2. The Effect of Energy Market Volatility on Herding
In recent years, the issue pertaining to the association between herding and the volatility of commodities has attracted increasing interest from practitioners and policymakers. In a comprehensive study of herding, Gabbori et al. (2020) surprisingly found that herding was independent of oil market volatility in the Saudi Arabia Stock Market. Similarly, BenMabrouk and Litimi (2018) selected, as a sample, all domestic US firms listed on the equity market over the span of 17 years and divided all sample companies into 12 sectors. An interesting finding emerged, i.e., that there was a significant linkage between the oil market and herding within the Capital Goods and Consumer Services sector for the whole sample period, but the volatility of the oil market can reduce herding and even generate anti-herding for all other sectors.
2.6. Relationship between Energy Market, Stock Market, and Herding in BRICS
2.6.1. Relationship between the Energy Markets and the Stock Markets in BRICS
There exist many published studies describing the role of oil and gas and their connection with financial stock markets in BRICS countries. Brazil, as one of the largest oil exporters, has surprisingly experienced growth of 30% in the equity market, which is due to rises in oil prices since the beginning of 2022 (Mellow 2022). Surveys, such as that conducted by Ferreira et al. (2020), have shown that the Brazilian financial sector has greater exposure to oil returns, which can provide some considerations and implications for both investors and authorities. This finding is similar to the perspective put forth by de Salles (2019), who highlighted a close linkage between crude oil fluctuation and the Brazilian stock market. Taking the case of India, Mahunta (2011) focused on the long-term effect of the international crude oil price on the Indian stock market, and Granger causality results revealed the existence of a unidirectional causality just from the crude oil market to the stock market. This view is supported by Yadav et al. (2020), who underlined that crude oil is a driver that leads to price discovery in the Indian equity market using a VAR model—a finding that can benefit investors who seek to diversify portfolios and offers a new insight to regulators who formulate related economic policies to balance the relationship between energy market(s) and the financial world. With respect to South Africa, Sanusi and Kapingura (2022) drew on an extensive range of sources to assess the interaction between the equity market and oil price. They subscribe to the view that changes in equity market performance stem from erratic oscillation in oil prices (using a time-varying approach and Markov regime switching VAR model) due to its heavy reliance on oil imports. Taking the above as their main focus, Hashmi et al. (2022) used a VAR-DCC-GARCH model to test the interaction between crude oil and the Chinese stock market over the span of 19 years. In detail, they proved that there tended to be a positive spillover effect between the crude oil fluctuations and equities in both directions, whilst they noted that the effect was stronger for mining, chemical, nonferrous metals, and steel. Wen et al. (2019) show that there is a significant bilateral nonlinear causality between oil prices and the Chinese equity markets due to increased demand and high dependence on oil imports. Conversely, Cong et al. (2008) illustrated that there seemed to be no significant interaction between oil price shocks and most Chinese equity indices, excluding the manufacturing index and some oil companies. Mensi et al.’s (2021) cross-country analysis utilising the wavelet method showed that there is a relation between oil and the BRICS stock market, and that the observed co-movement could have reached its peak during the 2008 global financial crisis. In a comparative study, Bouoiyour and Selmi (2016) proposed that the impact of oil price on stock returns in BRICS tends not to be uniform, but heterogeneous. Oil prices have a medium- and long-term potential effect on Brazilian, Russian, and Chinese shares, but a short-run effect on India and South Africa due to their different characteristics, such as oil dependence, financial system efficiency, securities regulation effectiveness, and market share distribution. Specifically, South Africa and India showed short-run causality running from real oil prices to stock returns. On the other hand, long-run causality can be reported in the other countries, which can be attributed to their high concentration on oil sectors and high dependence on oil importing—more than 50% of shares in Brazil and 60% of shares in Russia belong to oil-related companies; likewise, dependence on oil imports and oil intensity of China accounts for 32.8% and 23%, respectively (Bouoiyour and Selmi 2016). To conclude, oil exerts influence on these countries in different ways.
Relative to oil, less attention seems to be paid to issues regarding the relationship between natural gas and the equity market. According to Mensi et al. (2021), natural gas has the highest systematic risks compared to the stock market and crude oil. With respect to the influence of natural gas on equity markets in BRICS, Sadraoui et al.’s (2022) comparative study found significant evidence of a dynamic spillover effect between natural gas and the stock market in the BRICS countries, thus signifying higher prediction of impulsiveness in the equity market after investors have acquired information relative to gas prices. Kumar et al. (2019) mentioned that there seems to be no long-run causality between energy futures and the Indian stock market, but they also emphasised that investing in natural gas futures can have better hedge effects when investors consider establishing comprehensive and diversified portfolios in the Indian stock market on account of their characteristic of sometimes exhibiting abrupt movement with the stock market. Using the variance decomposition approach, Costola and Lorusso (2022) did conclude that increased uncertainty in Russian geopolitical conflicts may prompt a significantly positive spillover connectedness of future energy commodities volatility, including oil and gas. Last, but not least, they did report that Russian energy industries can be regarded as net shock transmitters to energy commodities.
2.6.2. Relationship between Energy Markets and Herding in BRICS
With respect to the relationship between herding and oil, more attention has been drawn on this field in recent years. Cakan et al. (2019a) provided an in-depth analysis for emerging markets, showing more prevalent herding in the case of Russia. In their seminal article, they identified that speculative activities in the global oil market can be significantly associated with investors’ herding behaviour in Russia and Brazil. The reason for this can be attributed to the investors’ psychology, i.e., that a high level of speculative activities in the oil market can be deemed a sign of increased uncertainty in terms of the direction of global demand, thus causing a greater tendency to follow the market consensus, so as to avoid investment mistakes. In addition, Chang et al. (2020) extended the current understanding of oil’s impact on the stock market and demonstrated a stronger herding tendency during extreme low oil prices, especially for fossil fuel energy sectors. This surprising and interesting result can be explained by the fact that extreme low or negative returns can be regarded as bad news in the oil market, which can have direct effects on energy sectors. In other words, investors’ behaviour in the energy sector seems to be sensitive to dynamic changes in the oil market (Arjoon and Bhatnagar 2017; Balcilar et al. 2013). Simultaneously, it is worth noting that there tends to be strong cross-sector herding and risk spillover effects from the US fossil fuel energy market to any renewable energy markets in normal periods. This is prevalent in the US market, but disappeared in European and Asian markets during the SARS epidemic (Chang et al. 2020). In a case study of herding in Indian energy commodity futures, Dewan and Dharni (2022) observed the absence of herding amongst energy commodity futures, except for downward market states, but reported a higher degree of herding behaviour for energy commodities during more volatile periods.
Given the literature above, our research hypotheses are as follows:
Hypothesis 1 (H1):
Energy markets have an impact on herding in stocks markets (‘rejected’).
Hypothesis 2 (H2):
Energy markets have an impact on herding in stocks markets during crises (‘rejected’, no unanimity, investors herd selectively at different points in time/crises).
Hypothesis 3 (H3):
Returns performance in energy markets Granger cause CSAD (‘rejected’, limited evidence).
Hypothesis 4 (H4):
A bullish energy market has an impact on herding in stock exchanges (‘rejected’).
Hypothesis 5 (H5):
High volatility in energy markets has an impact on herding in stock exchanges (‘rejected’).
Hypothesis 6 (H6):
Speculation in energy markets during crises has an impact on herding in stock exchanges (‘rejected’).
Hypothesis 7 (H7):
An increase in intensity/volatility in speculative activities in energy markets during crises has an impact on herding in stock exchanges (‘not rejected’).
3. Methodology and Data
3.1. Data and Sample(s)
The stock indices covered include Brazilian IBOVESPA, Russian MOEX Index, Chinese CSI 300, Indian S&P BSE SENSEX, and South African FTSE/JSE Africa All Share Index1. All data were collected from Bloomberg.
In addition, the Henry Hub Natural Gas Index2 and Brent Oil Index3 were selected as proxies to capture gas and oil price movements. The data were collected from the US Energy Information Administration. Secondly, in order to achieve the research goal of detecting similarities/differences regarding the impact of the energy spot and futures markets on the stock markets in BRICS, two different futures contracts, namely, Generic 1st “CO” Futures and Generic 1st “NG” Futures, will be selected as the research basis4; data on these contracts were collected from Bloomberg.
The whole sample period will cover 15 years, from 17 May 2007 to 13 May 2022. Several important events will also be taken into account. Our sub-periods analysis includes the following events: (1) “Global Financial Crisis (15 September 2008–31 March 2009)” (Lin et al. 2013; Aït-Sahalia et al. 2012); (2) “European Debt Crisis (1 April 2010–31 January 2012” (Dos Santos and Lagoa 2017); (3) “COVID-19 Crisis (31 December 2019 to 13 May 2022” (World Health Organization (WHO) 2020); and (4) “Russia–Ukraine War (24 February 2022–13 May 2022) (Psaropoulos 2022)”. The aim of this division/sample splitting is to establish whether event effects exist and whether investors tend to behave in different ways when there are sudden changes in market conditions, especially the occurrence of crises.
3.2. The Basic Model
We employ daily closing prices of market indices and individual stocks in BRICS countries to calculate market returns and individual stocks’ returns, respectively, via the following formula: . All empirical or statistical herding models can be divided into two categories: (1) based on holding and transaction data; and (2) based on returns data. Our research will adopt the second method and focus on returns’ dispersion or convergence. Compared to the other methods, the approaches utilising returns data can be more suitable when it comes to detecting and tracing time-variation herding in the context of emerging markets, because these methods take securities into account. Therefore, the returns’ dispersion is measured using the cross-sectional absolute deviation, as follows (Chang et al. 2000):
where
- (1)
- —Cross Sectional Absolute Deviation at Time t;
- (2)
- —Market Return at Time t;
- (3)
- —Return of Individual Stock at Time t;
- (4)
- N—the Number of Sample Stocks.
The model will become the benchmark for all the following models. Model (2) can serve as a valid model with which to detect herding. The CSAD indicator is not a measure of herding, but rather the parameter calculated by regressing CSAD on squared market return captures herding behaviour. The presence of herd behaviour is confirmed if is significantly negative.
3.3. Models for Detecting Herding between Energy Markets and Stock Markets
After introducing the basic herding model, the effect of energy markets on investors’ behaviour will be tested. To establish whether there are herding effects between energy markets and the behaviour of stock markets in BRICS countries, the return of crude oil and natural gas will be added to the regression model (Equation (2)) as one of the variables. Most importantly, spot markets and futures markets will be taken into account in this part. The model will be modified as follows:
where
- (1)
- —Daily Return of Brent Oil Index;
- (2)
- —Daily Return of Oil Generic 1st “CO” Futures;
- (3)
- —Daily Return of Henry Hub Natural Gas Index;
- (4)
- Daily Return of Natural Gas Generic 1st “NG” Futures.
A significantly negative captures herding behaviour, which means that the crude oil market or natural gas market can cause herding.
According to Hoque et al. (2020), oil and gas can be considered significant risk factors in terms of exerting influence on stock returns for oil and gas sub-industries, and this effect varies across sub-industries. In the previous sections, it was noted that an increasing number of articles have examined the effects of crude oil on the equity market compared to natural gas and the equity market. To extend understanding in this area, Kouchaksaraei et al. (2016) examined the relationship between gas prices and the performance of the stock exchange. In their research, there tended to be a two-way causality relationship between natural gas prices and the equity market in Russia and Norway—a relationship that was established via use of the Granger causality test. Therefore, prior literature has provided pieces of evidence to support the notion that natural gas prices can be considered a risk factor in terms of causing movements in the equity market. However, so far, to the best of our knowledge, no studies have considered how fluctuations in gas prices influence investment decisions and investor psychology, causing changes of behaviour. In order to bridge the research gap in this field, the current study will become the first empirical study to focus on the relationship between the natural gas market and the behaviour of stock markets in BRICS countries.
Aside from the spot market, which will certainly be considered, the futures market will become one of the significant elements to be introduced into this study. Therefore, the current study will become the first piece of work to incorporate both the spot market and the futures market into one research study. The aim is to observe whether the spot market and the futures market tend to have similar directions in terms of exerting influence on investors’ behaviour in the stock market; the degree of the effect will also be tested.
3.4. Crisis Events and Herding
3.4.1. Regression Model
In addition to the effects of energy markets on the stock market during the complete sample period, several important events will be added as distinct periods in order to determine changes in markets. According to Joo et al. (2020), it can be shown that an economic recession, such as that brought on by the 2008 Global Financial Crisis, can trigger rises in crude oil price, but it can also be found—interestingly—that the identified tendency can eventually revert to its original state. The Russia–Ukraine conflict could bring about or exacerbate an existing energy crisis. It could drive up prices of natural gas and even slow economic growth on account of high inflation rate and fuel shortages (IEA 2022). Therefore, the current study will consider both the effect of economic crisis and the effect of geopolitics, whilst the effect of a public health crisis (COVID-19) will also be addressed. The reason for this is that COVID-19 can somewhat impact economic development and disrupt supply chains. After taking the effect of crises events into account, the herding model will be modified as follows:
Crisis events stand for periods of Global Financial Crisis, European Debt Crisis, COVID-19 Crisis, and the Russia–Ukraine war. If is significant and negative, then this indicates the presence of herding. Most importantly, a greater value of can signal a stronger herding tendency.
3.4.2. Granger Causality Test
In addition to the regression model(s), a method known as the Granger causality test will be applied to further test the connection/causality between CSAD and energy markets returns during the four crisis periods. The Granger causality test was first put forward by Granger (1969) with the aim of identifying causality between time series data. It does not imply that one variable causes the other. It means that one variable contains info about the other. This is similar to the approach used in Galariotis et al. (2016) between CSAD and liquidity, while, in this study, we use CSAD and energy market performance, as stated above.
3.5. Different States for Energy Markets and Herding in Stock Markets
Regression Model
Equation (3) can be regarded as the model to detect the effect of energy markets on investors’ behaviour in the equity market during the complete sample period. In addition to the traditional model, the current study will also consider whether the effects will remain constant or will change with the altering of market conditions; in this way, the present study will be more comprehensive. In other words, this study will examine whether increased periods or decreased periods will trigger more of a herding phenomenon compared to normal states of energy markets. The purpose is to distinguish how fluctuations of the oil/gas market can result in a change of investors’ behaviour. Therefore, on the basis of the model (Equations (2) and (3), page 370) proposed by Galariotis et al. (2016), the variable named ‘energy market returns’ will be added to the model in order to establish a connection/relation between behaviour in the stock market and the performance of the energy market(s). The new modified model is presented below:
‘Up periods’ represent returns of oil and gas markets (including both the spot and futures markets) that are positive—greater than zero, while ‘downward periods’ capture negative returns of energy markets. According to the above models, a significantly negative indicates the occurrence of herding behaviour.
3.6. Volatility in Energy Markets and Herding in Stock Markets
The impact of volatility on herding behaviour has been well documented in the literature, with examples including Huang et al. (2015) and Balcilar et al. (2013). However, these articles have focused solely on the volatility of the equity market itself, whilst limited work has attempted to address the issue pertaining to the relationship between the volatility of energy markets and behaviour in stock markets. The current study will provide a new approach, so as to shed light on the connection between the volatility of energy markets and investors’ behaviour in BRICS countries.
3.6.1. Spot Market Volatility
Risk, as a crucial element of financial analysis, has always received much attention, both for risk management and for regulatory purposes. To date, various methods have been developed and introduced to measure volatility, which are classified into three types: implied volatility, conditional volatility, and historical volatility. Schwert (1989) has shown that higher average volatility is more likely to occur in recession periods. Studies concerning volatility contribute to understanding the fluctuation of financial markets, which may extend the understanding of investors’ behaviour due to swings of psychology and emotion.
More specifically, the GARCH model will be utilised to examine volatility of the spot market; indeed, this model was put forward by Bollerslev (1986) and Taylor (1987) and allows the conditional variance to depend on previous lag(s) on the basis of Engle’s (1982) ARCH model. Compared to the ARCH model, the advantage of the GARCH model is that it has better prediction ability with fewer variables and simultaneously avoids overfitting due to its characteristic of negativity constraints (Akgiray 1989; Brooks 2014). To examine the possibility of a relationship between GARCH volatility of the spot price/returns in energy markets and investors’ behaviour in equity markets, the GARCH model5 is presented in the following equations (the herding model is presented separately in the sections that follow further down):
where
- (1)
- : Daily Return of Brent Oil Index or Henry Hub Natural Gas Index at Time t;
- (2)
- : Daily Return of Brent Oil Index or Henry Hub Natural Gas Index at Time t − 1;
- (3)
- : GARCH Volatility of Crude Oil or Natural Gas Spot Market at Time t.
To determine whether different levels of volatility (and methods of calculating it) can trigger similar effects (of various degrees), a second method will be introduced to calculate volatility, namely, the EWMA model. The EWMA model is an acronym of exponentially weighted moving average and plays a fundamental role in computing return volatility in the area of risk management; the model was established by J.P. Morgan/Reuters (1996), who have teamed up to enhance RiskMetrics (also known as exponential smoother). Compared to the GARCH model, its strength is computation simplicity and its ability to better capture autocorrelation of the squared return; it also has greater forecasting capacity with regard to real data on account of its characteristic of dependency on the decay parameter (Ding and Meade 2010; Araneda 2021). Therefore, the EWMA model is as follows:
where
- (1)
- : EWMA Volatility of Oil or Natural Gas Spot Market at Time t;
- (2)
- : First-ordered Lagged Volatility.
3.6.2. Futures Market Volatility
In addition to considering the spot market, the futures market will also be taken into account in the current study. The aim in this regard is to offer a chance to compare the difference between the two types of energy markets in terms of effects on investors’ behaviour in equity markets. There exists a considerable amount of literature illustrating that volatility can trigger more speculation activity (Algieri and Leccadito 2019; Brunetti et al. 2016). Moreover, some studies have found that volatility increased herding tendency (Mandaci and Cagli 2022; Bouzid 2022; Bekiros et al. 2017). However, the majority of these studies investigated the effect of volatility on return performance and investors’ behaviour within the same financial market, rather than across different markets (such as the effect of volatility in the stock market on herding behaviour in the stock market). Additionally, few studies have focused on the relationship between volatility in the futures market and herding in the equity market. Therefore, the present study will devote itself to researching this aspect. The range-based method (RS volatility model) proposed by (Rogers and Satchell 1991; Rogers et al. 1994) will be employed as the basis for calculating the volatility of the futures market using the following equation:
where
- (1)
- —RS Volatility of Oil or Natural Gas Futures at Time t;
- (2)
- Ot—Opening Oil or Natural Gas Futures Price at Time t;
- (3)
- Ct—Closing Oil or Natural Gas Futures Prices at Time t;
- (4)
- Ht—High Oil or Natural Gas Futures Prices at Time t;
- (5)
- Lt—Low Oil or Low Natural Gas Futures Prices at Time t.
To ascertain whether different volatility models yield the same results, another extra model, namely, the GK model, will be introduced in this study. Under the guidance of Parkinson’s (1980) model, Garman and Klass (1980) put forward a new method to calculate historical volatility via incorporating intraday variability information. The benefit is that this estimator takes advantage of commonly available price information, and the application of high-frequency data can make it a more precise model when it comes to testing volatility. In light of this, the GK model is presented below (the herding model follows in the next section):
where
- (1)
- GK Volatility of Oil or Gas Futures Market at Time t;
- (2)
- ;
- (3)
- .
3.6.3. The Effect of Energy Volatility on Herding in BRICS’ Stock Market
As mentioned in the previous paragraph, there is a consensus among practitioners and scholars that there is a close link (and cross effect) between market volatility and herding (e.g., Huang et al. 2015; Balcilar et al. 2013; Fei and Zhang 2023). Nevertheless, there is an ambiguous relationship between energy market volatility and equity herding in the current literature. In other words, there is lack of enough empirical research to expound on how fluctuation of the energy markets (including the spot and futures markets) can exert influence on herding in BRICS.
In this study, the purpose is to illustrate the connection between different levels of energy volatility and behaviour in BRICS. Therefore, three interactive dummies will be employed in this study, which will represent different degrees of volatility. The model is presented below:
where
- (1)
- —Captures Volatility in the Second Quartile (25% of Distribution < σ < 50% of Distribution) and gets the value of 1, otherwise 0;
- (2)
- —Captures Volatility in the Third Quartile (50% of Distribution < σ < 75% of Distribution) and gets the value of 1, otherwise 0;
- (3)
- —Captures Volatility in the Forth Quartile (σ > 75% of Distribution) and gets the value of 1, otherwise 0;
- (4)
- —Represents GARCH and EWMA Volatility of Oil and Gas Spot Market, as well as RS and GK Volatility of Oil and Gas Futures Market;
- (5)
- Note that captures the first quartile.
In terms of the above model, the basic model is divided into four sub-models based on different volatility distributions (such as high volatility or low volatility of energy prices). There are four states of the world (or four quartiles), so that we create three dummies to capture the second, third, and fourth quartile of volatility levels. If , and are significantly negative, this indicates that the corresponding level of volatility level will induce herding. Again, to clarify, the first quartile (<25% of the distribution) is captured by . No dummy is created for the first quartile, otherwise we would be introducing multicollinearity. This is similar to Equation (5), page 145, in Galariotis et al. (2016).
3.7. Speculative Activity in Futures Market and Herding in Stock Market
In this study, the issue pertaining to the effect of speculation in the energy market on herding in the equity market will be examined. The present work will select the speculation ratio introduced by Chan et al. (2015), who showed that the speculation ratio can be calculated as “trading volume to open interest” for Brent oil futures contracts. According to the definition, a lower ratio indicates lower speculation activity. All data are collected from Bloomberg. Unlike the above models in our study, this part will focus solely on the futures market. Therefore, the modified model, which includes the speculation ratio as its main characteristic, is presented in the following equations:
where
- (1)
- : Speculation Ratio of Oil or Natural Gas Futures Market at Time t;
- (2)
- : Speculation Ratio of Oil or Natural Gas Futures during crisis and non-crisis periods (division method is the same as previous model);
- (3)
- Equation (14) captures any relationship between CSAD and SR if present during the whole period;
- (4)
- Equation (15) captures any relationship between CSAD and SR if present during different crisis events;
- (5)
- Equation (16) employs a quartile model to capture any relationship between CSAD and SR if present based on different levels of speculation activities via the introduction of dummy variables;
- (5a)
- captures the effect of the Speculation Ratio on CSAD when it lies in the Lower 25% of the SR Distribution;
- (5b)
- = 1 when the Speculation Ratio lies between 25% and 50% of the SR Distribution, otherwise = 0;
- (5c)
- = 1 when the Speculation Ratio lies between 50% and 75% of the SR Distribution, otherwise = 0;
- (5d)
- = 1 when the Speculation Ratio lies in the Upper 25% of the SR Distribution (Greater than 75% of Distribution), otherwise = 0.
If the coefficient in Equation (14) is significantly negative, this implies that a higher speculation ratio results in a lower market deviation. That is to say, a negative coefficient signifies that higher speculation in the futures market leads to convergence, which can be regarded as a sign of herding. Moreover, a significantly negative in Equation (15) implies a herding tendency during different crisis events. Finally, in Equation (16), significantly negative α3, α5, and α6 points to the occurrence of herding behaviour under a different level of speculation activities.
4. Discussion and Findings
4.1. Herding in Stock Markets and the Effect of Energy Markets (Oil/Gas–Spot/Futures)
The Augmented Dickey–Fuller (ADF) is a unit root test designed to test for stationarity of time series data. It can be seen from Table 1A,B, that all values of the ADF test are significant, thus indicating that all variables are stationary. Table 2 presents summary statistics for herding indicators and market returns of BRICS countries. It is apparent, from this table, that CSAD somewhat tends to change with market return. For instance, India reports the highest average and median values of the two variables, whilst Russia reports relatively lower values of these indicators. Russia also exhibits the greatest fluctuation and range in both of the two variables. The results obtained from the preliminary test of herding in equity markets are shown in Table 3. Chang et al.’s (2000) model suggests that a significant negative coefficient of Rmt2 indicates a herding tendency for sample markets. Strong evidence of herding in China and Russia is found between 2007 and 2022. Moreover, China seems to report a higher degree of herding than does Russia due to the greater value of the coefficient number.
4.2. Crisis Event Effects
Figure 1 presents prices and returns in both the oil market and the natural gas market; the figure incorporates the spot market and the futures market. Specifically, shaded areas in the graphs capture the different crisis periods, namely, the Global Financial Crisis, the European Debt Crisis, the COVID-19 Crisis, and the Russia–Ukraine War. The COVID-19 Crisis and the Russia–Ukraine War are captured by a single shaded area. It can be seen that prices and returns have experienced great fluctuation over the span of 15 years from 2007 to 2022. Figure 1 confirms that a crisis event can be regarded as a driver that triggers a higher degree of changes in the two variables, as indicated in the shaded areas. This finding is consistent with the standpoint of Rogoff (2022), who pointed out that the occurrence of crises can somewhat lead to greater price volatility in the oil and natural gas market via changes in short-term demand and decreased investment in production. For instance, the oil price suffered a large drop from its normal price of USD 68/barrel at the end of 2019 to USD 14/barrel in April 2020, as a result of the outbreak of COVID-19. However, the price recovered quickly, and even rose to USD 133/barrel in March 2022 due to the occurrence of the Russia–Ukraine war (Rogoff 2022). Similarly, The Investopedia Team et al. (2022) stressed that the 2008 Global Financial Crisis did not lead to contraction in credit, but did decimate prices in the oil and natural gas sector.
A scatter diagram was used to determine the relation between CSAD in BRICS and returns of energy markets, including the spot market and the futures market, in the oil and natural gas market. As Figure 2 shows, there is a non-linear relationship between the two indicators, which is confirmed by the existence of a data cluster instead of a straight line. In other words, such a relationship shows that the CCK model put forward by Chang et al. (2000) is appropriate for our study.
Table 5 presents the results obtained from the preliminary analysis of the relationship between investors’ behaviour in BRICS and the global financial crisis, as well as different crisis events; the findings were produced using the CCK model. What stands out from Table 5 is that a crisis event can trigger a very limited herding phenomenon when energy markets (oil/gas–spot/futures) are considered. There are very few negative and significant values (in bold) in Table 5. It is worth noticing that even during the Russia–Ukraine war, only one country (South Africa) appears to herd as a result of gas futures. Obviously, crises do not have the same effect on herding as one would think. Herding as a result of changes in energy markets during crises is ‘very much country and period’ dependent. There is no such thing as universality for herding in BRICS resulting from energy markets. When the whole period is considered (as already shown in Table 4), energy markets have zero influence on investors’ behaviour. The reason for this may be that BRICS countries seem to face less pressure, in terms of an energy crisis, induced by the Russia–Ukraine war compared to other countries (such as Europe), even though energy prices, production, and demand have been experiencing great fluctuation during the period.
Now, from a country’s point of view, Table 5 shows that Brazil and Russia seem to be economic entities that are clearly independent of the oil and natural gas markets compared to the other sample countries during the majority of sub-periods; no herding phenomenon is reported for Russia during any periods (Russia is a major producer and exporter of oil and gas, so a smaller or no effect is expected on its equity market), while for Brazil (which is also a producer/exporter of oil), herding behaviour is reported in the equity market as a result of gas futures market changes only during the pre-European Debt Crisis. Conversely, India can be regarded as the most susceptible market, which herds as a result of changes in energy markets (during crisis or not). All results are significant at the 5% or 10% level.
Finally, Table 5 also allows us to compare the effect(s) that oil and natural gas markets have on herding. During periods of crisis, the oil market tends to exert greater influence on investors’ behaviour in BRICS. For instance, the oil spot market can trigger herding in China and India. Nevertheless, South Africa is the only country whose behaviour is affected by gas futures during the Global Financial Crisis and the Russia–Ukraine War period, rather than being influenced by the oil market. The main reason for this is its heavy reliance on importing natural gas due to limited domestic natural gas resources—the second largest gas importer in Africa, with 3.6 billion standard cubic meters in 2020 (Washington and Gupte 2021; Halsey et al. 2022; Statista 2023). Another possible reason for the above result could be policy changes in South Africa. By putting forward the Integrated Resource Plan, South Africa intends to strengthen the role of Liquefied Natural Gas and plans to create an additional 8100 MW gas and diesel-fired generation capacity by 2030, with the purpose of ensuring energy security and filling the energy shortfall caused by the delays in the establishment of the country’s mega coal-fired power stations (Ross 2020). Such policy changes may urge investors to pay more attention to the global natural gas futures market(s) and to adjust their portfolios and decisions.
In order to better understand the connection (Granger causality) between changes in energy markets and CSAD in BRICS, Granger causality tests have been employed. Upon examining the results in Table 6, we can see that there is no Granger causality between oil–gas spot–future markets and CSAD (in either direction) during the Global Financial Crisis. However, the COVID-19 Crisis is the time period when most causalities are reported. In detail, four out of the five sample countries present some sort of Granger causality, with the exception of Russia. Specifically, the oil spot/future markets Granger cause CSAD in Brazil, China, and South Africa. In the case of Brazil and South Africa, there is a two-way causality between oil futures and CSAD during COVID-19. With regard to the oil/gas energy markets, it is clear that oil markets exhibit the greater number of causalities, which is consistent with the results in Table 5. The gas spot/futures markets appear to have almost no effect. As regards individual countries, Russia is the least susceptible market, with no causality reported between energy markets and CSAD during all (non)crisis periods.
4.3. Energy Markets: Upward/Downward States and Their Effects on Herding
The purpose of Table 7 is to assess whether herding is associated with different states (high/low) of energy markets (oil/gas–spot/futures). In other words, Table 7 presents the regression results of the relationship between CSAD in BRICS and upward/downward periods of returns in energy markets. The findings, as shown in Table 7, indicate that CSAD in stock markets is unrelated to different states of energy markets. There is no herding, regardless of the state of the energy markets.
4.4. Energy Volatility Effect
The results regarding the relationship between herding behaviour in BRICS and energy volatility are summarised in Table 8. To better assess the effect, four different volatility measures are employed to measure the extent to which the energy market (including the spot market and futures market) fluctuated during the sample periods. Simultaneously, the quartile method is utilised to test whether or not different states of volatility can exert different degrees of influence on investors’ behaviour. What stands out in Table 8 is that all BRICS countries report strong evidence of herding in periods of low/medium-energy volatility, which can be seen from the first and second quartile in this table. That is to say, lower/medium volatility in energy markets can trigger herding in the equity markets of BRICS. Herding is absent for higher levels of volatility. BenMabrouk and Litimi (2018) report similar findings for US industries/sectors and oil volatility. They report that higher oil volatility can trigger anti-herding behaviour, and low volatility can stimulate herding. In their own words: ‘this finding can be attributed to the fact that in periods of higher oil market volatility, investors infer this information as a signal of economic turbulence, leading them to trade in or out of industries, which reduces the herding behaviour for each specific sector’ (page 203). Moreover, detailed examination of herding in the US by Jlassi and Naoui (2015) showed the existence of herding tendency during low-volatility days. In addition, Zheng and Ge (2021) surprisingly found that despite a relatively mild level of herding during low-volatility days compared to that of high-volatility days, herding tends to last for a longer period in a low-volatility regime for the Chinese stock market. They also reported that A-share markets herd towards the Hong Kong and US markets during the low-volatility regime. The second most interesting aspect of the table is that the results remain qualitatively similar to different approaches of calculating volatility. For instance, there is a close linkage between the lowest GARCH volatility model (first quartile) and the Brazilian herding tendency, and the same relationship is also observed in other volatility models, such as EWMA and RS volatility. Moreover, both the spot market and the futures market for both the oil and gas markets move in tandem and have the same effect on herding for the first and second quartile. In terms of individual countries, the equity market in South Africa appears to be most susceptible to herding. As shown in the first quartile panel of Table 8, South Africa always reports the highest regression coefficient, e.g., |−27.73| in South Africa > |−9.06| in China > |−8.50| in Brazil > |−4.78| in India, and > |−3.67| in Russia. A similar pattern also appears in other situations. Conversely, India exhibits relatively lower coefficients/(less) herding for similar levels of volatility.
4.5. Speculative Activities Effect
The simple regression model was used to test what the linkage is between investors’ behaviour in BRICS countries and speculative activities in the energy futures market. Results for the whole period are displayed in Table 9. Upon examination, we are able to see that herding occurs in India and South Africa. Such results signify that oil importing countries seem to be greatly influenced by speculative activities. This outcome can be explained, in part, by the psychology of fear about uncertainty and conformity to the crowd. A higher speculation ratio can be deemed as a sign of possible increased uncertainty in the future energy demand, and so investors feel more secure when they choose to go with the market consensus in investment directions or investment targets so as to ride the wave of uncertainty and escape from great psychological pressure (Cakan et al. 2019b). This association between herding and speculative activities contributes to understanding the rationale of herds explained in previous theoretical or empirical studies, such as crowd psychology based on a sense of security (Devenow and Welch 1996) and informational cascade theory (Banerjee 1992). Additionally, the herding effect in South Africa is manifested, compared to that of India, with a higher regression coefficient (|−0.0004| in South Africa > |−0.0001| in India), meaning that South Africa is affected more by speculation regarding energy futures when the two markets experience the same level of speculative activities. Furthermore, Table 9 also reveals that a herding tendency is reported with reference to oil futures, but disappears in the gas futures market, which means that investors are inclined to concentrate on changes of speculative activities in oil futures.
When considering the effect of crises, Table 10 shows that crises have almost no effect on herding channelled through speculative activities for the majority of sample countries, excluding China and India. It appears that herding is reported in China and India as a result of speculative activities during the European debt crisis only. It is worth noting that during the non-crises periods, herding channelled through speculative activities is reported in India (as before) and South Africa. Overall, there is no evidence to suggest that herding as a result of speculative activities is stronger during crises. Actually, it appears that herding as a result of speculation is independent of crises. Also, it is worth noticing the resounding absence of a gas futures effect.
In order to extend our understanding of the relationship between herding in equity markets in BRICS and the degree (intensity/volatility) of speculative activities in energy futures, the quartile model has been used to explore the connection (if any) which is exhibited in Table 11. Results demonstrate that investors from China, India, Russia and South Africa behave in convergent ways when they invest in local equity markets—known as herding—especially during periods of substantial speculative activity; indeed, this can be seen by a significantly negative coefficient in the “Third Quartile” and “Fourth quartile” panel of Table 11. This outcome echoes Cakan et al. (2019a), who found that herding tends to be more pronounced in Russia during periods of high speculative activity in the global oil market. However, one unanticipated finding is that herding is also reported in China when speculative activity in Gas Futures remain at lowest level, which can be seen when looking at the “First quartile” panel in Table 11. Moreover, Table 11 illustrates that gas futures enhance herding in high/very intense/volatile speculative states. All BRICS except Brazil and Russia show herding at high levels of speculation. From a magnitude perspective, higher speculation in gas futures tends to exert greater influence on herding in India as shown by a higher coefficient (such as Third Quartile: |−3.37| in India > |−2.41| in South Africa; Fourth Quartile |−3.81| in India > |−2.00| in China), which indicates that India is the most susceptible country.
5. Conclusions, Implications, Limitations, and Future Research
This study set out to explore the association between herding in BRICS countries’ stock markets and various aspects of global energy markets, which comprise the spot market and the futures market of both the oil and gas markets. The purpose is not only to bridge the research gap in this field, but also to detect whether global energy markets can be regarded as a determinant of herding in equity markets. Moreover, this study can test whether investors behave in similar ways when they face similar movements in global energy markets, including volatility, crisis events, market performance, and speculative activities.
In the first stance, the current study focuses on the effect of crisis events on herding. Four different crises were selected, namely, the Global Financial Crisis, the European Debt Crisis, the COVID-19 Crisis, and the Russia–Ukraine War. The research goal is to compare whether investors display different behaviour in periods of crisis. The effect of energy markets during (non)crises on herding seems to be limited, and different countries herd at different points in time, as shown in Table 5. It seems that there is not ‘one’ crisis period that makes all investors herd at the same time. At this point, it is worth noting that Russia is the only country that shows no herding for all periods considered. In addition, it is worth noting that Brazil and Russia, as representatives of oil-exporting countries, exhibit anti-herding behaviour during crisis periods, which proves that the behaviour of equity markets in oil-importing countries can be susceptible to the influence of global energy markets. Simultaneously, the study also confirms that oil has a greater effect on investors’ behaviour than does gas.
Next, we investigate how different states of global energy markets exert influence on investment behaviour in the stock markets of BRICS countries. This test was undertaken to evaluate whether herding is constant during different states of the global energy markets and to examine whether investors present different behaviour patterns in upward and downward periods. Regression analysis revealed that investors’ behaviour does not change with the states of global energy markets (including the spot and futures markets).
Thirdly, this study was designed to determine the extent to which volatility of global energy markets can exert influence on the behaviour of stock markets in BRICS countries. The most obvious finding to emerge from the current work is that all of the said countries demonstrate convergence of behaviour in the low/medium volatile environment of the spot and futures markets in global energy markets. Meanwhile, no significant differences in herding are observed between spot/futures and gas/oil markets and between various volatility calculation methods. That is to say, investors are inclined to ‘follow the bandwagon’ when they face low/medium volatility of the spot/futures markets in both the oil and natural gas market. Similar results were obtained for the US and China (see BenMabrouk and Litimi (2018), Jlassi and Naoui (2015), and Zheng and Ge (2021)).
Finally, this study has discussed the connection between speculative activity of global energy markets and the behaviour of stock markets. One of the most significant findings to emerge from this study is that all countries, except Brazil, behave in a herding manner when the intensity/volatility in speculation activity increases, especially for gas futures. It is important to note that it is not the speculation activity per se in (non)crises that causes herding, but the intensity/volatility in speculation activity.
A major implication of this study is that investors do not need to worry about herding (that could lead to mispricing) during crisis periods when they consider the effect of global energy markets. Although energy markets exert some influence on the behaviour of equity markets, the impact is limited, especially when they are investing in Brazil and Russia. As two oil-exporting countries, the latter nations are immune to the effect of crisis periods. Therefore, when considering crisis periods as investment opportunities, Brazil and Russia can serve as good “counterbalancing forces” (based on past experience) to be included in international portfolios in order to achieve the purpose of lowering risks and gaining excess returns.
Next, the analysis of volatility undertaken here has extended our understanding of the relationship between fluctuation of global energy markets and equity markets’ behaviour. The regression outcomes of the quartile model show that increased herding can be caused by low volatility of the energy spot and futures markets, including natural gas and oil. The convergence in investment behaviour for all BRICS countries indicates that investors should be particularly wary when they select BRICS countries as investment targets during periods of low volatility in the energy spot and futures markets. Having said that, at this point, we need to point out that, if their investment strategy is focused solely on BRICS countries during low volatility in energy markets on account of these countries’ rapid development and large portion of global energy markets, investors should not be surprised by, and need to prepare mentally in advance for, possible abnormal movement of their portfolio beyond expectations (due to the herding effect). Alternatively, they can consider selecting other countries as part of a balanced portfolio rather than BRICS countries, which are negatively correlated with BRICS countries during periods of low volatility in global energy markets. The higher the degree of negative correlation, the better the balance effect is.
This study, to the best of our knowledge and belief, is the only empirical investigation into the impact of speculative activities on investors’ behaviour in BRICS countries. Brazil is the only country in our sample where investors do not herd as a result of speculation during (non)crises or when the intensity/volatility in speculative activity increases. In other words, Brazil is a ‘safe bet’ and can play a significant role in portfolio diversification and promoting the establishment of a balanced portfolio within a certain level of acceptable risk.
As it happens with all studies, this study also has its limitations. We would love to extend our sample before 2007 and include more gas and oil indices; however, data availability was an issue, especially for futures. This study could be extended to include frontier countries in the rest of the world with a higher/lower dependency on oil/gas and test if the results obtained here are universal.
Author Contributions
Supervision and editing: E.G., everything else: H.Z. All authors have read and agreed to the published version of the manuscript.
Funding
This research received no funding.
Data Availability Statement
All data is public domain.
Conflicts of Interest
The authors declare no conflict of interest.
| 1 | (1) Brazilian IBOVESPA: includes about 92 stocks; (2) Russian MOEX Index: tracks the 50 largest and most liquid stocks in Russia; (3) Chinese CSI 300: includes the top 300 stocks traded on the Shanghai Stock Exchange or Shenzhen Stock Exchange; (4) Indian S&P BSE SENSEX: consists of the 30 most liquid firms listed on the Bombay Stock Exchange; (5) South African FTSE/JSE Africa All Share Index: a market capitalisation weighted index, as the benchmark index, measures the performance of stocks that make up the top 99% of the market capitalisation of all listed companies traded on the Johannesburg Stock Exchange. |
| 2 | Henry Hub, the best known natural gas trading point, plays an important role in defining clearing prices and measures the price in USD per 1 million Btu based on the actual supply and demand of natural gas (Chen and Silberstein 2022). It is currently recognised as the benchmark of natural gas (CFI Team 2023). |
| 3 | The Brent Oil Index is the leading global price benchmark for Atlantic basin crude oil and can be employed to set the price of three-quarters of the world’s internationally traded crude oil suppliers. |
| 4 | The most important reason for choosing those contracts is that the two futures contracts are active, and they all have relatively complete data. |
| 5 | The order of GARCH is based on the AIC and BIC, even though the two criteria do not always agree. We tried different models, but the GARCH (1,1) appears to provide the best fit. Also see Hansen and Lunde (2005). |
References
- Abrahamian, Ara. 2022. How Stock Markets Historically Respond to Geopolitical Risks. [Online]. Available online: https://www.divergentplanning.com/blog/how-stock-markets-historically-respond-to-geopolitical-risks (accessed on 22 January 2023).
- Acaravci, Ali, Serkan Yilmaz Kandir, and Ilhan Ozturk. 2012. Natural Gas Prices and Stock Prices: Evidence from EU-15 Countries. Economic Modelling 29: 1646–54. [Google Scholar] [CrossRef]
- Adu, George, Paul Alagidede, and Amin Karimu. 2015. Stock Return Distribution in the BRICS. Review of Development Finance 5: 98–109. [Google Scholar] [CrossRef]
- Aït-Sahalia, Yacine, Jochen Andritzky, Andreas Jobst, Sylwia Nowak, and Natalia Tamirisa. 2012. Market response to policy initiatives during the global financial crisis. Journal of International Economic 87: 162–77. [Google Scholar] [CrossRef]
- Akgiray, Vedat. 1989. Conditional Heteroskedasticity in Time Series of Stock Returns: Evidence and Forecasts. The Journal of Business 62: 55–80. [Google Scholar] [CrossRef]
- Alam, Md. Kausar, Mosab I. Tabash, Mabruk Billah, Sanjeev Kumar, and Suhaib Anagreh. 2022. The Impacts of the Russia–Ukraine Invasion on Global Markets and Commodities: A Dynamic Connectedness among G7 and BRIC Markets. Journal of Risk and Financial Management 15: 352. [Google Scholar] [CrossRef]
- Alamgir, Farzana, and Sakib Bin Amin. 2021. The Nexus between Oil Price and Stock Market: Evidence from South Asia. Energy Reports 7: 693–703. [Google Scholar] [CrossRef]
- Algieri, Bernardina, and Arturo Leccadito. 2019. Price Volatility and Speculative Activities in Futures Commodity Markets: A Combination of Combinations of P-values Test. Journal of Commodity Markets 13: 40–54. [Google Scholar] [CrossRef]
- Antonakakis, Nikolaos, and George Filis. 2013. Oil Prices and Stock Market Correlation: A Time-varying Approach. International Journal of Energy and Statistics 1: 17–29. [Google Scholar] [CrossRef]
- Apergis, Nicholas, and Stephen M. Miller. 2009. Do Structural Oil-Market Shocks Affect Stock Prices? Energy Economics 31: 569–75. [Google Scholar] [CrossRef]
- Araneda, Axel A. 2021. Asset Volatility Forecasting: The Optimal Decay Parameter in the EWMA Model. New York: Cornell University. [Google Scholar]
- Arjoon, Vrjoon, and Chandra Shekhar Bhatnagar. 2017. Dynamic Herding Analysis in a Frontier Market. Research in International Business and Finance 42: 496–508. [Google Scholar] [CrossRef]
- Austin, Angelica. 2009. State-owned vs. Multinational Oil: New for Market Intervention. New York: The East West Institute. [Google Scholar]
- Baddeley, Michelle, Christopher Burke, W. Schultz, and Philippe Tobler. 2012. Herding in Financial Behaviour: A Behavioural and Neuroeconomic Analysis of Individual Differences. Cambridge: Faculty of Economics, University of Cambridge. [Google Scholar]
- Balcilar, Mehmet, Riza Demirer, Shawkat Hammoudeh, and Ahmed Khalifa. 2013. Do Global Shocks Drive Investor Herds in Oil-Rich Frontier Markets? Cairo: Economic Research Forum. [Google Scholar]
- Balcilar, Mehmet, Riza Demirer, and Shawkat Hammoudeh. 2014. What Drives Herding in Oil-Rich, Developing Stock Markets? Relative Roles of Own Volatility and Global Factors. North American Journal of Economics and Finance 29: 418–40. [Google Scholar] [CrossRef]
- Balcilar, Mehmet, Riza Demirer, and Talat Ulussever. 2017. Does Speculation in the Oil Market Drive Investor Herding in Emerging Stock Markets? Energy Economics 65: 50–63. [Google Scholar] [CrossRef]
- Banerjee, Abhijit V. 1992. A Simple Model of Herd Behavior. The Quarterly Journal of Economics 107: 797–817. [Google Scholar] [CrossRef]
- Banton, Caroline, Cierra Murry, and Yarilet Perez. 2022. Commodities: The Portfolio Hedge. [Online]. Available online: https://www.investopedia.com/articles/trading/05/021605.asp (accessed on 22 January 2023).
- Bashir, Muhammad Farhan. 2022. Oil Price Shocks, Stock Market Returns, and Volatility Spillovers: A Bibliometric Analysis and its Implications. Environmental Science and Pollution Research 29: 22809–28. [Google Scholar] [CrossRef]
- Bekiros, Stelios, Mouna Jlassi, Brian Lucey, Kamel Naoui, and Gazi Salah Uddin. 2017. Herding Behavior, Market Sentiment and Volatility: Will The Bubble Resume? The North American Journal of Economics and Finance 42: 107–31. [Google Scholar] [CrossRef]
- BenMabrouk, Houda, and Houda Litimi. 2018. Cross Herding between American Industries and the Oil Market. North American Journal of Economics and Finance 45: 196–205. [Google Scholar] [CrossRef]
- Bernanke, Ben S. 2016. The Relationship between Stocks and Oil Prices. [Online]. Available online: https://www.brookings.edu/blog/ben-bernanke/2016/02/19/the-relationship-between-stocks-and-oil-prices/ (accessed on 1 April 2023).
- Blasco, Natividad, Pilar Corredor, and Sandra Ferreruela. 2012. Does Herding Affect Volatility? Implications for the Spanish Stock Market. Quantitative Finance 12: 311–27. [Google Scholar] [CrossRef]
- Bollerslev, Tim. 1986. Generalized Autoregressive Conditional Heteroskedasticity. Journal of Econometrics 31: 307–27. [Google Scholar] [CrossRef]
- Boubaker, Heni, and Ons Ben Larbi. 2022. Dynamic Dependence and Hedging Strategies in BRICS Stock Markets with Oil during Crisis. Economic Analysis and Policy 76: 263–79. [Google Scholar] [CrossRef]
- Boubaker, Sabri, John W. Goodell, Dharen Kumar Pandey, and Vineeta Kumari. 2022. Heterogeneous Impacts of Wars on Global Equity Markets: Evidence from the Invasion of Ukraine. Finance Research Letters 48: 1–9. [Google Scholar] [CrossRef]
- Bougatef, Khemaies, and Imen Nejah. 2023. Does Russia-Ukraine War Generate Herding Behavior in Moscow Exchange? Review of Behavioral Finance. ahead-of-print. [Google Scholar] [CrossRef]
- Bouoiyour, Jamal, and Refk Selmi. 2016. How Differently Does Oil Prices Influence BRICS Stock Markets? Journal of Economic Integration 31: 547–68. [Google Scholar] [CrossRef]
- Bouzid, Khalil Nait. 2022. The Impact Of Idiosyncratic Volatility on the Investors’ Herd Behavior in the Chinese Stock Market. International Journal of Strategic Management and Economic Studies (IJSMES) 1: 483–513. [Google Scholar]
- Bricout, Aymeric, Raphael Slade, Iain Staffell, and Krista Halttunen. 2022. From the Geopolitics of Oil and Gas to the Geopolitics of the Energy Transition: Is There a Role for European Supermajors? Energy Research & Social Science 88: 1–8. [Google Scholar]
- Brooks, Chris. 2014. Introductory Econometrics for Finance, 3rd ed. Cambridge: Cambridge University Press. [Google Scholar]
- Brunetti, Celso, Bahattin Büyükşahin, and Jeffrey H. Harris. 2013. Herding and Speculation in the Crude Oil Market. The Energy Journal 34: 83–104. [Google Scholar] [CrossRef]
- Brunetti, Celso, Bahattin Büyükşahin, and Jeffrey H. Harris. 2016. Speculators, Prices, and Market Volatility. The Journal of Financial and Quantitative Analysis 51: 1545–74. [Google Scholar] [CrossRef]
- Büge, Max, Matias Egeland, Przemyslaw Kowalski, and Monika Sztajerowska. 2013. State-Owned Enterprises in the Global Economy. [Online]. Available online: https://www.weforum.org/agenda/2013/05/state-owned-enterprises-in-the-global-economy/ (accessed on 22 January 2023).
- Cakan, Esin, Rıza Demirer, Rangan Gupta, and Hardik A. Marfatia. 2019a. Oil Speculation and Herding Behavior in Emerging Stock Markets. Journal of Economics and Finance 43: 44–56. [Google Scholar] [CrossRef]
- Cakan, Esin, Rıza Demirer, Rangan Gupta, and Josine Uwilingiye. 2019b. Economic Policy Uncertainty and Herding Behavior: Evidence from the South African Housing Market. Advances in Decision Sciences 23: 88–113. [Google Scholar]
- Cattlin, Rebecca. 2021. What Is Natural Gas? [Online]. Available online: https://www.cityindex.com/en-uk/news-and-analysis/what-is-natural-gas-and-how-do-you-trade-it/ (accessed on 1 April 2023).
- CFI Team. 2023. Henry Hub. [Online]. Available online: https://corporatefinanceinstitute.com/resources/valuation/henry-hub/ (accessed on 1 May 2023).
- Chan, Leo H., Chi M. Nguyen, and Kam C. Chan. 2015. A New Approach to Measure Speculation in the Oil Futures Market and some Policy Implications. Energy Policy 86: 133–41. [Google Scholar] [CrossRef]
- Chandler, Marc. 2022. Soaring Natural Gas Increases Market Volatility. [Online]. Available online: https://www.investing.com/analysis/natural-gas-soars-increasing-market-volatility-200629481 (accessed on 22 January 2023).
- Chang, Chia-Lin, Michael McAleer, and Yu-Ann Wang. 2020. Herding Behaviour in Energy Stock Markets during the Global Financial Crisis, SARS, and ongoing COVID-19. Renewable and Sustainable Energy Reviews 134: 1–15. [Google Scholar] [CrossRef]
- Chang, Eric C., Joseph W. Cheng, and Ajay Khorana. 2000. An Examination of Herd Behavior in Equity Markets: An International Perspective. Journal of Banking & Finance 24: 1651–79. [Google Scholar]
- Chen, James, and Samantha Silberstein. 2022. What Is Henry Hub? Definition, Location, Owner, and Connections. [Online]. Available online: https://www.investopedia.com/terms/h/henry_hub.asp (accessed on 1 May 2023).
- Chen, Matthew E., and Amy Myers Jaffe. 2007. Energy Security: Meeting the Growing Challenge of National Oil Companies. The Whitehead Journal of Diplomacy and International Relations 8: 10–21. [Google Scholar]
- Christie, William, and Roger D. Huang. 1995. Following the Pied Piper: Do Individual Returns Herd around the Market? Financial Analysts Journal 51: 31–37. [Google Scholar] [CrossRef]
- Cliffe, Callum. 2022. How to Trade or Invest in Natural Gas. [Online]. Available online: https://www.ig.com/uk/trading-strategies/how-to-trade-natural-gas-190320 (accessed on 23 January 2023).
- Cong, Rong-Gang G., Yi-Ming Wei, Jian-Lin Jiao, and Ying Fan. 2008. Relationships between Oil Price Shocks and Stock Market: An Empirical Analysis from China. Energy Policy 36: 3544–53. [Google Scholar] [CrossRef]
- Costola, Michele, and Marco Lorusso. 2022. Spillovers among Energy Commodities and the Russian Stock Market. Journal of Commodity Markets 28: 1–22. [Google Scholar] [CrossRef]
- Dai, Zhifeng, and Haoyang Zhu. 2022. Time-varying Spillover Effects and Investment Strategies between WTI Crude Oil, Natural Gas and Chinese Stock Markets related to Belt and Road Initiative. Energy Economics 108: 1–12. [Google Scholar] [CrossRef]
- DailyBulls. 2023. Are Commodities and Stocks Closely Correlated? A Comparative Analysis. [Online]. Available online: https://dailybulls.in/how-commodity-prices-affect-stocks-correlation-with-examples/#:~:text=Output%2DSensitive%20Stocks%3A%20Output%2D,%2C%20energy%2C%20and%20agricultural%20products (accessed on 3 April 2023).
- de Oliveira, Carlos Alexandre. 2022. Brazil News Brief and Action Alert—Natural Gas Consumption in Brazil Grew by 28.82% in 2021. [Online]. Available online: https://www.climatescorecard.org/2022/06/natural-gas-consumption-in-brazil-grew-by-28-82-in-2021/#:~:text=Brazil%20imports%20approximately%2050%25%20of,gas%20from%20the%20neighboring%20country (accessed on 22 January 2023).
- de Salles, Andre Assis. 2019. On the Relationship between Crude Oil Prices and Stock Market: The Brazilian Case. International Research Journal of Finance and Economics 176: 156–66. [Google Scholar]
- Degiannakis, Stavros, George Filis, and Vipin Arora. 2018. Oil Prices and Stock Markets. The Energy Journal 39: 85–130. [Google Scholar] [CrossRef]
- Devenow, Andrea, and Ivo Welch. 1996. Rational Herding in Financial Economics. European Economic Review 40: 603–15. [Google Scholar] [CrossRef]
- Dewan, Pewan, and Khushdeep Dharni. 2022. Herding and Spillover Effects in the Indian Commodity Futures Market. Journal of Agribusiness in Developing and Emerging Economies. Available online: https://www.emerald.com/insight/content/doi/10.1108/JADEE-11-2021-0288/full/html (accessed on 22 January 2023). [CrossRef]
- Ding, Jie, and Nigel Meade. 2010. Forecasting Accuracy of Stochastic Volatility, GARCH and EWMA Models under Different Volatility Scenarios. Applied Financial Economics 20: 771–83. [Google Scholar] [CrossRef]
- Dos Santos, Luís G.G., and Sérgio Lagoa. 2017. Herding Behaviour in a Peripheral European Stock Market: The Impact of the Subprime and the European Sovereign Debt Crisis. International Journal of Banking, Accounting and Finance 8: 174–203. [Google Scholar] [CrossRef]
- EIA. 2022. Henry Hub Natural Gas Spot Price. [Online]. Available online: https://www.eia.gov/dnav/ng/hist/rngwhhdm.htm (accessed on 22 January 2023).
- Elyasiani, Elyas, Lqbal Mansur, and Babatunde Odusami. 2011. Oil Price Shocks and Industry Stick Returns. Energy Economics 33: 966–74. [Google Scholar] [CrossRef]
- Engle, Robert F. 1982. Autoregressive Conditional Heteroscedasticity with Estimates of the Variance of United Kingdom Inflation. Econometrica: Journal of the Econometric Society 50: 987–1007. [Google Scholar] [CrossRef]
- Espinosa-Méndez, Christian. 2022. Civil Unrest And Firm Performance: Evidence From Chile. Economics and Business Letters 11: 118–24. [Google Scholar] [CrossRef]
- Federal Reserve Bank of San Francisco (FRB). 2007. What Are the Possible Causes and Consequences of Higher Oil Prices on the Overall Economy? [Online]. Available online: https://www.frbsf.org/education/publications/doctor-econ/2007/november/oil-prices-impact-economy/ (accessed on 4 April 2023).
- Fei, Fan, and Jianing Zhang. 2023. Chinese Stock Market Volatility and Herding Behavior Asymmetry during the COVID-19. Cogent Economics & Finance 11: 1–19. [Google Scholar]
- Ferreira, Paulo, Éder Pereira, and Marcus Silva. 2020. The Relationship between Oil Prices and the Brazilian Stock Market. Physica A: Statistical Mechanics and its Applications 545: 1–12. [Google Scholar] [CrossRef]
- Fleischmann, Oliver, Anne Valley, and Cormac O’Daly. 2022. FDI in the Energy Sector. [Online]. Available online: https://globalcompetitionreview.com/guide/foreign-direct-investment-regulation-guide/second-edition/article/fdi-in-the-energy-sector (accessed on 31 March 2023).
- Gabbori, Dina, Basel Awartani, Aktham Maghyereh, and Nader Virk. 2020. OPEC Meetings, Oil Market Volatility and Herding Behaviour in the Saudi Arabia Stock Market. International Journal of Finance & Economics 26: 870–88. [Google Scholar]
- Galariotis, Emilios, Styliani-Iris Krokida, and Spyros I. Spyrou. 2016. Bond Market Investor Herding: Evidence from the European Financial Crisis. International Review of Financial Analysis 48: 367–75. [Google Scholar] [CrossRef]
- Garman, Mark B., and Michael J. Klass. 1980. On the Estimation of Security Price Volatilities from Historical Data. The Journal of Business 53: 67–78. [Google Scholar] [CrossRef]
- Gatfaoui, Hayette. 2016. Linking the Gas and Oil Market with the Stock Market: Investigating the U.S. Relationship. Energy Economics 53: 5–16. [Google Scholar] [CrossRef]
- GEP. 2022. Russia-Ukraine War’s Effects on the Oil and Gas Industry. [Online]. Available online: https://www.gep.com/blog/mind/russia-ukraine-wars-effects-oil-and-gas-industry (accessed on 22 January 2023).
- Ghorbel, Achraf, Mouna Boujelbene, and Younes Boujelbene. 2014. Shocks and Herding Contagion in the Oil and Stock Markets. The IUP Journal of Applied Finance 19: 41–60. [Google Scholar]
- Granger, Clive W. J. 1969. Investigating Causal Relations by Econometric Models and Cross-spectral Methods. Econometrica 37: 424–38. [Google Scholar] [CrossRef]
- Groves, Jo. 2022. How to Invest in Natural Gas. [Online]. Available online: https://www.standard.co.uk/esmoney/investing/how-to-invest-in-natural-gas-b1024012.html (accessed on 22 January 2023).
- Groww. 2022. How Oil Prices Affect Your Portfolio? [Online]. Available online: https://groww.in/blog/how-oil-prices-affect-your-portfolio (accessed on 4 April 2023).
- Halsey, Richard, Richard Bridle, and Anna Geddes. 2022. Gas Pressure: Exploring the Case for Gas-Fired Power in South Africa. Winnipeg: International Institute for Sustainable Development. [Google Scholar]
- Hampton, Liz. 2022. Price Volatility and Rising Demand Revive U.S. Natural Gas Trading. [Online]. Available online: https://www.reuters.com/business/energy/price-volatility-rising-demand-revive-us-natural-gas-trading-2022-04-08/ (accessed on 22 January 2023).
- Hansen, Peter R., and Asger Lunde. 2005. A forecast comparison of volatility models: Does anything beat a GARCH(1,1)? Journal of Applied Econometrics 20: 873–89. [Google Scholar] [CrossRef]
- Hashmi, Shabir M., Farhan Ahmed, Zainab Alhayki, and Aamir Aijaz Syed. 2022. The Impact of Crude Oil Prices on Chinese Stock Markets and Selected Sectors: Evidence from the VAR-DCC-GARCH Model. Environmental Science and Pollution Research 29: 52560–73. [Google Scholar] [CrossRef]
- Hoque, Mohammad E., Soo-Wah Low, and Mohd Azlan Shah Zaidi. 2020. The Effects of Oil and Gas Risk Factors on Malaysian Oil and Gas Stock Returns: Do They Vary? Energies 13: 3901. [Google Scholar] [CrossRef]
- Huang, Teng-Ching, Bing-Huei Lin, and Tung-Hsiao Yang. 2015. Herd Behavior and Idiosyncratic Volatility. Journal of Business Research 68: 763–70. [Google Scholar] [CrossRef]
- International Energy Agency (IEA). 2008. World Energy Outlook 2008. Paris: IEA. [Google Scholar]
- International Energy Agency (IEA). 2022. Global Energy Crisis. [Online]. Available online: https://www.iea.org/topics/global-energy-crisis (accessed on 22 January 2023).
- Ivanov, Asen, Dan Levin, and James Peck. 2009. Hindsight, Foresight, and Insight: An Experimental Study of a Small-Market Investment Game with Common and Private Values. The American Economic Review 99: 1484–507. [Google Scholar] [CrossRef]
- Jlassi, Mouna, and Kamel Naoui. 2015. Herding Behaviour and Market Dynamic Volatility: Evidence from the US Stock Markets. American Journal of Finance and Accounting 4: 70–91. [Google Scholar] [CrossRef]
- Jones, Charles M., and Gautam Kaul. 1996. Oil and the Stock Markets. The Journal of Finance 51: 463–91. [Google Scholar] [CrossRef]
- Joo, Kyohun, Jong Hwan Suh, Daeyong Lee, and Kwangwon Ahn. 2020. Impact of the Global Financial Crisis on the Crude Oil Market. Energy Strategy Review 30: 1–6. [Google Scholar] [CrossRef]
- Joo, Young C., and Sung Y. Park. 2021. The Impact of Oil Price Volatility on Stock Markets: Evidences from Oil-Importing Countries. Energy Economics 101: 1–13. [Google Scholar] [CrossRef]
- J.P. Morgan/Reuters. 1996. RiskMetricsTM-Technical Document, 4th ed. New York: Martin Spencer. [Google Scholar]
- Kemp, John. 2022. Column: China’s Reliance on Gas Imports Threatens Security. [Online]. Available online: https://www.reuters.com/business/energy/chinas-reliance-gas-imports-threatens-security-kemp-2022-10-07/#:~:text=China’s%20net%20import%20requirement%20climbed,2016%20and%2021%25%20in%202011 (accessed on 22 January 2023).
- Konradsson, Richard, and Theodor Porss. 2019. Stock Market Integration between the BRICS Countries—Long-term Investment Opportunities. Linköping: Linköping University. [Google Scholar]
- Kouchaksaraei, Meysam Azizi, Hamed Movahedizadeh, and Hoda Mohammadalikhani. 2016. Determinant of the Relationship between Natural Gas Prices and Leading Natural Gas Countries’ Stock Exchange. International Journal of Economics and Finance 8: 246–53. [Google Scholar] [CrossRef]
- Krishna, T. A., and B. Suresha. 2022. Intensified Geopolitical Conflicts and Herding Behavior: An Evidence from Selected Nifty Sectoral Indices during India-China Tensions in 2020. Investment Management and Financial Innovations 19: 300–12. [Google Scholar]
- Kumar, Satish, Ashis Kumar Pradhanb, Aviral Kumar Tiwari, and Sang Hoon Kang. 2019. Correlations and Volatility Spillovers between Oil, Natural Gas, and Stock Prices in India. Resources Policy 62: 282–91. [Google Scholar] [CrossRef]
- Liao, Tsai-Ling, Chih-Jen Huang, and Chieh-Yuan Wu. 2011. Do Fund Managers Herd to Counter Investor Sentiment? Journal of Business Research 64: 207–12. [Google Scholar] [CrossRef]
- Lin, William T., Shih-Chuan Tsai, and Pei-Yau Lung. 2013. Investors’ Herd Behavior: Rational or Irrational? Asia-Pacific Journal of Financial Studies 43: 755–76. [Google Scholar] [CrossRef]
- Loang, Ooi Kok. 2023. Cross Market Herding in Chinese, US and Crude Oil Markets: Quantile Regression Analysis; Kuala Lumpur, Malaysia. Available online: https://www.researchgate.net/profile/Ooi-Kok-Loang/publication/369506572_CROSS_MARKET_HERDING_IN_CHINESE_US_AND_CRUDE_OIL_MARKETS_QUANTILE_REGRESSION_ANALYSIS/links/641eb774a1b72772e4275603/CROSS-MARKET-HERDING-IN-CHINESE-US-AND-CRUDE-OIL-MARKETS-QUANTILE-REGRESSION-ANALYSIS.pdf (accessed on 22 January 2023).
- Mahunta, Rajendra. 2011. Relationship between International Crude Oil Price and Indian Stock Market (NSE). Interscience Management Review 4: 63–73. [Google Scholar] [CrossRef]
- Mandaci, Pinar Evrim, and Efe Caglar Cagli. 2022. Herding Intensity and Volatility In Cryptocurrency Markets. Finance Research Letters 46: 1–7. [Google Scholar]
- Mellow, Craig. 2022. Brazil’s Stock Market Is Up 30% This Year. Where to Find Bargains. [Online]. Available online: https://www.barrons.com/articles/brazil-stock-market-bargains-51650609904 (accessed on 22 January 2023).
- Mensi, Walid, Mobeen U. Rehman, Debasish Maitra, Khamis Hamed Al-Yahyaee, and Xuan Vinh Vo. 2021. Oil, Natural Gas and BRICS Stock Markets: Evidence of Systemic Risks and Co-Movements in the Time-Frequency Domain. Resources Policy 72: 1–24. [Google Scholar] [CrossRef]
- Mertzanis, Charilaos, and Noha Allam. 2018. Political Instability and Herding Behaviour: Evidence from Egypt’s Stock Market. Journal of Emerging Market Finance 17: 29–59. [Google Scholar] [CrossRef]
- Messis, Petros, and Achilleas Zapranis. 2014. Herding Behaviour and Volatility in the Athens Stock Exchange. The Journal of Risk Finance 15: 572–90. [Google Scholar] [CrossRef]
- Meyer, Robinson. 2022. Three Theories for Why Gas Prices Are So High. [Online]. Available online: https://www.theatlantic.com/science/archive/2022/02/why-gas-got-so-expensive/622887/ (accessed on 29 March 2022).
- Monthly Bulletin. 2004. How Do Stock Market React to Changes in Oil Prices? Frankfurt: Governing Council of the European Central Bank. [Google Scholar]
- Motilal Oswal. 2018. Can the Commodity Markets Provide Cues for Equity Trading? [Online]. Available online: https://www.motilaloswal.com/blog-details/can-the-commodity-markets-provide-cues-for-equity-trading-/1446 (accessed on 22 January 2023).
- Nadig, Smruthi. 2022. Before and After: How the Ukraine Crisis Has Affected Russian Oil. [Online]. Available online: https://www.offshore-technology.com/features/before-and-after-how-the-ukraine-crisis-has-affected-russian-oil/#:~:text=Since%20the%20second%20half%20of,the%20first%20time%20since%202014 (accessed on 9 April 2023).
- Nandha, Mohan, and Robert Faff. 2008. Does Oil Move Equity Prices? A Global View. Energy Review 30: 986–97. [Google Scholar] [CrossRef]
- Nasir, Muhammad Ali, Lutchmee Naidoo, Muhammad Shahbaz, and Nii Amoo. 2018. Implications of Oil Prices Shocks for the Major Emerging Economies: A Comparative Analysis of BRICS. Energy Economics 76: 76–88. [Google Scholar] [CrossRef]
- Noguera-Santaella, José. 2016. Geopolitics and the Oil Price. Economic Modelling 52: 301–9. [Google Scholar] [CrossRef]
- Olayele, Fred B. 2015. The Geopolitics of Oil and Gas. New York: International Association for Energy Economics. [Google Scholar]
- Ono, Shigeki. 2011. Oil Price Shocks and Stock Markets in BRICs. The European Journal of Comparative Economics 8: 29–45. [Google Scholar]
- Parkinson, Michael. 1980. The Extreme Value Method for Estimating the Variance of the Rate of Return. The Journal of Business 53: 61–65. [Google Scholar] [CrossRef]
- Pindyck, Robert S. 2004. Volatility in Natural Gas and Oil Markets. The Journal of Energy and Development 30: 1–19. [Google Scholar]
- Pinho, Carlos, and Isabel Maldonado. 2022. Commodity and Equity Markets: Volatility and Return Spillovers. Commodities 1: 18–33. [Google Scholar] [CrossRef]
- Pistilli, Melissa. 2022. 10 Top Natural Gas Producers by Country. [Online]. Available online: https://investingnews.com/top-natural-gas-producers/ (accessed on 22 January 2023).
- Pompian, Michael. 2017. How Herding Leads to Market Bubbles. [Online]. Available online: https://www.morningstar.com/articles/832975/how-herding-leads-to-market-bubbles (accessed on 22 January 2023).
- Power, Séamus A. 2018. The Deprivation-protest Paradox: How the Perception of Unfair Economic Inequality Leads to Civic Unrest. Current Anthropology 59: 765–89. [Google Scholar] [CrossRef]
- Psaropoulos, John. 2022. Timeline: Six months of Russia’s War in Ukraine. [Online]. Available online: https://www.aljazeera.com/news/2022/8/24/timeline-six-months-of-russias-war-in-ukraine (accessed on 22 January 2023).
- Rapier, Robert. 2020. Fossil Fuels Still Supply 84 Percent of World Energy—And Other Eye Openers from BP’s Annual Review. [Online]. Available online: https://www.forbes.com/sites/rrapier/2020/06/20/bp-review-new-highs-in-global-energy-consumption-and-carbon-emissions-in-2019/?sh=510922c366a1 (accessed on 22 January 2023).
- Rogers, L. Christopher G., and Stephen E. Satchell. 1991. Estimating Variance from High, Low and Closing Prices. The Annals of Applied Probability 1: 504–12. [Google Scholar] [CrossRef]
- Rogers, Leonard C.G., Stephen E. Satchell, and Youngjun Yoon. 1994. Estimating the Volatility of Stock Prices: A Comparison of Methods that Use High and Low Prices. Applied Financial Economics 4: 241–47. [Google Scholar] [CrossRef]
- Rogoff, Kenneth. 2022. Global Oil and Gas Prices Have Been Highly Volatile—What Will Happen Next? [Online]. Available online: https://www.theguardian.com/business/2022/jul/05/global-oil-gas-prices-supply-demand-us-europe#:~:text=The%20price%20of%20Brent%20crude,barrel%20after%20Russia%20invaded%20Ukraine (accessed on 22 January 2023).
- Ross, James. 2020. Hitting the Gas in South Africa—The Expanding Role of LNG and a New Round of Gas Exploration Appear Set to Alleviate the Country’s Energy Supply Problem. [Online]. Available online: https://www.nortonrosefulbright.com/en/knowledge/publications/d887b62e/hitting-the-gas-in-south-africa (accessed on 22 January 2023).
- Ross, Sean, Charles Potters, and Hans Daniel Jasperson. 2021. How Oil Prices Affect the Stock Market. [Online]. Available online: https://www.investopedia.com/ask/answers/030415/how-does-price-oil-affect-stock-market.asp (accessed on 1 April 2023).
- Sadorsky, Perry. 1999. Oil Price Shocks and Stock Market Activity. Energy Economics 21: 449–69. [Google Scholar] [CrossRef]
- Sadraoui, Tarek, Rym Regaïeg, Wajdi Moussa, Nidhal Mgadmi, and Chokri Arfa. 2022. Dynamic Spillover between the Crude Oil, Natural Gas and BRICS Stock Markets. Journal of Energy Markets 15: 1–36. [Google Scholar] [CrossRef]
- Sansarlioglu, Burhan. 2022. Geopolitical Risks Continue to Affect Commodity Market. [Online]. Available online: https://www.aa.com.tr/en/economy/geopolitical-risks-continue-to-affect-commodity-market/2548157 (accessed on 22 January 2023).
- Sanusi, Kazeem Abimbola, and Forget Mingiri Kapingura. 2022. On the Relationship between Oil Price, Exchange Rate and Stock Market Performance in South Africa: Further Evidence from Time-Varying and Regime Switching Approaches. Cogent Economics & Finance 10: 1–18. [Google Scholar]
- Scholtens, Bert, and Cenk Yurtsever. 2012. Oil Price Shocks and European Industries. Energy Economics 34: 1187–95. [Google Scholar] [CrossRef]
- Schwert, G. William. 1989. Why Does Stock Market Volatiility Change Over Time? The Journal of Finance 44: 1115–56. [Google Scholar] [CrossRef]
- Segal, Troy, and Gordon Scott. 2021. China A-Shares: Definition, History, vs. B-Shares. [Online]. Available online: https://www.investopedia.com/terms/a/a-shares.asp (accessed on 22 January 2023).
- Segal, Troy, Chip Stapleton, and Katrina Munichiello. 2022. Is Short Selling Allowed in India? [Online]. Available online: https://www.investopedia.com/ask/answers/09/short-selling-india.asp (accessed on 22 January 2023).
- Siapartners. 2022. Geopolitical Developments and Record High Oil & Gas Prices—Can Europe Reduce its Energy Dependence on Russia? [Online]. Available online: https://www.sia-partners.com/en/news-and-publications/from-our-experts/geopolitical-developments-and-record-high-oil-gas-prices (accessed on 22 January 2023).
- Staff, Al Jazeera. 2022. Infographic: How Much of Your Country’s Gas Comes from Russia? [Online]. Available online: https://www.aljazeera.com/news/2022/3/17/infographic-how-much-of-your-countrys-gas-comes-from-russia-interactive (accessed on 22 January 2023).
- Statista. 2023. Import Volume of Natural Gas into Africa in 2020, by Country. [Online]. Available online: https://www.statista.com/statistics/1197980/import-volume-of-natural-gas-in-african-countries/ (accessed on 5 June 2023).
- Taylor, Stephen J. 1987. Forecasting the Volatility of Currency Exchange Rates. International Journal of Forecasting 3: 159–70. [Google Scholar] [CrossRef]
- The Economist. 2011. The Oil Business—Bif Oil’s Bigger Brothers. [Online]. Available online: https://www.economist.com/business/2011/10/29/big-oils-bigger-brothers (accessed on 31 March 2023).
- The Investopedia Team, Khadija Khartit, and Timothy Li. 2022. The 2008 Financial Crisis and Its Effects on Gas and Oil. [Online]. Available online: https://www.investopedia.com/ask/answers/052715/how-did-financial-crisis-affect-oil-and-gas-sector.asp (accessed on 22 January 2023).
- Trueck, Stefan, and Yimeng Yu. 2016. Investor Herding and Dispersing in the Renewable Energy Sector. Sydney: Sydney Centre for Financial Risk Faculty of Business and Economics, Macquarie University. [Google Scholar]
- Ulussever, Talat, and Rıza Demirer. 2017. Investor Herds and Oil Prices Evidence in the Gulf Cooperation Council (GCC) Equity Markets. Central Bank Review 17: 77–89. [Google Scholar] [CrossRef]
- Victor, Nadeja M. 2007. On Measuring the Performance of National Oil Companies (NOCs). Stanford: Stanford University. [Google Scholar]
- Wadhwa, Puneet, and Lovisha Darad. 2022. Will the Spike in Natural Gas Prices Affect Related Stocks? [Online]. Available online: https://www.business-standard.com/podcast/markets/will-the-spike-in-natural-gas-prices-affect-related-stocks-122100400097_1.html (accessed on 22 January 2023).
- Wang, Kai-Hua, Chi-Wei Su, Yidong Xiao, and Lu Liu. 2022. Is the Oil Price a Barometer of China’s Automobile Market? From a Wavelet-based Quantile-on-Quantile Regression Perspective. Energy 240: 1–10. [Google Scholar] [CrossRef]
- Washington, Tom, and Eklavya Gupte. 2021. Interview: South Africa to Grow More Reliant on Fuel Imports as Refinery Closures Loom: SAPIA. [Online]. Available online: https://www.spglobal.com/commodityinsights/en/market-insights/latest-news/oil/012821-interview-south-africa-to-grow-more-reliant-on-fuel-imports-as-refinery-closures-loom-sapia# (accessed on 1 June 2023).
- Wen, Fenghua, Jihong Xiao, Xiaohua Xia, Bin Chen, Zhengyan Xiao, and Jinyi Li. 2019. Oil Prices and Chinese Stock Market: Nonlinear Causality and Volatility Persistence. Emerging Markets Finance and Trade 55: 1247–63. [Google Scholar] [CrossRef]
- Workman, Daniel. 2022a. Crude Oil Exports by Country. [Online]. Available online: https://www.worldstopexports.com/worlds-top-oil-exports-country/ (accessed on 22 January 2023).
- Workman, Daniel. 2022b. Crude Oil Imports by Country. [Online]. Available online: https://www.worldstopexports.com/crude-oil-imports-by-country/ (accessed on 22 January 2023).
- World Health Organization (WHO). 2020. Novel Coronavirus—China. [Online]. Available online: https://www.who.int/emergencies/disease-outbreak-news/item/2020-DON233 (accessed on 22 January 2023).
- Worldometer. 2015a. India Natural Gas. [Online]. Available online: https://www.worldometers.info/gas/india-natural-gas/#:~:text=India%20imports%2037%25%20of%20its,(649%2C796%20MMcf%20in%202015) (accessed on 22 January 2023).
- Worldometer. 2015b. South Africa Natural Gas. [Online]. Available online: https://www.worldometers.info/gas/south-africa-natural-gas/#:~:text=South%20Africa%20imports%2078%25%20of,(134%2C197%20MMcf%20in%202015) (accessed on 22 January 2023).
- Yadav, Nikhil, Priyanka Tandon, Ravindra Tripathi, and Rajesh K. Shastri. 2020. A Dynamic Relationship between Crude Oil Price and Indian Equity Market: An Empirical Study with Special reference to Indian Benchmark Index Sensex. Benchmarking: An International Journal 28: 582–99. [Google Scholar] [CrossRef]
- Youssef, Mouna, and Khaled Mokni. 2020. Asymmetric Effect of Oil Prices on Herding in Commodity Markets. Managerial Finance 47: 535–54. [Google Scholar] [CrossRef]
- Youssef, Mouna, and Khaled Mokni. 2023. Herding Behavior in Stock Markets of Oil-importing and Oil-exporting Countries: The Role of Oil Prices. Journal of Asset Management 24: 44–58. [Google Scholar] [CrossRef]
- Zheng, Tingguo, and Houyi Ge. 2021. A Study of The Tine-Varying Characteristics Of Herding Effects In China’s Stock Market Based On A Regime-Switching Model. Journal of Financial Research 489: 170–87. [Google Scholar]
Figure 1.
Price and Returns of Oil Market and Natural Gas Market. (Note: The above Figures illustrate prices and returns for oil market and natural gas market over time, including spot market and futures market. The shaded areas capture the four different crisis sub-periods. The first shaded area captures results during the Global Financial Crisis from 15 September 2008 to 31 March 2009. The second shaded area captures the European Sovereign Debt Crisis between 1 April 2010 and 31 January 2012. The third shaded area captures the COVID-19 Crisis from 31 December 2019 to 13 May 2022. The last shaded area captures the Russia–Ukraine conflicts period between 24 February 2022 and 13 May 2022. Furthermore, the X-axis captures “Time”. The Y-axis for all graphs captures ”Price” (Left graph) or “Return” (Right graph).
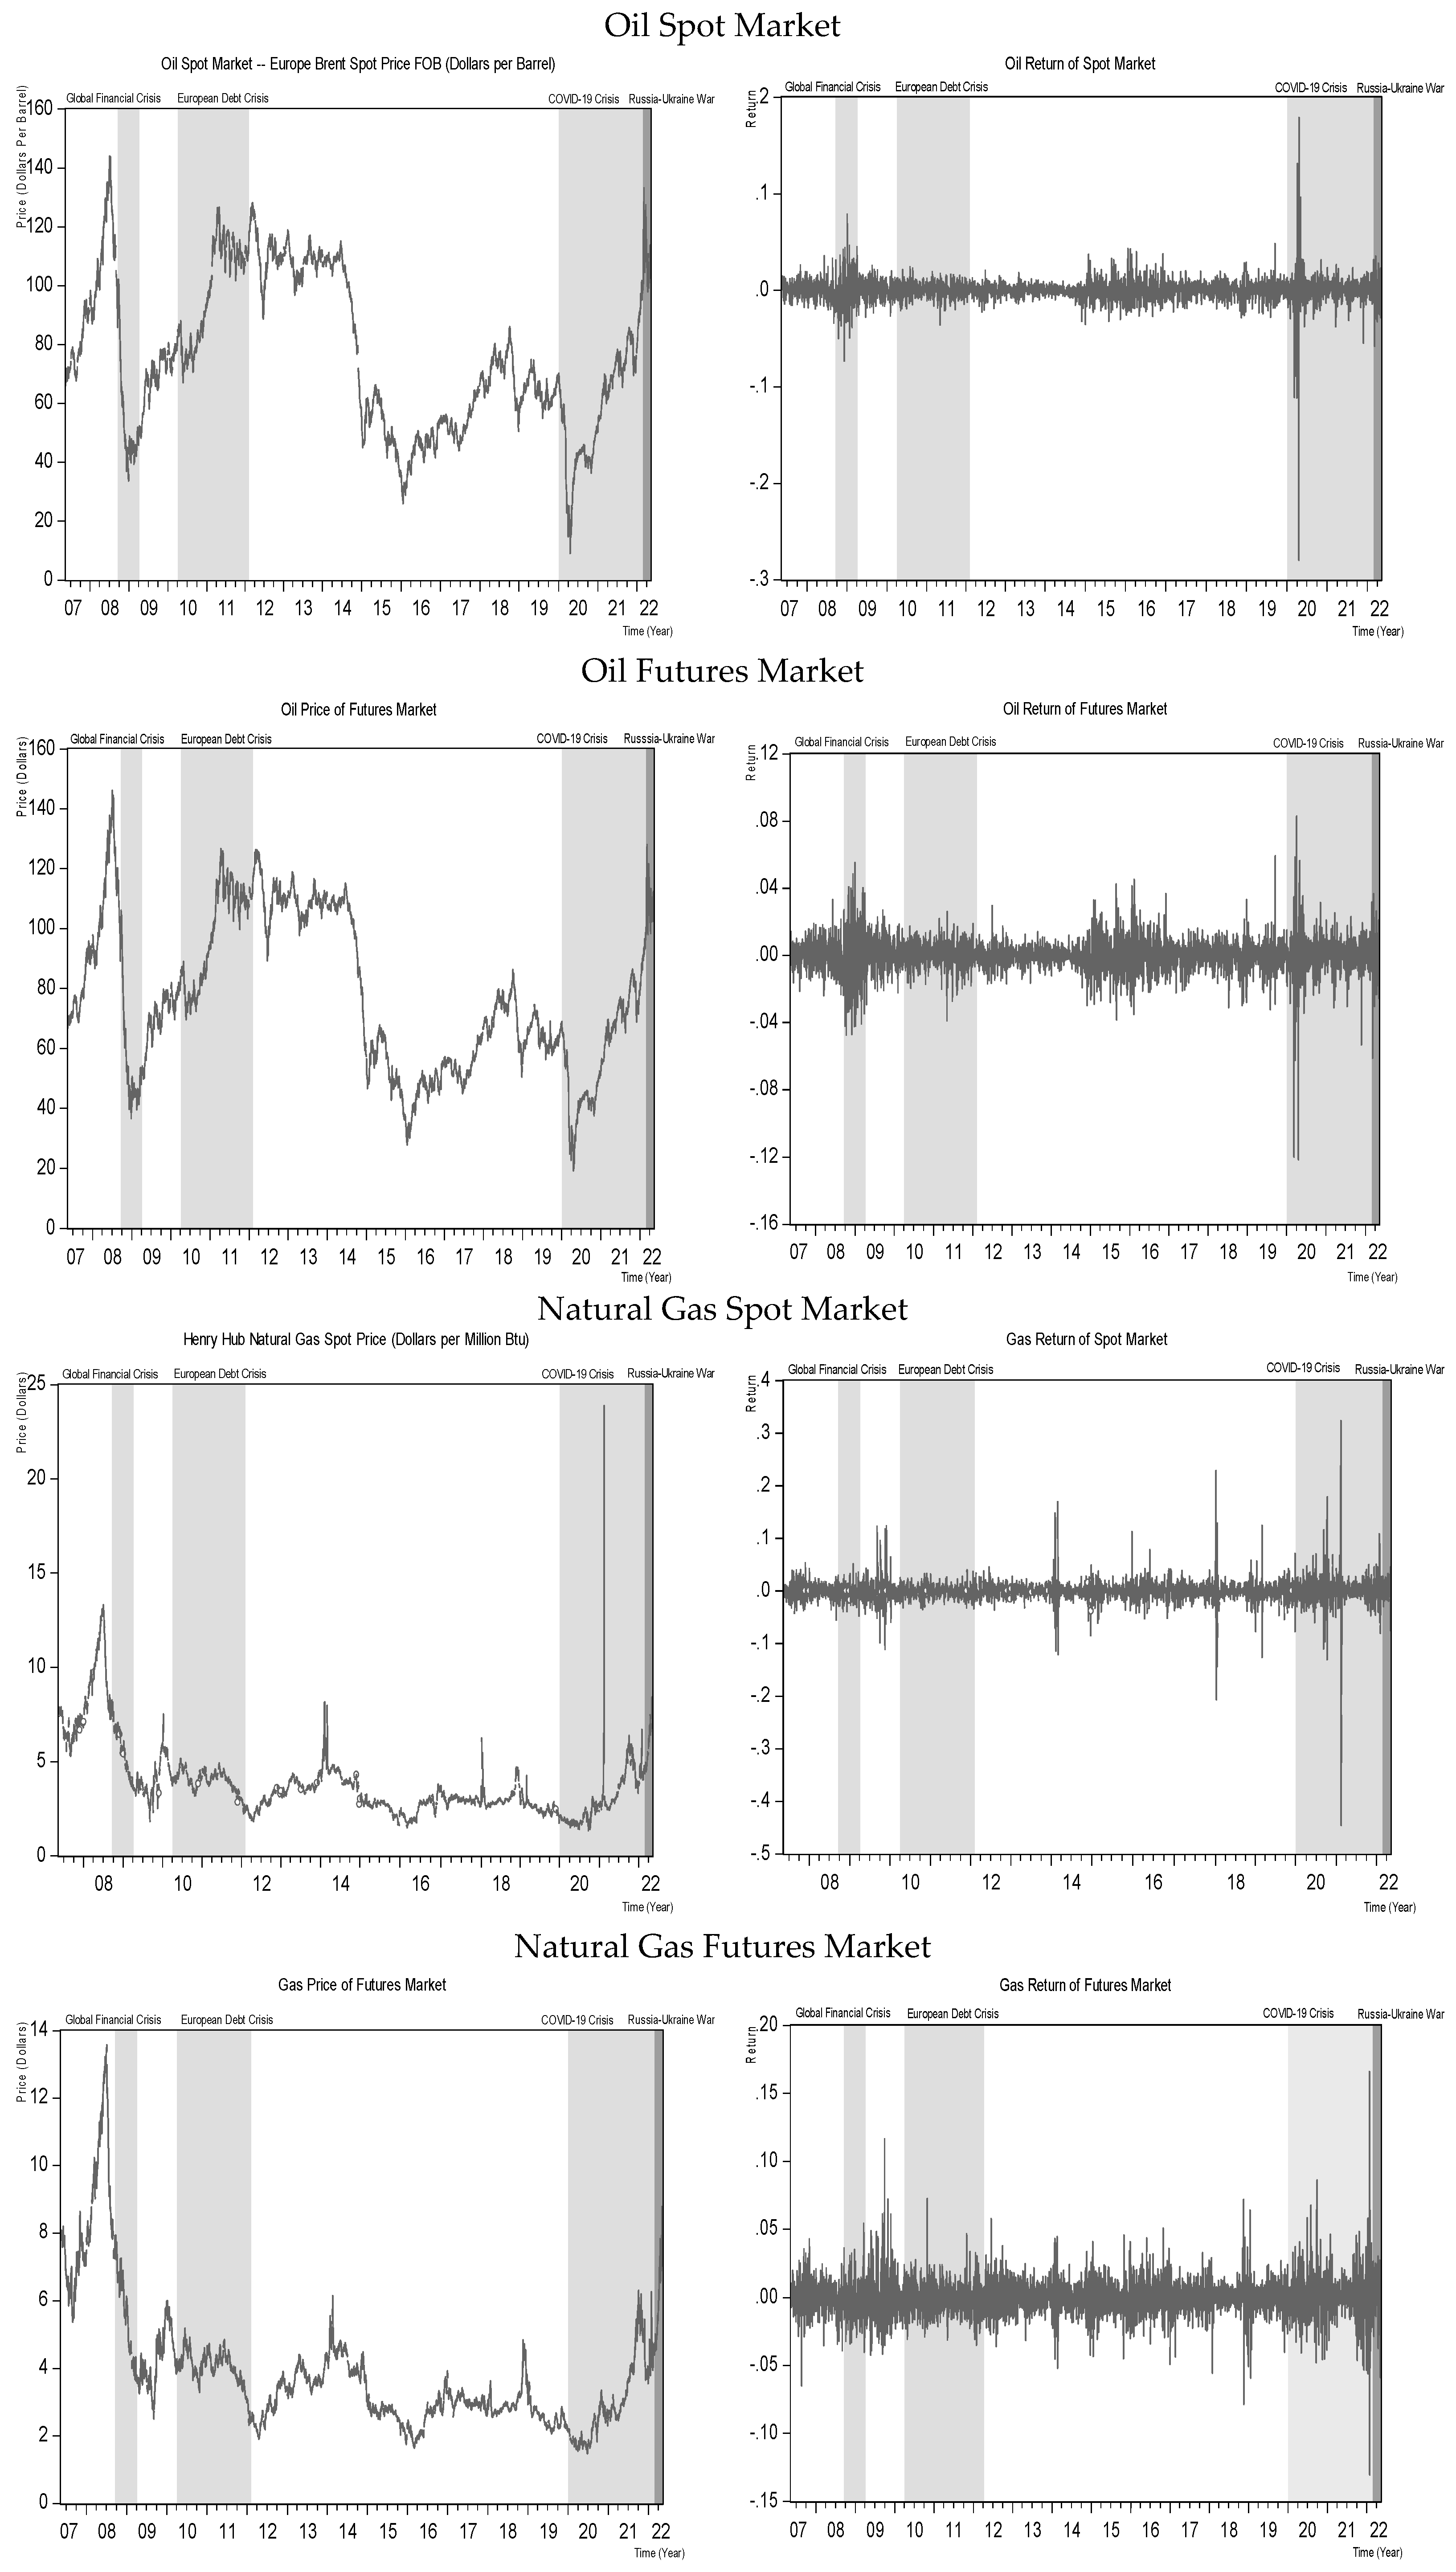
Figure 2.
Relationship between CSAD in BRICS and Returns of Energy Markets. (Note: The above scatter diagrams demonstrate the relationship between CSAD of sample markets and returns of different energy markets, including spot markets and futures markets).
Figure 2.
Relationship between CSAD in BRICS and Returns of Energy Markets. (Note: The above scatter diagrams demonstrate the relationship between CSAD of sample markets and returns of different energy markets, including spot markets and futures markets).
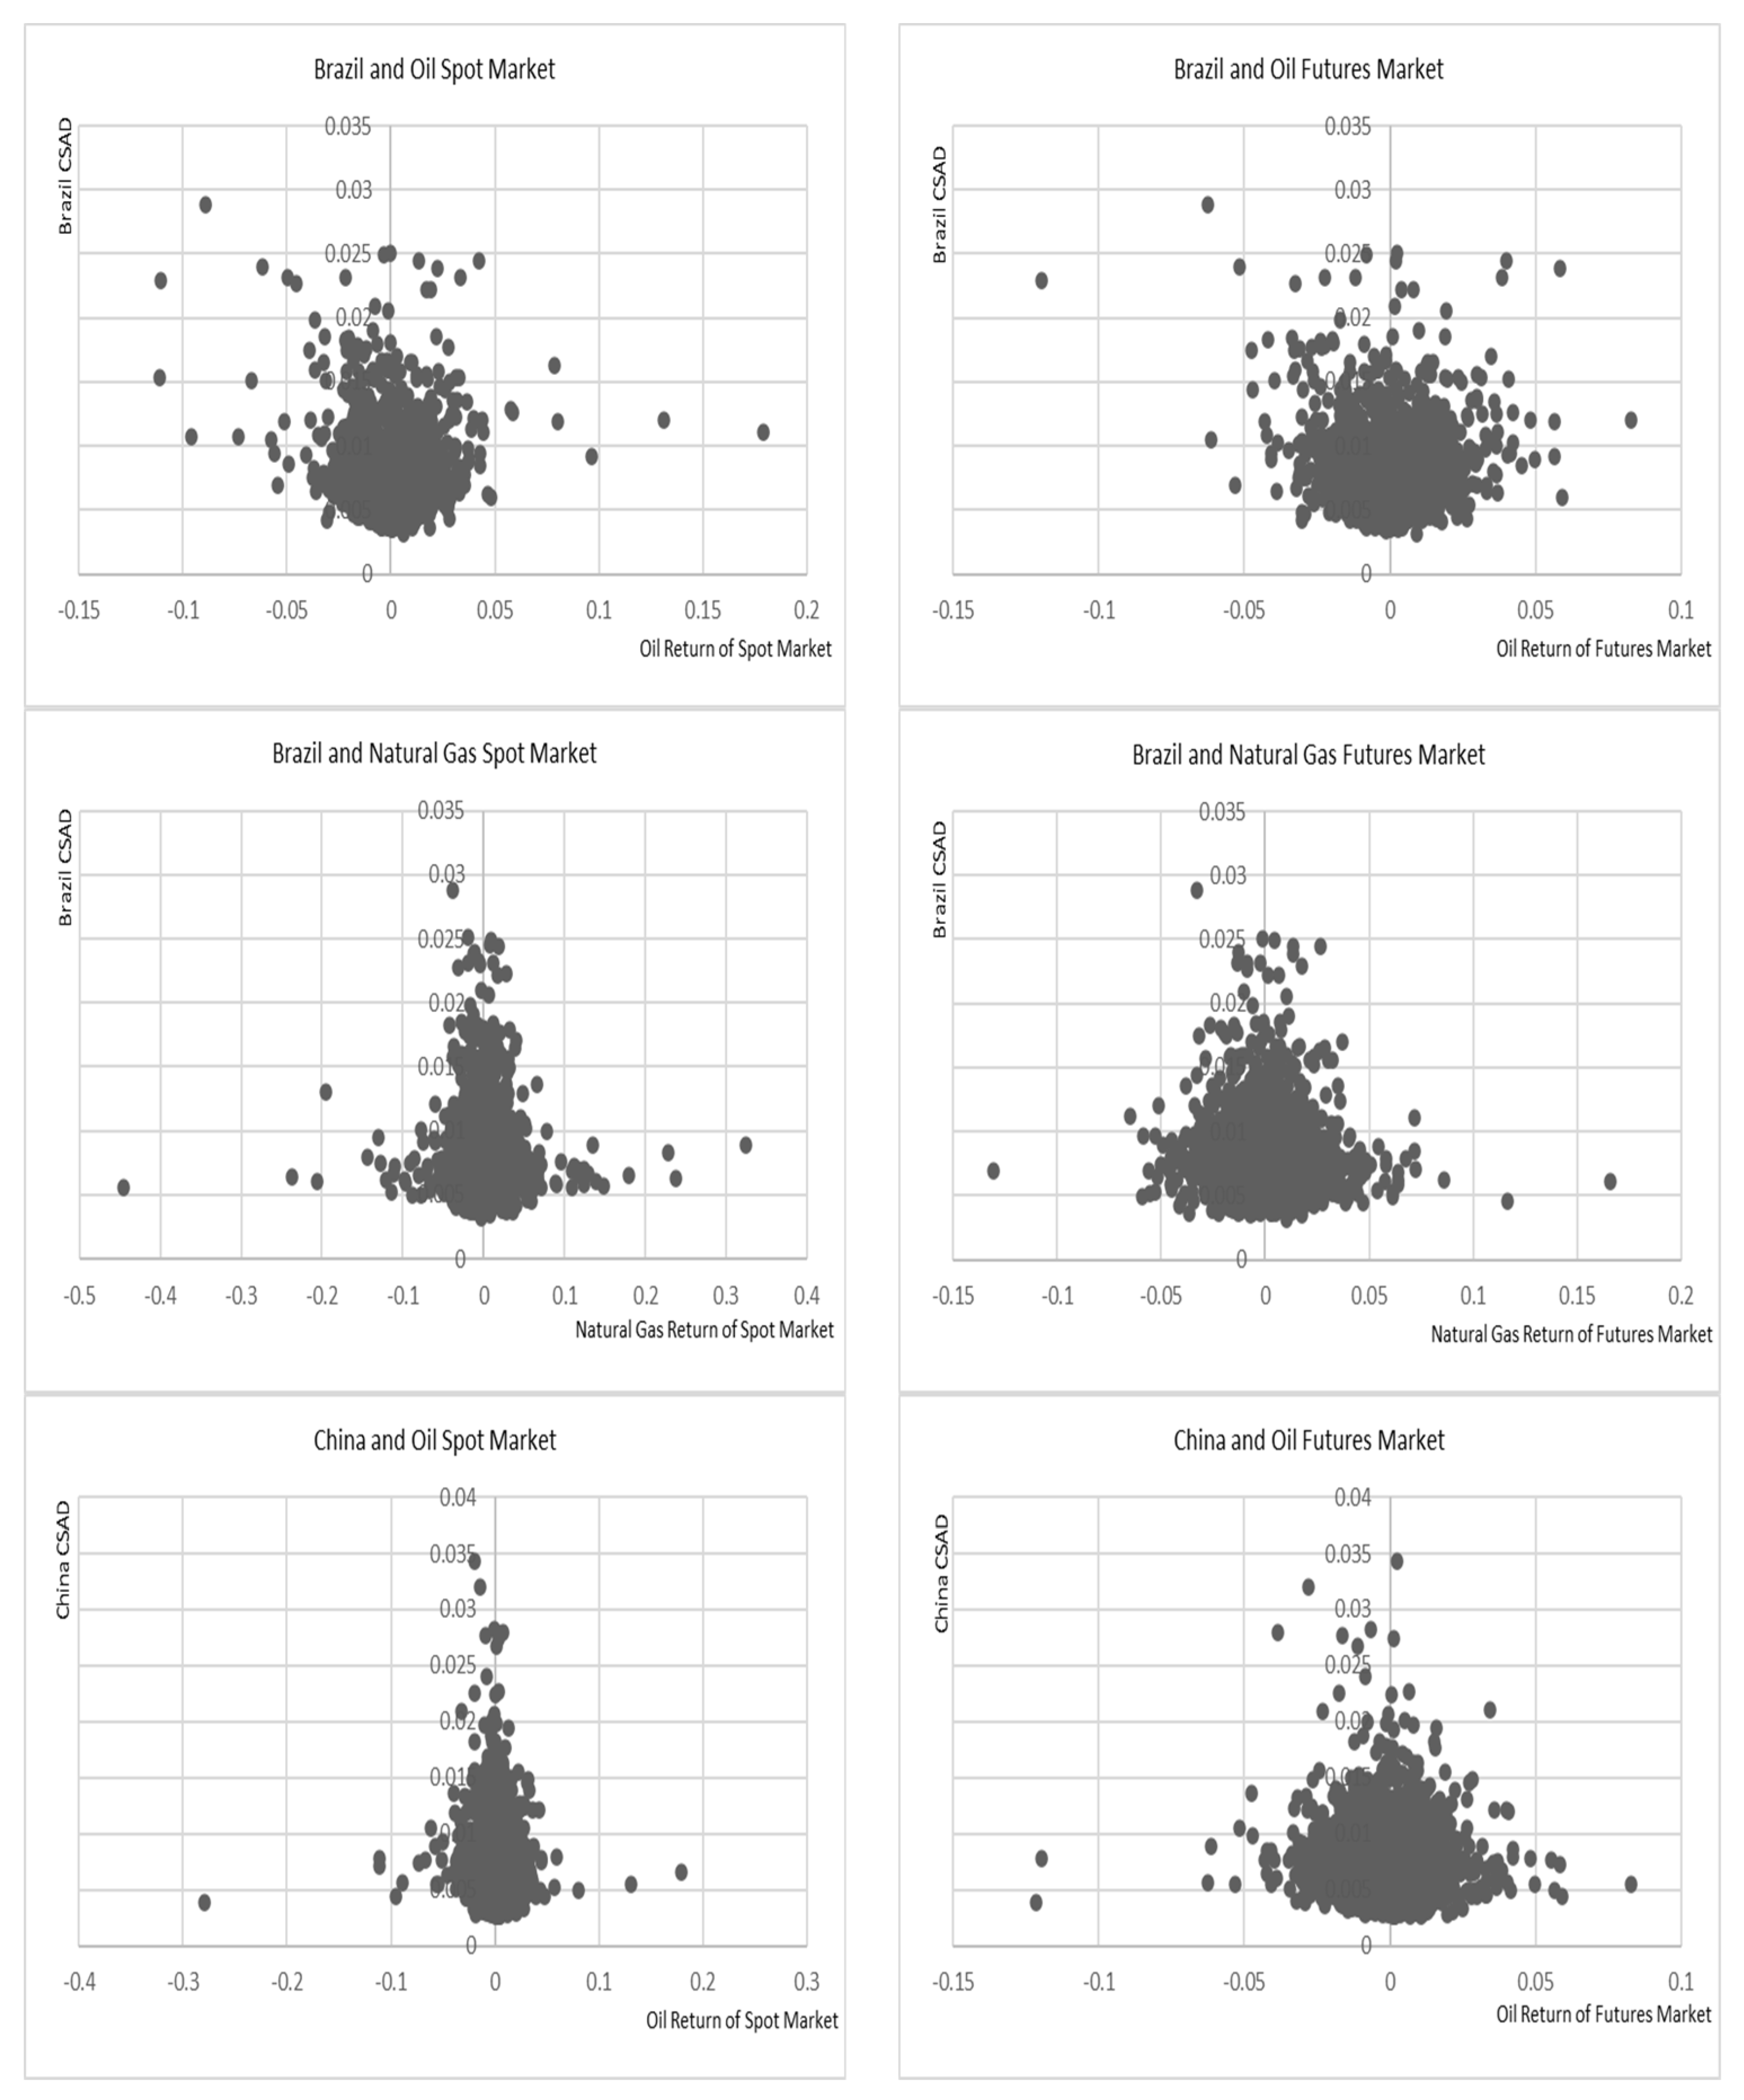

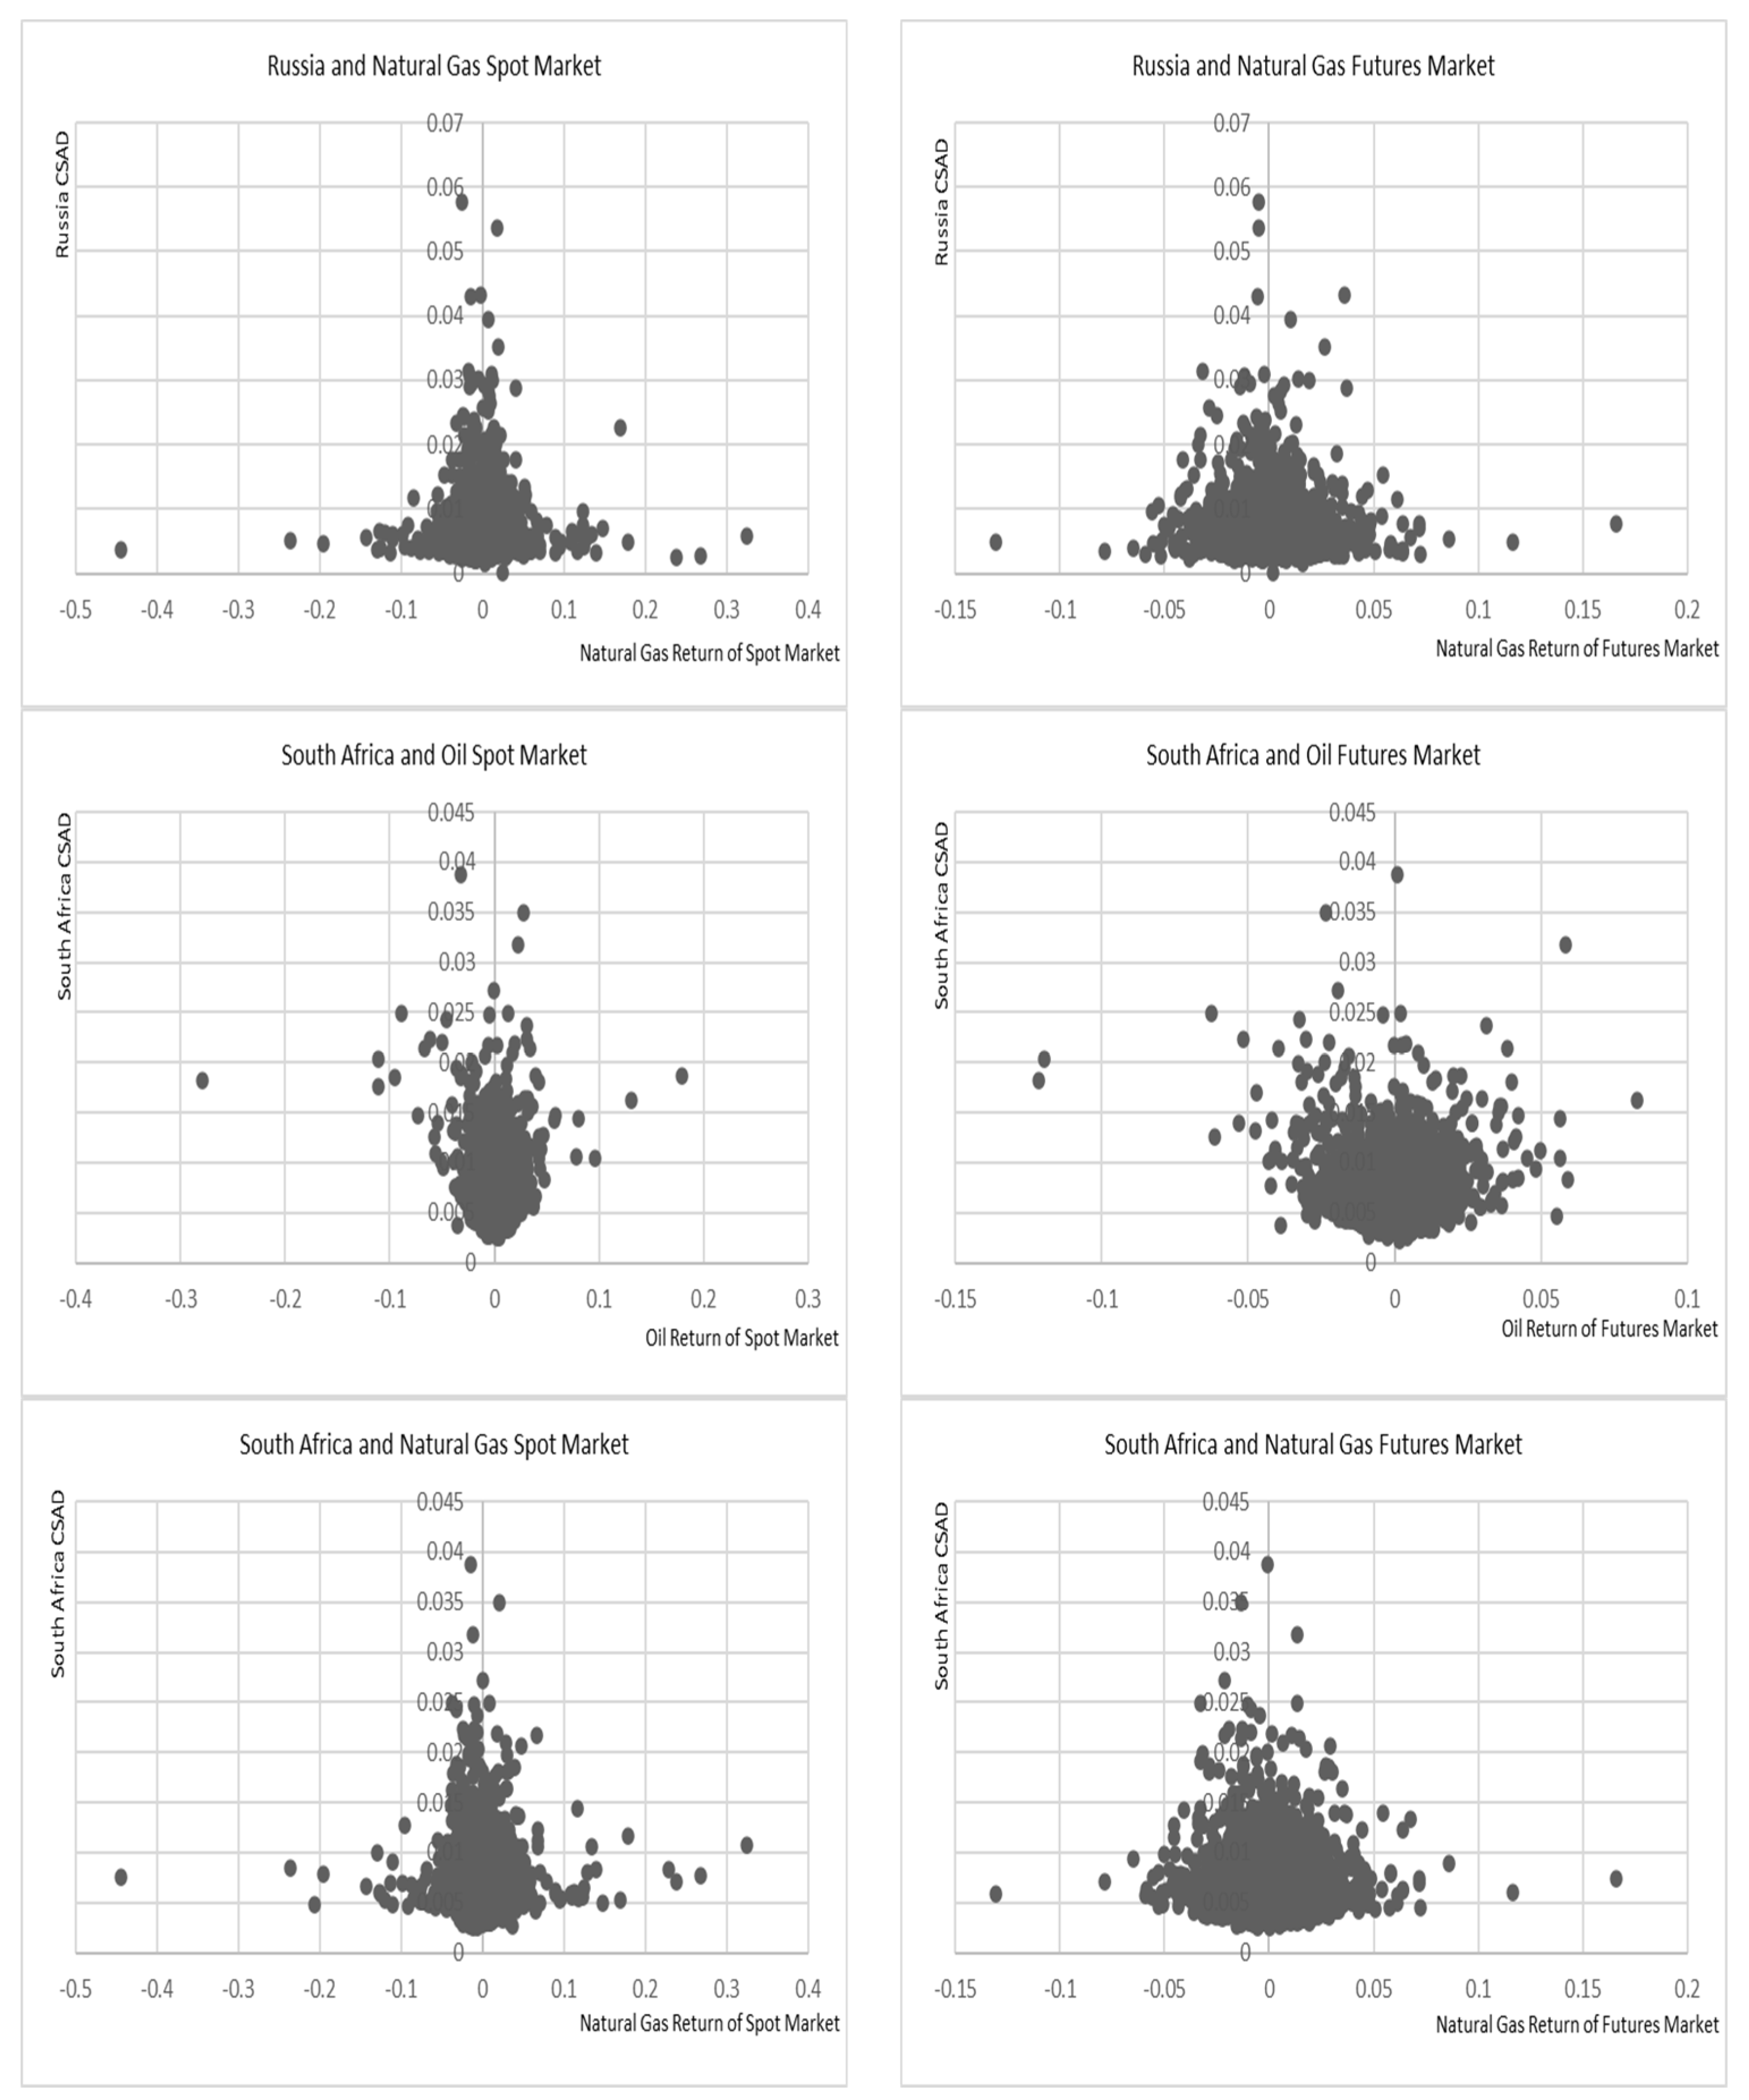

Table 1.
(A) Stationarity Test, CSAD and market returns; (B) Stationarity Test, energy markets.
| (A) | |||||
| Variables | Brazil | China | India | Russia | South Africa |
| CSAD | −7.45 | −8.13 | −9.07 | −7.02 | −5.90 |
| (p Value) | (0.00) | (0.00) | (0.00) | (0.00) | (0.00) |
| Rmt | −64.98 | −58.95 | −58.36 | −63.23 | −60.53 |
| (p Value) | (0.00) | (0.00) | (0.00) | (0.00) | (0.00) |
| |Rmt| | −4.65 | −3 | −4.55 | −3.82 | −3.84 |
| (p Value) | (0.00) | (0.00) | (0.00) | (0.00) | (0.00) |
| Rmt2 | −7.89 | −5.11 | −8.63 | −11.65 | −6.81 |
| (p Value) | (0.00) | (0.00) | (0.00) | (0.00) | (0.00) |
| Result | Stationarity | Stationarity | Stationarity | Stationarity | Stationarity |
| (B) | |||||
| Variables | Energy Market | ||||
| ROil Spot | −13.89 | ||||
| (p Value) | (0.00) | ||||
| ROil Futures | −63.44 | ||||
| (p Value) | (0.00) | ||||
| RHH Spot | −31.99 | ||||
| (p Value) | (0.00) | ||||
| RGas Futures | −66.94 | ||||
| (p Value) | (0.00) | ||||
| σOil Spot GARCH | −6.08 | ||||
| (p Value) | (0.00) | ||||
| σOil Spot EWMA | −6.75 | ||||
| (p Value) | (0.00) | ||||
| σOil Futures GK | −5.65 | ||||
| (p Value) | (0.00) | ||||
| σOil Futures RS Vol | −5.74 | ||||
| (p Value) | (0.00) | ||||
| σHH Spot GARCH | −11.55 | ||||
| (p Value) | (0.00) | ||||
| σHH Spot EWMA | −5.08 | ||||
| (p Value) | (0.00) | ||||
| σGas Futures GK | −7.95 | ||||
| (p Value) | (0.00) | ||||
| σGas Futures RS Vol | −8.22 | ||||
| (p Value) | (0.00) | ||||
| SROil Futures | −4.66 | ||||
| (p Value) | (0.00) | ||||
| SRGas Futures | −6.13 | ||||
| (p Value) | (0.00) | ||||
| ROVX Index | −63.86 | ||||
| (p Value) | (0.00) | ||||
| R3M Index | −33.72 | ||||
| (p Value) | (0.00) | ||||
| Result | Stationarity | ||||
Table 2.
Descriptive Statistics: Herding and Market Return Indicators.
| Variables | Brazil | China | India | Russia | South Africa | |
|---|---|---|---|---|---|---|
| CSAD | Mean | 0.7283 | 0.6760 | 0.8315 | 0.6002 | 0.6811 |
| Median | 0.6744 | 0.6159 | 0.7736 | 0.5084 | 0.6150 | |
| Maximum | 2.8838 | 3.4303 | 3.9049 | 5.7662 | 3.8787 | |
| Minimum | 0.3158 | 0.2578 | 0.4257 | 0.0041 | 0.2231 | |
| Standard Deviation | 0.2441 | 0.2790 | 0.2503 | 0.3561 | 0.2844 | |
| Rmt | Mean | 0.0088 | 0.0008 | 0.0157 | 0.0038 | 0.0102 |
| Median | 0.0255 | 0.0257 | 0.0292 | 0.0181 | 0.0232 | |
| Maximum | 5.9404 | 3.8786 | 6.9444 | 10.9556 | 3.1536 | |
| Minimum | −6.946 | −3.9757 | −6.1243 | −17.5748 | −4.4415 | |
| Standard Deviation | 0.7697 | 0.7363 | 0.6073 | 0.8665 | 0.5371 | |
| Observations | 3711 | 3652 | 3719 | 3747 | 3752 |
Note: In order to make data readable, all original values are multiplied by 100.
Table 3.
Herding in BRICS’ Stock Market.
| Brazil | China | India | Russia | South Africa | |
|---|---|---|---|---|---|
| 0.23 | 0.28 | 0.27 | 0.37 | 0.27 | |
| (0.00) | (0.00) | (0.00) | (0.00) | (0.00) | |
| 1.74 | −3.21 | 1.79 | −0.27 | 8.09 | |
| (0.00) | (0.00) | (0.00) | (0.01) | (0.00) |
Note: This table presents results of Equation (2):. Bold figures mean significant results.
Table 4.
Performance of Energy Markets and Herding in BRICS.
| Brazil | China | India | Russia | South Africa | |
|---|---|---|---|---|---|
| ROil Spot2 | 0.34 | −0.02 | 0.07 | 0.01 | 0.26 |
| (p Value) | (0.00) | (0.40) | (0.00) | (0.85) | (0.00) |
| ROil Futures2 | 0.93 | 0.12 | 0.4 | 0.72 | 0.97 |
| (p Value) | (0.00) | (0.21) | (0.00) | (0.00) | (0.00) |
| RGas Spot2 | 0.0023 | 0.04 | 0.01 | −0.01 | 0.03 |
| (p Value) | (0.75) | (0.00) | (0.19) | (0.24) | (0.00) |
| RGas Futures2 | 0.04 | 0.1 | 0.08 | 0.08 | 0.12 |
| (p Value) | (0.31) | (0.09) | (0.09) | (0.15) | (0.02) |
Note: Table 4 illustrates regression result of model Equation (3): .
Table 5.
Herding Effect between Equity Markets of BRICS and Energy Markets based on Different Crisis Events.
Table 5.
Herding Effect between Equity Markets of BRICS and Energy Markets based on Different Crisis Events.
| Brazil | China | India | Russia | South Africa | ||
|---|---|---|---|---|---|---|
| Crisis Periods | ||||||
| Global Financial Crisis (15/09/2008–31/03/2009) | ROil Spot2 | 0.21 | 0.25 | 0.12 | −1.02 | 0.11 |
| (p Value) | (0.46) | (0.43) | (0.69) | (0.16) | (0.56) | |
| ROil Futures2 | 0.8 | 0.39 | 0.40 | −0.45 | −0.29 | |
| (p Value) | (0.07) | (0.25) | (0.35) | (0.60) | (0.32) | |
| RGas Spot2 | 0.19 | −0.71 | 0.06 | −1.10 | 0.38 | |
| (p Value) | (0.74) | (0.13) | (0.92) | (0.35) | (0.32) | |
| RGas Futures2 | 0.28 | 0.46 | −0.21 | 0.58 | −0.73 | |
| (p Value) | (0.63) | (0.35) | (0.73) | (0.62) | (0.08) | |
| European Debt Crisis (1/04/2010–31/01/2012) | ROil Spot2 | 1.33 | −0.84 | −1.07 | 1.05 | −0.47 |
| (p Value) | (0.01) | (0.31) | (0.08) | (0.20) | (0.20) | |
| ROil Futures2 | 0.99 | −0.61 | −1.01 | 1.83 | −0.36 | |
| (p Value) | (0.04) | (0.41) | (0.06) | (0.01) | (0.28) | |
| RGas Spot2 | 0.02 | 0.29 | 0.22 | −0.17 | −0.17 | |
| (p Value) | (0.92) | (0.47) | (0.40) | (0.63) | (0.29) | |
| RGas Futures2 | 0.24 | 0.40 | 0.13 | −0.18 | −0.07 | |
| (p Value) | (0.14) | (0.16) | (0.50) | (0.49) | (0.55) | |
| COVID-19 Crisis (31/12/2019–13/05/2022) | ROil Spot2 | 0.23 | −0.06 | 0.04 | −0.01 | 0.15 |
| (p Value) | (0.00) | (0.01) | (0.06) | (0.62) | (0.00) | |
| ROil Futures2 | 0.55 | −0.25 | 0.13 | 0.15 | 0.55 | |
| (p Value) | (0.00) | (0.00) | (0.11) | (0.24) | (0.00) | |
| RGas Spot2 | −0.01 | 0.04 | 0.002 | −0.01 | 0.0028 | |
| (p Value) | (0.56) | (0.00) | (0.79) | (0.18) | (0.83) | |
| RGas Futures2 | −0.03 | 0.03 | −0.01 | 0.0023 | −0.05 | |
| (p Value) | (0.59) | (0.62) | (0.91) | (0.97) | (0.59) | |
| Russia–Ukraine War (24/02/2022–13/05/2022) | ROil Spot2 | 0.49 | −0.42 | 0.08 | 0.18 | 1.12 |
| (p Value) | (0.30) | (0.36) | (0.84) | (0.96) | (0.01) | |
| ROil Futures2 | 0.49 | −0.28 | −0.01 | 1.12 | 1.00 | |
| (p Value) | (0.27) | (0.51) | (0.98) | (0.80) | (0.01) | |
| RGas Spot2 | 0.50 | −0.06 | 0.63 | −2.62 | −0.20 | |
| (p Value) | (0.10) | (0.84) | (0.02) | (0.27) | (0.48) | |
| RGas Futures2 | 0.46 | 0.77 | −0.07 | −3.22 | −1.49 | |
| (p Value) | (0.31) | (0.09) | (0.87) | (0.24) | (0.00) | |
| Non-Crisis Period | ||||||
| Pre-Global Financial Crisis (11/05/2007–14/09/2008) | ROil Spot2 | 0.97 | −1.15 | −0.88 | 0.98 | 1.10 |
| (p Value) | (0.17) | (0.36) | (0.37) | (0.20) | (0.13) | |
| ROil Futures2 | 1.67 | −0.35 | −0.02 | −0.41 | 0.82 | |
| (p Value) | (0.06) | (0.81) | (0.99) | (0.68) | (0.36) | |
| RGas Spot2 | 0.61 | 0.13 | −0.12 | −0.39 | 0.17 | |
| (p Value) | (0.02) | (0.77) | (0.77) | (0.18) | (0.51) | |
| RGas Futures2 | 0.31 | −0.41 | −0.0015 | −0.42 | −0.09 | |
| (p Value) | (0.31) | (0.41) | (0.99) | (0.20) | (0.77) | |
| Pre-European Debt Crisis (01/04/2009–31/03/2010) | ROil Spot2 | −0.28 | 0.90 | 0.04 | −0.32 | 0.40 |
| (p Value) | (0.58) | (0.20) | (0.97) | (0.75) | (0.44) | |
| ROil Futures2 | −0.38 | 1.27 | 1.08 | 0.49 | 1.06 | |
| (p Value) | (0.54) | (0.10) | (0.44) | (0.68) | (0.08) | |
| RGas Spot2 | −0.0030 | −0.10 | −0.09 | −0.05 | −0.01 | |
| (p Value) | (0.94) | (0.11) | (0.38) | (0.54) | (0.79) | |
| RGas Futures2 | −0.18 | 0.12 | 0.08 | −0.03 | 0.0062 | |
| (p Value) | (0.02) | (0.27) | (0.65) | (0.87) | (0.94) | |
| Pre-COVID-19 Crisis (01/02/2012–13/05/2022) | ROil Spot2 | 1.80 | 0.93 | 0.33 | 1.33 | 1.53 |
| (p Value) | (0.00) | (0.02) | (0.13) | (0.00) | (0.00) | |
| ROil Futures2 | 1.64 | 1.6 | 0.31 | 1.25 | 1.3 | |
| (p Value) | (0.00) | (0.00) | (0.12) | (0.00) | (0.00) | |
| RGas Spot2 | 0.01 | 0.01 | 0.01 | 0.02 | 0.02 | |
| (p Value) | (0.73) | (0.69) | (0.75) | (0.49) | (0.23) | |
| RGas Futures2 | 0.28 | −0.0036 | −0.25 | 0.20 | 0.02 | |
| (p Value) | (0.02) | (0.98) | (0.01) | (0.08) | (0.89) | |
Note: Table 5 illustrates regression results of Equation (4): . Bold figures indicate significant results.
Table 6.
Granger Causality Tests: CSAD and Performance of Energy Markets—Crisis Periods.
| Null Hypothesis | Energy Markets | Brazil | China | India | Russia | South Africa |
|---|---|---|---|---|---|---|
| Panel A: Global Financial Crisis Period (15 September 2008–31 March 2009) | ||||||
| Panel A.1: CSADi,t does not cause Performance of Energy Market(s) (Prob.) | Oil Spot Market | 0.33 | 0.48 | 0.33 | 0.57 | 0.57 |
| Oil Futures Market | 0.12 | 0.87 | 0.16 | 0.21 | 0.89 | |
| Gas Spot Market | 0.53 | 0.99 | 0.67 | 0.65 | 0.71 | |
| Gas Futures Market | 0.95 | 0.25 | 0.26 | 0.37 | 0.12 | |
| Panel A.2: Performance of Energy Market(s) does not cause CSADi,t (Prob.) | Oil Spot Market | 0.12 | 0.72 | 0.98 | 0.76 | 0.22 |
| Oil Futures Market | 0.70 | 0.44 | 0.36 | 0.21 | 0.88 | |
| Gas Spot Market | 0.47 | 0.87 | 0.44 | 0.66 | 0.15 | |
| Gas Futures Market | 0.64 | 0.52 | 0.27 | 0.70 | 0.44 | |
| Panel B: European Debt Crisis Period (1 April 2010–31 January 2012) | ||||||
| Panel B.1: CSADi,t does not cause Performance of Energy Market(s) (Prob.) | Oil Spot Market | 0.39 | 0.17 | 0.39 | 0.27 | 0.17 |
| Oil Futures Market | 0.62 | 0.76 | 0.88 | 0.01 | 0.78 | |
| Gas Spot Market | 0.51 | 0.74 | 0.14 | 0.69 | 0.26 | |
| Gas Futures Market | 0.36 | 0.73 | 0.71 | 0.84 | 0.72 | |
| Panel B.2: Performance of Energy Market(s) does not cause CSADi,t (Prob.) | Oil Spot Market | 0.12 | 0.59 | 0.75 | 0.27 | 0.32 |
| Oil Futures Market | 0.25 | 0.79 | 0.72 | 0.24 | 0.36 | |
| Gas Spot Market | 0.58 | 0.07 | 0.65 | 0.52 | 0.69 | |
| Gas Futures Market | 0.90 | 0.13 | 0.09 | 0.59 | 0.85 | |
| Panel C: COVID-19 Crisis Period (31 December 2019–13 May 2022) | ||||||
| Panel C.1: CSADi,t does not cause Performance of Energy Market(s) (Prob.) | Oil Spot Market | 0.12 | 0.80 | 0.00 | 0.70 | 0.12 |
| Oil Futures Market | 0.01 | 0.85 | 0.31 | 0.31 | 0.01 | |
| Gas Spot Market | 0.61 | 0.95 | 0.96 | 0.93 | 0.9 | |
| Gas Futures Market | 0.95 | 0.22 | 0.47 | 0.91 | 0.81 | |
| Panel C.2: Performance of Energy Market(s) does not cause CSADi,t (Prob.) | Oil Spot Market | 0.02 | 0.02 | 0.28 | 0.60 | 0.02 |
| Oil Futures Market | 0.01 | 0.02 | 0.20 | 0.20 | 0.03 | |
| Gas Spot Market | 0.83 | 0.35 | 0.93 | 0.93 | 0.86 | |
| Gas Futures Market | 0.94 | 0.18 | 0.82 | 0.91 | 0.86 | |
| Panel D: Russia–Ukraine War Crisis Period (24 February 2022–13 May 2022) | ||||||
| Panel D.1: CSADi,t does not cause Performance of Energy Market(s) (Prob.) | Oil Spot Market | 0.49 | 0.17 | 0.60 | 0.52 | 0.27 |
| Oil Futures Market | 0.53 | 0.84 | 0.70 | 0.62 | 0.10 | |
| Gas Spot Market | 0.31 | 0.23 | 0.74 | 0.21 | 0.62 | |
| Gas Futures Market | 0.77 | 0.47 | 0.55 | 0.30 | 0.55 | |
| Panel D.2: Performance of Energy Market(s) does not cause CSADi,t (Prob.) | Oil Spot Market | 0.46 | 0.02 | 0.43 | 0.18 | 0.68 |
| Oil Futures Market | 0.23 | 0.14 | 0.61 | 0.66 | 0.90 | |
| Gas Spot Market | 0.25 | 0.36 | 0.13 | 0.83 | 0.31 | |
| Gas Futures Market | 0.39 | 0.86 | 0.15 | 0.27 | 0.85 | |
Note: Table 6 displays Granger causality tests results about the impact of energy markets on CSAD in BRICS and the other way around. Bold figures indicate significant results.
Table 7.
Herding Effect between Equity Markets of BRICS and Energy Markets during Up/Down Periods.
| State of Energy Market | Brazil | China | India | Russia | South Africa | |
|---|---|---|---|---|---|---|
| Upward Period (REnergy > 0) | ROil Spot2 | 0.25 | −0.01 | 0.24 | 0.04 | 0.51 |
| (p Value) | (0.00) | (0.88) | (0.00) | (0.55) | (0.00) | |
| ROil Futures2 | 1.48 | 0.20 | 1.38 | 1.31 | 1.84 | |
| (p Value) | (0.00) | (0.32) | (0.00) | (0.00) | (0.00) | |
| RGas Spot2 | 0.01 | −0.02 | 0.01 | −0.01 | 0.05 | |
| (p Value) | (0.35) | (0.41) | (0.60) | (0.45) | (0.00) | |
| RGas Futures2 | −0.04 | 0.02 | 0.08 | 0.06 | 0.11 | |
| (p Value) | (0.42) | (0.77) | (0.21) | (0.41) | (0.06) | |
| Downward Period (REnergy < 0) | ROil Spot2 | 0.65 | −0.03 | 0.04 | −0.0025 | 0.18 |
| (p Value) | (0.00) | (0.37) | (0.14) | (0.94) | (0.00) | |
| ROil Futures2 | 0.72 | 0.09 | 0.13 | 0.40 | 0.71 | |
| (p Value) | (0.00) | (0.44) | (0.13) | (0.01) | (0.00) | |
| RGas Spot2 | −0.0023 | 0.05 | 0.01 | 0.01 | 0.01 | |
| (p Value) | (0.80) | (0.00) | (0.21) | (0.40) | (0.31) | |
| RGas Futures2 | 0.26 | 0.29 | 0.10 | 0.14 | 0.14 | |
| (p Value) | (0.00) | (0.01) | (0.25) | (0.20) | (0.16) |
Note: Table 7 presents regression results regarding the impact of energy markets on CSAD in BRICS during different states of energy markets based on Equation (5): and Equation (6): .
Table 8.
Herding Effect and Different Degrees of Volatility in Spot and Futures Markets.
| First Quartile (σ < 25% of Distribution)—α3 | |||||||
|---|---|---|---|---|---|---|---|
| Brazil | China | India | Russia | South Africa | |||
| Spot Market | GARCH Volatility (p value) | Oil | −8.50 | −9.06 | −4.78 | −3.67 | −27.73 |
| (0.00) | (0.00) | (0.02) | (0.00) | (0.00) | |||
| Gas | 0.12 | −1.46 | −1.36 | −14.05 | −9.95 | ||
| (0.88) | (0.11) | (0.36) | (0.00) | (0.00) | |||
| EWMA Volatility (p value) | Oil | −8.90 | −4.01 | −4.87 | −0.55 | −26.97 | |
| (0.00) | (0.00) | (0.01) | (0.00) | (0.00) | |||
| Gas | −2.63 | −2.04 | −3.86 | −9.52 | −17.89 | ||
| (0.00) | (0.02) | (0.01) | (0.00) | (0.00) | |||
| Futures Market | RS Volatility (p Value) | Oil | −7.03 | −5.62 | 1.77 | −8.23 | −22.87 |
| (0.00) | (0.00) | (0.19) | (0.00) | (0.00) | |||
| Gas | −0.73 | −1.03 | 1.37 | −1.05 | −0.78 | ||
| (0.49) | (0.34) | (0.27) | (0.00) | (0.65) | |||
| GK Volatility (p value) | Oil | −8.47 | −6.38 | −2.64 | −16.90 | −23.80 | |
| (0.00) | (0.00) | (0.20) | (0.00) | (0.00) | |||
| Gas | −3.12 | −2.19 | −0.1 | −6.01 | −7.27 | ||
| (0.00) | (0.06) | (0.51) | (0.00) | (0.00) | |||
| Second Quartile (25% of Distribution < σ < 50% of Distribution)—α4 | |||||||
| Spot Market | GARCH Volatility (p value) | Oil | 2.14 | 4.16 | −1.13 | −2.44 | 14.14 |
| (0.06) | (0.00) | (0.59) | (0.04) | (0.00) | |||
| Gas | 0.29 | −3.21 | 2.97 | 12.65 | 11.06 | ||
| (0.72) | (0.00) | (0.04) | (0.00) | (0.00) | |||
| EWMA Volatility (p value) | Oil | 5.34 | −2.68 | −0.22 | −5.50 | 9.59 | |
| (0.00) | (0.02) | (0.91) | (0.00) | (0.00) | |||
| Gas | 2.51 | −2.98 | −2.60 | 2.81 | 6.16 | ||
| (0.01) | (0.00) | (0.09) | (0.06) | (0.01) | |||
| Futures Market | RS Volatility (p Value) | Oil | −0.06 | 2.60 | −0.78 | −1.04 | 13.9 |
| (0.97) | (0.04) | (0.63) | (0.48) | (0.00) | |||
| Gas | 1.45 | −3.40 | 0.38 | 0.41 | 4.50 | ||
| (0.15) | (0.00) | (0.79) | (0.52) | (0.02) | |||
| GK Volatility (p value) | Oil | 4.14 | 1.99 | 3.96 | 10.20 | 8.16 | |
| (0.00) | (0.13) | (0.05) | (0.00) | (0.02) | |||
| Gas | 3.76 | −1.40 | 3.98 | 4.87 | 8.82 | ||
| (0.00) | (0.15) | (0.01) | (0.00) | (0.00) | |||
| Third Quartile (50% of Distribution < σ < 75% of Distribution)—α5 | |||||||
| Spot Market | GARCH Volatility (p value) | Oil | 6.61 | 5.81 | 5.56 | 3.15 | 17.38 |
| (0.00) | (0.00) | (0.00) | (0.00) | (0.01) | |||
| Gas | 2.58 | −2.83 | 7.87 | 14.91 | 17.48 | ||
| (0.00) | (0.00) | (0.00) | (0.00) | (0.00) | |||
| EWMA Volatility (p value) | Oil | 4.34 | 1.30 | 8.02 | −4.31 | 17.67 | |
| (0.00) | (0.20) | (0.00) | (0.00) | (0.00) | |||
| Gas | 5.03 | −2.33 | 4.99 | 9.94 | 23.36 | ||
| (0.00) | (0.00) | (0.00) | (0.00) | (0.00) | |||
| Futures Market | RS Volatility (p Value) | Oil | 4.45 | 3.70 | −3.78 | 7.41 | 19.03 |
| (0.00) | (0.00) | (0.01) | (0.00) | (0.00) | |||
| Gas | 2.21 | −1.42 | 1.00 | 1.93 | 7.08 | ||
| (0.02) | (0.13) | (0.40) | (0.00) | (0.00) | |||
| GK Volatility (p value) | Oil | 7.71 | 5.02 | 0.10 | 16.32 | 14.69 | |
| (0.00) | (0.00) | (0.96) | (0.00) | (0.00) | |||
| Gas | 4.53 | −1.57 | 3.52 | 6.52 | 12.69 | ||
| (0.00) | (0.12) | (0.01) | (0.00) | (0.00) | |||
| Forth Quartile (σ > 75% of Distribution)—α6 | |||||||
| Spot Market | GARCH Volatility (p value) | Oil | 9.21 | 5.64 | 6.32 | 4.46 | 32.22 |
| (0.00) | (0.00) | (0.00) | (0.00) | (0.00) | |||
| Gas | 1.20 | −1.33 | 2.97 | 13.66 | 17.34 | ||
| (0.01) | (0.15) | (0.03) | (0.00) | (0.00) | |||
| EWMA Volatility (p value) | Oil | 9.60 | 0.76 | 6.07 | 1.20 | 31.21 | |
| (0.00) | (0.46) | (0.00) | (0.00) | (0.00) | |||
| Gas | 3.57 | −1.60 | 3.62 | 8.94 | 22.65 | ||
| (0.00) | (0.11) | (0.01) | (0.00) | (0.00) | |||
| Futures Market | RS Volatility (p Value) | Oil | 7.74 | 1.98 | −0.15 | 7.73 | 29.05 |
| (0.00) | (0.08) | (0.90) | (0.00) | (0.00) | |||
| Gas | 2.60 | −2.70 | 0.18 | 0.72 | 10.56 | ||
| (0.01) | (0.00) | (0.87) | (0.02) | (0.00) | |||
| GK Volatility (p value) | Oil | 9.43 | 2.85 | 4.08 | 16.4 | 28.46 | |
| (0.00) | (0.00) | (0.04) | (0.00) | (0.00) | |||
| Gas | 4.82 | −1.30 | 2.47 | 5.56 | 15.78 | ||
| (0.00) | (0.20) | (0.08) | (0.00) | (0.00) | |||
Note: Table 8 exhibits the effect of different levels of volatility in energy markets on herding in BRICS’ equity stock markets based on . Bold figures mean significant results.
Table 9.
Herding Effect and Speculative Activities in Energy Futures Market—Whole Period.
| Brazil | China | India | Russia | South Africa | |
|---|---|---|---|---|---|
| SROil Futures | 0.000015 | −0.0001 | −0.0001 | 0.0003 | −0.0004 |
| (p Value) | (0.76) | (0.23) | (0.02) | (0.00) | (0.00) |
| SRGas Futures | −0.000001 | −0.000003 | −0.00001 | −0.000003 | 0.000003 |
| (p Value) | (0.64) | (0.31) | (0.56) | (0.14) | (0.16) |
Note: Table 9 demonstrates how speculative activities in energy futures market can exert influence on herding of BRICS based on Equation (14): . Bold figures mean significant results.
Table 10.
Herding Effect and Speculative Activities in Energy Futures Market.
| Brazil | China | India | Russia | South Africa | ||
|---|---|---|---|---|---|---|
| Crisis Period | ||||||
| Global Financial Crisis (15/09/2008–31/03/2009) | SROil Futures (p value) | 0.001 | 0.0001 | 0.0007 | 0.0008 | 0.0002 |
| (0.01) | (0.83) | (0.03) | (0.25) | (0.46) | ||
| SRGas Futures (p value) | 0.0001 | 0.0001 | 0.00005 | 0.0006 | 0.00002 | |
| (0.55) | (0.43) | (0.81) | (0.19) | (0.90) | ||
| European Debt Crisis (1/04/2010–31/01/2012) | SROil Futures (p value) | 0.0001 | −0.0002 | 0.00003 | 0.0002 | −0.00002 |
| (0.17) | (0.01) | (0.68) | (0.01) | (0.69) | ||
| SRGas Futures (p value) | −0.00001 | −0.000001 | −2.34 × 10−05 | −0.00002 | −0.00002 | |
| (0.52) | (0.96) | (0.07) | (0.30) | (0.01) | ||
| COVID-19 Crisis (31/12/2019–13/05/2022) | SROil Futures (p value) | 0.0001 | 0.0001 | 0.0001 | 0.0005 | 0.0004 |
| (0.57) | (0.65) | (0.51) | (0.07) | (0.25) | ||
| SRGas Futures (p value) | −0.000003 | −0.000001 | 0.000001 | −0.000001 | 0.00001 | |
| (0.38) | (0.86) | (0.82) | (0.85) | (0.18) | ||
| Russia–Ukraine War (24/02/2022–13/05/2022) | SROil Futures (p value) | 0.001 | −0.001 | −0.0002 | 0.003 | 0.0013 |
| (0.13) | (0.48) | (0.81) | (0.38) | (0.06) | ||
| SRGas Futures (p value) | −0.00005 | 0.0001 | 0.00002 | 0.0003 | −0.00003 | |
| (0.33) | (0.06) | (0.58) | (0.06) | (0.55) | ||
| Non-Crisis Period | ||||||
| Pre-Global Financial Crisis (11/05/2007–14/09/2008) | SROil Futures (p value) | 0.0004 | −0.0003 | 0.0001 | 0.0007 | 0.0006 |
| (0.00) | (0.31) | (0.65) | (0.00) | (0.00) | ||
| SRGas Futures (p value) | −0.0001 | −0.0001 | −0.0001 | 0.0001 | −0.00004 | |
| (0.18) | (0.60) | (0.47) | (0.21) | (0.55) | ||
| Pre-European Debt Crisis (01/04/2009–31/03/2010) | SROil Futures (p value) | −0.00004 | −0.0002 | −0.0004 | 0.0001 | −0.0002 |
| (0.66) | (0.10) | (0.09) | (0.49) | (0.02) | ||
| SRGas Futures (p value) | −0.00002 | 0.00004 | −0.00001 | −0.00005 | −0.00002 | |
| (0.11) | (0.09) | (0.76) | (0.13) | (0.11) | ||
| Pre-COVID-19 Crisis (01/02/2012–13/05/2022) | SROil Futures (p value) | 0.0001 | 0.0002 | −0.0001 | 0.0002 | −0.0002 |
| (0.10) | (0.13) | (0.09) | (0.00) | (0.03) | ||
| SRGas Futures (p value) | 0.0000004 | −0.000001 | −0.000001 | −0.000002 | −0.000001 | |
| (0.83) | (0.69) | (0.74) | (0.24) | (0.76) | ||
Note: Table 10 demonstrates how speculative activities in energy futures market exert influence on herding in BRICS based on . Bold figures mean significant results.
Table 11.
Herding Effect and Different Degrees of Speculative Activities in Energy Futures Market.
| Brazil | China | India | Russia | South Africa | ||
|---|---|---|---|---|---|---|
| First Quartile of Speculation Ratio Distribution (SR < 25%) | ||||||
| Futures Market | Oil | 2.55 | −1.64 | 1.42 | 0.94 | 11.28 |
| (p value) | (0.00) | (0.17) | (0.00) | (0.20) | (0.00) | |
| Gas | 2.05 | −2.69 | 5.15 | 0.11 | 9.14 | |
| (p value) | (0.00) | (0.00) | (0.00) | (0.73) | (0.00) | |
| Second Quartile of Speculation Ratio Distribution (25% ≤ SR < 50%) | ||||||
| Futures Market | Oil | −1.31 | −0.66 | −2.68 | −1.33 | −2.80 |
| (p value) | (0.16) | (0.54) | (0.08) | (0.14) | (0.25) | |
| Gas | −0.70 | −0.91 | −1.66 | 0.72 | −0.69 | |
| (p value) | (0.10) | (0.30) | (0.06) | (0.02) | (0.60) | |
| Third Quartile of Speculation Ratio Distribution (50% ≤ SR < 75%) | ||||||
| Futures Market | Oil | −0.34 | −1.95 | 1.69 | −1.26 | −2.53 |
| (p value) | (0.67) | (0.05) | (0.01) | (0.08) | (0.21) | |
| Gas | −0.39 | 0.93 | −3.37 | 0.40 | −2.41 | |
| (p value) | (0.32) | (0.29) | (0.00) | (0.38) | (0.00) | |
| Forth Quartile of Speculation Ratio Distribution (SR > 75%) | ||||||
| Futures Market | Oil | −1.09 | −1.40 | 0.19 | −1.18 | −3.19 |
| (p value) | (0.17) | (0.17) | (0.72) | (0.09) | −0.11 | |
| Gas | 0.64 | −2.00 | −3.81 | −0.45 | 4.58 | |
| (p value) | (0.22) | (0.02) | (0.00) | (0.13) | (0.00) | |
Note: Table 11 illustrates the relationship between herding in BRICS’ equity markets and different level of speculative activities based on Equation (16): . Bold figures mean significant results.
Disclaimer/Publisher’s Note: The statements, opinions and data contained in all publications are solely those of the individual author(s) and contributor(s) and not of MDPI and/or the editor(s). MDPI and/or the editor(s) disclaim responsibility for any injury to people or property resulting from any ideas, methods, instructions or products referred to in the content. |
© 2023 by the authors. Licensee MDPI, Basel, Switzerland. This article is an open access article distributed under the terms and conditions of the Creative Commons Attribution (CC BY) license (https://creativecommons.org/licenses/by/4.0/).
Share and Cite
MDPI and ACS Style
Zhang, H.; Giouvris, E. What Is the Effect of Oil and Gas Markets (Spot/Futures) on Herding in BRICS? Recent Evidence (2007–2022). J. Risk Financial Manag. 2023, 16, 466. https://doi.org/10.3390/jrfm16110466
AMA Style
Zhang H, Giouvris E. What Is the Effect of Oil and Gas Markets (Spot/Futures) on Herding in BRICS? Recent Evidence (2007–2022). Journal of Risk and Financial Management. 2023; 16(11):466. https://doi.org/10.3390/jrfm16110466
Chicago/Turabian StyleZhang, Hang, and Evangelos Giouvris. 2023. "What Is the Effect of Oil and Gas Markets (Spot/Futures) on Herding in BRICS? Recent Evidence (2007–2022)" Journal of Risk and Financial Management 16, no. 11: 466. https://doi.org/10.3390/jrfm16110466