Article

Cost-Effectiveness Analysis of COVID-19 Case Quarantine Strategies in Two Australian States: New South Wales and Western Australia

1
Newcastle Business School, University of Newcastle, Callaghan, NSW 2308, Australia
2
Department of Research, International Engineering and Technology Institute, Denver, CO 80202, USA
3
Department of Sociology and Business Law, University of Bologna, 40126 Bologna, Italy
*
Author to whom correspondence should be addressed.
J. Risk Financial Manag. 2021, 14(7), 305; https://doi.org/10.3390/jrfm14070305
Submission received: 25 May 2021 / Revised: 29 June 2021 / Accepted: 1 July 2021 / Published: 4 July 2021
(This article belongs to the Special Issue COVID-19’s Risk Management and Its Impact on the Economy)

Abstract

:
Two main strategies, home and hotel isolation, have been used to isolate COVID-19 cases in most countries. Both have proven to be somewhat medically effective, but the costs to produce the desired outcome remain unclear. We used a decision tree model to compare alternatives and a simulation model to determine the household structure and provide recommendations for the most cost-effective way to isolate a COVID-19 patient in two Australian States, New South Wales (NSW) and Western Australia (WA). The results show that although the average cost of isolating a confirmed case at home is lower than that of a hotel quarantine, it is demonstrable that the decision depends on household size and the ages of household members. If the household members’ ages are old or the household size is large, the expected mean cost of home quarantine might be higher than hotel quarantine. Our study, therefore, provides the government with a cost-effective insight into making quarantine policies.

1. Introduction

The ongoing outbreak of the respiratory disease, known as Coronavirus Disease 2019 (COVID-19), is the latest threat to global health and the global economy. Initially recognised in December 2019 (Lu et al. 2020), COVID-19 is significantly more transmissible than preceding emergent Coronaviridae, severe acute respiratory syndrome coronavirus (SARS-CoV) and the Middle East respiratory syndrome coronavirus (MERS-CoV). The outbreak of COVID-19 has posed greater challenges for global public health, clinical responses, and whole-of-government responses than either SARS (2002–2004) or MERS (2012 to date) (De Wit et al. 2016). The case fatality rate is reported at between 0.48 and 5.73%, which varies across countries affected by multiple factors including coinfection, capacity and quality of the healthcare system, sociodemographic factors, and comorbidity conditions (Oke and Heneghan 2020). Moreover, its higher reproduction number, ranging from 2.24 to 3.58, and its asymptomatic transmission capability have made it difficult to contain the spread of the COVID-19 (Zhao et al. 2020).
Several pandemic intervention strategies including various approaches to containment, mitigation and suppression, have been investigated, deployed and adjusted across the world in recent months in order to prevent, slow down and eliminate the spread of COVID-19. While these strategies inevitably vary across nations, they need to be feasible, consider the resources of local health care systems, and be broadly acceptable to the community. Mitigation policies include, but are not limited to, isolation of cases, home quarantine of their household members, travel restrictions, venue closures, general social distancing and isolation of individuals within specific age groups (e.g., the elderly, defined as older than 75 years), as well as people with compromised immune systems or other vulnerable groups (Ferguson et al. 2020). In addition, governments have implemented mandatory isolation policies for travellers coming from overseas. Australia currently practices home-isolation of confirmed cases with mild symptoms, suspected cases (people with symptoms awaiting laboratory results) and close contacts of cases. This ultimately increases the risk of infection of other household members regardless of their personal hygiene actions, and thus increases the risk of costs. In addition, complete compliance with the home isolation restrictions is not fully guaranteed (Dickens et al. 2020). For example, more than 50% of people with unconfirmed infection in Israel did not comply with the self-isolation rules and went to work because of financial hardship (Bodas and Peleg 2020). Therefore, policy makers and governments need to carefully design a low risk and cost-effective method of isolating the COVID-19 patients.
In order to accurately estimate the costs of home isolation, this study applies age-stratified rates of hospitalisation, ICU bed requirements, and the length of stay in ward care. However, in order to obtain the co-occurrence of individuals with different age groups, we applied an agent-based simulation model developed by Geard et al. (2013). We implemented this model to simulate the populations of two Australian states, New South Wales (NSW) and Western Australia (WA), which are further split into capital city urban areas and regional areas. This is necessary to take into account their variable household structures, age distributions, and population densities.
The objectives of our research are: provide a cost-effectiveness analysis of two modes of quarantine of a COVID-19 case either by the home quarantine or the hotel quarantine option from the perspective of the national health system in Australia by using a detailed decision tree model; to examine the underlying factors (population density, household size, householder age) that contribute to both the cost and incidence of managing the diseases between urban and regional areas in two Australian states. The primary contributions of this paper are threefold. Our study, first, expands the understanding of cost-effectiveness to quarantine a COVID-19 patient by taking the potential hospitalisation and ICU costs associated with potential infection within the household into account as well. Second, this paper defines the possible scope to select whether home quarantine or hotel quarantine is more cost-effective. It expands extant literature on public health management by correcting the stereotype that the costs of home isolation must be lower than those of a hotel quarantine, and points out the situations in which hotel quarantine is more cost-effective, which are when the ages of household members are old or the sizes of household are large; third, it thus provides quarantine policy-making suggestions from the cost-effectiveness perspective to the government. By improving the quarantine policy, it can save quarantine costs for patients and, to some extent, reduces the overall number of COVID-19-infected patients by reducing the risks of transmission within the household, thereby saving on public health resources and social costs.
We continue with a literature review in Section 2, following by a discussion of the decision tree model and simulation model that analyse the cost-effectiveness and age-distribution of household members, respectively, in Section 3. The results and conclusion are reported in Section 4 and Section 5, respectively.

2. Literature Review

Evidence shows that coronavirus is transmissible via droplets and fomites, and supplemented by other transmission routes such as aerosols and faecal contamination (Van Doremalen et al. 2020; Xu et al. 2020). Niwa et al. (2020) highlighted the importance of reducing social contacts. They believed that the reduction in the contacts in the early stage of the COVID-19 outbreak is the most significant measure. Al Zobbi et al. (2020) revealed a significant correlation between tight social distance and the number of infections. Gungoraydinoglu et al. (2021) explored that quarantine as one of the intervention measures play a vital role in decreasing the mobility and reducing the spread of the COVID-19 virus. Moreover, Tang et al. (2020) explored that quarantine can enact synergistically with diagnosis to reduce the reproduction rate and transmission of COVID-19. However, since the pre-symptomatic or asymptomatic carriers can transmit the virus to others (Bai et al. 2020; He et al. 2020; Rothe et al. 2020), the household transmission will continue to contribute substantially to increase in cases even after enforced restrictions on human movement (Liu et al. 2020; She et al. 2020). Therefore, Regmi and Lwin (2021) recommended to think of the three Cs which are “closed spaces, crowed places and close contats” when considering the effective approach to reduce the COVID-19 transmission. They suggested that although isolation and quarantine is regarded as one of the most effective non-parmaceutical interventions (NPIs), other factors might affect the social contact and should also be considered, such as household size. Although the isolation of cases and quarantine of their close contacts at home are frequently recommended as a disease control measure in countries with COVID-19 outbreaks, these restrictions will have little impact on transmission within households. So far, the household secondary attack rate (HSAR) is variably reported between 4.64% and 38.7% with the weighted mean of 25.03% across different countries (Arnedo-Pena et al. 2020; Böhmer et al. 2020; Burke et al. 2020; Cheng et al. 2020; COVID-19 National Incident Room Surveillance Team 2020; Jing et al. 2020; Li et al. 2020; Park et al. 2020; Wang et al. 2020; Zhang et al. 2020). The Australian Department of Health reports that the HSAR can vary from 3–10% to as high as 100% (Australian Government Department of Health 2020). The risk of hospitalisation and the level of severity, particularly for the elderly, leads to not only a heavy cost for families and governments but also deterioration in care standards, and increased fatality rates with additional societal costs (Ji et al. 2020).
The dynamics of COVID-19 transmission are reported to vary across different age groups of the population. Children are usually not the primary source of infection and they do not play key roles in the transmission of COVID-19 (Gudbjartsson et al. 2020; Siachpazidou et al. 2021). Zhu et al. (2020) reported that children are the index case of only three out of 31 household clusters. Conversely, adult cases have shown higher probabilities of hospitalisation and a need for an ICU bed as well as case fatality rates partially due to compromised immune system with age, meaning they are more likely to suffer from COVID-19 (Gao et al. 2020; Hassan et al. 2020). According to Verity et al. (2020), on which Ferguson et al. (2020) based their simulation model, the hospitalisation and case fatality rate increases with age in China. In addition, COVID-19 National Incident Room Surveillance Team (2020) reported that the length of stay in hospital is also highly dependent on the age of patients. For instance, it is reported that the median length of ICU stays for cases in the age group 60+ of is eight days longer than cases in the 18–59 age group.

3. Data and Methods

The decision tree model described here is for the cost-effectiveness analysis of isolating a COVID-19 case with mild symptoms. In addition, the simulation model used is designed to estimate the structure of households and obtain the co-occurrence of individuals from different age groups in households.

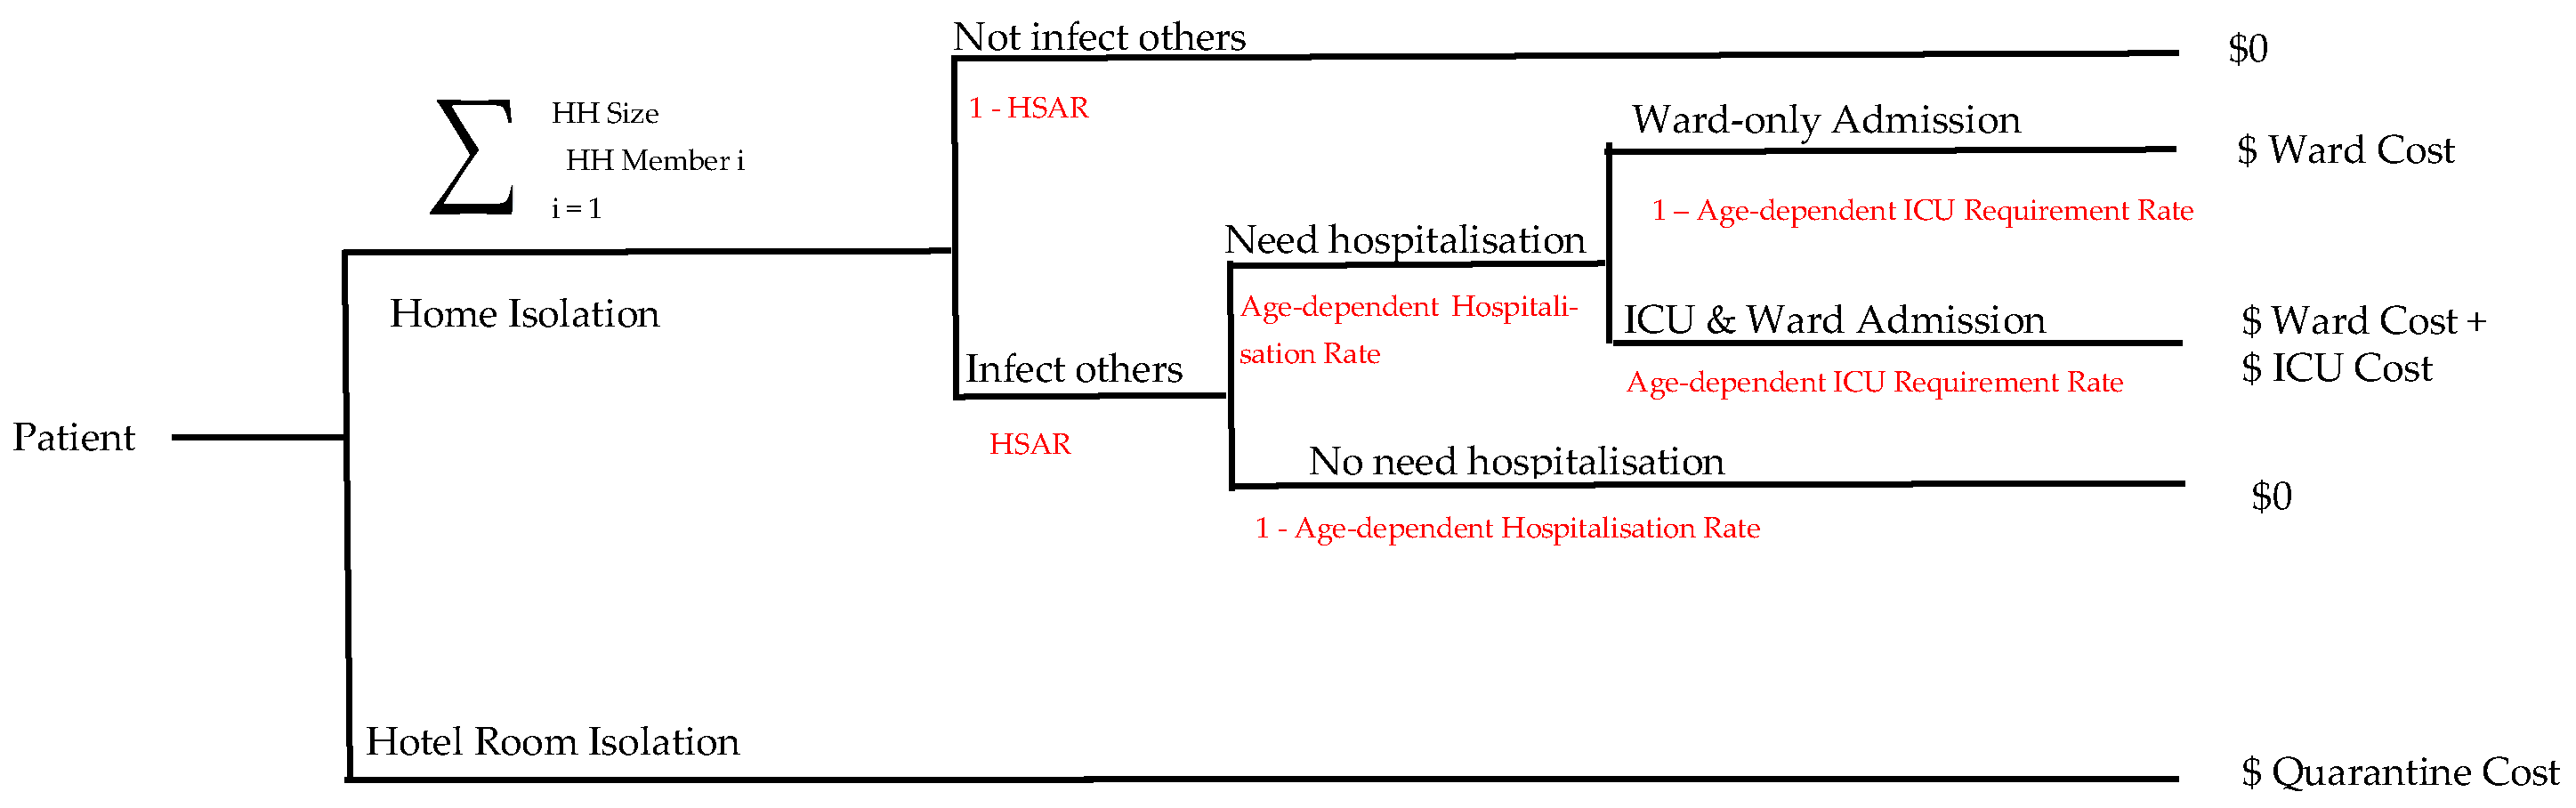
3.1. Decision Tree Model for Cost-Effectiveness Analysis

Isolating a patient who does not show critical or severe symptoms helps reduce transmission and contain the COVID-19 pandemic. There are two main strategies used to isolate COVID-19 patients with mild symptoms: isolating in the home that the patient may be sharing with other household members or isolating the patient in a hotel room to prevent the patient’s interaction with other householders. A decision tree model is used to compare the cost of these alternatives and provide insightful recommendations for policy makers and government members regarding the most cost-effective way to isolate a COVID-19 patient. The model begins with a COVID-19 patient who needs to be isolated (Figure 1). We have designed an expandable decision tree to efficiently incorporate the size of a patient’s household and the age distribution of household members. Depending on the number of other individuals living in the household to which a case zero belongs, therefore, the upper branch of the decision tree will be repeated. This will allow us to integrate the age-dependent hospitalisation and ICU bed requirement rates for each housemate.
Several assumptions have been made to simplify the decision tree and provide an estimation of costs of both alternatives. First, gender and comorbidities of household members are considered irrelevant at this stage of analysis. Second, the household secondary attack rate is assumed fixed regardless of the household size, and infections beyond the secondary attack are disregarded for the simplicity of the model. Third, cases involving contact with hotel staff members would be excluded because they are assumed not to transmit the disease. Fourth, other costs of subsequent cases are not included, such as public health investigation and assessment of secondary cases. Fifth, because close contact household members only begin their 14-day isolation after the case in their household has recovered and been released from isolation, removing a case may allow a contact to return to work one or two weeks earlier. Finally, the case isolation is assumed to be followed by 100% compliance.
Table 1 summarises the parameters of the decision tree associated with the two scenarios in the decision tree in Figure 1. In the first scenario, the cost of a 14-day quarantine is assumed to be AU$3000 and AU$2520 per person in NSW and WA, respectively. To estimate the total cost of isolation in the second scenario, the HSAR is assumed to be 25.03%, which is the weighted mean of reported HSAR in the literature (Arnedo-Pena et al. 2020; Böhmer et al. 2020; Burke et al. 2020; Cheng et al. 2020; COVID-19 National Incident Room Surveillance Team 2020; Jing et al. 2020; Li et al. 2020; Park et al. 2020; Wang et al. 2020; Zhang et al. 2020). In addition, age-dependent ratios of hospitalisation and ICU requirement are used, which are adopted from a report provided by the Australian Government (2020), which models the impact of COVID-19 in Australia. The length of hospital stay, which includes on-wards care and possibly an ICU bed, is also assumed to be age-dependent (COVID-19 National Incident Room Surveillance Team 2020). The on-ward care costs AU$1800 per night whereas an ICU bed costs AU$5000 per night (Hicks et al. 2019).

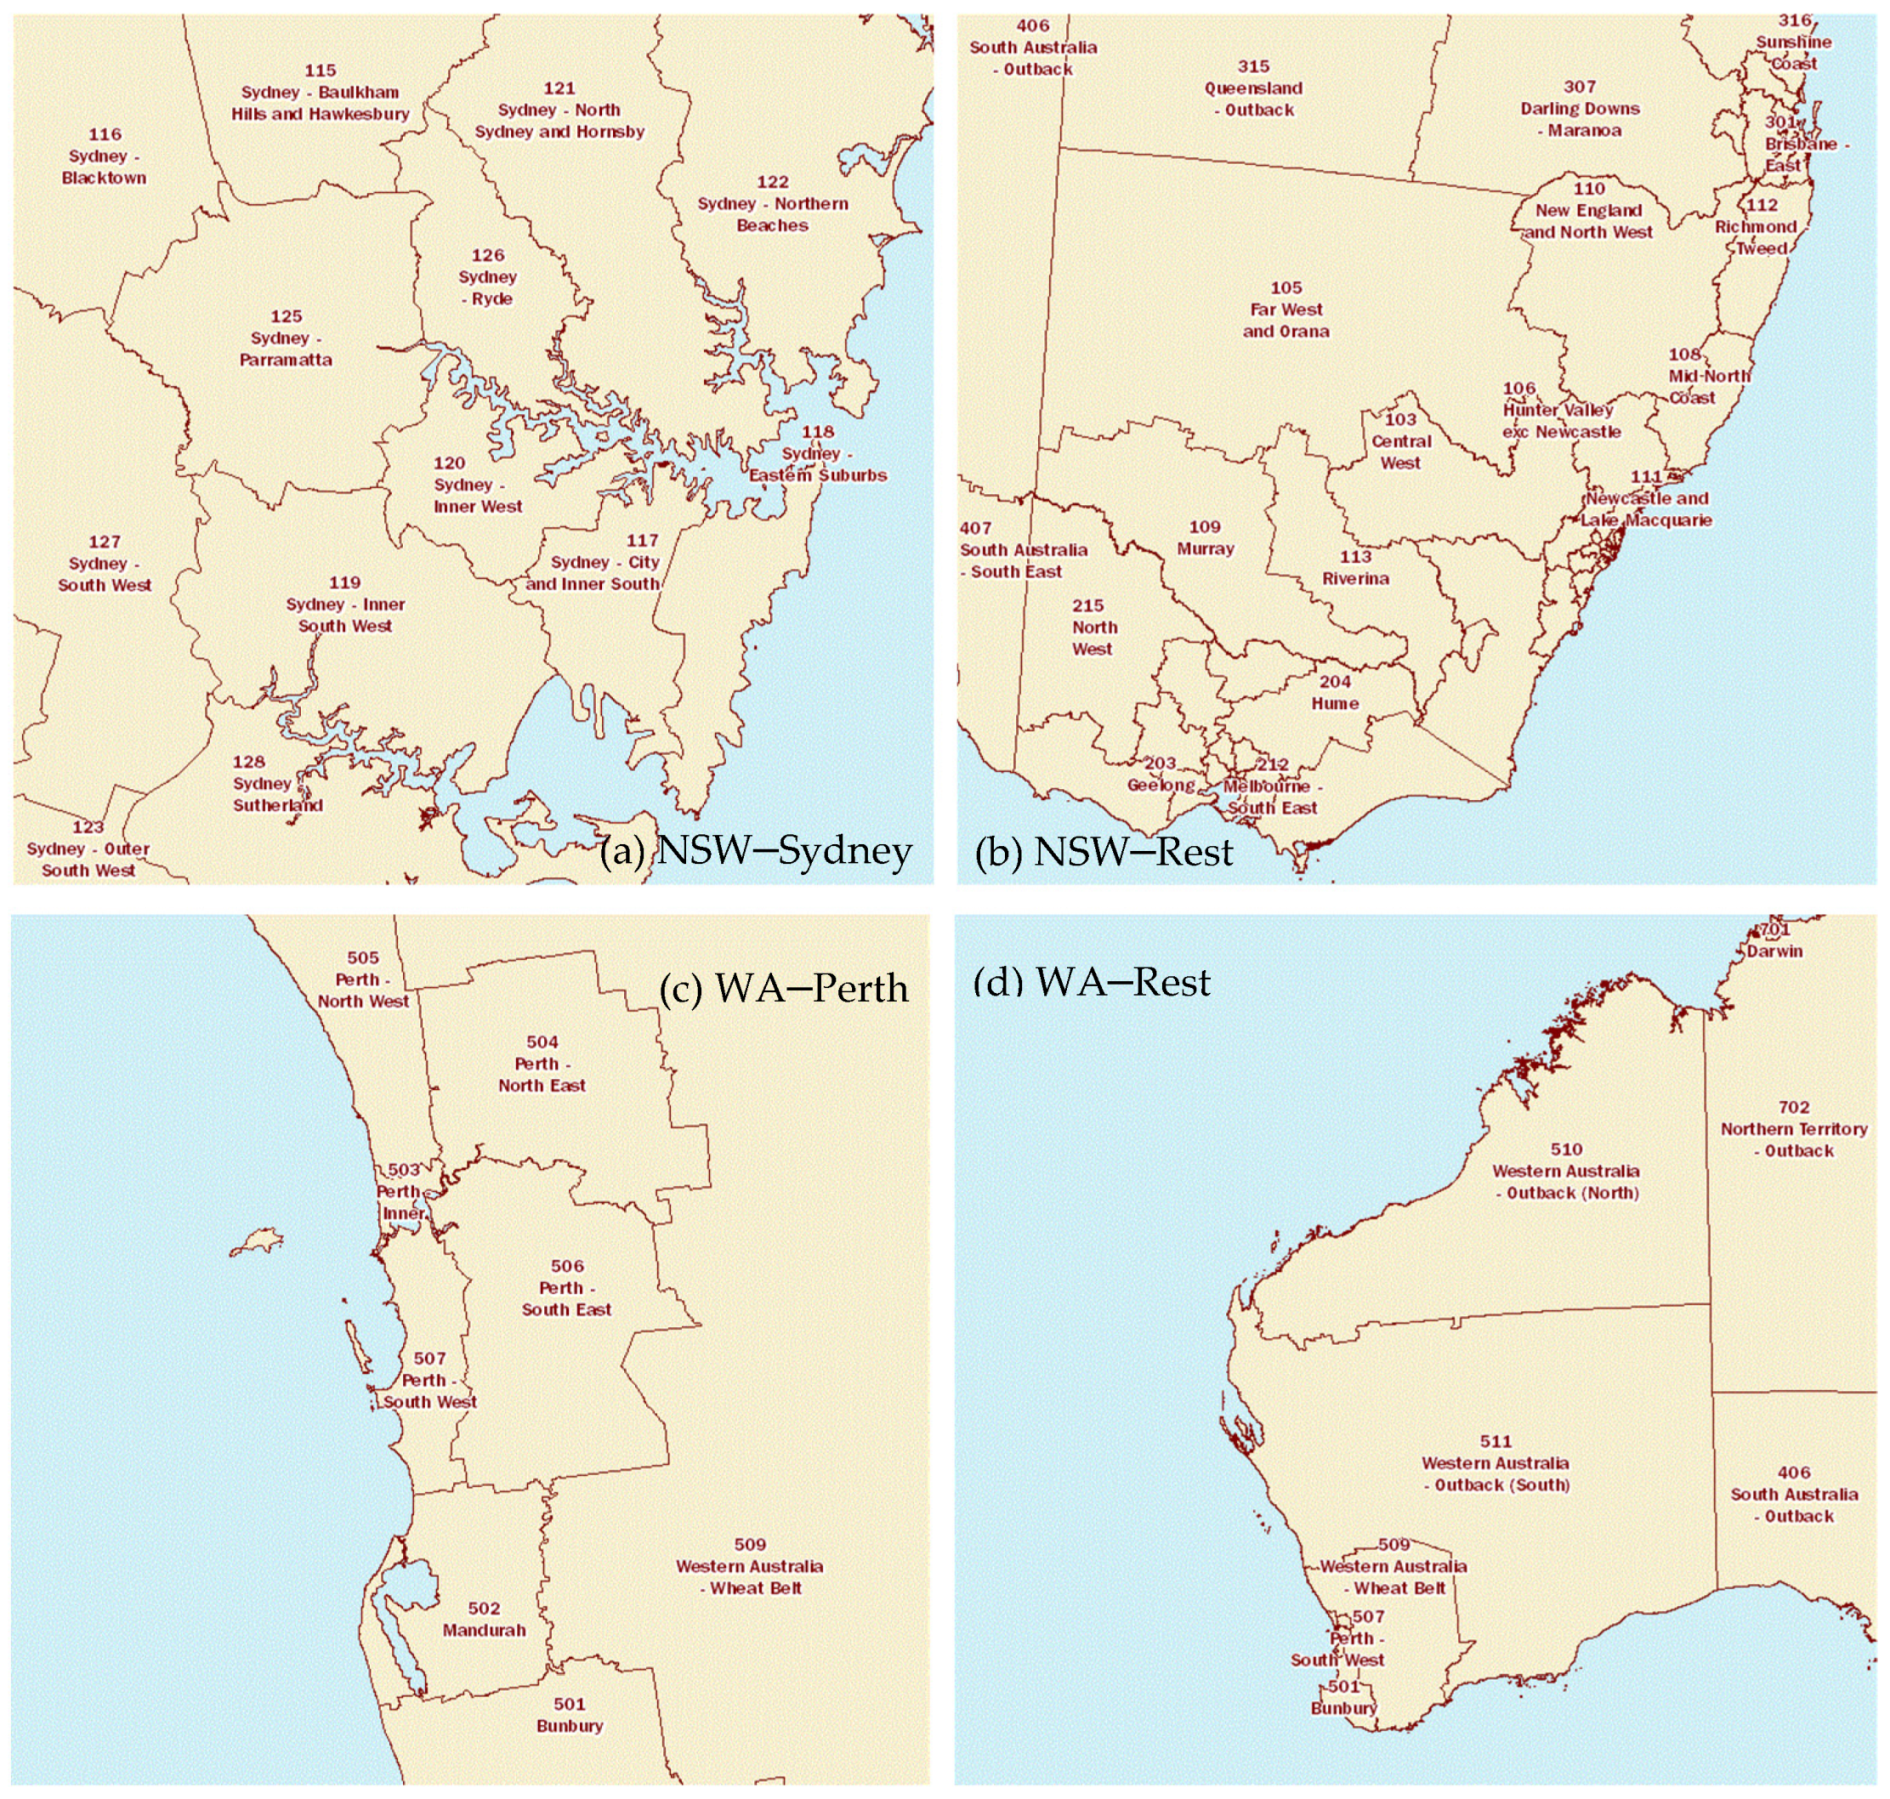
3.2. Simulation Model: Age Distribution of Household Members

To determine the size of and age structure in a patient’s household, we simulated the population of NSW and WA using the model proposed by Geard et al. (2013). This model is individual-based, where individuals of the population are characterised by their age, sex and the household to which they belong. They are also structured by a network of interpersonal ties that maps couple, parent–child and household co-membership relationships. This model allows us to simulate the dynamics of households and derive the age of the household members of a COVID-19 case. To perform further comparisons between urban and regional areas, we divided NSW and WA into two separate regions according to statistical areas level 4 (SA4), to represent high- and low-density regions.
As shown in Figure 2, NSW-Sydney consists of 12 sub-regions, whereas regional NSW (NSW–Rest) includes 14 areas throughout the rest of the state. Similarly, urban WA, WA-Perth, includes five sub-regions, while regional WA (WA–Rest), is divided into four areas. The synthetic populations of the four regions under examination have been created according to data available from Census 2016 by the Australian Bureau of Statistics (Australian Bureau of Statistics 2016) and the simulation runs for four years until 2020. This simulation model involves the following steps.
Initialisation: The simulation process starts with creating an initial ‘bootstrap’ population with ages randomly drawn from a specified age distribution. Then, these individuals are randomly assigned to households with sizes drawn from a specified household size distribution. One or two adults are assigned to the households of size one or two, respectively, while two adults with one or more children are assigned to households of size three or greater. In order to create more realistic initial households, households of size one or two are assigned one or two adults, respectively, whilst households of size three or greater are assigned two adults and one or more children.
Updating: Throughout the simulation, the state of population is updated on a daily basis using the parameters associated with the demographic events which can happen to an individual. These events include: death, for which age- and sex-specific yearly mortality rates are used to determine the probability of death of an individual at a point of time; birth, for which age-specific fertility rates are used to determine the probability of giving birth to a new individual at a point of time; couple formation which is the fixed probability per time unit of forming a new couple by an individual within a given age range who is currently single; couple dissolution, that is the fixed probability per time unit of dissolving the couple by a coupled individual within a given age range; and leaving home, that is the fixed probability per unit time of leaving the parental home to form a new single person household.
Table 2 summarises the parameters used in the simulation model for the four regions. We encourage reference to Geard et al. (2013) for a detailed explanation of the simulation model.1 All parameters that were not publicly available at the state- or national-level were taken from Geard et al. (2013).

4. Results and Discussion

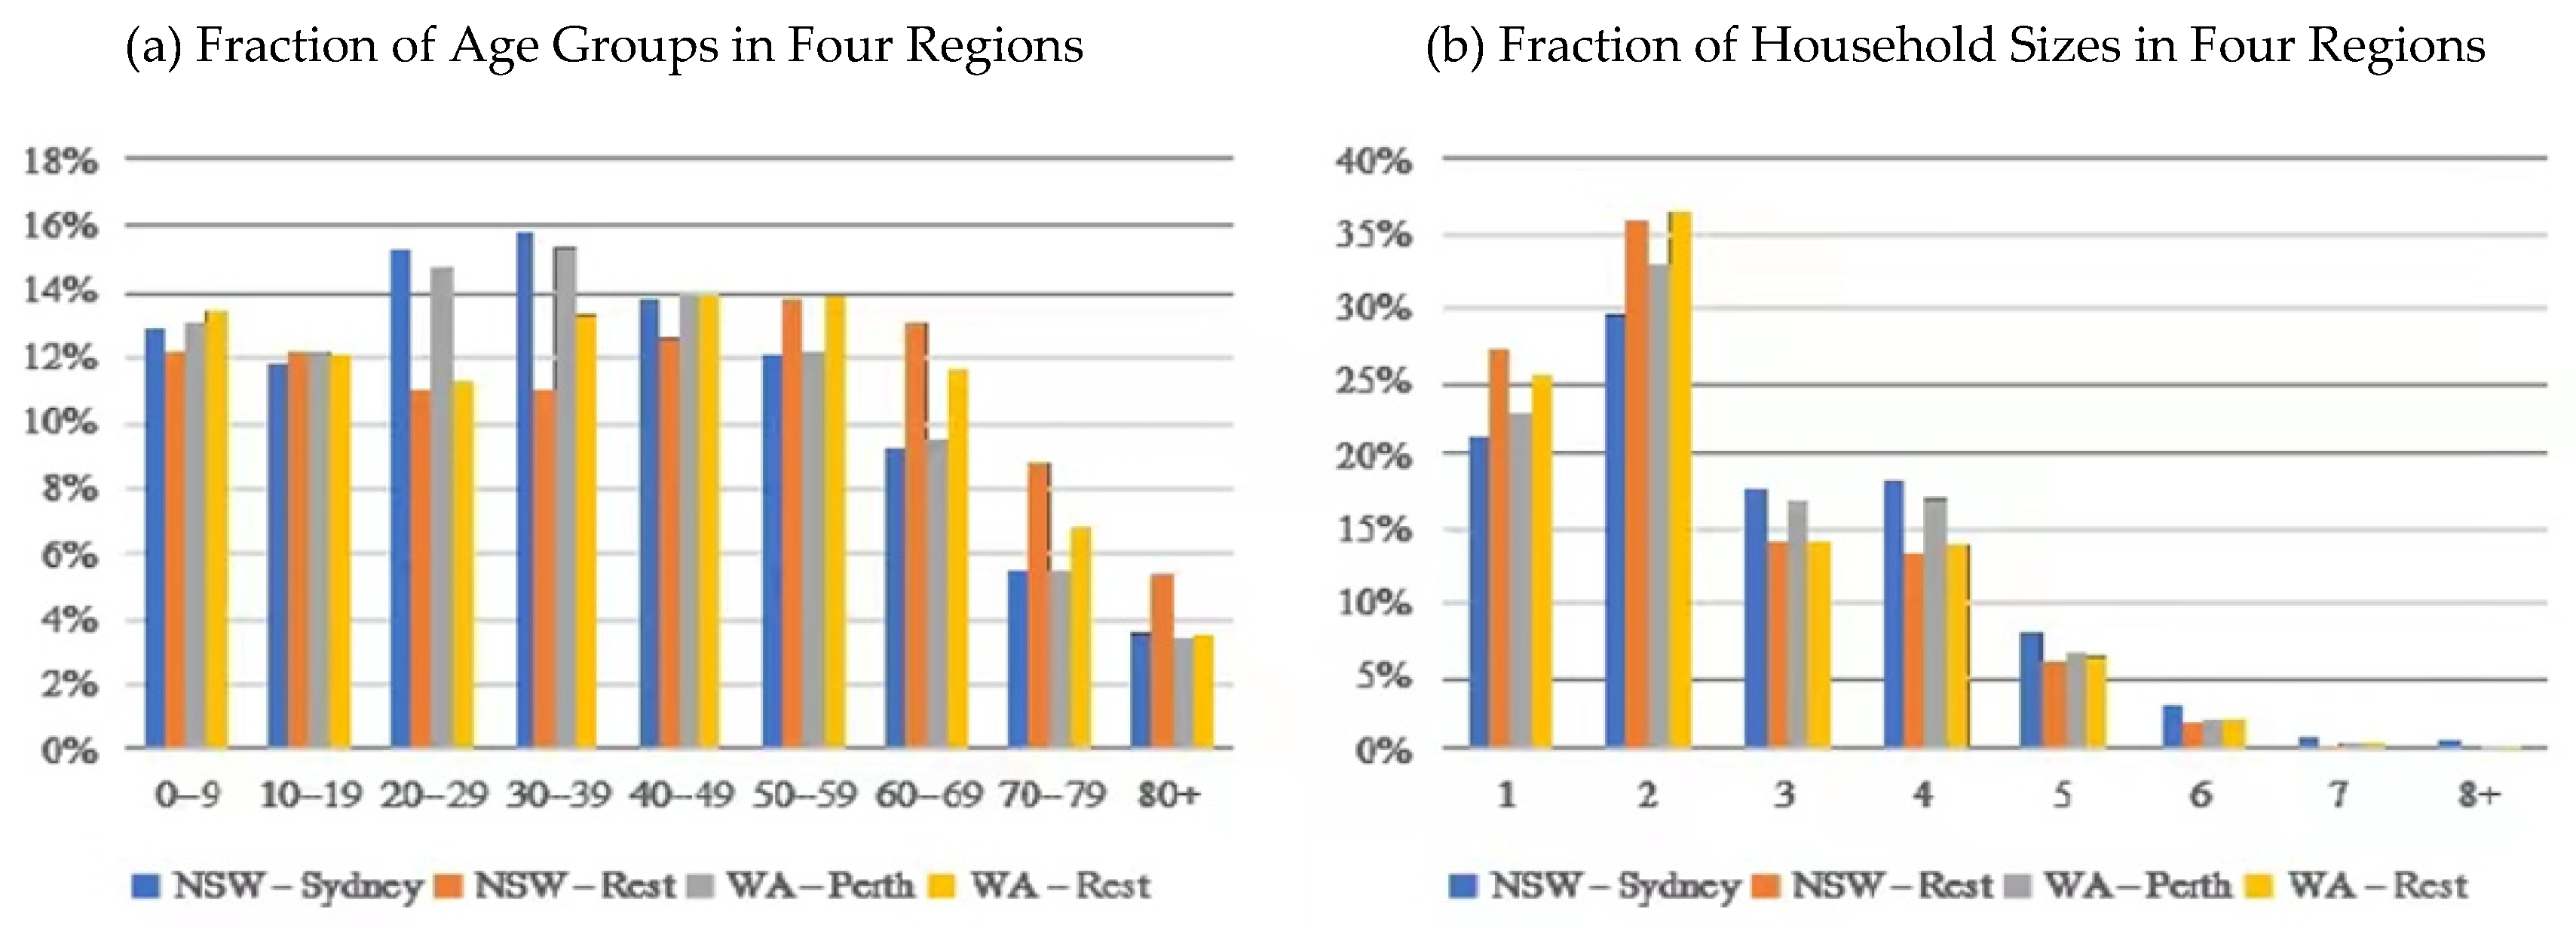
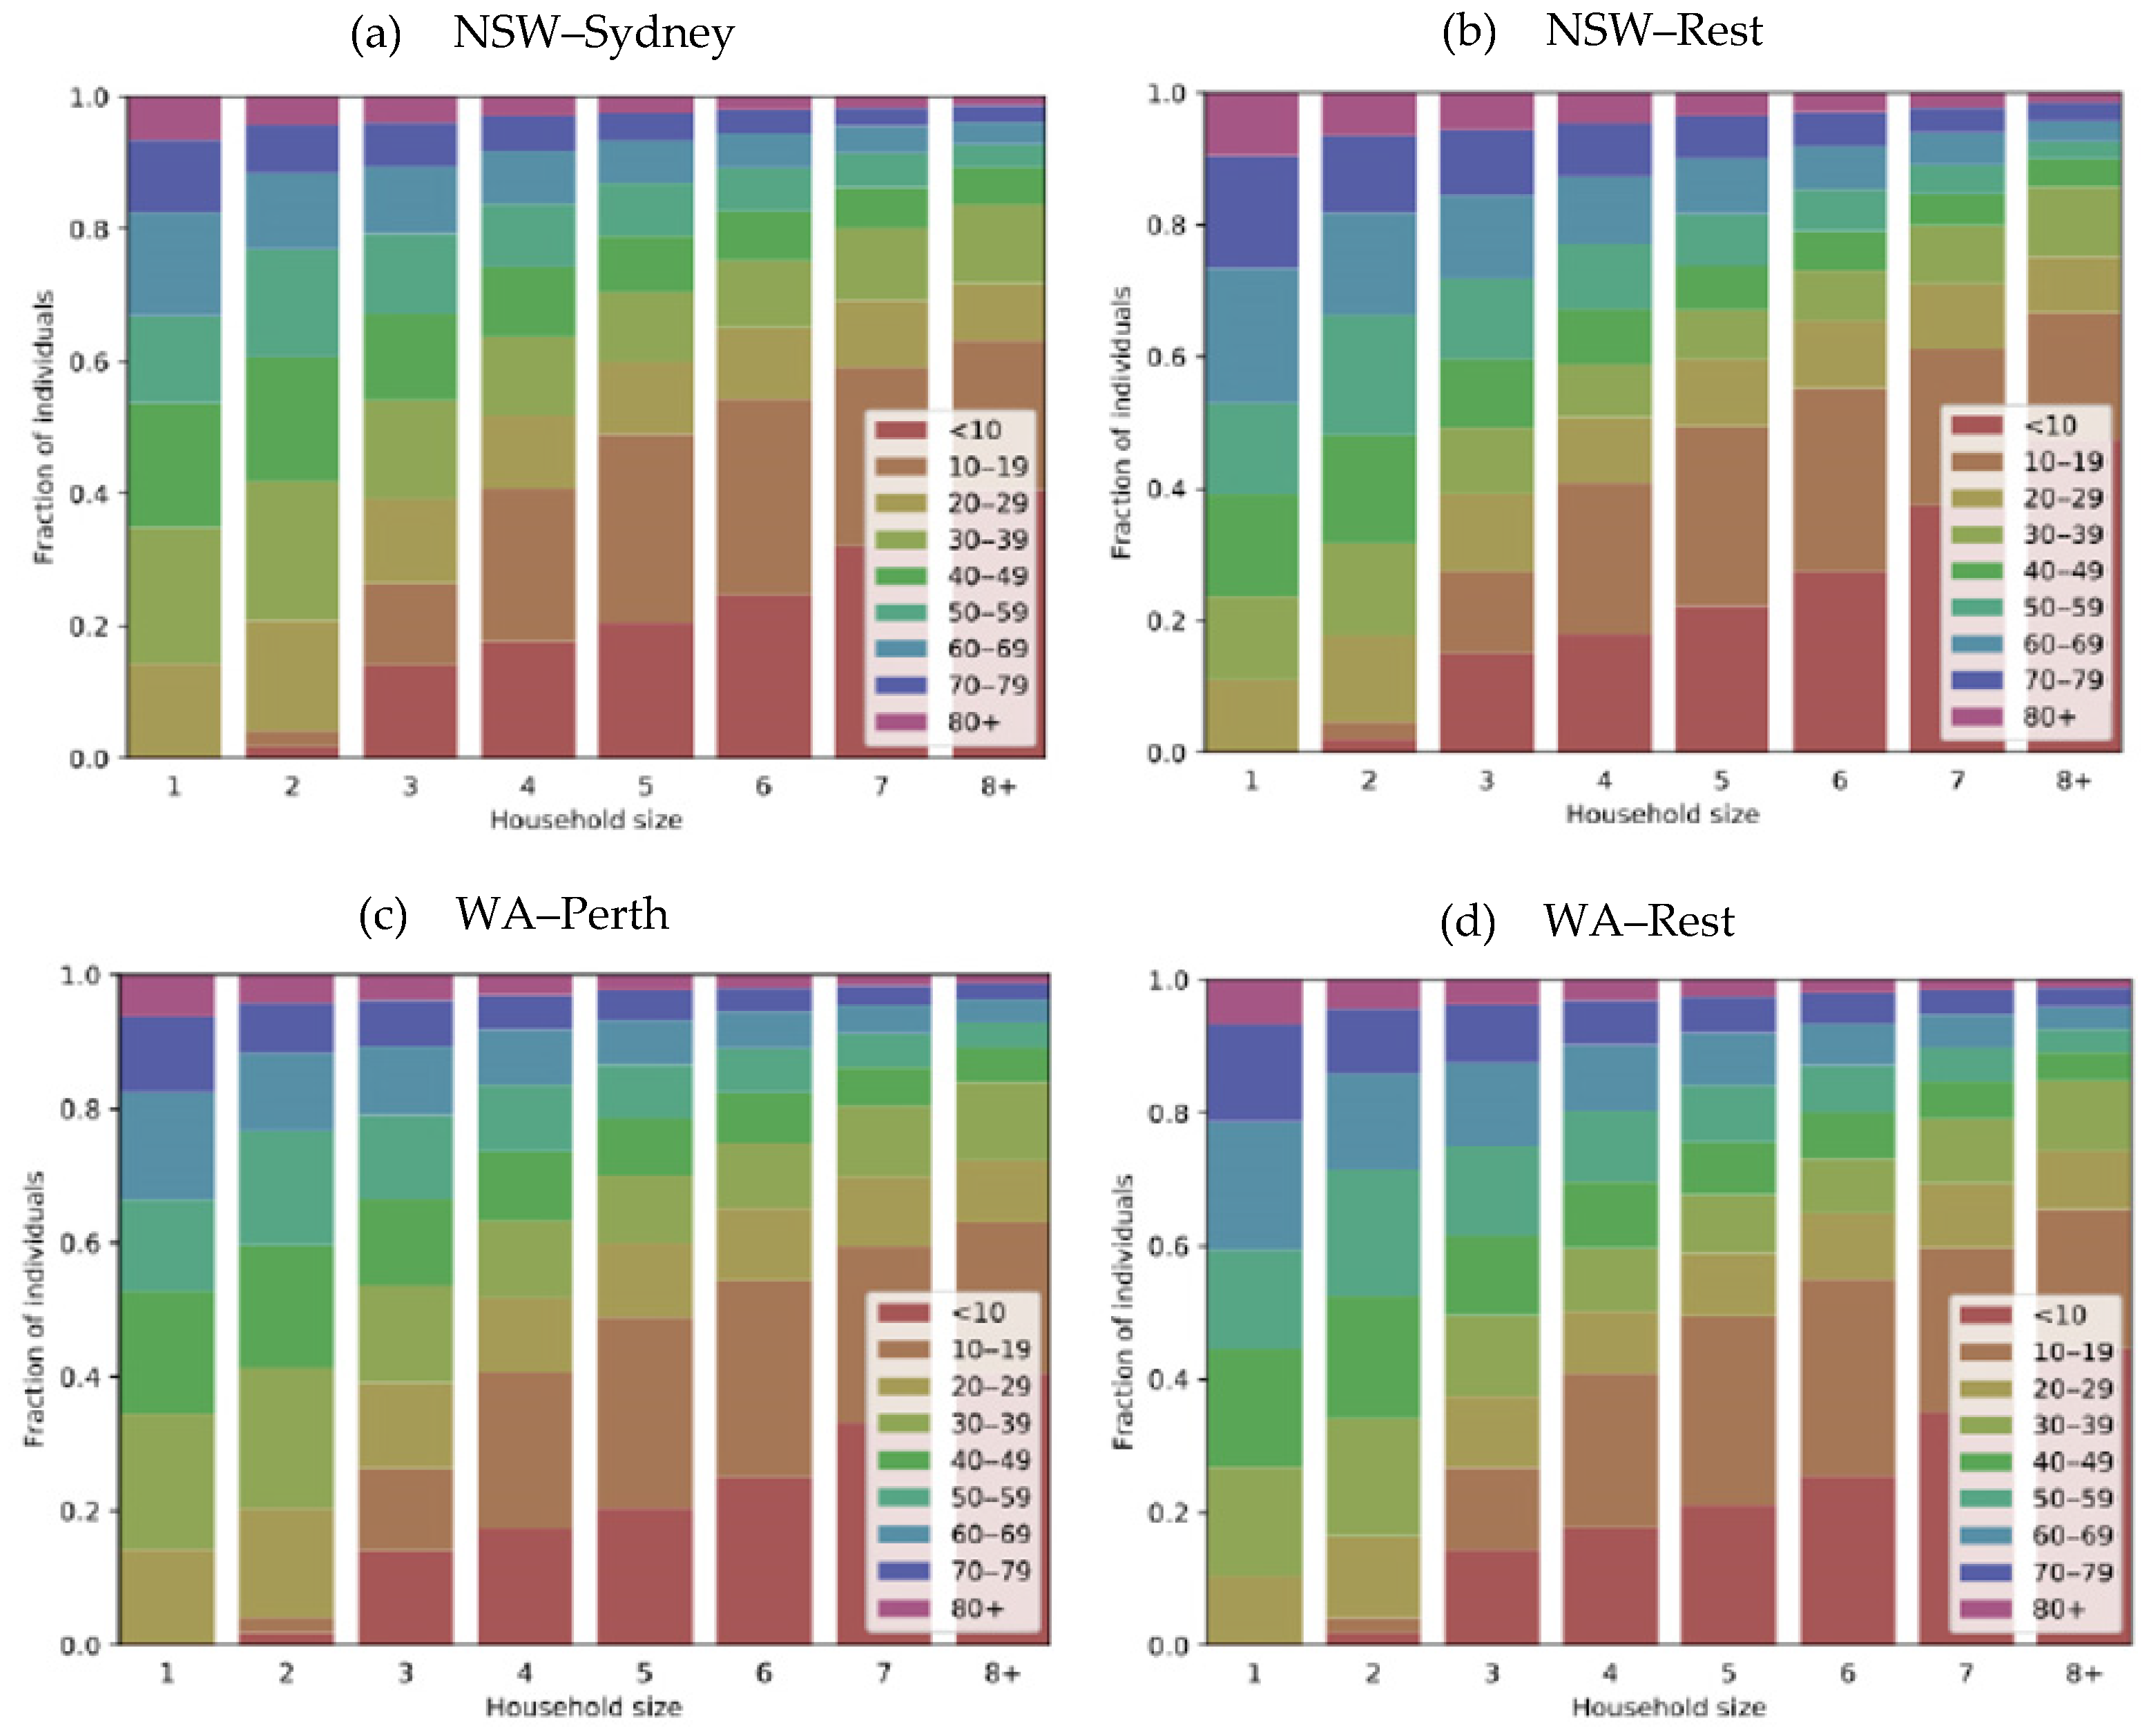
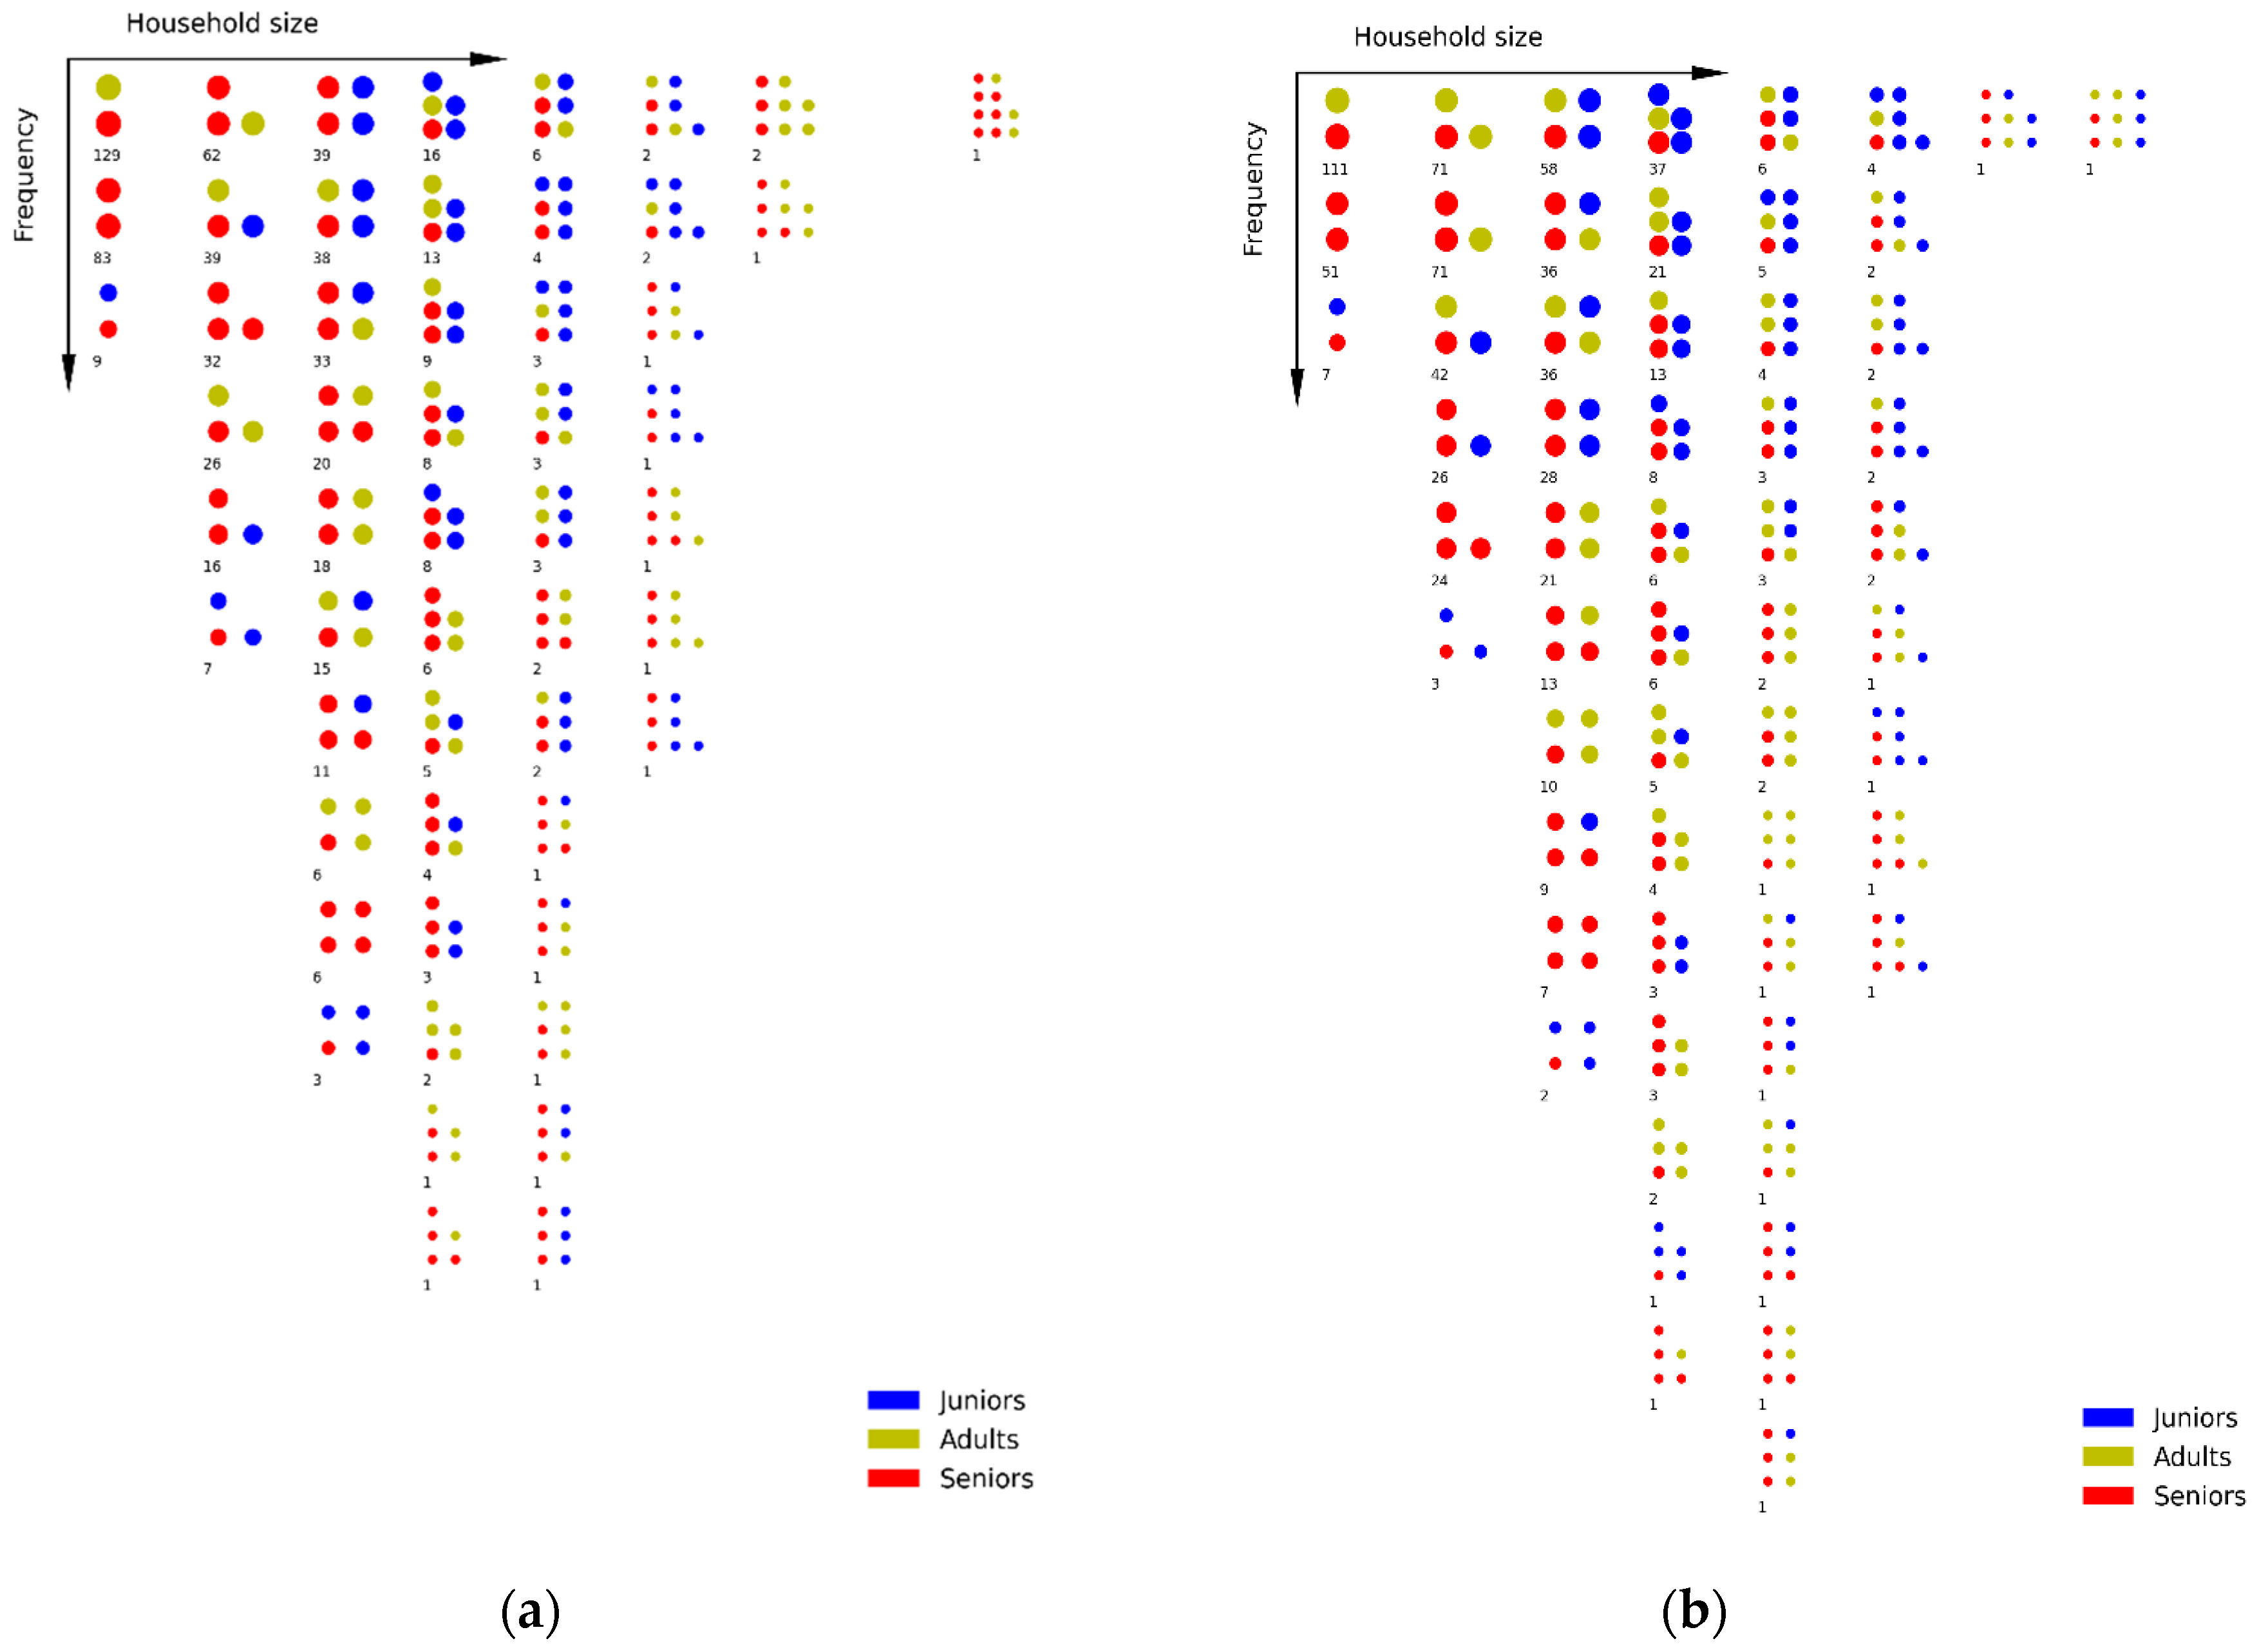
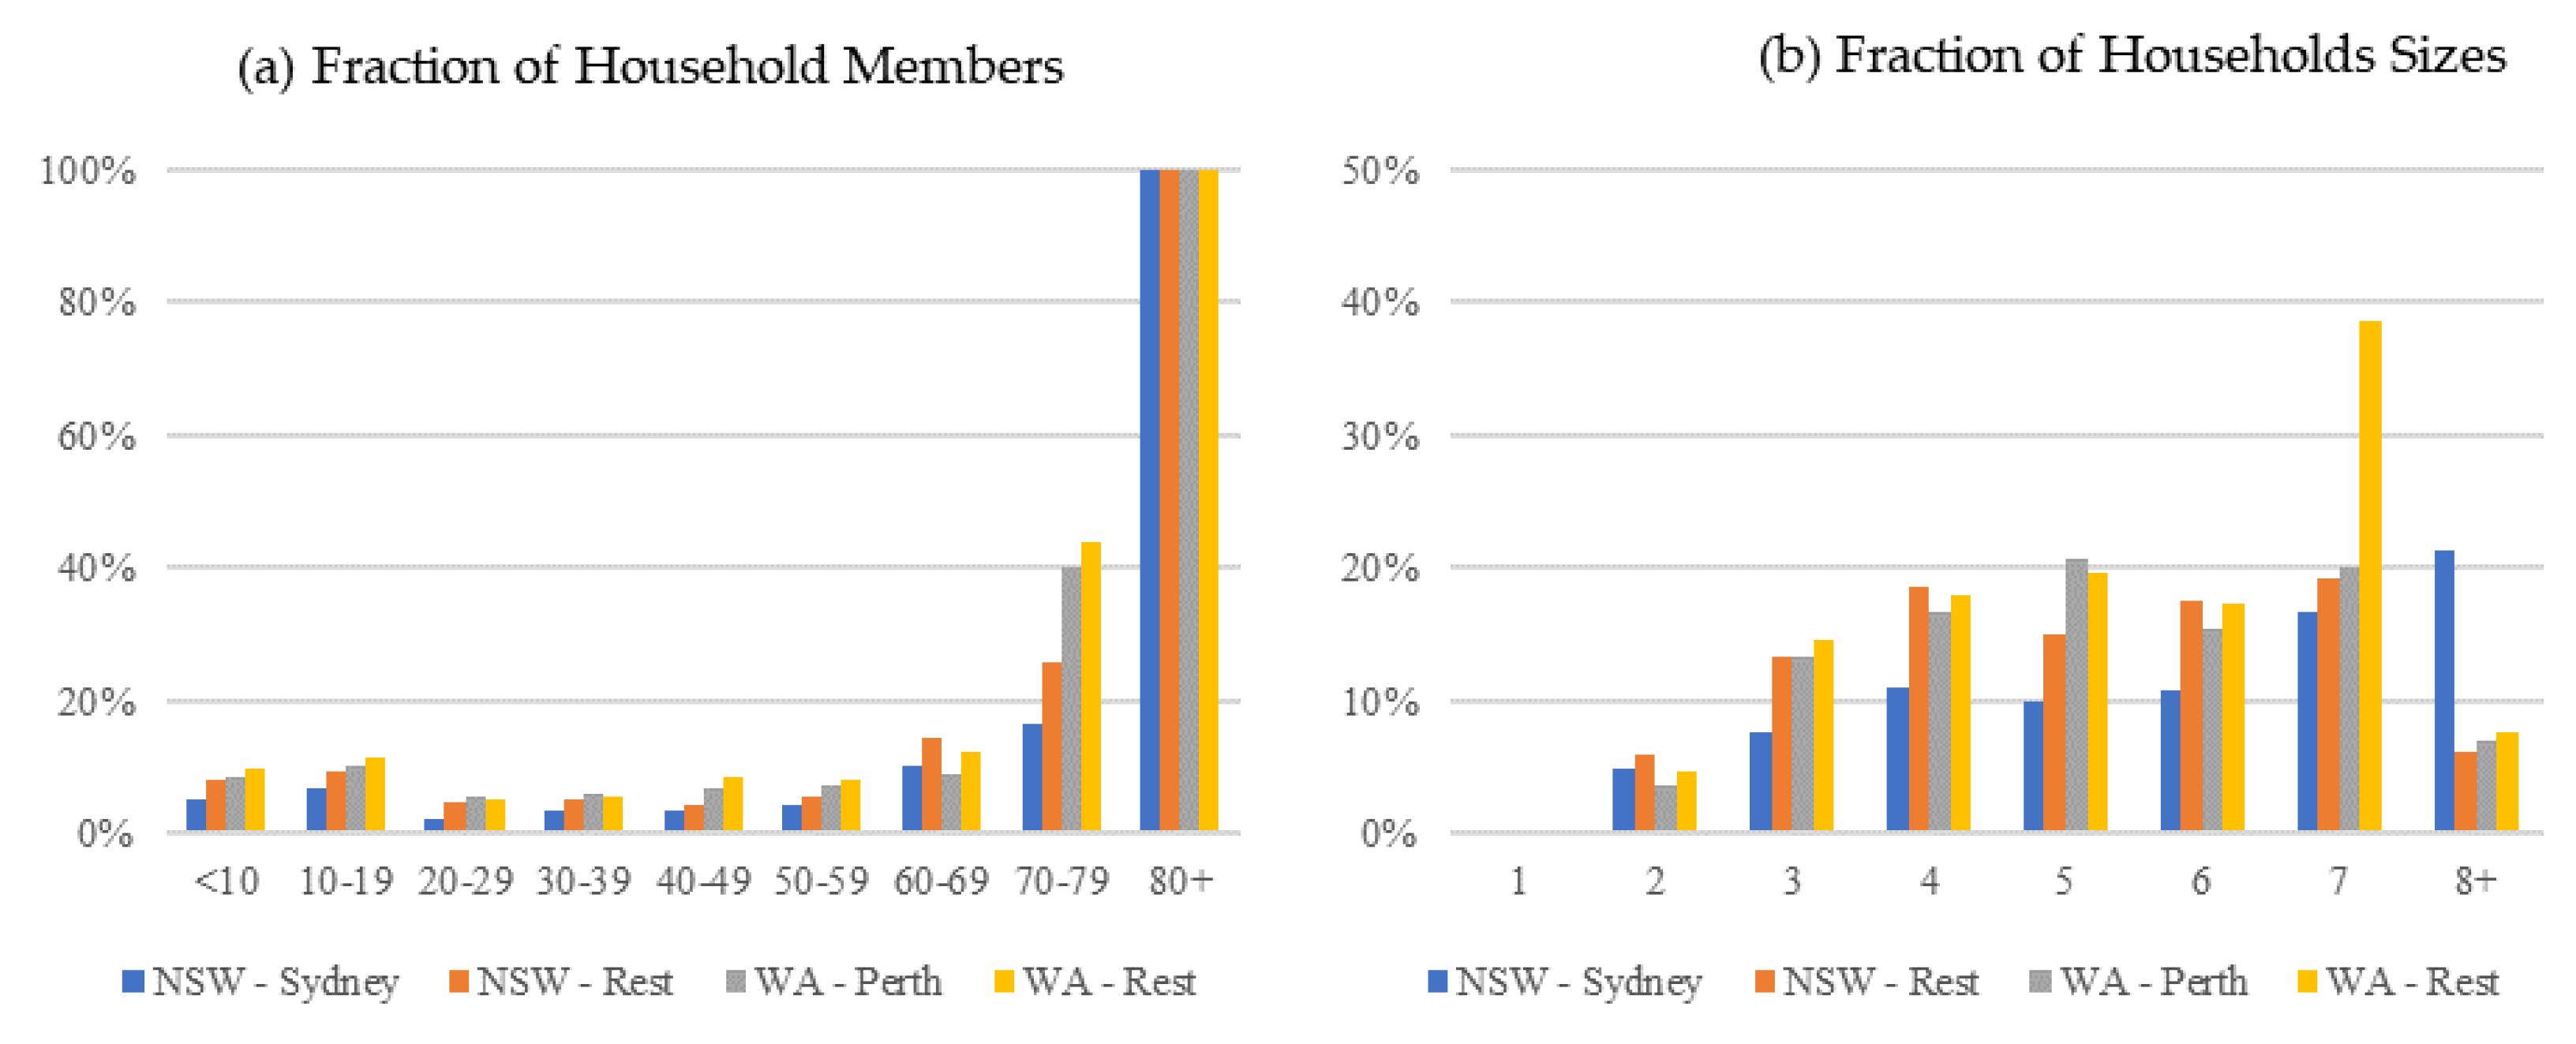
4.1. Simulated Households

Figure 3 demonstrates the age distribution of populations and the household size distribution of four regions, NSW–Sydney, NSW–Rest, WA–Perth and WA–Rest, according to the 2016 Census (Australian Bureau of Statistics 2016). It is obvious that the regional areas of both NSW and WA have older populations: individuals with age greater than 50 comprise a higher fraction of the population than in urban areas. Conversely, individual and couple households are more frequent in regional areas than in urban areas of the two states. This means that these areas will have higher numbers of small households with higher frequencies of elderly individuals living together, which ultimately have higher risks of hospitalisation and ICU facilities in the case of infection.
After running the simulation model, as previously explained, we obtained the households and characteristics of individuals (such as their age, sex, and marital status). Figure 4 shows the fraction of individuals of different age groups that are living together in households of different sizes. Although this figure provides no information on the co-occurrence of individuals from different age groups in households, we can still observe the age structure of the households with different sizes. In addition, the smaller households include higher fractions of adults, which means they are more likely to be hospitalised and require an ICU bed if infected, according to the age-dependent hospitalisation rate. However, the larger the household size, the higher the number of younger members.

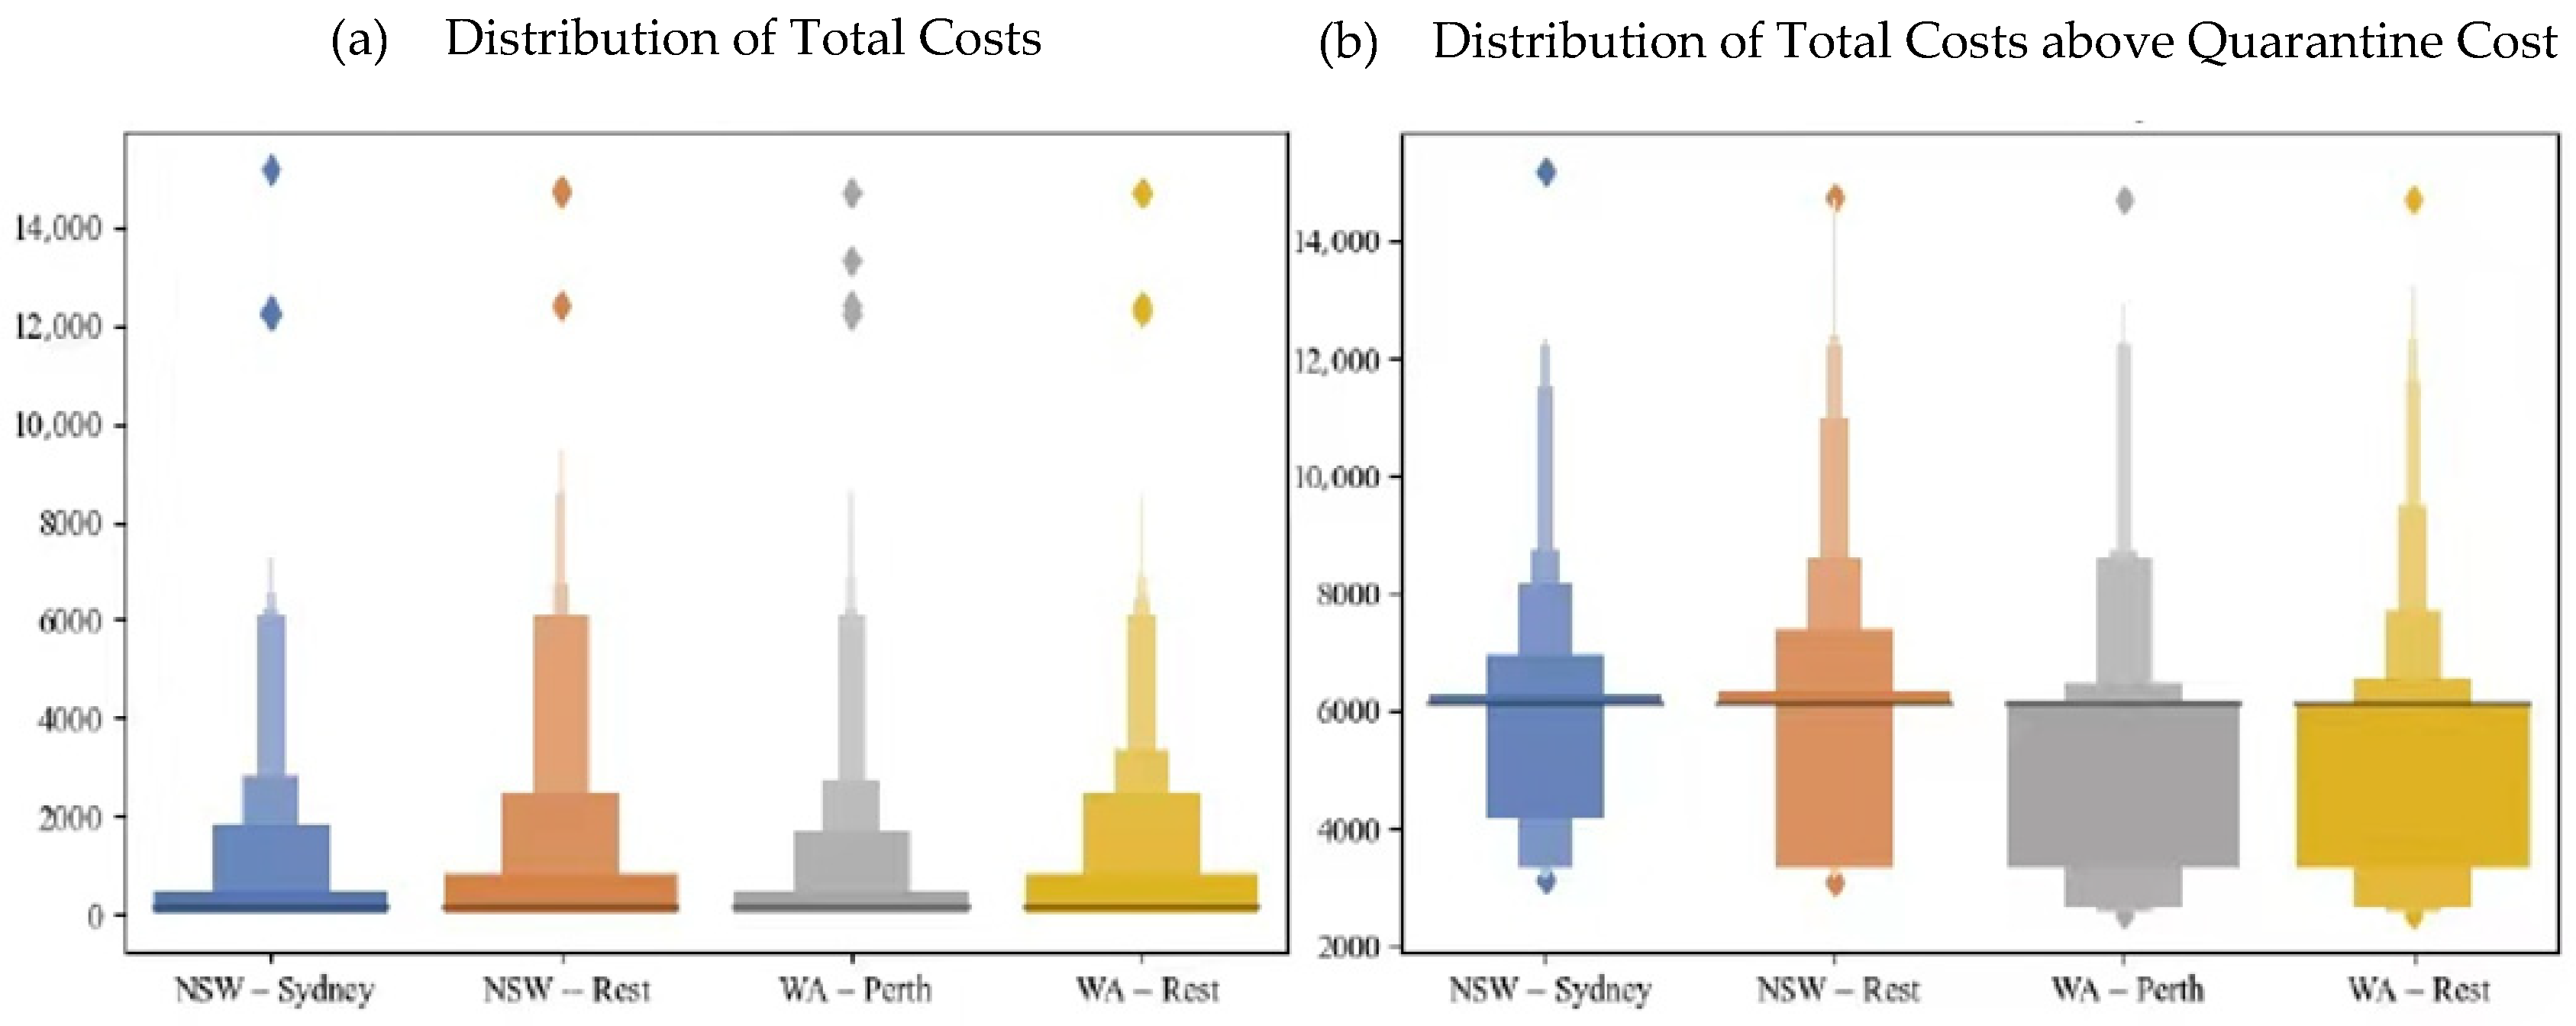
4.2. Estimating the Isolation Cost

After obtaining simulated households, where members’ ages are known, the decision tree (Figure 1) can be applied. When a case is sent into isolation in a hotel room as in Scenario 1, we only consider the cost of a 14-day quarantine in NSW and WA, which is on average AU$3000.00 per person (NSW Government 2020) and AU$2520.00 per person (WA Government 2020), respectively. However, when patient zero is sent to his or her home to practice home quarantine (Scenario 2), there are more factors to consider. The process of estimating the total cost of isolating at home begins with randomly selecting 5000 households, in each of the four regions, that are drawn from the household distribution with the simulated age structures. Then, an adult member is randomly chosen to be patient zero in the households. When calculating the total cost of isolating a confirmed case at home, where other householders may be living with the case zero, we need to consider conditional probabilities as mentioned in Table 1 for all housemates and add them up. These probabilities include the HSAR and age-dependent hospitalisation and ICU bed requirement rates. Table 3 demonstrates the summary statistics of the total cost of home isolation excluding lone-person households, in which the household secondary attack is technically impossible. As we demostrated, the home isolation option, on average, is cheaper than hotel isolation in all four regions. To be specific, the mean total costs of home isolation for multi-person households was AU$892 in NSW-Sydney regions, AU$1216 in NSW-Rest regions, AU$907 in WA-Perth regions and AU$1004 in WA-Rest regions, compared to the costs of 14-days hotel quarantine in NSW and WA, which were on average AU$3000 and AU$2520 per person, respectively. In addition, regional areas have higher total costs than urban areas of both NSW and WA, see Figure 5a. This can be related to the older population of these regional areas, who are at greater risk of needing hospitalisation and intensive care (COVID-19 National Incident Room Surveillance Team 2020). Figure 5b, moreover, shows the distribution of total costs of the home isolation option, when it is greater than the states’ quarantine cost. In this instance, urban areas show an almost identical distribution of expected costs for home isolation to regional areas.
To further investigate more costly households, which are the most vulnerable both from financial and medical points of view, we separately examined households with a total expected cost of home isolation greater than the states’ hotel quarantine costs. Figure 6 summarises the results of these more costly households. In order to make the plot clearer, individuals were re-categorised into three age groups: juniors (aged below 20 years), adults (aged between 20 and 59 years) and seniors (aged 60 or more). Out of 7927 and 7831 non-lone households, 709 and 789 households with an average size of 3.39 and 3.61 demonstrate expected costs of home isolation greater than the cost of hotel quarantine in NSW and WA, respectively. Not surprisingly, the households with adult and senior individuals have higher expected costs of home isolation than the hotel quarantine cost. Figure 7a confirms that senior members are frequently in households where the cost of home isolation is higher than the hotel quarantine cost, and all elderly individuals (aged above 80) are present in these households. Conversely, Figure 7b demonstrates that a higher fraction of larger households has expected costs of home isolation greater than the hotel quarantine costs announced by NSW and WA. The difference becomes even greater in the areas with lower population density. This is almost certainly because of the prevalence of smaller households in urban areas with high density, where individuals share a dwellings together.
Comparing NSW and WA, the results show identical trends in both states. Generally, the quarantine costs in NSW are higher than in WA, but the differences are not significant. Moreover, the results showed that generally the costs of home quarantine were lower than a hotel quarantine in both states (Table 3). In addition, under the home quarantine, the costs for households in rural areas were higher than households in urban regions in both states as well. Moreover, under the circumstances that the ages of household members are old or the household size is big, the expected home quarantine costs were higher than the costs of hotel quarantine in both NSW and WA.
In summary, these findings suggest that decision makers should consider the ages of household members and the household size when deciding whether to isolate a COVID-19 patient at home.
In addition to factors directly related to costs, governments should consider the benefit of preventing hospitals with limited facilities and ICU beds from being overwhelmed. Increased stress on the health system leads to a deterioration in the standard of patient care, with possible increased fatality rates leading to significant societal costs (Ji et al. 2020).

5. Conclusions

Many countries now practice the isolation of cases and contacts as an effective measure for containing COVID-19, which has a reproduction number greater than two. However, the effectiveness of this measure varies across different countries depending on several factors including the costs incurred. In order to prevent further costs associated with isolating cases in their homes, these individuals can be offered a hotel room, limiting their contacts with other household members. In our study, we performed a cost-effective analysis using a decision tree and calculated the comparative costs of isolating patients in their home versus in a hotel room. Given the probability of secondary household infection rate, and age-dependent hospitalisation rates, as well as the ratio of patients who require ICU beds, and the length of hospital stay, we have calculated the expected cost of isolating a patient at home. We found that the average expected cost of isolating a patient at home is relatively lower compared to the cost of hotel quarantine announced by NSW and WA. However, this cost significantly increases when there are seniors sharing the house with the patient zero, and hotel isolation may be a cost-saving measure in the context of large families, boarding houses and other group living situations.
Our study, first, expands the understanding of the cost-effectiveness to quarantine a COVID-19 patient. Costs associated with the potential risk of infection within the patient’s household are also taken into account when considering the home quarantine option. Due to the high HSAR of the COVID-19, the household members of patient zero are at high risk of infection, once infected, may incur additional costs including ward cost and ICU cost. This makes the cost-effectiveness analysis between home quarantine and hotel quarantine more comprehensive. Second, our study defines the possible scope of the selection of quarantine measures based on the cost-effectiveness analysis. Generally, it is cheaper to quarantine the patient at home in both NSW and WA than in the hotel. However, if the ages of household members are old or the household size is large, the expected cost of home isolation is greater than the hotel quarantine cost. Adults and seniors are more likely to be infected and have a relatively high rate of hospitalisation and ICU beds need which may incur additional costs. In addition, the large household size of patient zero brings members into close contact, leading to a high risk of transmission within the household, which increases the risks of potential costs. Third, our study provides the Australian government and policymakers with practical insight into COVID-19 patient quarantine decision-making from the cost-effectiveness perspective. We recommend the government and policymakers to take into account the household structures, the ages of household members and household density when formulating scientific quarantine policies, to guide people to better choose and implement quarantine measures based on their household situations both cost- and medical-effectively.
This study is unable to determine a more precise classification standard to make a clear distinction as to in which case home isolation is preferable or hotel isolation is preferable from the cost-effectiveness perspective. Future studies on this point could be conducted. Additionally, while cultural and social conditions will vary from country to country, the household characteristics we investigated here will be relevant in public health management elsewhere—now and in the future.

Author Contributions

Conceptualization, A.M., D.L., N.M. and F.P.; methodology, A.M., D.L., N.M. and F.P.; formal analysis, N.M.; investigation, N.M.; writing—original draft preparation, N.M.; writing—review and editing, A.M., D.L., N.M., Y.L. and F.P.; supervision, A.M. and F.P.; project administration, A.M. and F.P.; funding acquisition, Y.L. All authors have read and agreed to the published version of the manuscript.

Funding

This research received no external funding.

Institutional Review Board Statement

Not applicable

Informed Consent Statement

Not applicable

Data Availability Statement

The data presented in this study are available on request from the corresponding author.

Acknowledgments

All authors are grateful to editors for their time and assistance on relevant work of manuscript submission, revision, acceptance, proofreading and publication. Additionally, we strongly appreciate reviewers who provide constructive suggestions that inspire our ideas and improve the article.

Conflicts of Interest

The authors declare no conflict of interest.

Notes

1
The Python program of the simulation model can be accessed from https://github.com/nicgeard/sim-demog (accessed on 16 July 2020).
2
There is no household infection within the individual households.

References

  1. Al Zobbi, Mohammed, Belal Alsinglawi, Omar Mubin, and Fady Alnajjar. 2020. Measurement Method for Evaluating the Lockdown Policies during the COVID-19 Pandemic. International Journal of Environmental Research and Public Health 17: 5574. [Google Scholar] [CrossRef]
  2. Arnedo-Pena, Alberto, Susana Sabater-Vidal, Noemí Meseguer-Ferrer, Mª Rosario Pac-Sa, Pilar Mañes-Flor, Juan Carlos Gascó-Laborda, Rosa Mª Larrea, Mª Dolores Tirado-Balaguer, MA Romeu-García, and María Gil-Fortuño. 2020. COVID-19 secondary attack rate and risk factors in household contacts in Castellon (Spain): Preliminary report. Enfermedades Emergentes 19: 64–70. [Google Scholar]
  3. Australian Bureau of Statistics. 2016. Census 2016 by Statistical Area SA2+ (ASGS 2016). Available online: http://stat.data.abs.gov.au/Index.aspx?DataSetCode=ABS_C16_T01_SA (accessed on 16 July 2020).
  4. Australian Government. 2020. Impact of COVID-19: Theoretical Modelling of How the Health System Can Respond. Available online: https://www.pm.gov.au/sites/default/files/files/covid19-icu-modelling-summary.pdf (accessed on 16 July 2020).
  5. Australian Government Department of Health. 2020. Novel Coronavirus (COVID-19): Information for Clinicians. Available online: https://www.health.gov.au/sites/default/files/documents/2020/03/coronavirus-covid-19-information-for-clinicians.pdf (accessed on 16 July 2020).
  6. Bai, Yan, Lingsheng Yao, Tao Wei, Fei Tian, Dong-Yan Jin, Lijuan Chen, and Meiyun Wang. 2020. Presumed asymptomatic carrier transmission of COVID-19. JAMA 323: 1406–7. [Google Scholar] [CrossRef] [Green Version]
  7. Bodas, Moran, and Kobi Peleg. 2020. Self-Isolation Compliance In The COVID-19 Era Influenced By Compensation: Findings from a recent survey in Israel: Public attitudes toward the COVID-19 outbreak and self-isolation: A cross sectional study of the adult population of Israel. Health Affairs 39: 936–41. [Google Scholar] [CrossRef] [PubMed] [Green Version]
  8. Böhmer, Merle M., Udo Buchholz, Victor M. Corman, Martin Hoch, Katharina Katz, Durdica V. Marosevic, Stefanie Böhm, Tom Woudenberg, Nikolaus Ackermann, and Regina Konrad. 2020. Investigation of a COVID-19 outbreak in Germany resulting from a single travel-associated primary case: A case series. The Lancet Infectious Diseases 20: 920–28. [Google Scholar] [CrossRef]
  9. Burke, Rachel M., Claire M. Midgley, Alissa Dratch, Marty Fenstersheib, Thomas Haupt, Michelle Holshue, Isaac Ghinai, M. Claire Jarashow, Jennifer Lo, and Tristan D. McPherson. 2020. Active monitoring of persons exposed to patients with confirmed COVID-19—United States, January–February 2020. Morbidity and Mortality Weekly Report 69: 245. [Google Scholar] [CrossRef] [Green Version]
  10. Cheng, Hao-Yuan, Shu-Wan Jian, Ding-Ping Liu, Ta-Chou Ng, Wan-Ting Huang, and Hsien-Ho Lin. 2020. Contact tracing assessment of COVID-19 transmission dynamics in Taiwan and risk at different exposure periods before and after symptom onset. JAMA Internal Medicine 180: 1156–63. [Google Scholar] [CrossRef] [PubMed]
  11. COVID-19 National Incident Room Surveillance Team. 2020. COVID-19, Australia: Epidemiology Report 20: Fortnightly Reporting Period Ending 5 July 2020. Communicable Diseases Intelligence 44: 1–31. [Google Scholar] [CrossRef]
  12. De Wit, Emmie, Neeltje Van Doremalen, Darryl Falzarano, and Vincent J. Munster. 2016. SARS and MERS: Recent insights into emerging coronaviruses. Nature Reviews Microbiology 14: 523. [Google Scholar] [CrossRef]
  13. Dickens, Borame L., Joel R. Koo, Annelies Wilder-Smith, and Alex R. Cook. 2020. Institutional, not home-based, isolation could contain the COVID-19 outbreak. The Lancet 395: 1541–42. [Google Scholar] [CrossRef]
  14. Ferguson, Neil, Daniel Laydon, Gemma Nedjati-Gilani, Natsuko Imai, Kylie Ainslie, Marc Baguelin, Sangeeta Bhatia, Adhiratha Boonyasiri, Zulma M. Cucunubá, Gina Cuomo-Dannenburg, and et al. 2020. Impact of non-pharmaceutical interventions (NPIs) to reduce COVID-19 mortality and healthcare demand. Imperial College London. [Google Scholar] [CrossRef]
  15. Gao, Zan, Jung Eun Lee, Daniel J. McDonough, and Callie Albers. 2020. Virtual Reality Exercise as a Coping Strategy for Health and Wellness Promotion in Older Adults during the COVID-19 Pandemic. Journal of Clinical Medicine 9: 1986. [Google Scholar] [CrossRef]
  16. Geard, Nicholas, James M. McCaw, Alan Dorin, Kevin B. Korb, and Jodie McVernon. 2013. Synthetic population dynamics: A model of household demography. Journal of Artificial Societies and Social Simulation 16: 8. [Google Scholar] [CrossRef]
  17. Gudbjartsson, Daniel F., Agnar Helgason, Hakon Jonsson, Olafur T. Magnusson, Pall Melsted, Gudmundur L. Norddahl, Jona Saemundsdottir, Asgeir Sigurdsson, Patrick Sulem, and Arna B. Agustsdottir. 2020. Spread of SARS-CoV-2 in the Icelandic population. New England Journal of Medicine 382: 2302–15. [Google Scholar] [CrossRef]
  18. Gungoraydinoglu, Ali, Ilke Öztekin, and Özde Öztekin. 2021. The Impact of COVID-19 and Its Policy Responses on Local Economy and Health Conditions. Journal of Risk and Financial Management 14: 233. [Google Scholar] [CrossRef]
  19. Hassan, Mohammad Mahmudul, Md Abul Kalam, Shahanaj Shano, Md Raihan Khan Nayem, Md Kaisar Rahman, Shahneaz Ali Khan, and Ariful Islam. 2020. Assessment of Epidemiological Determinants of COVID-19 Pandemic Related to Social and Economic Factors Globally. Journal of Risk and Financial Management 13: 194. [Google Scholar] [CrossRef]
  20. He, Xi, Eric H. Y. Lau, Peng Wu, Xilong Deng, Jian Wang, Xinxin Hao, Yiu Chung Lau, Jessica Y Wong, Yujuan Guan, and Xinghua Tan. 2020. Temporal dynamics in viral shedding and transmissibility of COVID-19. Nature Medicine 26: 672–75. [Google Scholar] [CrossRef] [PubMed] [Green Version]
  21. Hicks, Peter, Sue Huckson, Emma Fenney, Isobel Leggett, David Pilcher, and Edward Litton. 2019. The financial cost of intensive care in Australia: A multicentre registry study. Medical Journal of Australia 211: 324–25. [Google Scholar] [CrossRef] [Green Version]
  22. Ji, Yunpeng, Zhongren Ma, Maikel P. Peppelenbosch, and Qiuwei Pan. 2020. Potential association between COVID-19 mortality and health-care resource availability. The Lancet Global Health 8: e480. [Google Scholar] [CrossRef] [Green Version]
  23. Jing, Qin-Long, Ming-Jin Liu, Zhou-Bin Zhang, Li-Qun Fang, Jun Yuan, An-Ran Zhang, Natalie E. Dean, Lei Luo, Meng-Meng Ma, and Ira Longini. 2020. Household secondary attack rate of COVID-19 and associated determinants in Guangzhou, China: A retrospective cohort study. The Lancet Infectious Diseases 20: 1141–50. [Google Scholar] [CrossRef]
  24. Li, Wei, Bo Zhang, Jianhua Lu, Shihua Liu, Zhiqiang Chang, Cao Peng, Xinghua Liu, Peng Zhang, Yan Ling, and Kaixiong Tao. 2020. Characteristics of household transmission of COVID-19. Clinical Infectious Diseases 71: 1943–46. [Google Scholar] [CrossRef]
  25. Liu, Jiaye, Xuejiao Liao, Shen Qian, Jing Yuan, Fuxiang Wang, Yingxia Liu, Zhaoqin Wang, Fu-Sheng Wang, Lei Liu, and Zheng Zhang. 2020. Community transmission of severe acute respiratory syndrome coronavirus 2, Shenzhen, China, 2020. Emerging Infectious Diseases 26: 1320. [Google Scholar] [CrossRef] [PubMed]
  26. Lu, Hongzhou, Charles W Stratton, and Yi-Wei Tang. 2020. Outbreak of pneumonia of unknown etiology in Wuhan, China: The mystery and the miracle. Journal of Medical Virology 92: 401–2. [Google Scholar] [CrossRef] [Green Version]
  27. Niwa, Makoto, Yasushi Hara, Shintaro Sengoku, and Kota Kodama. 2020. Effectiveness of Social Measures against COVID-19 Outbreaks in Selected Japanese Regions Analyzed by System Dynamic Modeling. International Journal of Environmental Research and Public Health 17: 6238. [Google Scholar] [CrossRef] [PubMed]
  28. NSW Government. 2020. Quarantine Arrangements for International Travellers. Available online: https://www.nsw.gov.au/covid-19/what-you-can-and-cant-do-under-rules/quarantine (accessed on 16 July 2020).
  29. Oke, Jason, and Carl Heneghan. 2020. Global Covid-19 Case Fatality Rates. Centre for Evidence-Based Medicine: University of Oxford. Available online: https://www.cebm.net/covid-19/global-covid-19-case-fatality-rates/ (accessed on 14 February 2021).
  30. Park, Shin Young, Young-Man Kim, Seonju Yi, Sangeun Lee, Baeg-Ju Na, Chang Bo Kim, Jung-il Kim, Hea Sook Kim, Young Bok Kim, and Yoojin Park. 2020. Coronavirus disease outbreak in call center, South Korea. Emerging Infectious Diseases 26: 1666. [Google Scholar] [CrossRef]
  31. Regmi, Krishna, and Cho Mar Lwin. 2021. Factors Associated with the Implementation of Non-Pharmaceutical Interventions for Reducing Coronavirus Disease 2019 (COVID-19): A Systematic Review. International Journal of Environmental Research and Public Health 18: 4274. [Google Scholar] [CrossRef] [PubMed]
  32. Rothe, Camilla, Mirjam Schunk, Peter Sothmann, Gisela Bretzel, Guenter Froeschl, Claudia Wallrauch, Thorbjörn Zimmer, Verena Thiel, Christian Janke, and Wolfgang Guggemos. 2020. Transmission of 2019-nCoV infection from an asymptomatic contact in Germany. New England Journal of Medicine 382: 970–71. [Google Scholar] [CrossRef] [PubMed] [Green Version]
  33. She, Jun, Jinjun Jiang, Ling Ye, Lijuan Hu, Chunxue Bai, and Yuanlin Song. 2020. 2019 novel coronavirus of pneumonia in Wuhan, China: Emerging attack and management strategies. Clinical and Translational Medicine 9: 1–7. [Google Scholar] [CrossRef]
  34. Siachpazidou, Dimitra I., Ourania S. Kotsiou, Grigorios Chatziparasidis, Dimitrios Papagiannis, George D. Vavougios, Eudoxia Gogou, Vasileios T. Stavrou, and Konstantinos I. Gourgoulianis. 2021. Action and Reaction of Pre-Primary and Primary School-Age Children to Restrictions during COVID-19 Pandemic in Greece. Journal of Personalized Medicine 11: 451. [Google Scholar] [CrossRef]
  35. Tang, Biao, Francesca Scarabel, Nicola Luigi Bragazzi, Zachary McCarthy, Michael Glazer, Yanyu Xiao, Jane M. Heffernan, Ali Asgary, Nicholas Hume Ogden, and Jianhong Wu. 2020. De-Escalation by Reversing the Escalation with a Stronger Synergistic Package of Contact Tracing, Quarantine, Isolation and Personal Protection: Feasibility of Preventing a COVID-19 Rebound in Ontario, Canada, as a Case Study. Biology 9: 100. [Google Scholar] [CrossRef]
  36. Van Doremalen, Neeltje, Trenton Bushmaker, Dylan H. Morris, Myndi G. Holbrook, Amandine Gamble, Brandi N. Williamson, Azaibi Tamin, Jennifer L. Harcourt, Natalie J. Thornburg, and Susan I. Gerber. 2020. Aerosol and surface stability of SARS-CoV-2 as compared with SARS-CoV-1. New England Journal of Medicine 382: 1564–67. [Google Scholar] [CrossRef]
  37. Verity, Robert, Lucy C. Okell, Ilaria Dorigatti, Peter Winskill, Charles Whittaker, Natsuko Imai, Gina Cuomo-Dannenburg, Hayley Thompson, Patrick GT Walker, and Han Fu. 2020. Estimates of the severity of coronavirus disease 2019: A model-based analysis. The Lancet Infectious Diseases 20: 669–77. [Google Scholar] [CrossRef]
  38. WA Government. 2020. Paying for Hotel Quarantine in WA Frequently Asked Questions. Available online: https://www.wa.gov.au/government/publications/paying-hotel-quarantine-wa-frequently-asked-questions (accessed on 16 July 2020).
  39. Wang, Zhongliang, Wanli Ma, Xin Zheng, Gang Wu, and Ruiguang Zhang. 2020. Household transmission of SARS-CoV-2. Journal of Infection 81: 179–82. [Google Scholar] [CrossRef] [PubMed]
  40. Xu, Yi, Xufang Li, Bing Zhu, Huiying Liang, Chunxiao Fang, Yu Gong, Qiaozhi Guo, Xin Sun, Danyang Zhao, and Jun Shen. 2020. Characteristics of pediatric SARS-CoV-2 infection and potential evidence for persistent fecal viral shedding. Nature Medicine 26: 502–5. [Google Scholar] [CrossRef] [PubMed] [Green Version]
  41. Zhang, Juanjuan, Maria Litvinova, Yuxia Liang, Yan Wang, Wei Wang, Shanlu Zhao, Qianhui Wu, Stefano Merler, Cécile Viboud, and Alessandro Vespignani. 2020. Changes in contact patterns shape the dynamics of the COVID-19 outbreak in China. Science 368: 1481–86. [Google Scholar] [CrossRef] [PubMed]
  42. Zhao, Shi, Qianyin Lin, Jinjun Ran, Salihu S. Musa, Guangpu Yang, Weiming Wang, Yijun Lou, Daozhou Gao, Lin Yang, and Daihai He. 2020. Preliminary estimation of the basic reproduction number of novel coronavirus (2019-nCoV) in China, from 2019 to 2020: A data-driven analysis in the early phase of the outbreak. International Journal of Infectious Diseases 92: 214–17. [Google Scholar] [CrossRef] [Green Version]
  43. Zhu, Yanshan, Conor J. Bloxham, Katina D. Hulme, Jane E. Sinclair, Zhen Wei Marcus Tong, Lauren E. Steele, Ellesandra C. Noye, Jiahai Lu, Keng Yih Chew, and Janessa Pickering. 2020. Children are unlikely to have been the primary source of household SARS-CoV-2 infections. medRxiv. [Google Scholar] [CrossRef]
Figure 1. The decision tree of the cost-effectiveness analysis for case isolation in a hotel room versus self-isolation in the home. This figure is based on the cost-effectiveness analysis of isolating a case with mild symptoms in the hotel versus in the home. Clearly, household size and the housemates’ ages will determine the hospitalisation and ICU requirement rates.
Jrfm 14 00305 g001
Figure 2. The map of significant areas in (a) NSW–Sydney, (b) NSW–Rest, (c) WA–Perth, and (d) WA–Rest. (Australian Bureau of Statistics 2016).
Jrfm 14 00305 g002
Figure 3. Summaries of age profiles and household sizes in two states: (a) age; and (b) household size, according to Census 2016 (Australian Bureau of Statistics 2016).
Jrfm 14 00305 g003
Figure 4. The fraction of individuals of different age groups within households of varying size in the four regions from the simulation model. NSW–Sydney and WA–Perth include statistical areas level 4 in Sydney and Perth, whereas NSW–Rest and WA–Rest include statistical areas level 4 outside Sydney and Perth, respectively.
Jrfm 14 00305 g004
Figure 5. Distribution of total costs of home isolation: (a) when the household size is greater than one; and (b) when the total cost is greater than the states’ hotel quarantine cost. Hotel quarantine costs announced by NSW and WA are AU$3000 and AU$2520, respectively.
Jrfm 14 00305 g005
Figure 6. Distribution of household types with total costs higher than the states’ hotel quarantine cost: (a) in NSW; and (b) in WA, when the total cost of home isolation is greater than the states’ hotel quarantine cost. Household members are represented with a circle coloured by age category and households are represented by clusters of circles. Larger circles indicate more common household types. “Juniors” refer to individuals under the age of 20; “adults” are defined as individuals between 20 and 59 years old, and “seniors” refers to those aged 60 and older.
Jrfm 14 00305 g006
Figure 7. Distributions of ages and household sizes: (a) ages of household members; and (b) distribution of the patient zero when the total cost of home isolation is above the state hotel quarantine costs. Fractions are calculated by dividing the number of individuals in different age groups and household sizes, when the total cost of home isolation exceeds the state hotel quarantine costs, by the total number of individuals in different age groups and household sizes in the sample.
Jrfm 14 00305 g007
Table 1. The list of parameters incorporated in the decision tree.
ParameterScenario 1
(Hotel Isolation)
Scenario 2
(Home Isolation)
Quarantine Cost
NSWAU$3000.00 per person
WAAU$2520.00 per person
Household Secondary Attack Rate (HSAR) 25.03%
Age-dependent Hospitalisation (ICU Requirement) Rate:
0–90.062% (0.018%)
10–190.062% (0.018%)
20–290.78% (0.23%)
30–392.9% (0.85%)
40–495.1% (1.5%)
50–599.9% (2.9%)
60–6915.5% (4.44%)
70–7935.8% (10.5%)
80+65.9% (19.4%)
Ward Stay: Median
<205
20–596
60+9
ICU Stay: Median
<200
20–5913
60+21
Ward Cost AU$1800 per night
ICU Cost AU$5000 per night
Note: The household secondary attack rate (HSAR) is the weighted average of the HSAR in the literature, which is reported to vary between 4.64% and 38.7%. The age groups for the ward and ICU stay length are reported as <18, 18–59, 60+ in the bi-weekly epidemiological report by the COVID-19 National Incident Room Surveillance Team (2020). However, this has been modified here in order to match the age groups for hospitalisation and ICU requirement rates.
Table 2. List of parameters used in the simulation model, from Geard et al. (2013).
ParameterNSW–SydneyNSW–RestWA–PerthWA–RestSource
Initial population size4,496,2592,971,1591,847,107620,972Australian Bureau of Statistics (2016)
Mortality probabilitiesBy year of ageAustralian Bureau of Statistics (2016)
Fertility probabilitiesBy year of ageAustralian Bureau of Statistics (2016)
Birth gapmean: 365 days; SD: 90 daysGeard et al. (2013)
Couple formation parametersage range: 18–60 years; annual probability: 7.5%Geard et al. (2013)
Partner age differencemean: 2 years; SD: 2 yearsGeard et al. (2013)
Couple dissolution parametersage range: 18–60; annual probability: 1.5%Geard et al. (2013)
Leaving home parametersminimum age: 18; annual probability: 0.8%Geard et al. (2013)
Table 3. A summary of statistics of the total costs of home isolation for households with a size greater than one2.
RegionCountMeanSTDMin25%50%75%Max
NSW—Sydney3953892.031652.471.4485.02170.04834.8015,208.53
NSW—Rest39741215.591975.411.4486.46323.251004.3014,752.45
WA—Perth3891906.911680.621.4485.02178.43834.8014,730.37
WA—Rest39401003.721731.571.4486.46323.25837.6914,731.81
Publisher’s Note: MDPI stays neutral with regard to jurisdictional claims in published maps and institutional affiliations.

