Relative Efficiency of Canadian Banks: A Three-Stage Network Bootstrap DEA


Research Centre in Operations and Decision Sciences, Department of Finance and Operations, Faculty of Management, Laurentian University, 935 Ramsey Lake Road, Sudbury, ON P3E 2C6, Canada
*
Author to whom correspondence should be addressed.
J. Risk Financial Manag. 2020, 13(4), 68; https://doi.org/10.3390/jrfm13040068
Submission received: 27 February 2020
/
Revised: 7 April 2020
/
Accepted: 8 April 2020
/
Published: 10 April 2020
(This article belongs to the Special Issue Banking and the Economy)
Abstract
:In this study, we focus on how banks can enhance their efficiency in the utilization of resources to ensure their economic sustainability. We propose a novel three-stage (production, investment, and revenue generation) network Data Envelopment Analysis (DEA) with bootstrapping to evaluate the performance of the six big Canadian banks for the period 2000–2017, amid the 2007 financial crisis and the increasing competition level due to new technologies. We identify the best practices in each stage that can be used as benchmarks by other banks to improve their economic sustainability. Our results indicate that the 2007 financial crisis resulted in lower efficiencies in the performance of Canadian banks. This decline was not substantial for the production and investment stages when the revenue generation stage received the greatest hit. In addition, we observed that the individual banks did not have consistent performance in the different stages. Finally, we compared our model with the black box DEA model and concluded that the network DEA provides more insightful and accurate results in terms of banks’ efficiencies.
1. Introduction
Finanancial services firms are an integral and important part of the economic systems of every country. They include banks (the largest proportion), securities brokers, insurance, mutual fund, and credit card companies (Melnick et al. 2012).
In Canada, the banking system plays a major role in the economy. By the numbers, in 2017, the Canadian banking system represented 86 banks, 5907 branches, 18,640 ATM, 275,825 employees in Canada, and 119,885 employees overseas. In the same year, banks accounted for 3.3% of the Gross Domestic Product (GDP) of the country. The top six banks paid 12.2 billion of CAD$ in taxes in Canada and 18.2 billion of CAD$ overseas (Canadian Bankers Association 2018). In addition to their direct contributions, banks have a more remarkable impact on the GDP through their financing activities. For example, in 2017, more than 1 million of financing relationships between banks and Small and Medium-sized Enterprises (SME) have been reported (Canadian Bankers Association 2018).
Canadian banks faced various challenges since the beginning of the millennium. First, technology is increasingly important in the process of creating value for their customers. Customers increasingly favor the use of technological outlets for their transactions. Hence, in 2017, they have completed 643 million of them through ATMs, 574 million through online banking, and 398 million through mobile banking. There are, therefore, strong competitive forces requiring that banks constantly innovate their customer relationship management using information technology (Canadian Bankers Association 2014). On the other hand, technology has significantly lowered the barriers to enter the industry and allowed several new competitors to enter the market, especially online banks.
Another challenge that banks experienced recently comes from the 2007 subprime crisis and its aftermath. Banks, and more generally financial services firms, were at the epicenter of this crisis. Indeed, the crisis started as a credit crisis in the USA, with numerous resounding bankruptcies (Countrywide, Northern Rock, Bear Stearns, Fannie Mae, and Freddie Mac) that were followed in mid-September 2008 by the bankruptcy of the Lehman Brothers. At that point, the crisis became a liquidity crisis and ended up having a global impact.
In such a competitive environment, it is primordial for the actors of the sector to monitor and improve their performance to ensure their economic sustainability. To achieve that, they must identify the best practices in the industry and use them as a roadmap to achieve economic sustainability. In order to assess the performance of a firm, one approach typically used in the literature is to measure efficiency (Daraio and Simar 2007). Measuring the efficiency of a firm, in a sample, consists of evaluating numerically its technical efficiency, defined as its ability to operate on or near the efficient production frontier of the sample (Daraio and Simar 2007). A function typically represents the frontier, and the goal here is to determine the technical efficiency, which represents this function. Econometric functions can be used to this endeavour, leading to a set of techniques called parametric techniques (Daraio and Simar 2007). They proceed by assuming a mathematical formulation for the functions and aim at determining its parameters. Stochastic Frontier Analysis is the most significant type of parametric methods.
On the other hand, mathematical programming methodologies can be used to determine the frontier, leading to non-parametric techniques. Data Envelopment Analysis (DEA) is the most used non-parametric technique (Emrouznejad and Yang 2018; Daraio and Simar 2007). In this approach, no assumption should be made on the relationship of the parameters and the efficiency. In addition, a large set of inputs and outputs can be handled in this approach, which is not the case for parametric techniques (Daraio and Simar 2007). However, DEA suffers from the need to have a large quantity of data to be able to achieve a high level of accuracy in the results, typically referred to as the “curse of dimensionality" (Daraio and Simar 2007). Since its introduction in the late 70s (Charnes et al. 1978), DEA has been successfully applied to analyse the performance or efficiency of public and private organizations, financial institutions, financial products, projects, etc. (Emrouznejad and Yang 2018).
There have been several measures of the efficiency of banks using DEA worldwide (Kaffash and Marra 2017; Paradi and Zhu 2013; Fethi and Pasiouras 2010). In fact, given the complex nature of the banking sector production system, researchers went beyond the basic DEA models and implemented different extensions of this approach to analyze the efficiency of banks. One of these extensions which has received growing interest in the pertinent literature is the network DEA (Färe et al. 2007). In the network DEA, the internal structure of Decision-Making Units (DMUs) is segmented into connected sub-DMUs, and the efficiency is calculated for the sub-DMUs (Färe et al. 2007). Existing studies of the efficiency of banks using network DEA had several purposes. First, researchers were interested in understanding the dual role of deposits being at the same time an output and an input of operating subprocesses in banks operations (Holod and Lewis 2011; Fukuyama and Matousek 2011, 2017; Wang et al. 2014a; Yang and Liu 2012; Ebrahimnejad et al. 2014; Lin and Chiu 2013). Other studies applied network DEA to dismantle the production system of banks into sub-processes and provide a more accurate efficiency evaluation (Seiford and Zhu 1999; Avkiran 2009; Wang et al. 2014b; Matthews 2013; Wanke and Barros 2014). A final set of studies extended the models to the dynamic case. In this situation, some of the outputs in one period are the inputs for the next period (Akther et al. 2013; Fukuyama and Weber 2015; Avkiran 2015; Chao et al. 2015).
However, in the Canadian context, all reported studies used the classical DEA models. They were assessing banks at the global or branch levels. At the global level, researchers were interested in measuring efficiencies and determining whether it had been impacted by external factors, such as recessions the country had faced before the year 2000 (Asmild et al. 2004). At the branch level, researchers were mostly interested in benchmarking, identifying best practices or deficiencies, and determining how they can proceed to achieve efficiency (Paradi and Schaffnit 2004; Yang 2009; Paradi et al. 2011, 2012).
The objective of this paper is to perform an efficiency analysis of the Canadian banking industry using network DEA for the period 2000–2017. Our literature review has identified this as a gap that we intend to close. In our approach, banks operating activities aim first at collecting deposits from customers. The deposits are then used to provide loans to customers, perform investment activities, and mitigate the effects of impaired loans. Finally, from these loans and investments, revenues are generated for the banks through income from interests and fees that are collected for various services. Hence, we propose a three-stage model where three subprocesses of the operations of banks will be assessed: the deposit collection process, which transforms the resources of the banks into deposits; the intermediation process, which typically transforms deposits into loans and investments; and the revenue generation process, which transforms the loans and investments into revenues for the bank. To the best of our knowledge, this is the first time that network DEA is used in the Canadian context and that these three subprocesses are explicitly considered in the literature. In addition to using the network DEA structure, we computed the DEA efficiencies using the Bootstrap approach (Simar and Wilson 1998, 2000) in order to obtain robust efficiency estimators. We will first perform an efficiency analysis of the sector, then we will determine how the 2007 financial crisis has affected the efficiency of Canadian banks, and finally we will compare the efficiency measures obtained from our three-stage DEA models to the ones from the classical DEA models.
The remainder of the paper is organized as follows. Section 2 provides a literature review on applications of DEA methodologies. Section 3 presents the DEA and network DEA methodologies and describes the models that we will be using. Section 4 follows with the context of our study and our empirical analysis. We conclude in Section 5.
2. Literature Review
The efficiency measurement of the banking systems, as a pillar of the modern economy, has long been of interest to researches. Accordingly, several approaches, such as accounting-based measurements (Fixler and Zieschang 1993) and the stochastic frontier approach (Weill 2004), have been implemented to assess the efficiency of the banking sector.
DEA is a non-parametric approach that allows for measuring the efficiency of DMUs considering several inputs and outputs. Various advantages of DEA have led to its wide applications in different industries (Emrouznejad and Yang 2018), including the banking sector. The first application of DEA in the banking sector can be traced back to the study of Sherman and Gold (1985). Since then, a considerable number of studies have examined the efficiency of the banking sector using DEA. See the studies of Kaffash and Marra (2017), Paradi and Zhu (2013), and Fethi and Pasiouras (2010) for recent reviews in the applications of DEA in the banking sector.
2.1. Network DEA in the Banking Sector
The banking process consists of several interconnected subprocesses, and classic black box DEA models, due to their holistic approach, cannot be used to analyze these subprocess. Therefore, researchers have implemented various extensions of DEA, such as network DEA, to investigate the performance of different aspects of banking systems. In the network DEA, the internal structure of DMUs is segmented into connected sub-DMUs, and the efficiency is calculated for each sub-DMU (Färe et al. 2007).
Some of the studies focused on two-stage DEA models in which deposits is the output of the first stage and the input of the second stage and investigated how this approach affects the measurement of efficiencies. Holod and Lewis (2011) showed that having deposits as the connecting factor of the first and second stages substantially impacts the efficiencies. Fukuyama and Matousek (2011) concluded a similar result by evaluating the efficiencies of the Turkish banking industry. By evaluating the efficiencies of Chinese banks, Wang et al. (2014a) also found a discrepancy between the results of the network DEA and the traditional back-box DEA.
A portion of the pertinent literature is devoted to exploring the role of risk in the efficiency of banks. Fukuyama and Matousek (2017) incorporated non-performing loans as a measure of risk in their model. They applied their model to the Japanese banking sector and indicated that the studied banks have gradually reduced their risk between 2000 to 2013. Similarly, Ebrahimnejad et al. (2014) considered non-performing loans as a measure of risk and evaluated the performance of the branches of a local bank in the US. Matthews (2013) interviewed 24 banking executives to identify the risks that the banking industry is facing and, accordingly, developed some indexes to measure the risk. Furthermore, they incorporated these indexes in their DEA model and concluded that, in this approach, return on investment can be considered as a proxy for the measured efficiencies.
Several studies concentrated on the evaluation of the marketability and profitability of banks. Seiford and Zhu (1999) argued that most of the studies in assessing bank efficiency focus on the operational aspect of the banks and ignore their marketing side. Hence, they divided the banking process into profitability and marketability stages and applied their model to analyze the efficiency of 55 banks in the United States. Their results indicated that large banks have lower performance in terms of marketability. Avkiran (2009) divided the bank production system into three parallel sub-DMUs: profit centre loans and overdrafts, mortgaged real estate loans, and discounted commercial bills. It was demonstrated that the results of the black box DEA model are not necessarily aligned with the network DEA model. Yang and Liu (2012) investigated the productivity and profitability of Taiwanese banks using fuzzy logic and concluded that profitability plays a greater role in the overall performance of the banks in comparison to productivity. Wang et al. (2014b) extended the previous study by considering the value creation process and similarly applied fuzzy logic to simplify the proposed model. They showed that intellectual properties have a significant impact on the value of the banks. Lin and Chiu (2013), in addition to profitability, included corporate and consumer banking to their model. The results showed that mergers and acquisition activities could enhance the performance and profitability of banks. By focusing on cost and productivity efficiencies, Wanke and Barros (2014) also concluded that mergers and acquisitions could reduce the costs and increase profitability.
Some researchers extended the models to the dynamic case. In this situation, some of the outputs in one period are the inputs for the next period. Akther et al. (2013) developed a two-stage dynamic network DEA model to evaluate the efficiency of the Bangladesh banking system. They considered non-performing loans generated in one period as an input for the next period. It was demonstrated that the results of their model are not aligned with the black box DEA model. Fukuyama and Weber (2015) extended the previous study by considering carry-over assets as an intermediate product between the periods. They applied their model to the Japanese banks and concluded that the performance of the banks could be improved by more effective management of deposits. Like previous studies, Avkiran (2015) developed a two-stage dynamic network DEA model. They included the number of referrals as one of the intermediate products between the periods and used robustness tests to examine the efficiency measurements better. They applied the model to 48 Chinese banks and concluded that there is no significant difference between the efficiency of foreign and domestic banks. Chao et al. (2015) considered the capability, efficiency, and profitability as three stages of the banking process. They assumed that the non-performing loans and loan loss reserves connect the periods. The application of the model to the Taiwan banking sector for the period 2005–2011 indicated that the profitability of the banks has been decreasing, due to the financial crisis.
2.2. Applications of DEA in the Canadian Banking Sector
The Banking sector has a pivotal role in Canada’s economy and, accordingly, has been of interest to several researchers. Various studies investigated the application of DEA models in Canadian banks. Asmild et al. (2004) focused on five major Canadian banks for the period 1982–2000. They considered a production model where the deposits are considered as an output. They indicated that the two recessions that Canada faced during this period significantly impacted the efficiency of the banks. Paradi and Schaffnit (2004) investigated the performance of the branches of one large Canadian bank. They also applied the production model and concluded that focusing on efficient branches can help the managers to grow their business. Yang (2009) also evaluated the branches of one Canadian bank using a production model. They indicated that branches should reform their processes to achieve efficiency. Paradi et al. (2012) incorporated a novel grouping approach with DEA to assess the efficiency of branches of a Canadian bank. The results indicated that the grouping approach could facilitate the identification of deficiencies. In another study, Paradi et al. (2015) developed two models to evaluate staff allocation and customer satisfaction. They applied their models to the branches of a large Canadian bank. By comparing the DEA scores with the bank’s internal metrics, it was concluded that the DEA measurements are reliable. Paradi et al. (2011) developed three models (production model, intermediary model, and profitability model) to evaluate different aspects of a bank’s branch operations. Afterward, they proposed a non-parametric index approach to aggregate the results of the models. They showed that their approach provides a more comprehensive insight into the performance of branches.
Our contribution to the literature is four-fold. First, we extended the current network DEA models by considering the revenue generation stage. This stage is related to the portfolio selection and pricing strategies of the banks. Despite the importance of this stage (Gambacorta 2008; DeYoung and Rice 2004), it has been either ignored (Fukuyama and Weber 2015; Akther et al. 2013; Fukuyama and Matousek 2011; Holod and Lewis 2011) or combined with other stages (Wang et al. 2014a; Ebrahimnejad et al. 2014; Lin and Chiu 2013; Yang and Liu 2012). In our study, we consider revenue generation as a separate stage and evaluate the efficiency of Canadian banks in this stage. Second, a glance at the pertinent literature reveals that despite the advantages of network DEA in evaluating the efficiency of the banks (Avkiran 2009), this approach has not been used in assessing the performance of Canadian banks. In our study, we implement network DEA to provide a better understanding of the performance of the Canadian banking industry. Third, most of the studies that have implemented DEA to evaluate the efficiency of Canadian banks focused on the operations of branches. The only study that has investigated the operations of the Canadian banks from the corporate level is the study of Asmild et al. (2004). In this study, we incorporate more recent data to elaborate on the recent changes in Canada’s banking sector, and, especially, we evaluate the effect of the 2007 financial crisis on Canadian banks. Fourth, in order to account for the uncertainty (stochastic error) inherent to the real world and obtain robust and consistent efficiency estimators, we performed the bootstrapping of our efficiency ratios with bootstrap DEA (Simar and Wilson 1998, 2000). No study has used bootstrapping in the performance assessment of Canadian banks.
3. Methodology
3.1. Black Box CCR and BCC Models
Data Envelopment Analysis (DEA) is certainly one of the most prolific decision-making techniques of the last four decades. This technique has been used to measure the performance or relative efficiency of private and public organizations in almost all sectors, including in manufacturing (Wahab et al. 2008), logistics (Xu et al. 2009), telecommunication (Cooper et al. 2001), mining and oil and gas production (Dia et al. 2019a, 2019b), and healthcare (Jacobs 2001). A recent survey of DEA applications can be found in Emrouznejad and Yang (2018).
The first DEA models, and by far the most used ones, so far, are the CCR (for Charnes, Cooper and Rhodes, the initials of the authors) (Charnes et al. 1978) and BCC (for Banker, Charnes and Cooper, the initials of the authors) (Banker et al. 1984) models. The CCR model measures the overall efficiency while the BBC model measures the managerial efficiency. With these two models, it is possible to obtain the scale efficiency (Banker et al. 1984) by dividing the overall efficiency by the managerial efficiency.
DEA has several benefits compared to its counterpart parametric models (Banker et al. 1988; Banker et al. 1986): First, it converts multiple inputs and outputs into a comprehensible measure of relative efficiency for a sample of Decision-Making Units (DMUs). Besides, this technique allows for performing benchmarking for the DMUs, which are non-efficient without setting a priori relationships between the inputs and outputs. In this study, the DMUs are the top six Canadian Banks observed annually for the period of 18 years (2000–2017).
The first DEA model considered is the CCR oriented input, and is presented as follows:
In the above model, n is the number of DMUs, t is the number of outputs, m is the number of inputs, xis is the value of the input s for the DMUi, yir is the value of the output r for the DMUi, hi is the efficiency score of the DMUi (generally, index 0 is used to indicate the DMU being assessed in the models), μr is the relative importance of the output r, νs is the relative importance of the input s, and ε is a small positive real number.
The second DEA model is a variant of the preceding one, known as the BCC model, when variable return to scale is considered:
The DEA models allow for the identification and the quantification of the sources of inefficiencies by transforming the CCR and BCC models into equivalent dual models. For instance, the dual model of the CCR oriented input is as follows:
where the parameters λj (j = 1, …, n) in Equations (10) and (11) identify the benchmark DMUs and define an envelope for the evaluated DMU0; θ0 in Equation (9) is the efficiency ratio of the evaluated DMU0; z0 in Equations (9) and (10) indicates the proportion of inputs, for an inefficient DMU, needed to produce outputs equivalent to its benchmark DMUs; and si− and sr+ in Equations (9)–(11) correspond to the slacks associated with the inputs i and the outputs r, respectively. Similarly, the dual of the BCC oriented input model is obtained by adding the following convexity constraint to the CCR dual oriented input model specified in Equations (9)–(11):
The efficiency obtained from the CCR model can be further decomposed into efficiency related to the management effectiveness and the scale of operations. Since the BCC model computes the efficiency driven by the management effectiveness, we can evaluate the scale efficiency (SE) (Banker et al. 1984) as the ratio of the overall technical efficiency (computed by the CCR model) to the pure technical efficiency (computed by the BCC model), as in Equation (13).
The scale efficiency in Equation (13) evaluates if the DMU has the optimum scale size or, in other words, if it has the right amount of resources to operate.
3.2. DEA with Bootstrapping
The main limitation of the DEA methodology is that it is deterministic and does not consider the uncertainties characterizing the real world problems. Indeed, past studies focusing on the statistical properties of the conventional point estimators obtained through DEA have found that these estimators are not consistent efficiency estimators (Toma et al. 2017). Bootstrapping methodologies are well known and frequently used statistical resampling tools useful when one needs to perform statistical inferences for complex problems. Following Simar and Wilson’s (1998) approach, one can generate robust efficiency scores and build their confidence intervals (Simar and Wilson 2000). The bootstrap DEA consists in approximating the sampling distributions of the efficiency estimator, using a Monte Carlo resampling method to simulate the Data Generating Process (DGP). One can then calculate the robust estimators of the original unknown sampling distribution (Toma et al. 2017). The crucial step in the process lies in the proper specification of the DGP underlying the observed data.
For our previously presented DEA models, the DGP, P, generates a random sample, , to estimate their relative efficiencies . An estimator, , of the actual and unknown Data Generating Process (DGP) is then generated using the bootstrap procedure. A new dataset is constructed using the population obtained from the efficiency estimates. This dataset defines the corresponding and , whose distributions are known, given that is known. Using a Monte Carlo approximation in the analytical computation of , a collection of B pseudo-samples, , are generated to produce the pseudo-estimates of the relative efficiencies . Moreover, a kernel density estimation algorithm is used to ensure the generation of consistent bootstrap estimates (Simar and Wilson 1998). Thus, we obtain a better estimation of the true efficiency scores, as compared to the regular DEA efficiency ones.
In our study, the bootstrap DEA efficiency scores are computed by running 2000 iterations of this procedure, which ensures enough convergence of the confidence intervals.
3.3. Our Three-Stage Network DEA Model
The controversial role of deposits in the banking process has long been a debated matter in the pertinent literature. This issue has resulted in extensive applications of two-stage network DEA in the measurement of the banking sector efficiency (Wang et al. 2014a). In these models, in the first stage, the resources are utilized to generate deposits, which, in turn, will be used to generate loans and securities or incomes (Fukuyama and Matousek 2017; Fukuyama and Weber 2015; Wang et al. 2014a; Akther et al. 2013; Holod and Lewis 2011).
One essential aspect of banking operations is how banks set interest rates and select their securities to create revenue. This process directly affects the profit and the performance of the banks (Gambacorta 2008; DeYoung and Rice 2004). Nevertheless, most of the studies in the literature have either ignored this process (Fukuyama and Weber 2015; Akther et al. 2013; Fukuyama and Matousek 2011; Holod and Lewis 2011) or combined it with the second stage (Wang et al. 2014a; Ebrahimnejad et al. 2014; Lin and Chiu 2013; Yang and Liu 2012).
In this study, in order to capture different aspects of the banking operations, we consider three stages: the production stage, intermediation stage, and revenue generation stage. In the production stage, the bank uses its resources to generate deposits, which is the lone output of this stage. We consider the total assets, number of employees, and non-operating costs as the inputs of the first stage. In the intermediation stage, the bank uses the deposits to generate loans and securities. One important aspect of the second stage is the risk that comes with impaired loans. It is one of the main responsibilities of the banks to oversee and monitor impaired loans to ensure the sustainability of the system (Office of Superintendent of Financial Institutions 2010). Hence, in our model, we consider impaired loans as an undesired output of the second stage, and we applied an inverse transformation to it as the output to consider (Seiford and Zhu 2002) in this stage. In the revenue generation stage, we examine the efficiency of the banks’ investment strategies and interest fee setting policies. In this stage, the outputs are interest incomes and non-interest incomes. Figure 1 shows the inputs and outputs of each stage.
4. Empirical Study
4.1. Sample and Data
By the numbers, in 2017, there were 86 domestic and foreign banks operating in Canada (Canadian Bankers Association 2018). In this study, we focused on the Canadian banks, which have over $100,000 million of total assets. These banks consist of Royal Bank of Canada (RBC), Toronto-Dominion Bank (TD), Bank of Nova Scotia (Scotia), Bank of Montreal (BMO), Canadian Imperial Bank of Commerce (CIBC), and National Bank of Canada (NBC). These top six banks, also known as the “big six,” are classified as systematically important financial institutions by Canadian regulatory bodies. In addition, they control over 90% of banking assets and 75% of the assets of the deposit institutions in Canada (Gueyié et al. 2019; Mohsni and Otchere 2018). Therefore, due to their importance for the Canadian economy and to get meaningful results by reducing disparity in our sample (McMillan and Datta 1998), we focus on these six banks. We gathered the data for the years 2000–2017 (108 DMUs in each stage) from the annual reports and other public financial reports. This set of data gives us a better understanding of the past two decades’ major trends and phenomena in the Canadian banking industry. Table 1 provides a summary of the descriptive statistics of the inputs and outputs for each bank.
A glance at Table 1 reveals the different policies that the Canadian banks have implemented to generate profit. For instance, Scotia has a relatively small proportion of securities over loans. This demonstrates that the income of the Scotia is more reliant on loans rather than securities. This policy has resulted in a large amount of impaired loans for this bank. Despite the smaller size of Scotia relative to RBC and TD in terms of total assets, this bank has a larger amount of impaired loans.
The other important observation is the inconsistency between the total assets and the operating costs. For instance, although in terms of total assets BMO is a larger bank compared to CIBC, it has a lower number of employees and other operating costs.
4.2. Analysis of Results
Using the collected data, we have run the Bootstrap three-stage DEA models to measure the efficiencies. In total, we have considered nine inputs and outputs, the triple of which is 27. We define a DMU as a bank considered in a given year. This resulted in 108 DMUs. Therefore, our DEA sample satisfies the rule of thumb proposed by Sarkis (2007) to achieve acceptable results.
For each stage, we calculated the bootstrap overall technical efficiency (OTE), the bootstrap pure technical efficiency (PTE), and the scale efficiency (SE), as presented in Section 3. Please note that we measured the SE using the OTE and PTE from non-bootstrap models. In addition, we measured the overall efficiencies by applying a multiplicative approach. In this approach, for each DMU, the multiplicative aggregate efficiency is computed by multiplying its efficiency scores calculated individually in the three stages.
4.2.1. Annual Evaluation of Efficiencies
In this section, we analyze the behaviour of efficiencies for the years 2000–2017. Table 2, Table 3 and Table 4 provide the calculated OTEs, PTEs, and the SEs for the first, second, and third stages, respectively.
The first observation from Table 2 and Table 3 is that the banking sector of Canada performed well in terms of the overall technical efficiency and the pure technical efficiency in the first and second stages. On average, the overall and pure technical efficiencies of the banks in the period 2000 to 2017 are 0.828 and 0.88 for the first stage, and 0.812 and 0.879 for the second stage. Besides, in the first two stages, the OTE is always above 0.74, and the PTE is above 0.8. In the third stage, the average OTE and PTE are relatively lower and are equal to 0.739 and 0.77, respectively (see Table 4).
The measured scale efficiencies for three stages suggest that the main source of inefficiency in the sector is the managerial issues rather than scale issues. Figure 2, Figure 3 and Figure 4 show the variations of OTE, PTE, and SE for the period 2000 to 2017.
From Figure 2, it can be observed that, for the period 2000 to 2007, the OTE and the PTE are gradually decreasing. This shows that, during this period, the Canadian banks were gradually losing their ability to turn their resources into deposits. The data from the Office of the Superintendent of Financial Institutions Canada show that, during this period, the assets to capital ratio for Canadian banks was increasing (Office of Superintendent of Financial Institutions 2019), which results in lower efficiency in the first stage.
Figure 3 and Figure 4 demonstrate that the average efficiency of the Canadian banks for the investment and revenue generation stages was increasing before the 2007 financial crisis. In the period 2002 to 2007, the demand for mortgages increased, which resulted in higher mortgage interest rates (Bank of Canada 2019). Hence, in this period, we observe increasing trends in the efficiencies for the second and the third stages.
In the period 2007 to 2011, we can observe a swift decline in the OTE and PTE for all three stages. This behaviour can be traced back to the 2007 financial crisis. Nevertheless, the decline in the measured efficiencies is not substantial. In the studied period, neither OTE nor PTE has ever gone below 0.74 for the first two stages and below 0.59 for the third stage. This pattern can be associated with the resilience of the Canadian banking system. In fact, according to a recent survey by the World Economic Forum, Canada has one of the most stable banking systems in the world (World Economic Forum 2018). Another explanatory element that describes the relatively good performance of the Canadian banks during the 2007 financial crisis is the high reliance of Canadian banks on retail and commercial deposits in comparison to American and European counterparts (Gauthier and Tomura 2011). Retail and Commercial deposits provide a more stable source of funds for the banks and, consequently, impose less risk during financial crises (Truno et al. 2017). Moreover, researchers have suggested other elements, such as stiff government supervision and regulations and a centralized structure of the Canadian banking system, as important factors that helped the Canadian banking sector to have a smooth transition during the 2007 financial crisis (Seccareccia 2012).
After 2011, we observe a gradual increase in the OTE and PTE of all stages. In fact, in the first stage, the OTEs and the PTEs for 2015, 2016, and 2017 are even higher than similar measures in 2000. Most of the banks responded to the financial crisis by reducing their operating and non-operating costs (Tsionas and Mamatzakis 2017). Canadian banks also followed a similar strategy that resulted in higher efficiencies in the first stage after 2011.
We observe similar behaviour for the PTE of the second stage. The PTE in the last three years is increasing and is higher than the PTE in 2000.
According to Figure 4, the revenue generation stage of the banks is also gently recovering. After 2010, we can observe a gradual increase in the OTE and PTE of the final stage. In fact, after 2011, the mortgage rate was relatively constant (Statistics Canada 2019); however, the decrease in the amount of impaired loans and the higher reliance of the Canadian banks on non-interest incomes, such as deposit and transfer fees (Seccareccia 2012), have resulted in higher efficiency in the last stage. In fact, the share of non-interest incomes in the total income of the studied banks has increased from 22% in 2007 to 39% in 2017.
In order to develop a better understanding of the variation of efficiency in different years, we conducted pairwise t-tests and compared the OTE, PTE, and SE of the studied years for all three stages. The results of this comparison are presented in Table 5. Please note that, in this table, we have only reported the p-values for the years with a significant difference at 1%, 5%, and 10%.
According to Table 5, in the first stage, although we observe a swift decrease in overall technical efficiency in the period 2009 to 2011, this decrease is not statistically significant. We have a similar situation for SE. In addition, the PTE during the financial crisis does not show a statistically significant difference to the years prior to the financial crisis. As mentioned before, this behaviour can be traced back to the resilience of the Canadian banking system. However, the improvement in PTE after the financial crisis is significant. It can be observed that the PTEs of 2008, 2010, and 2011 are significantly different from the years 2015, 2016, and 2017. After 2011, most of the banks around the world tried to reduce their costs to become more resilient to the fluctuations of the financial markets, and Canadian banks were no exception to this (Tsionas and Mamatzakis 2017). Table 5 reveals that Canadian banks were indeed successful in this process.
In the second stage, the big six Canadian banks demonstrate a stable performance. We did not observe any statistically significant difference between the OTEs, PTEs, and SEs prior, during, or after the financial crisis. According to the results, the financial crisis did not substantially impair the loaning and investment processes of the big six Canadian banks (and therefore, no number is reported in Table 5 for Stage 2). This shows that the Canadian banks have not made a drastic change in the rate of turning deposits into loans and securities, and although the lower rate of impaired loans has caused an increase in the efficiencies, this increase is not statistically significant.
The third stage indicates the largest variations in efficiency from 2000 to 2017. According to Table 5, during the financial crisis, the efficiency of Canadian banks’ revenue generation stage dropped significantly. The OTEs and PTEs during the financial crisis are significantly different from the years 2000 and 2001, in which the banks had the highest efficiencies. In addition, the performance of the banks before the financial crisis is significantly different from the years 2010 and 2011. These observations are due to the fact that, before the financial crisis, the banks were benefiting from a high mortgage demand and high mortgage rates, and the loss of this source of income resulted in significantly lower efficiencies in Stage 3 after the financial crisis.
4.2.2. Evaluation of the Banks’ Efficiencies
In this section, we analyze and compare the efficiencies of the big six Canadian banks. Table 6 provides the OTE, PTE, and the SE of the banks for all three stages.
The first observation from Table 6 is that the six big Canadian banks, on average, have a lower performance in the second stage in terms of overall technical efficiency. The average OTE for the first and the third stages are 0.837 and 0.915, while this number for the second stage is 0.791. In terms of pure technical efficiency, the banks have the best performance in the third stage. The average PTE for the first, second, and third stages are 0.880, 0.879, and 0.948, respectively.
Our second observation is that the standard deviations of the efficiencies for all the stages are relatively low. In the first and the second stages, the highest coefficient of variation for OTE, PTE, and SE is 0.118. In the third stage, we have a larger variation in the measured efficiencies; nevertheless, the coefficients of variation are still relatively low. The highest coefficient of variation in this stage is 0.248. This observation shows that due to the high centralization of the Canadian banking system and the higher level supervision of the government, Canadian banks are remarkably resilient to the fluctuations of the financial markets (World Economic Forum 2018).
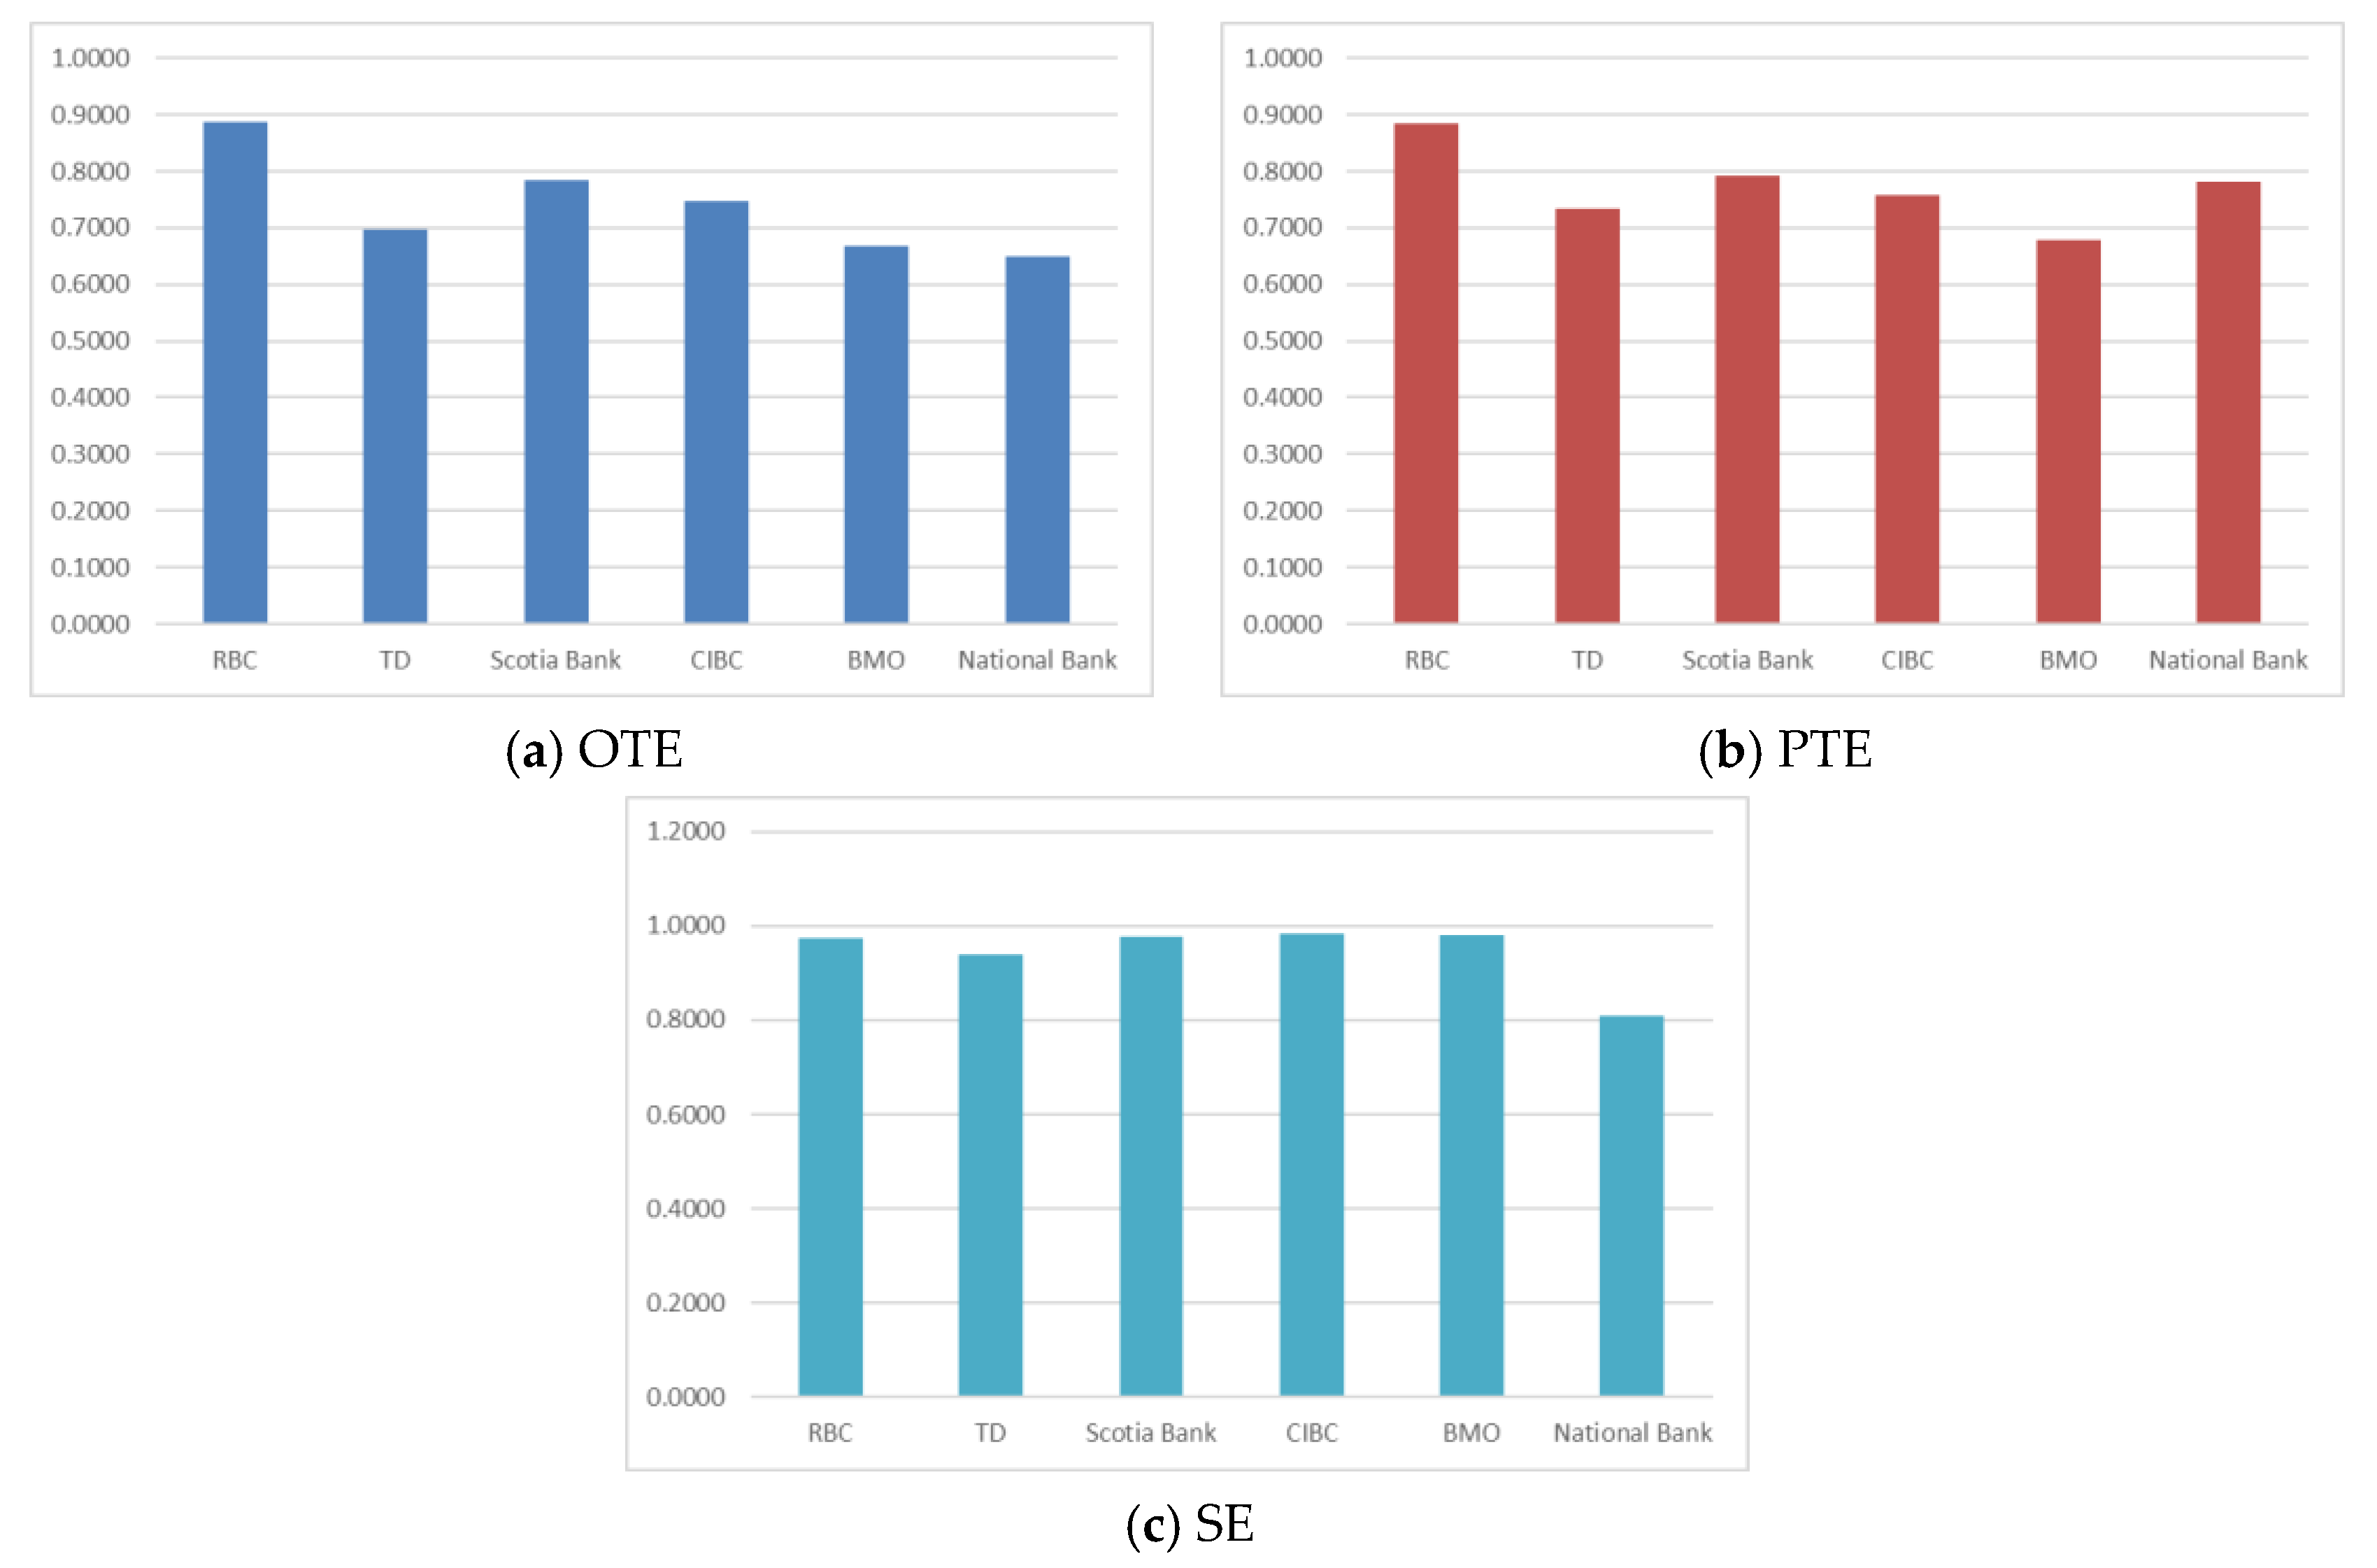
Finally, we can see that the banks do not show consistent performance in all stages. For instance, NBC, despite having the highest OTE and PTE in the second stage, has the lowest OTE in the third stage. Figure 5, Figure 6 and Figure 7 show the efficiencies of the banks in all three stages.
In the first stage, in terms of overall technical efficiency, CIBC has the best performance. Interestingly, although NBC has the lowest OTE, it has the highest pure technical efficiency. This observation shows that managerial issues play a greater role in NBC in comparison to other banks.
In the second stage, NBC is the most efficient bank in terms of overall technical efficiency and pure technical efficiency. In fact, by comparing the results with Table 1, we can see that NBC has a very low rate of impaired loans. This indicates that NBC has a proper process of risk measurement in their loans, and that is one of the main reasons they have high efficiency in the second stage. In addition, the results indicate that, in the second stage, the larger banks in terms of total assets have a lower performance. In terms of overall technical efficiency and scale efficiency, TD has the lowest score. Moreover, RBC is in the fifth position in terms of OTE, PTE, and SE.
Although RBC does not have a good performance in the second stage, it has the highest OTE and PTE in the third stage, followed by Scotia Bank. Despite the good performance of NBC in the second stage, it has the lowest OTE and SE. In terms of pure technical efficiency, BMO is in last place. Besides, note that although Scotia Bank does not have the highest OTE or PTE in any of the stages, it performs consistently well in all stages. Scotia Bank is in the second position in all the stages in terms of overall and pure technical efficiencies.
By comparing the results in the second and the third stages, we can observe the importance of considering revenue generation as a separate stage. Performing well in terms of the level of loans and investments does not necessarily translate to higher income. For instance, RBC and NBC have a substantially inconsistent performance in these two stages. It can be concluded that separating these two stages can provide a better insight about the efficiencies of the banks.
We also conducted a pairwise t-test to compare the efficiencies of the banks in the first, second, and third stages. Table 7 presents the results of these tests. In this table, the first column shows the pair of banks that are compared, the second column shows the type of efficiency that is calculated, and the p-value of the t-test is reported in the third column. Please note that, in this table, we only report the p-values for the tests that are statistically significant at 1%, 5%, and 10%.
In the first stage, the difference between the overall technical efficiency of NBC and the other banks is statistically significant. This result suggests that NBC has a problem in attracting deposits. However, this problem is mainly due to managerial issues rather than the smaller size of NBC. This fact can be concluded from the higher PTE of NBC in comparison to other banks. CIBC has the highest OTE, and it is significantly higher than RBC’s, TD’s, and Scotia’s OTE. One of the reasons for this observation is the proficiency of CIBC in online banking and digital services, which has resulted in lower costs for CIBC while maintaining a high level of deposits. According to Global Finance magazine, in 2019, CIBC was the best consumer digital bank in North America. In this stage, in terms of pure technical efficiency, NBC has the highest score. In fact, the difference between NBC’s PTE and the other banks’ PTE is statistically significant. One important factor that has resulted in high NBC’s PTE is the relatively smaller size of NBC in terms of assets. The substantial difference between the performance of NBC in terms of OTE and PTE has resulted in a statistically significant lower performance of this bank in terms of scale efficiency.
In the second stage, NBC is the most efficient bank in terms of overall technical efficiency, and the difference between NBC and other banks is statistically significant. NBC also has the highest score in terms of pure technical efficiency and scale efficiency. In terms of PTE, the difference between NBC and Scotia and BMO is not statistically significant; however, in terms of SE, NBC has a significantly higher score compared to other banks. These observations indicate that NBC has an efficient risk management process. In fact, the percentage of impaired loans for NBC is 0.5%, which is the lowest among the studied banks. The percentage of impaired loans for the rest of the banks, on average, is 0.9%.
RBC has the best performance in terms of overall and technical efficiencies in the last stage. In fact, in terms of OTE, Scotia is the only bank that has difference with RBC that is not significant. In terms of PTE, RBC has a significantly higher efficiency in comparison to TD, CIBC, and BMO. In terms of scale efficiency, the top five Canadian banks do not show a significant difference in their efficiencies. Nevertheless, NBC has a significantly lower efficiency compared to these banks.
4.2.3. Network DEA vs. Black Box DEA
The network DEA provides a clear view of how different banks operate in different stages. Hence, banks can identify the operations that create inefficiencies in their system and implement more precise improvement strategies. In this section, we investigate the difference between the overall efficiencies measured by network DEA and Black box DEA. In the network DEA, we utilized a multiplicative approach to measure the overall efficiencies of the banks. In this approach, the overall efficiency is equal to the product of efficiencies in the three stages. In addition, in the black box model, we assumed that the banking process has one stage in which the total assets, number of employees, and the other operating costs are the inputs, and the interest and non-interest incomes are the outputs. The average values of the efficiency scores obtained from both DEA models over the study period (2000–2017) are presented in Table 8.
A quick glance at Table 8 reveals that the calculated efficiencies in the network DEA are relatively lower than that of the black box model. This can be associated with the multiplicative approach that we have implemented to calculate the overall efficiencies in the network DEA.
However, it can be observed that the two models rank the banks differently in terms of their efficiencies. The results of the network DEA suggest that Scotia has the highest overall OTE, while black box model recommends RBC as the most efficient bank. We also see a discrepancy between the results of network and black box DEA in terms of PTE. For instance, while in the network DEA Scotia has the second-highest score, black box DEA suggests that Scotia has the fifth highest score. The results are even more divergent in terms of scale efficiency. The only alignment between the results is NBC, which is ranked last by both models.
The results of black box DEA is significantly affected by the revenue generation stage. In terms of OTE, the results of black box DEA and the revenue generation stage are completely aligned. This observation can be due to the importance of interest and non-interest incomes in black box DEA and the revenue generation stage. In addition, it shows how other aspects of the banking process are ignored in the black box DEA. For instance, the production stage can be significantly impacted by the digitization of the processes, which is an important facet of modern businesses. Nevertheless, black box DEA does not provide a clear picture of this aspect of the banking process.
5. Conclusions
As the pillar of the modern economy, the banking system has been of interest to many researchers. In this study, we focused on the efficiencies of the big six Canadian banks in the period of 2000 to 2017. We proposed a new three-stage network DEA model with bootstrapping to measure the efficiencies of the banks and identify the best practices in the industry that can be used as benchmarks to achieve economic sustainability. In this model, in addition to the production and investment stages, we considered the revenue generation stage as an important element of the banking process. Our results show that the big six Canadian banks have relatively high efficiency in the studied period for all the stages. The 2007 financial crisis has resulted in a decline in the efficiencies of the banks in all stages; however, our results suggest that this decline was not significant in the overall technical efficiency of the first stage and the overall and pure technical efficiencies of the second stage. This behavior can be traced back to the resilience of the Canadian banking system. The revenue generation stage of the Canadian banking sector received the biggest hit in the financial crisis. Nevertheless, after 2010, the big six Canadian banks demonstrated a steady recovery.
By comparing the efficiencies of the banks, we observed that the banks do not show a consistent performance in all the stages. In the production stage, CIBC has the highest OTE, while NBC has the highest PTE. In the investment stage, NBC is the most efficient bank in terms of both OTE and PTE. In the revenue generation stage, RBC has the highest OTE and PTE. Moreover, Scotia Bank shows the most consistent performance in all the stages by being ranked second in terms of OTE and PTE.
Finally, we compared the results of the network DEA with the black box DEA and concluded that not only the network DEA provides more insightful results, but the results between the network DEA and the black box DEA are not necessarily aligned. This observation is consistent with the findings of Wang et al. (2014b) and Fukuyama and Matousek (2011).
Our study has, however, a few limitations. The first one has to do with the choice of the input and output variables for the DEA models. Indeed, the results of the models are sensitive to these choices. An interested reader could refer to Botti et al. (2014) and Boubaker et al. (2018). Another limitation is the static nature of the DEA models. Extending the model into a dynamic multi-period setting can provide new insights into the efficiency of the Canadian banking system. In addition, in our study, we focused on the corporate level and did not evaluate the efficiencies of banks branches’ efficiencies. Incorporating the model to measure the efficiencies of the branches can develop a better understanding of where the banks should focus on to improve their system.
Author Contributions
Conceptualization, M.D., A.G., and P.M.T.; methodology, M.D., A.G., P.M.T.; software, M.D.; validation, M.D., A.G., and P.M.T.; formal analysis, M.D., A.G., and P.M.T.; investigation, M.D., A.G., and P.M.T.; resources, M.D., A.G., and P.M.T.; data curation, M.D.; writing—original draft preparation, M.D., A.G., and P.M.T.; writing—review and editing, M.D., A.G., and P.M.T. All authors have read and agreed to the published version of the manuscript.
Funding
This research received no external funding.
Conflicts of Interest
The authors declare no conflict of interest.
References
- Akther, Syed, Hirofumi Fukuyama, and William L. Weber. 2013. Estimating two-stage network slacks-based inefficiency: An application to Bangladesh banking. Omega 41: 88–96. [Google Scholar] [CrossRef]
- Asmild, Mette, Joseph C. Paradi, Vanita Aggarwall, and Claire Schaffnit. 2004. Combining DEA window analysis with the Malmquist index approach in a study of the Canadian banking industry. Journal of Productivity Analysis 21: 67–89. [Google Scholar] [CrossRef]
- Avkiran, Necmi K. 2009. Opening the black box of efficiency analysis: An illustration with UAE banks. Omega 37: 930–941. [Google Scholar] [CrossRef]
- Avkiran, Necmi Kemal. 2015. An illustration of dynamic network DEA in commercial banking including robustness tests. Omega 55: 141–50. [Google Scholar] [CrossRef]
- Bank of Canada. 2019. Selected Historical Interest Rates. Available online: https://www.bankofcanada.ca/rates/interest-rates/selected-historical-interest-rates/ (accessed on 26 January 2019).
- Banker, Rajiv D., Abraham Charnes, and William Wager Cooper. 1984. Some models for estimating technical and scale inefficiencies in data envelopment analysis. Management Science 30: 1078–92. [Google Scholar] [CrossRef] [Green Version]
- Banker, Rajiv D., Robert F. Conrad, and Robert P. Strauss. 1986. A comparative application of data envelopment analysis and translog methods: An illustrative study of hospital production. Management Science 32: 30–44. [Google Scholar] [CrossRef]
- Banker, Rajiv D., Abraham Charnes, William W. Cooper, and Ajay Maindiratta. 1988. A comparison of DEA and translog estimates of production frontiers using simulated observations from a known technology. In Applications of Modern Production Theory: Efficiency and Productivity. Dordrecht: Springer, pp. 33–55. [Google Scholar]
- Botti, Laurent, Sabri Boubaker, Amal Hamrouni, and Bernardin Solonandrasana. 2014. Corporate governance efficiency and internet financial reporting quality. Review of Accounting and Finance 13: 43–64. [Google Scholar] [CrossRef]
- Boubaker, Sabri, Asma Houcine, Zied Ftiti, and Hatem Masri. 2018. Does audit quality affect firms’ investment efficiency? Journal of the Operational Research Society 69: 1688–99. [Google Scholar] [CrossRef]
- Canadian Bankers Association. 2014. Competition, Choice and Innovation—Driving the Customer Experience in Banking. Available online: https://cba.ca/competition-choice-and-innovation-driving-the-customer-experience (accessed on 9 February 2019).
- Canadian Bankers Association. 2018. Focus: Fast Facts About the Canadian Banking System. Available online: https://cba.ca/fast-facts-the-canadian-banking-system?l=en-us (accessed on 9 February 2019).
- Chao, Chuang-Min, Ming-Miin Yu, and Hsiao-Ning Wu. 2015. An application of the dynamic network DEA model: The case of banks in Taiwan. Emerging Markets Finance and Trade 51: S133–S151. [Google Scholar] [CrossRef]
- Charnes, Abraham, William W. Cooper, and Edwardo Rhodes. 1978. Measuring the efficiency of decision making units. European Journal of Operational Research 2: 429–44. [Google Scholar] [CrossRef]
- Cooper, William W., Kyung Sam Park, and Gang Yu. 2001. An illustrative application of IDEA (imprecise data envelopment analysis) to a Korean mobile telecommunication company. Operations Research 49: 807–20. [Google Scholar] [CrossRef]
- Daraio, Cinzia, and Leopold Simar. 2007. The measurement of efficiency. In Advanced Robust and Nonparametric Methods in Efficiency Analysis. Boston: Springer. [Google Scholar]
- DeYoung, Robert, and Tara Rice. 2004. How do banks make money? A variety of business strategies. Economic Perspectives-Federal Reserve Bank of Chicago 28: 52. [Google Scholar]
- Dia, Mohamed, Kobana Abukari, Pawoumodom M. Takouda, and Abdelouahid Assaidi. 2019a. Relative efficiency measurement of Canadian mining companies. International Journal of Applied Management Science 11: 224–42. [Google Scholar] [CrossRef]
- Dia, Mohamed, Pawoumodom Takouda, and Amirmohsen Golmohammadi. 2019b. Efficiency Measurement of Canadian Oil and Gas Companies. International Journal of Operational Research. [Google Scholar] [CrossRef]
- Ebrahimnejad, Ali, Madjid Tavana, Farhad Hosseinzadeh Lotfi, Reza Shahverdi, and Mohamad Yousefpour. 2014. A three-stage data envelopment analysis model with application to banking industry. Measurement 49: 308–19. [Google Scholar] [CrossRef]
- Emrouznejad, Ali, and Guo-liang Yang. 2018. A survey and analysis of the first 40 years of scholarly literature in DEA: 1978–2016. Socio-Economic Planning Sciences 61: 4–8. [Google Scholar] [CrossRef]
- Färe, Rolf, Shawna Grosskopf, and Gerald Whittaker. 2007. Network DEA. In Modeling Data Irregularities and Structural Complexities in Data Envelopment Analysis. Edited by Joe Zhu and Wade D. Cook. Boston: Springer. [Google Scholar]
- Fethi, Meryem Duygun, and Fotios Pasiouras. 2010. Assessing bank efficiency and performance with operational research and artificial intelligence techniques: A survey. European Journal of Operational Research 204: 189–98. [Google Scholar] [CrossRef]
- Fixler, Dennis J., and Kimberly D. Zieschang. 1993. An index number approach to measuring bank efficiency: An application to mergers. Journal of Banking & Finance 17: 437–50. [Google Scholar]
- Fukuyama, Hirofumi, and Roman Matousek. 2011. Efficiency of Turkish banking: Two-stage network system. Variable returns to scale model. Journal of International Financial Markets, Institutions and Money 21: 75–91. [Google Scholar] [CrossRef]
- Fukuyama, Hirofumi, and Roman Matousek. 2017. Modelling bank performance: A network DEA approach. European Journal of Operational Research 259: 721–32. [Google Scholar] [CrossRef]
- Fukuyama, Hirofumi, and William L. Weber. 2015. Measuring Japanese bank performance: A dynamic network DEA approach. Journal of Productivity Analysis 44: 249–64. [Google Scholar] [CrossRef]
- Gambacorta, Leonardo. 2008. How do banks set interest rates? European Economic Review 52: 792–819. [Google Scholar] [CrossRef] [Green Version]
- Gauthier, Céline, and Hajime Tomura. 2011. Understanding and Measuring Liquidity Risk: A Selection of Recent Research. Bank of Canada Review 2011: 3–11. [Google Scholar]
- Gueyié, Jean-Pierre, Alaa Guidara, and Van Son Lai. 2019. Banks’ non-traditional activities under regulatory changes: Impact on risk, performance and capital adequacy. Applied Economics 51: 3184–97. [Google Scholar] [CrossRef]
- Holod, Dmytro, and Herbert F. Lewis. 2011. Resolving the deposit dilemma: A new DEA bank efficiency model. Journal of Banking & Finance 35: 2801–10. [Google Scholar]
- Jacobs, Rowena. 2001. Alternative methods to examine hospital efficiency: Data envelopment analysis and stochastic frontier analysis. Health Care Management Science 4: 103–15. [Google Scholar] [CrossRef]
- Kaffash, Sepideh, and Marianna Marra. 2017. Data envelopment analysis in financial services: A citations network analysis of banks, insurance companies and money market funds. Annals of Operations Research 253: 307–44. [Google Scholar] [CrossRef] [Green Version]
- Lin, Tzu-Yu, and Sheng-Hsiung Chiu. 2013. Using independent component analysis and network DEA to improve bank performance evaluation. Economic Modelling 32: 608–16. [Google Scholar] [CrossRef]
- Matthews, Kent. 2013. Risk management and managerial efficiency in Chinese banks: A network DEA framework. Omega 41: 207–15. [Google Scholar] [CrossRef] [Green Version]
- McMillan, Melville L., and Debasish Datta. 1998. The relative efficiencies of Canadian universities: A DEA perspective. Canadian Public Policy/Analyse de Politiques 24: 485–511. [Google Scholar] [CrossRef]
- Melnick, Edward L, Praveen R Nayyer, Michael L Pinedo, and Sridhar Seshadri. 2012. Creating Value in Financial Services: Strategies, Operations and Technologies. Berlin: Springer Science & Business Media. [Google Scholar]
- Mohsni, Sana, and Isaac Otchere. 2018. Does regulatory regime matter for bank risk taking? A comparative analysis of US and Canada. Journal of International Financial Markets, Institutions and Money 53: 1–16. [Google Scholar] [CrossRef]
- Office of Superintendent of Financial Institutions. 2010. Impairment-Sound Credit Risk Assessment and Valuation of Financial Instruments at Amortized Cost. Available online: http://www.osfi-bsif.gc.ca/Eng/fi-if/rg-ro/gdn-ort/gl-ld/Pages/c1_ifrs.aspx (accessed on 9 January 2019).
- Office of Superintendent of Financial Institutions. 2019. Financial Data for Banks. Available online: http://www.osfi-bsif.gc.ca/Eng/wt-ow/Pages/FINDAT.aspx (accessed on 26 January 2019).
- Paradi, Joseph C., and Claire Schaffnit. 2004. Commercial branch performance evaluation and results communication in a Canadian bank––A DEA application. European Journal of Operational Research 156: 719–35. [Google Scholar] [CrossRef]
- Paradi, Joseph C., and Haiyan Zhu. 2013. A survey on bank branch efficiency and performance research with data envelopment analysis. Omega 41: 61–79. [Google Scholar] [CrossRef]
- Paradi, Joseph C., Stephen Rouatt, and Haiyan Zhu. 2011. Two-stage evaluation of bank branch efficiency using data envelopment analysis. Omega 39: 99–109. [Google Scholar] [CrossRef]
- Paradi, Joseph C., Haiyan Zhu, and Barak Edelstein. 2012. Identifying managerial groups in a large Canadian bank branch network with a DEA approach. European Journal of Operational Research 219: 178–87. [Google Scholar] [CrossRef]
- Paradi, Joseph, Elizabeth Min, and Xiaopeng Yang. 2015. Evaluating Canadian bank branch operational efficiency from staff allocation: A DEA approach. Management and Organizational Studies 2: 52–65. [Google Scholar] [CrossRef] [Green Version]
- Sarkis, Joe. 2007. Preparing Your Data for DEA. In Modeling Data Irregularities and Structural Complexities in Data Envelopment Analysis. Edited by Wade D. Cook and Joe Zhu. Boston: Springer. [Google Scholar]
- Seccareccia, Mario. 2012. Financialization and the transformation of commercial banking: Understanding the recent Canadian experience before and during the international financial crisis. Journal of Post Keynesian Economics 35: 277–300. [Google Scholar] [CrossRef]
- Seiford, Lawrence M., and Joe Zhu. 1999. Profitability and marketability of the top 55 US commercial banks. Management Science 45: 1270–88. [Google Scholar] [CrossRef] [Green Version]
- Seiford, Lawrence M., and Joe Zhu. 2002. Modeling undesirable factors in efficiency evaluation. European Journal of Operational Research 142: 16–20. [Google Scholar] [CrossRef]
- Sherman, H. David, and Franklin Gold. 1985. Bank branch operating efficiency: Evaluation with data envelopment analysis. Journal of Banking & Finance 9: 297–315. [Google Scholar]
- Simar, Leopold, and Paul W. Wilson. 1998. Sensitivity analysis of efficiency scores: How to bootstrap in nonparametric frontier models. Management Science 44: 49–61. [Google Scholar] [CrossRef] [Green Version]
- Simar, Leopold, and Paul W. Wilson. 2000. Statistical inference in nonparametric frontier models: The state of the art. Journal of Productivity Analysis 13: 49–78. [Google Scholar] [CrossRef]
- Statistics Canada. 2019. Interest Rates 2009–2019. Available online: https://www.stats.gov.nl.ca/Statistics/Topics/trade/PDF/G_INTEREST.pdf (accessed on 26 January 2019).
- Toma, Pierluigi, Pier Paolo Miglietta, Giovanni Zurlini, Donatella Valente, and Irene Petrosillo. 2017. A non-parametric bootstrap-data envelopment analysis approach for environmental policy planning and management of agricultural efficiency in EU countries. Ecological Indicators 83: 132–43. [Google Scholar] [CrossRef]
- Truno, Matthieu, Andriy Stolyarov, Danny Auger, and Michel Assaf. 2017. Wholesale Funding of the Big Six Canadian Banks. Bank of Canada Review 2017: 42–55. [Google Scholar]
- Tsionas, Euthimios G., and Emmanuel C Mamatzakis. 2017. Adjustment costs in the technical efficiency: An application to global banking. European Journal of Operational Research 256: 640–49. [Google Scholar] [CrossRef] [Green Version]
- Wahab, Mohamed I. M., Desheng Wu, and Chi-Guhn Lee. 2008. A generic approach to measuring the machine flexibility of manufacturing systems. European Journal of Operational Research 186: 137–49. [Google Scholar] [CrossRef]
- Wang, Ke, Wei Huang, Jie Wu, and Ying-Nan Liu. 2014a. Efficiency measures of the Chinese commercial banking system using an additive two-stage DEA. Omega 44: 5–20. [Google Scholar] [CrossRef]
- Wang, Wei-Kang, Wen-Min Lu, and Pei-Yi Liu. 2014b. A fuzzy multi-objective two-stage DEA model for evaluating the performance of US bank holding companies. Expert Systems with Applications 41: 4290–97. [Google Scholar] [CrossRef]
- Wanke, Peter, and Carlos Barros. 2014. Two-stage DEA: An application to major Brazilian banks. Expert Systems with Applications 41: 2337–44. [Google Scholar] [CrossRef]
- Weill, Laurent. 2004. Measuring cost efficiency in European banking: A comparison of frontier techniques. Journal of Productivity Analysis 21: 133–52. [Google Scholar] [CrossRef]
- World Economic Forum. 2018. Global Competitiveness Index 2017–2018. Available online: http://reports.weforum.org/global-competitiveness-index-2017–2018/competitiveness-rankings/#series=EOSQ087 (accessed on 29 January 2019).
- Xu, Jiuping, Bin Li, and Desheng Wu. 2009. Rough data envelopment analysis and its application to supply chain performance evaluation. International Journal of Production Economics 122: 628–38. [Google Scholar] [CrossRef]
- Yang, Zijiang. 2009. Assessing the performance of Canadian bank branches using data envelopment analysis. Journal of the Operational Research Society 60: 771–80. [Google Scholar] [CrossRef]
- Yang, Chyan, and Hsian-Ming Liu. 2012. Managerial efficiency in Taiwan bank branches: A network DEA. Economic Modelling 29: 450–61. [Google Scholar] [CrossRef]
Figure 1.
Structure of the three-stage model. NB: * Since it is an undesired output, an inverse transformation of the impaired loans is applied as the output of the second stage.
Figure 1.
Structure of the three-stage model. NB: * Since it is an undesired output, an inverse transformation of the impaired loans is applied as the output of the second stage.
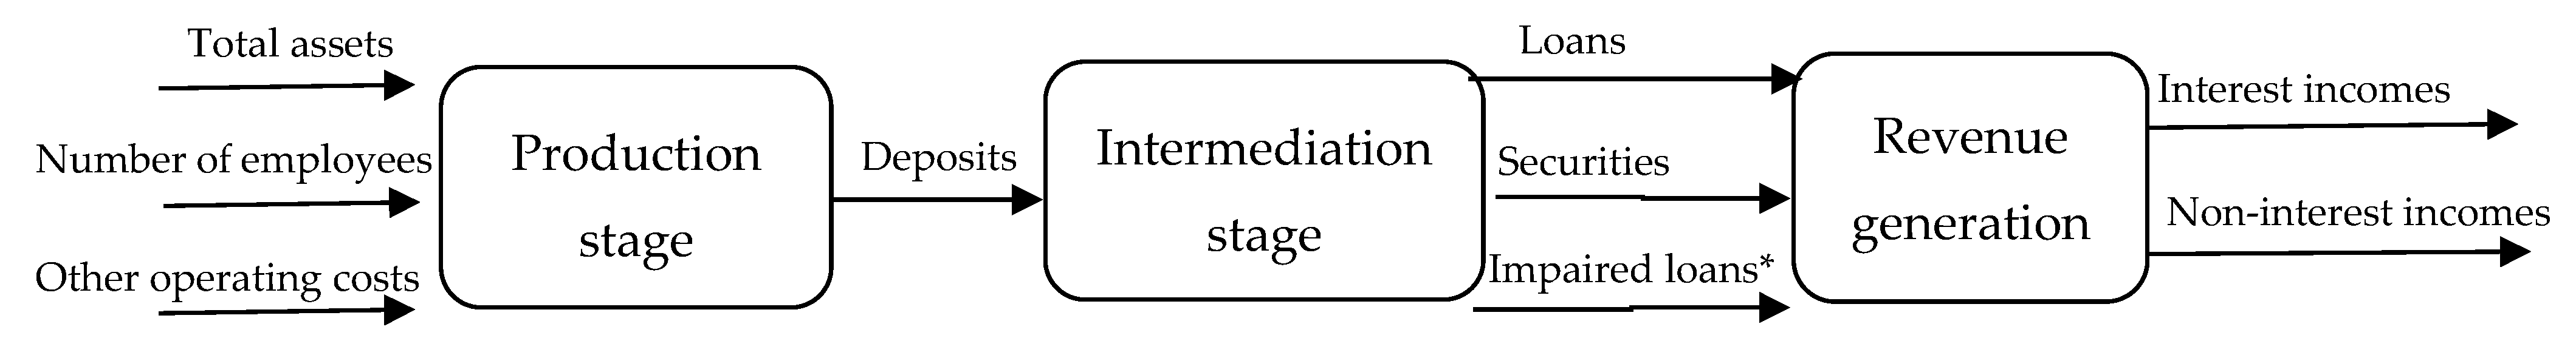
Figure 2.
Annual bootstrap OTE, bootstrap PTE, and the SE for the first stage.
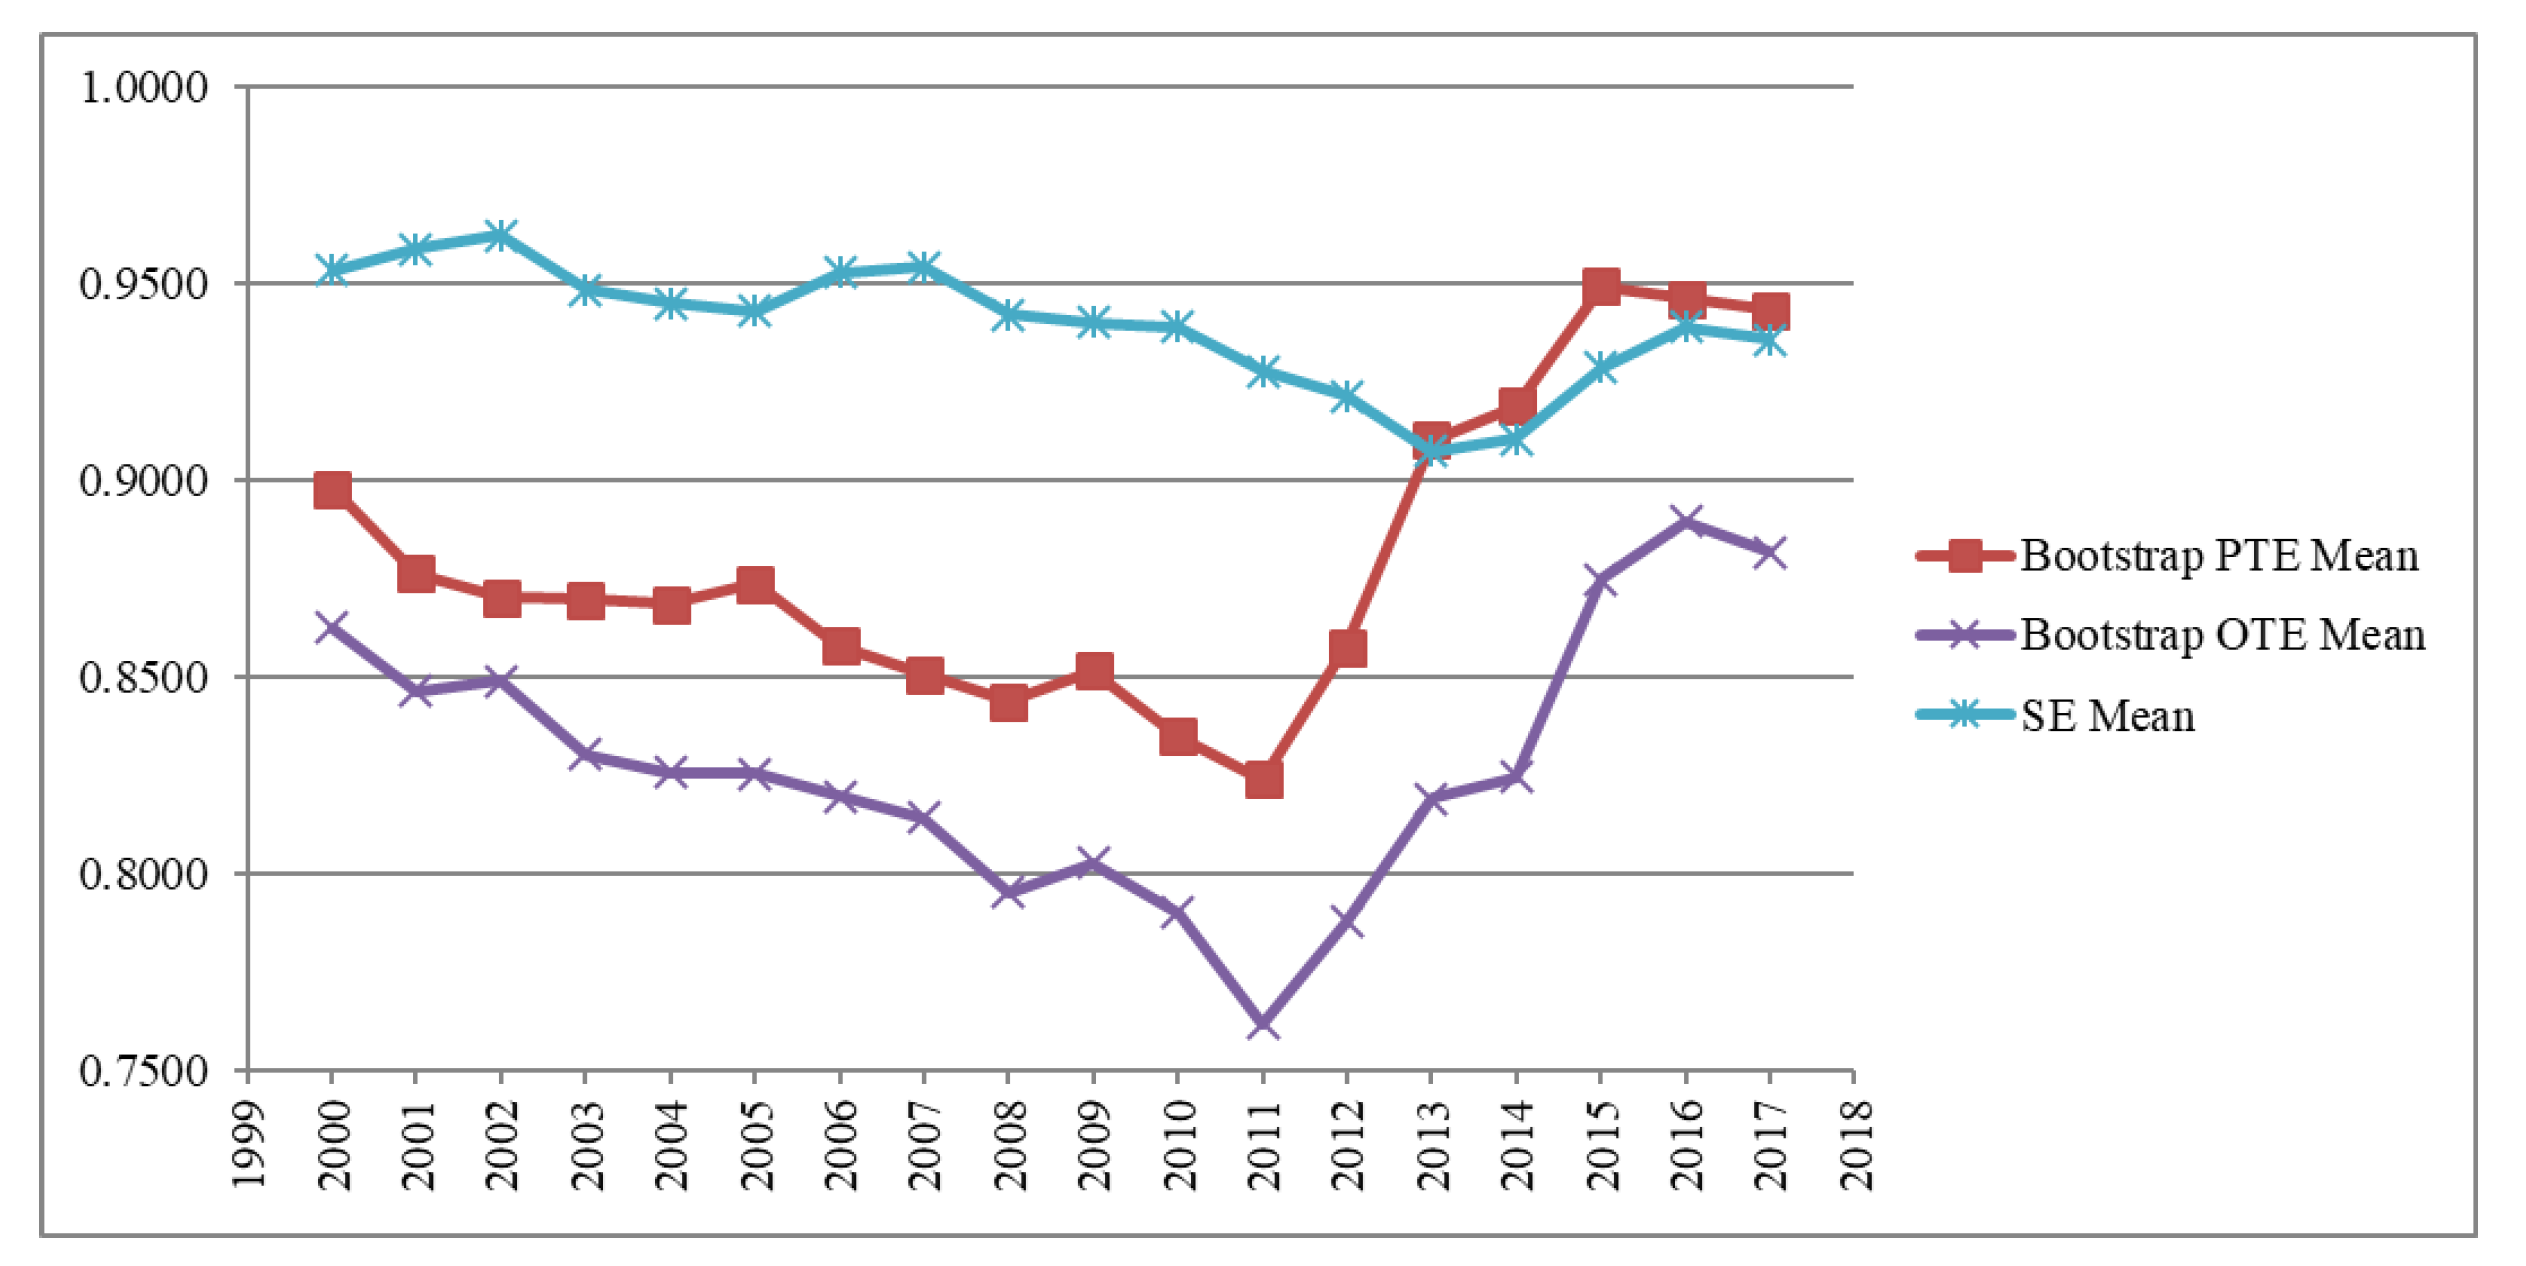
Figure 3.
Annual bootstrap OTE, bootstrap PTE, and the SE for the second stage.
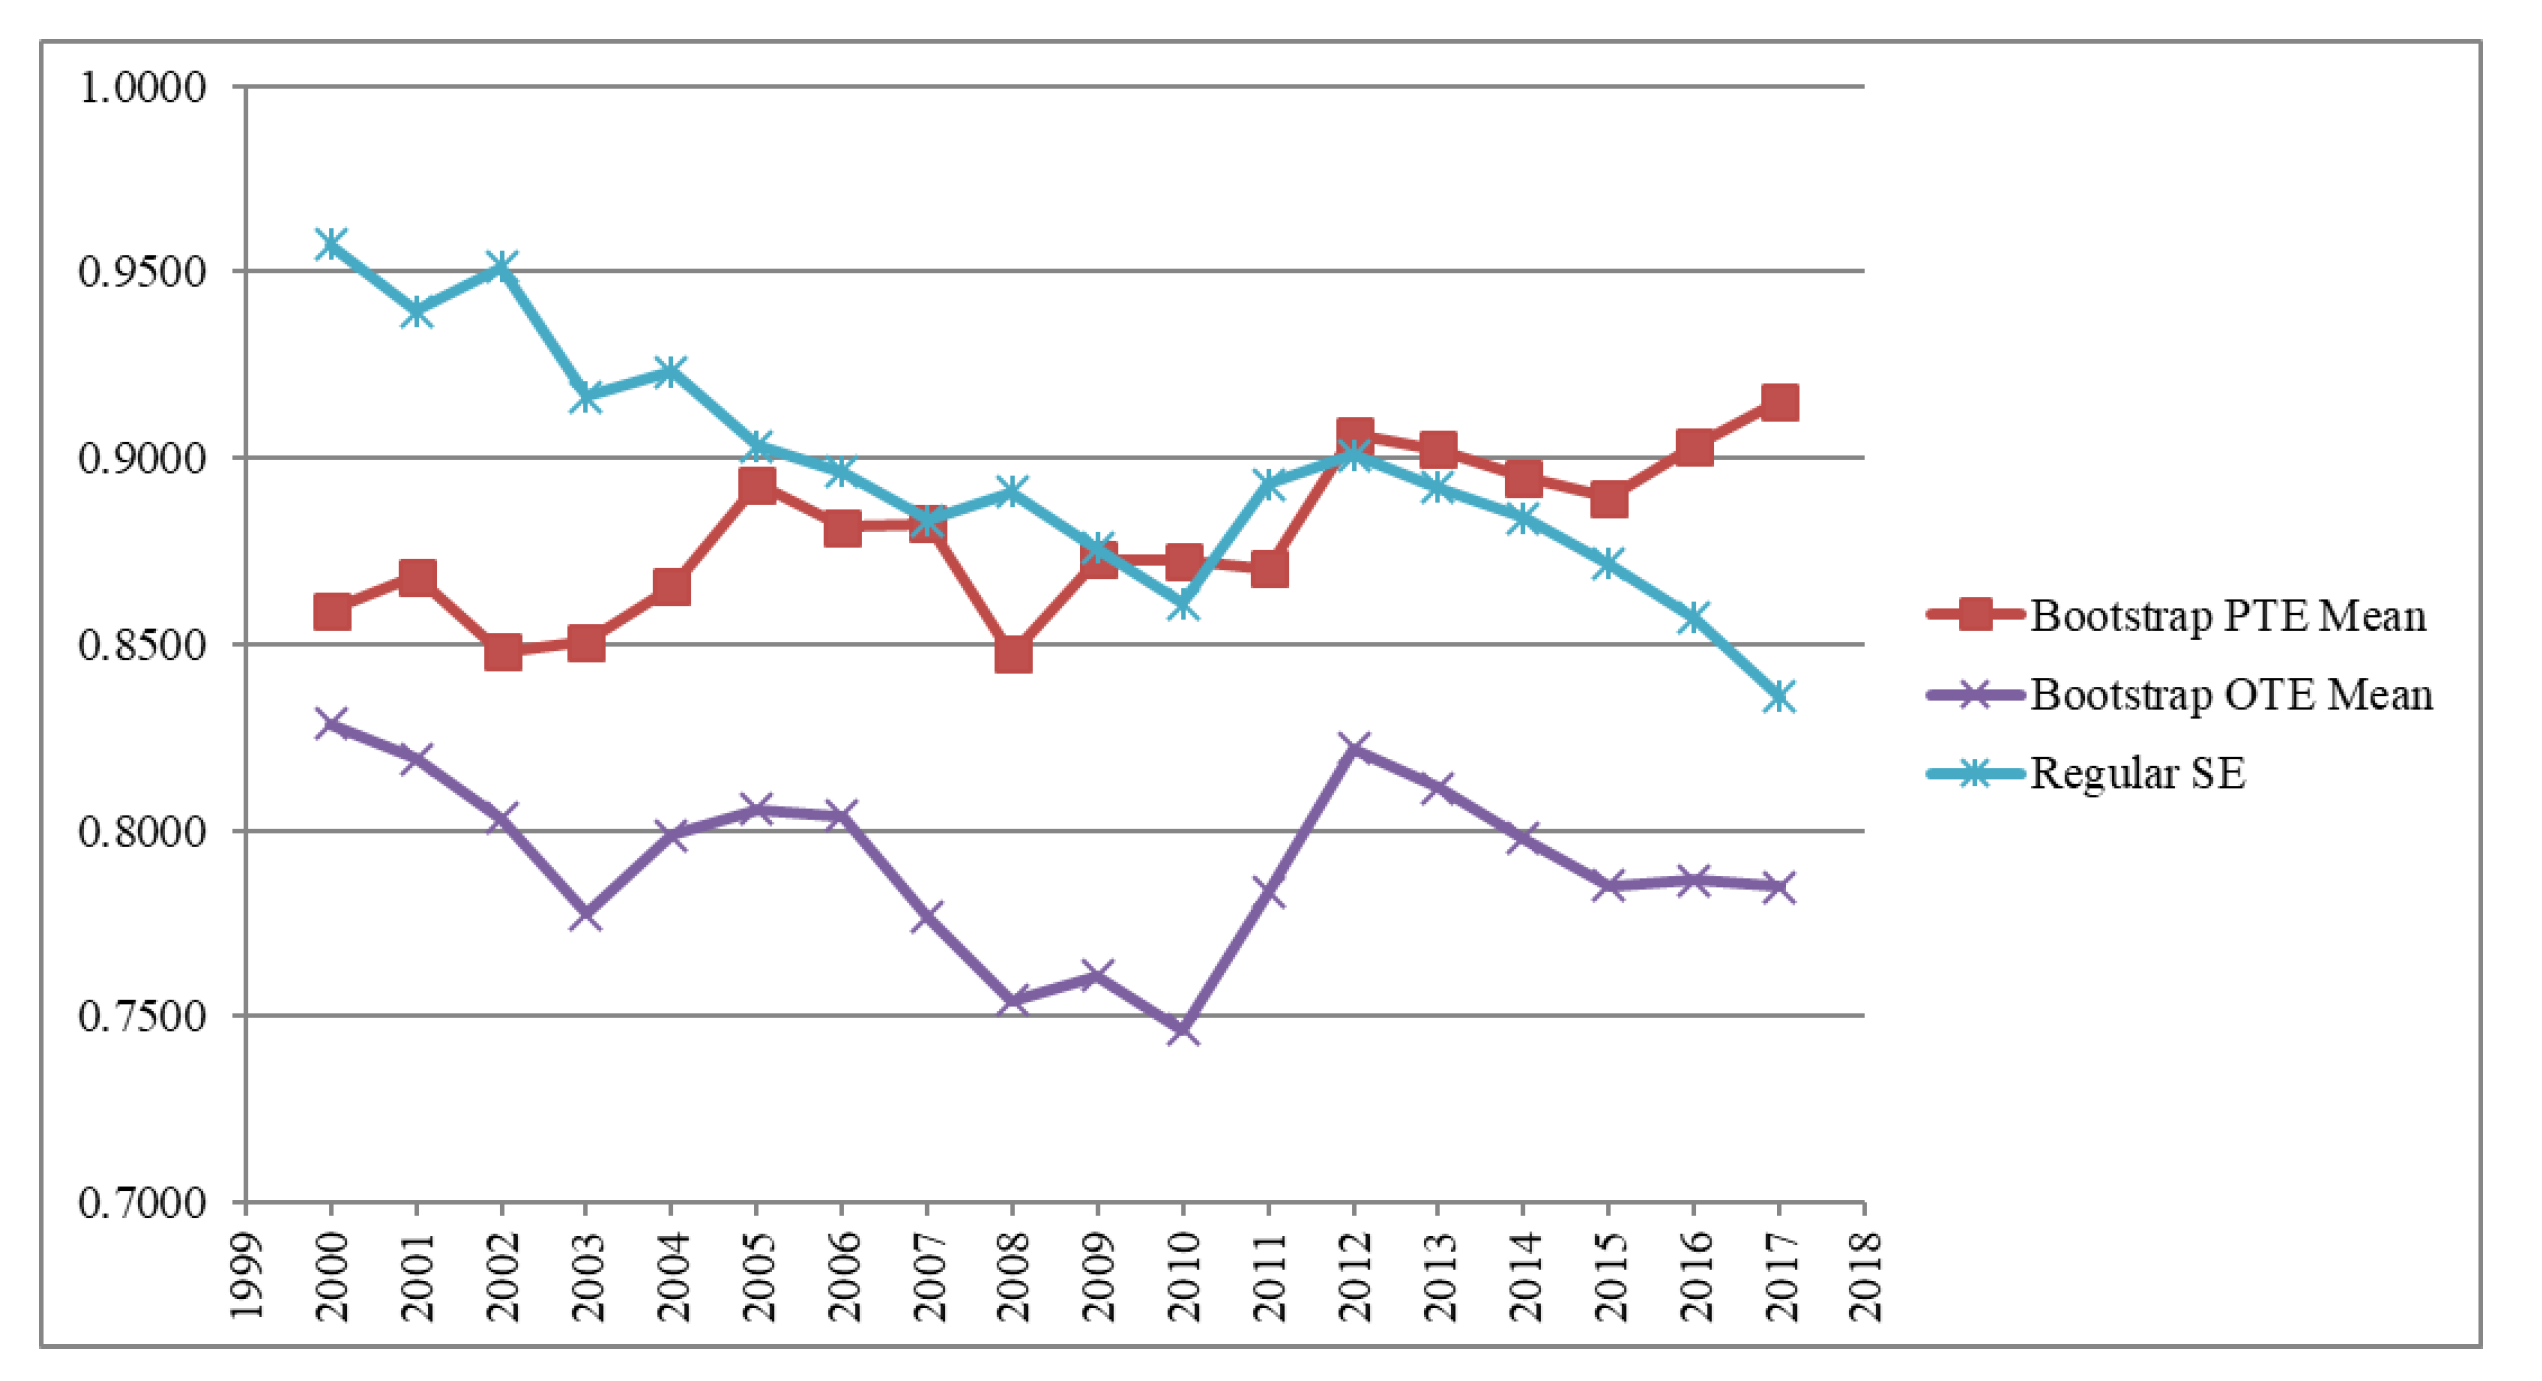
Figure 4.
Annual bootstrap OTE, bootstrap PTE, and the SE for the third stage.
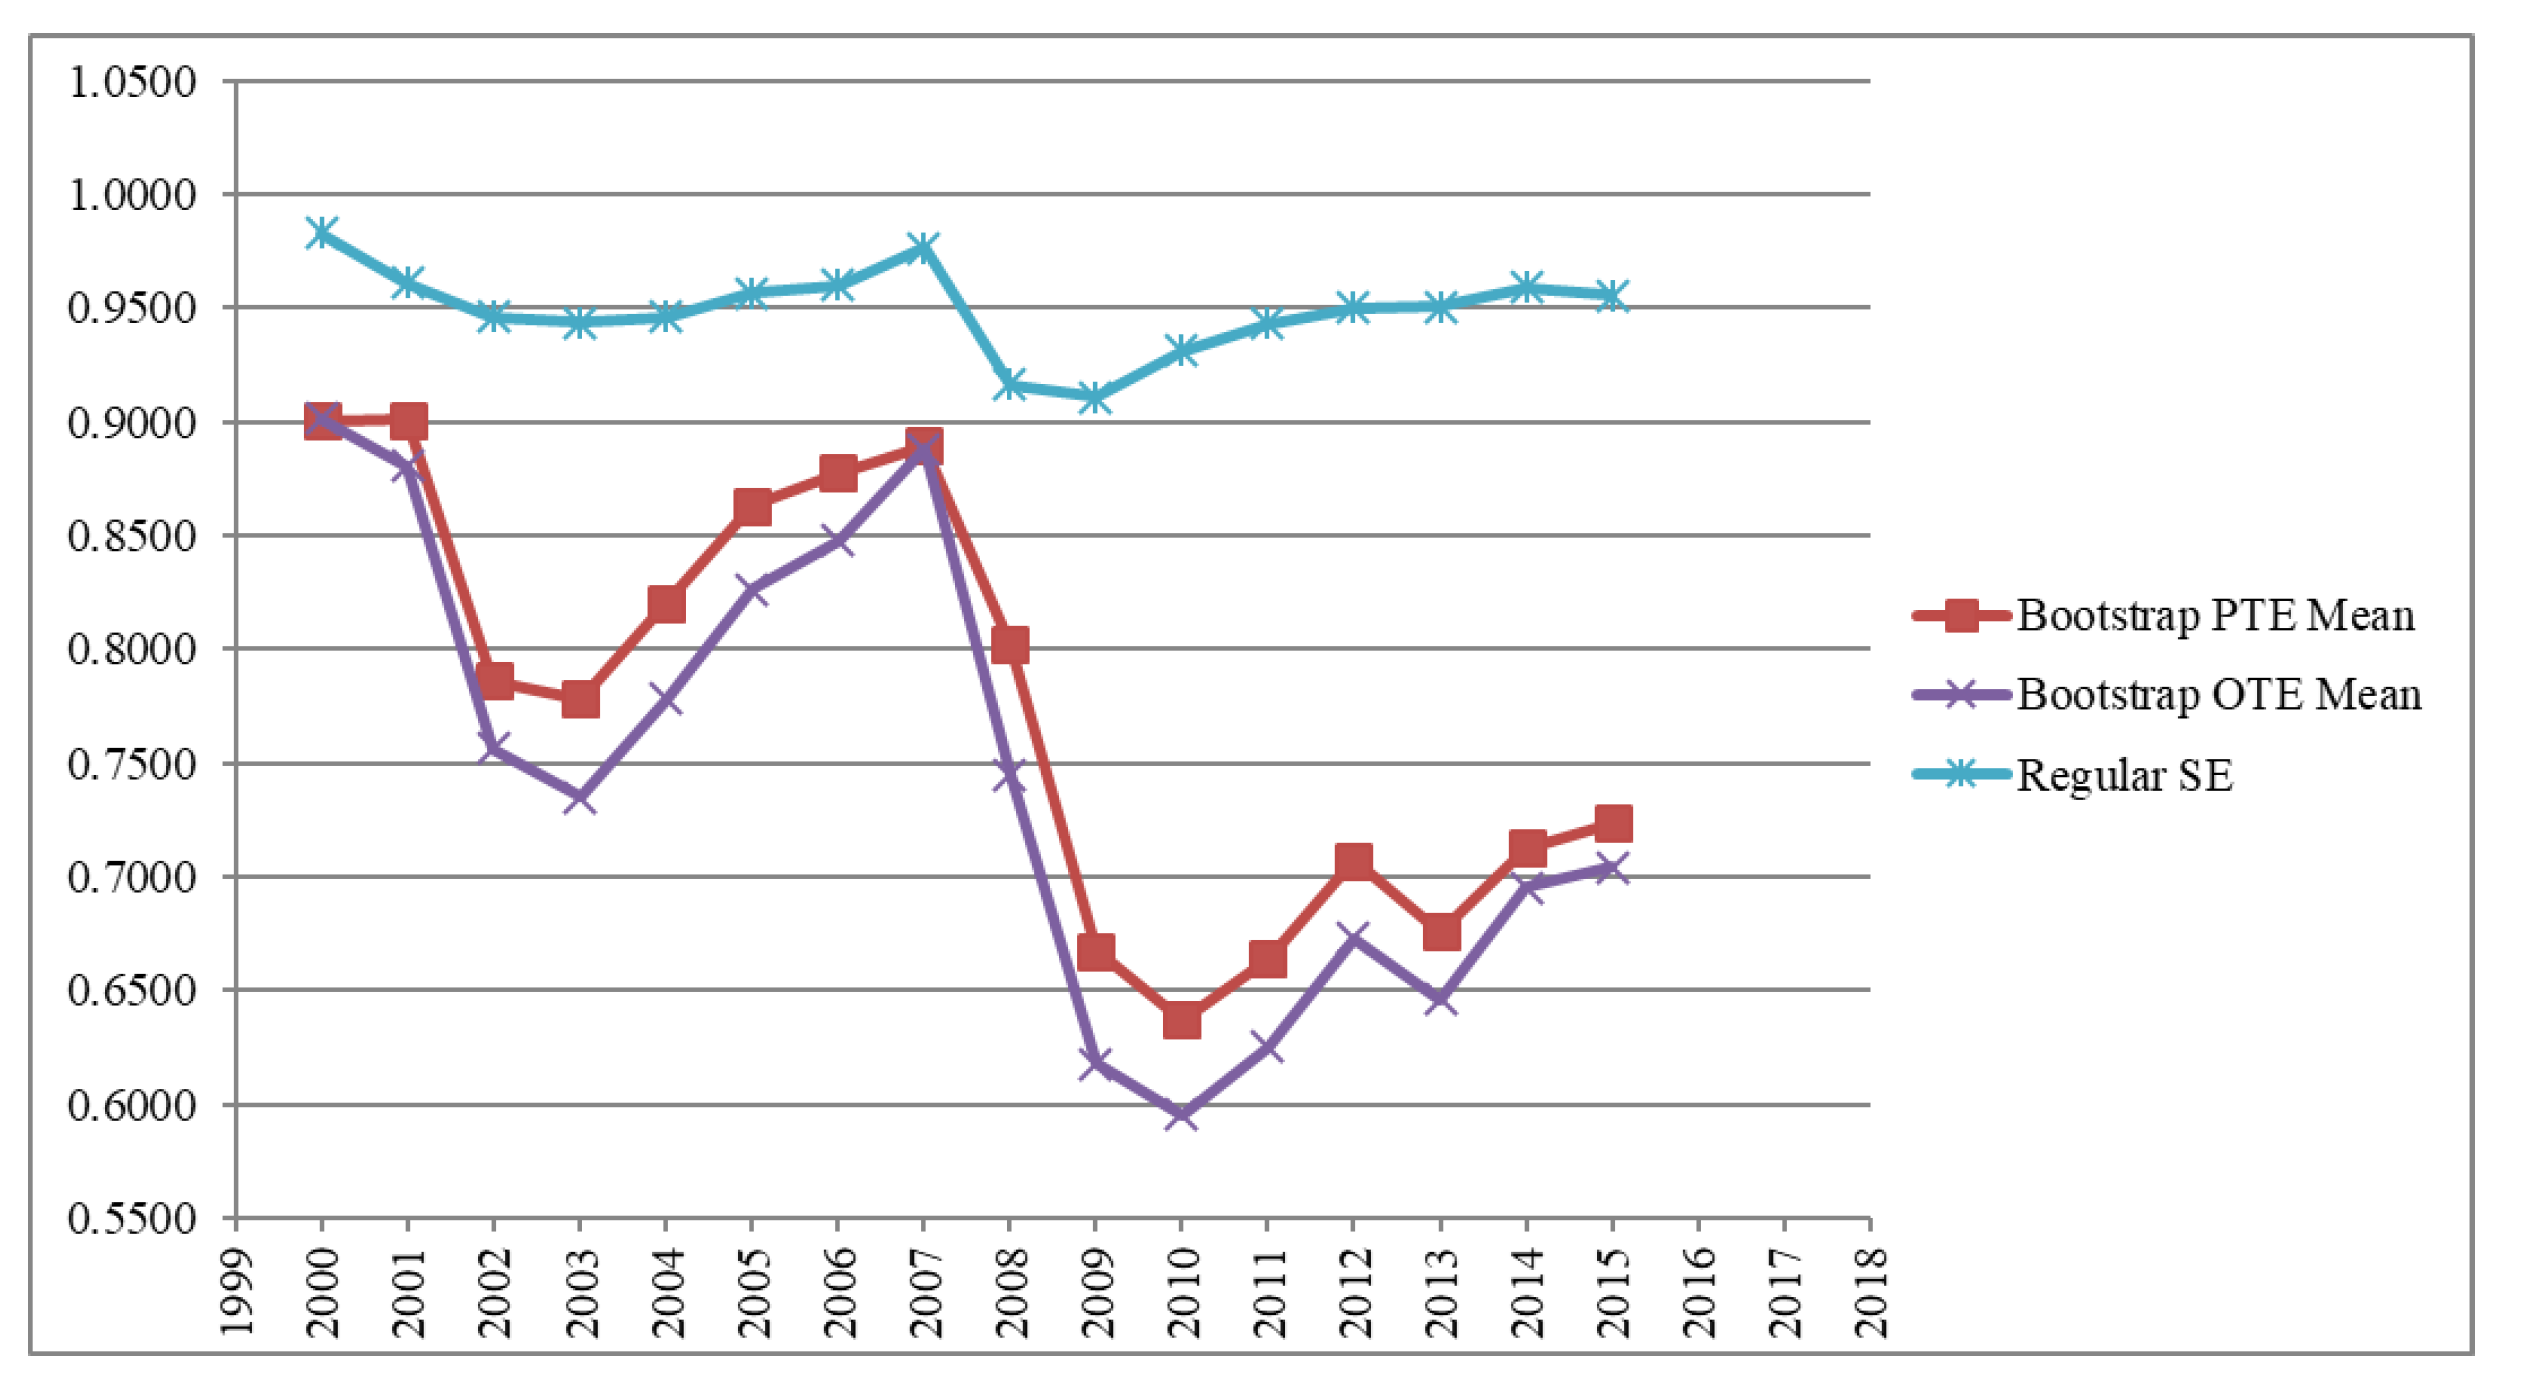
Figure 5.
Banks’ bootstrap OTE, bootstrap PTE, and the SE for the first stage.
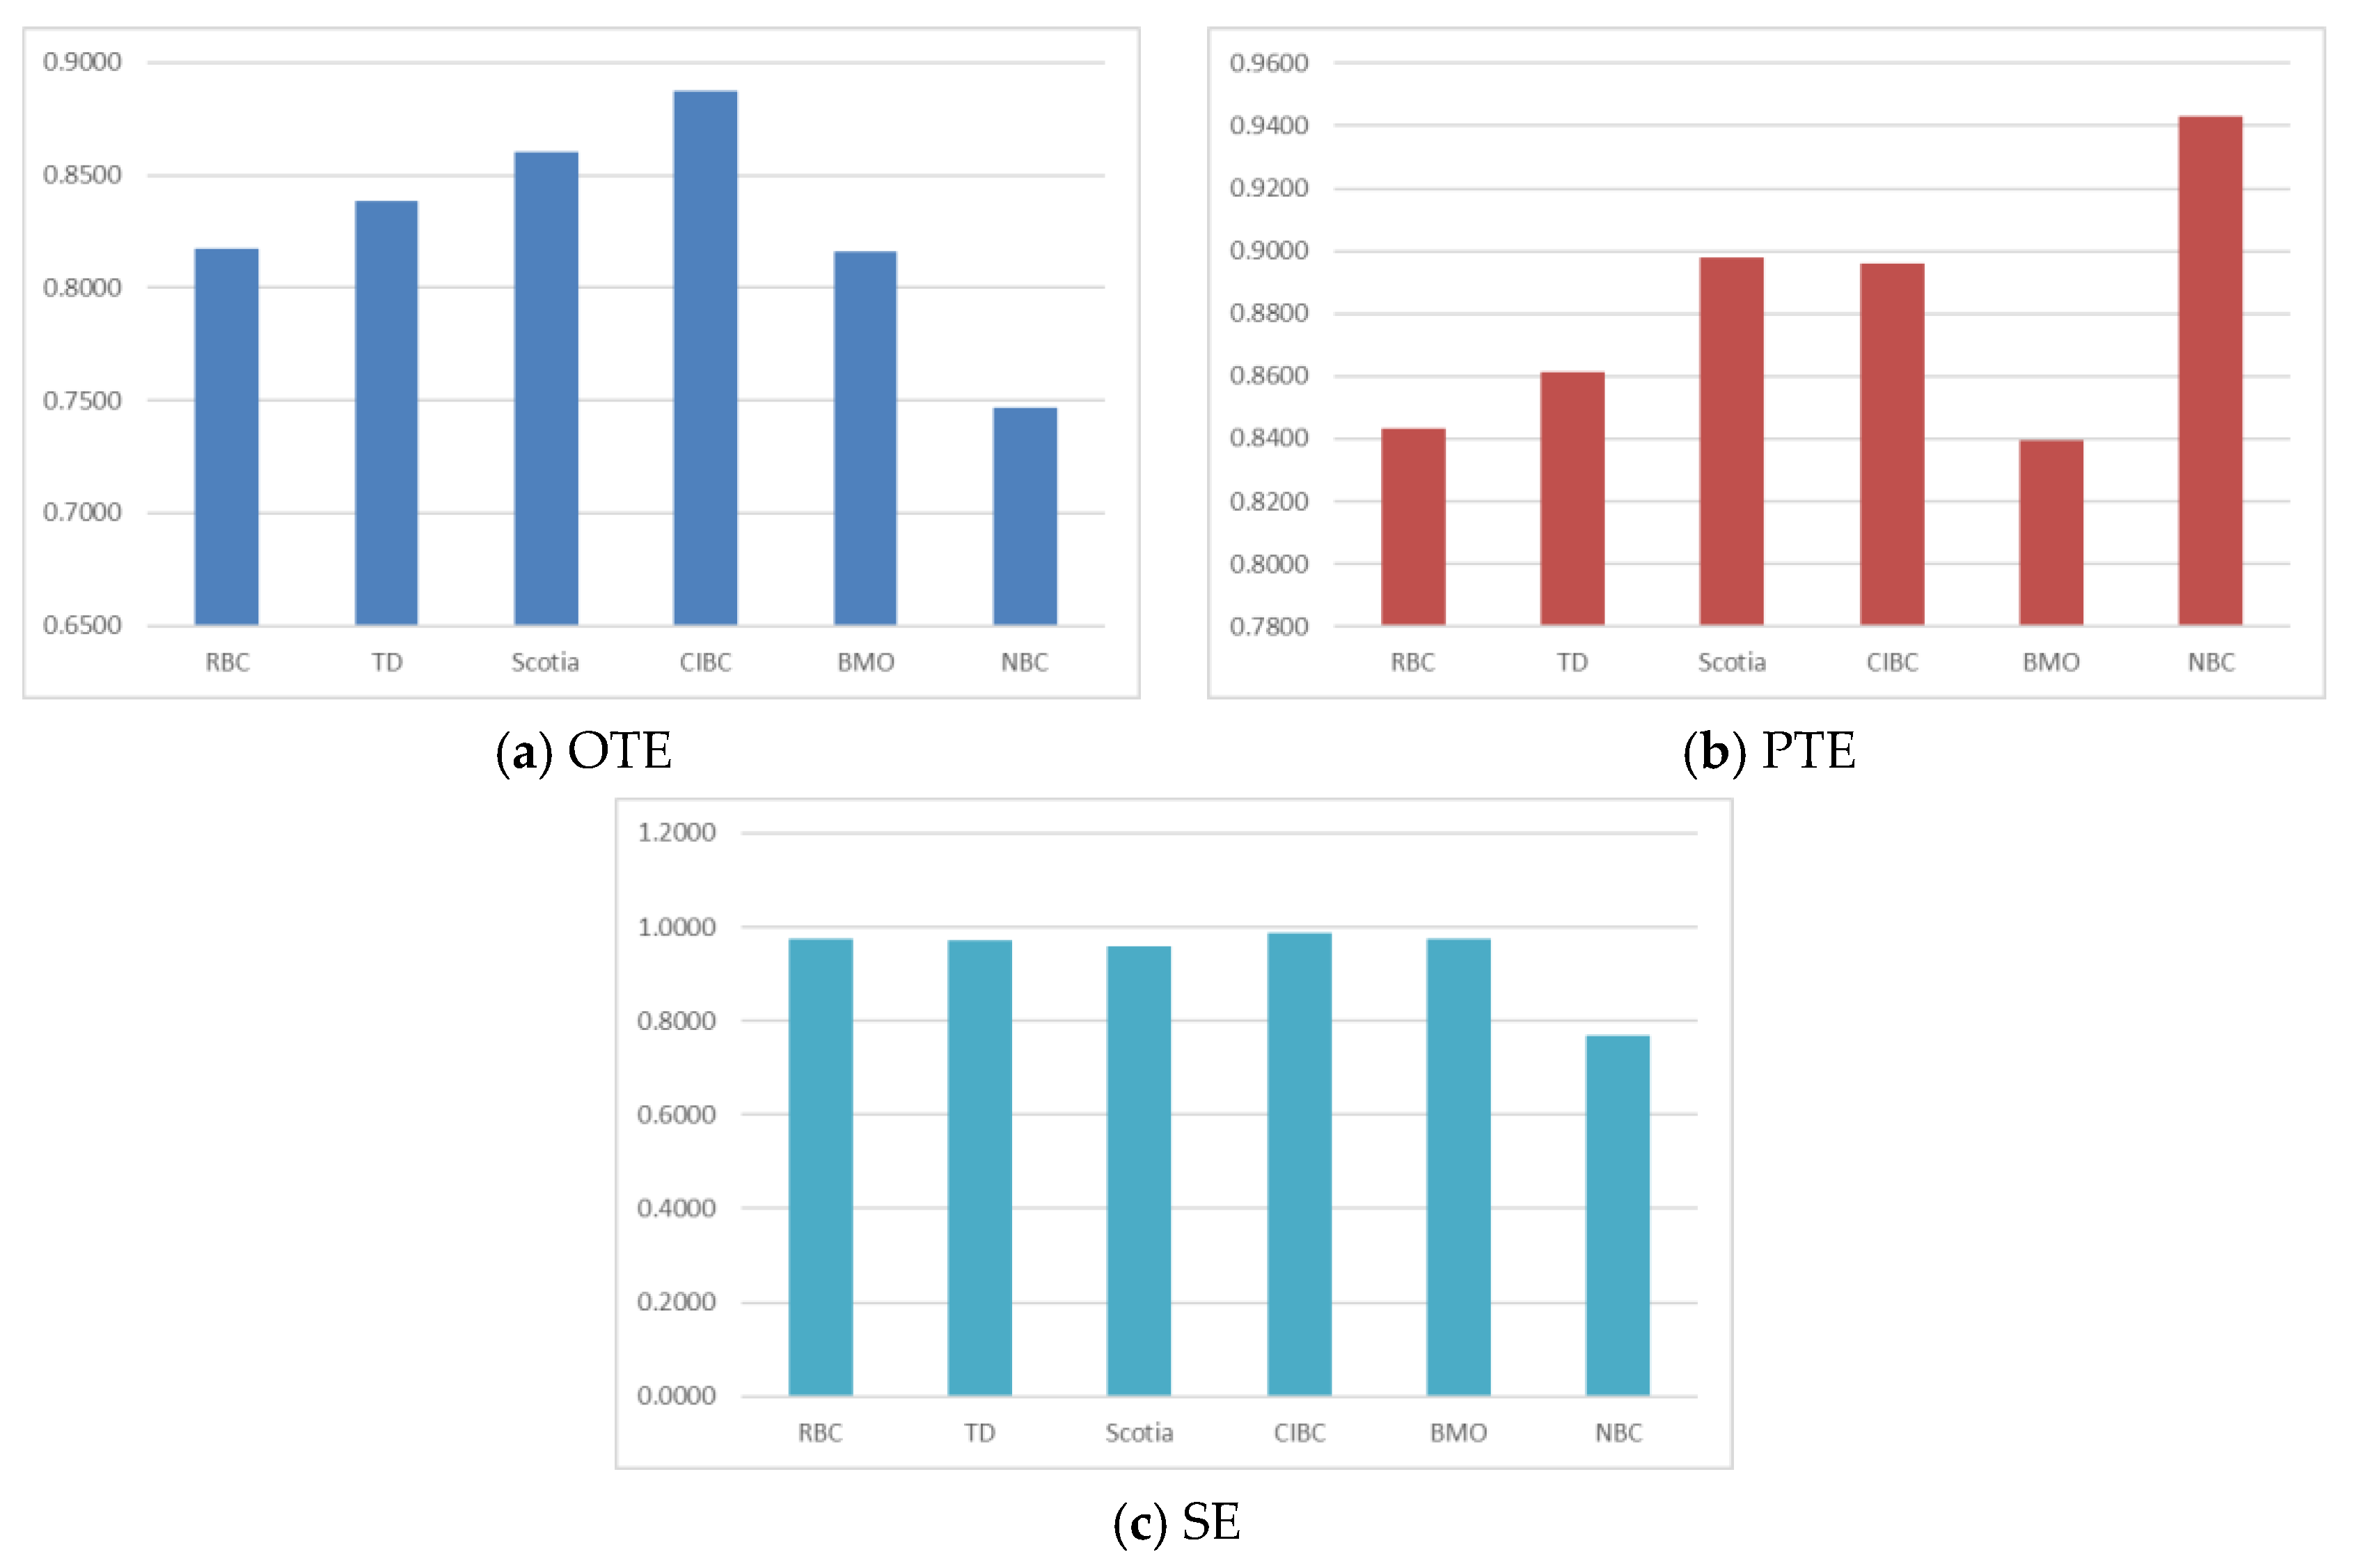
Figure 6.
Banks’ bootstrap OTE, bootstrap PTE, and the SE for the second stage.
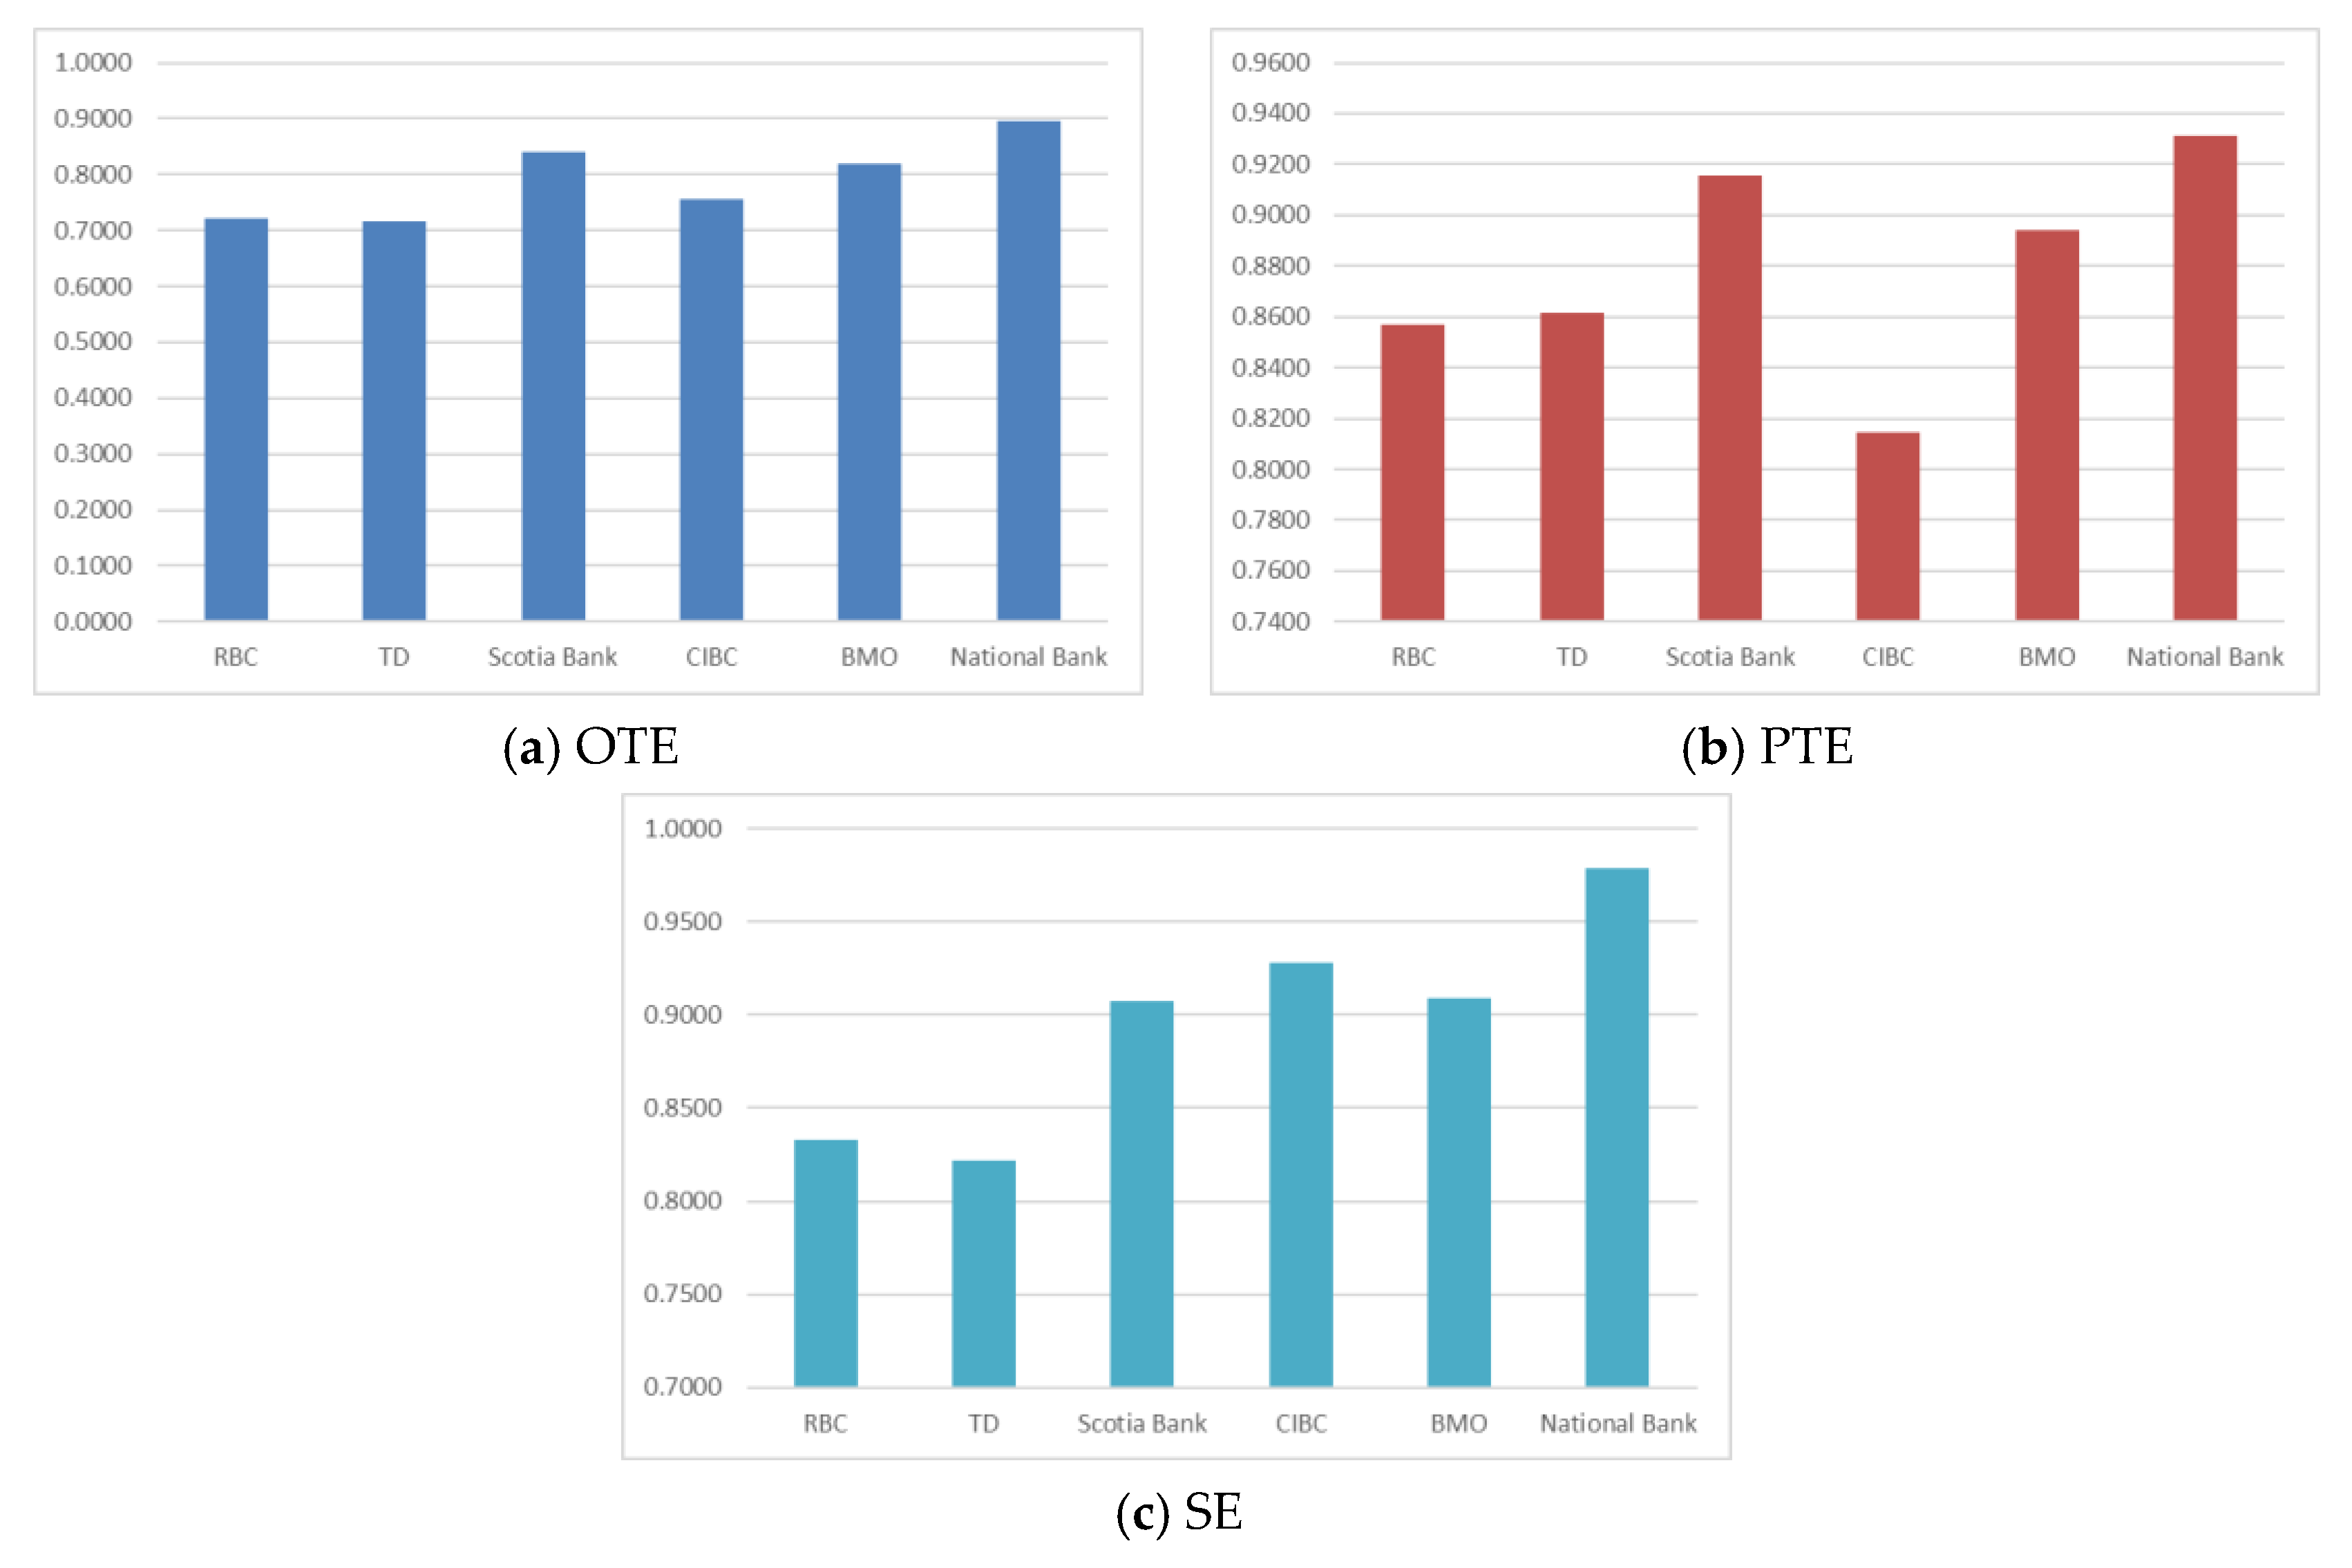
Figure 7.
Banks’ bootstrap OTE, bootstrap PTE, and the SE for the third stage.

Table 1.
Descriptive analysis—Inputs and outputs for the banks for the period (2000–2017).
| Bank | Measurements | Total Assets * | Other Operating Costs * | Number of Employees | Deposits * | Loans * | Securities * | Impaired Loans * | Interest Incomes * | Non-Interest Incomes * |
|---|---|---|---|---|---|---|---|---|---|---|
| RBC | Mean | 688,731.67 | 15,306.72 | 66,943.39 | 438,106.22 | 303,186.44 | 162,548.11 | 2116.50 | 20,189.28 | 15,223.22 |
| Median | 689,424.00 | 14,713.00 | 67,813.50 | 406,432.50 | 281,496.50 | 174,694.50 | 2267.50 | 20,832.50 | 15,252.00 | |
| Standard deviation | 289,411.41 | 3250.60 | 8086.03 | 183,855.81 | 130,067.14 | 48,520.46 | 789.04 | 4176.99 | 4542.34 | |
| TD | Mean | 625,827.44 | 13,673.06 | 62,597.28 | 406,734.89 | 293,833.06 | 159,557.56 | 1874.94 | 18,486.00 | 8504.67 |
| Median | 560,216.50 | 13,964.00 | 62,361.00 | 383,364.00 | 236,376.00 | 146,474.00 | 2224.50 | 18,155.50 | 7089.00 | |
| Standard deviation | 337,341.55 | 2277.94 | 15,975.48 | 211,551.92 | 177,496.98 | 68,428.37 | 1042.37 | 5587.61 | 3401.75 | |
| Scotia | Mean | 528,578.50 | 12,966.44 | 65,730.89 | 364,946.50 | 292,938.44 | 78,512.56 | 3470.83 | 17,809.50 | 7022.44 |
| Median | 502,070.50 | 12,914.00 | 68,425.50 | 348,499.50 | 275,263.00 | 78,516.00 | 3641.50 | 17,420.50 | 5760.50 | |
| Standard deviation | 234,290.20 | 2516.53 | 18,516.46 | 162,864.62 | 117,545.51 | 20,687.06 | 1140.40 | 3354.50 | 3164.07 | |
| CIBC | Mean | 359,600.44 | 9795.56 | 41,837.17 | 2597,80.11 | 195,912.22 | 75,223.22 | 1469.28 | 12,240.89 | 5824.56 |
| Median | 347,109.00 | 8885.50 | 42,453.00 | 232,312.00 | 169,343.50 | 74,888.00 | 1490.50 | 11,859.00 | 5932.50 | |
| Standard deviation | 85,460.34 | 2728.67 | 2493.44 | 79145.04 | 68,780.39 | 9005.19 | 435.00 | 1919.15 | 2050.35 | |
| BMO | Mean | 424,123.72 | 9404.67 | 39,366.83 | 276,328.11 | 217,638.39 | 98,471.17 | 2020.83 | 12,345.94 | 6444.28 |
| Median | 400,049.00 | 9302.50 | 36,623.00 | 242,703.50 | 188,978.00 | 105,475.50 | 2111.00 | 13,020.50 | 5367.50 | |
| Standard deviation | 160,896.39 | 2253.57 | 5614.51 | 111,921.45 | 77,355.21 | 42,192.37 | 785.14 | 2390.88 | 2576.29 | |
| NBC | Mean | 143,005.11 | 3084.39 | 18,388.44 | 84,697.33 | 72,080.22 | 43,044.89 | 393.06 | 3812.39 | 2415.17 |
| Median | 130,735.00 | 3101.00 | 17,516.00 | 75,596.00 | 57,192.50 | 48,209.00 | 391.50 | 3889.00 | 2333.50 | |
| Standard deviation | 56,915.28 | 748.00 | 1764.19 | 32,999.01 | 31,563.05 | 15,982.27 | 104.42 | 906.01 | 505.16 |
* numbers are in $ millions.
Table 2.
Annual bootstrap overall technical efficiency (OTE), bootstrap pure technical efficiency (PTE), and the scale efficiency (SE) for the first stage.
Table 2.
Annual bootstrap overall technical efficiency (OTE), bootstrap pure technical efficiency (PTE), and the scale efficiency (SE) for the first stage.
| Year | Measures | Bootstrap OTE | Bootstrap PTE | SE | Year | Measures | Bootstrap OTE | Bootstrap PTE | SE |
|---|---|---|---|---|---|---|---|---|---|
| 2000 | Mean | 0.863 | 0.898 | 0.954 | 2009 | Mean | 0.803 | 0.852 | 0.940 |
| Median | 0.854 | 0.894 | 0.976 | Median | 0.795 | 0.857 | 0.991 | ||
| Standard deviation | 0.027 | 0.033 | 0.055 | Standard deviation | 0.073 | 0.072 | 0.110 | ||
| 2001 | Mean | 0.846 | 0.876 | 0.959 | 2010 | Mean | 0.790 | 0.835 | 0.939 |
| Median | 0.848 | 0.866 | 0.979 | Median | 0.798 | 0.861 | 0.987 | ||
| Standard deviation | 0.030 | 0.042 | 0.049 | Standard deviation | 0.084 | 0.075 | 0.103 | ||
| 2002 | Mean | 0.849 | 0.870 | 0.962 | 2011 | Mean | 0.762 | 0.824 | 0.928 |
| Median | 0.844 | 0.860 | 0.979 | Median | 0.747 | 0.809 | 0.973 | ||
| Standard deviation | 0.035 | 0.041 | 0.043 | Standard deviation | 0.089 | 0.061 | 0.118 | ||
| 2003 | Mean | 0.830 | 0.870 | 0.948 | 2012 | Mean | 0.788 | 0.858 | 0.921 |
| Median | 0.839 | 0.862 | 0.978 | Median | 0.757 | 0.860 | 0.953 | ||
| Standard deviation | 0.025 | 0.038 | 0.077 | Standard deviation | 0.106 | 0.072 | 0.105 | ||
| 2004 | Mean | 0.826 | 0.869 | 0.945 | 2013 | Mean | 0.819 | 0.910 | 0.907 |
| Median | 0.831 | 0.862 | 0.979 | Median | 0.813 | 0.918 | 0.920 | ||
| Standard deviation | 0.043 | 0.049 | 0.089 | Standard deviation | 0.104 | 0.052 | 0.102 | ||
| 2005 | Mean | 0.825 | 0.874 | 0.943 | 2014 | Mean | 0.825 | 0.919 | 0.911 |
| Median | 0.837 | 0.870 | 0.982 | Median | 0.815 | 0.930 | 0.915 | ||
| Standard deviation | 0.053 | 0.050 | 0.103 | Standard deviation | 0.087 | 0.051 | 0.089 | ||
| 2006 | Mean | 0.820 | 0.858 | 0.953 | 2015 | Mean | 0.875 | 0.949 | 0.929 |
| Median | 0.818 | 0.848 | 0.986 | Median | 0.889 | 0.953 | 0.967 | ||
| Standard deviation | 0.036 | 0.061 | 0.086 | Standard deviation | 0.082 | 0.025 | 0.095 | ||
| 2007 | Mean | 0.814 | 0.851 | 0.954 | 2016 | Mean | 0.889 | 0.946 | 0.939 |
| Median | 0.804 | 0.842 | 0.990 | Median | 0.934 | 0.944 | 0.976 | ||
| Standard deviation | 0.045 | 0.070 | 0.081 | Standard deviation | 0.080 | 0.011 | 0.081 | ||
| 2008 | Mean | 0.795 | 0.844 | 0.942 | 2017 | Mean | 0.882 | 0.943 | 0.936 |
| Median | 0.794 | 0.833 | 0.985 | Median | 0.905 | 0.946 | 0.966 | ||
| Standard deviation | 0.049 | 0.068 | 0.100 | Standard deviation | 0.064 | 0.020 | 0.078 |
Table 3.
Annual bootstrap OTE, bootstrap PTE, and the SE for the second stage.
| Year | Measures | Bootstrap OTE | Bootstrap PTE | SE | Year | Measures | Bootstrap OTE | Bootstrap PTE | SE |
|---|---|---|---|---|---|---|---|---|---|
| 2000 | Mean | 0.8286 | 0.8591 | 0.9573 | 2009 | Mean | 0.7610 | 0.8727 | 0.8759 |
| Median | 0.8209 | 0.8323 | 0.9782 | Median | 0.7489 | 0.8702 | 0.8624 | ||
| Standard deviation | 0.1174 | 0.0825 | 0.0485 | Standard deviation | 0.0918 | 0.0662 | 0.0857 | ||
| 2001 | Mean | 0.8193 | 0.8682 | 0.9397 | 2010 | Mean | 0.7466 | 0.8725 | 0.8609 |
| Median | 0.7992 | 0.8695 | 0.9362 | Median | 0.7257 | 0.8839 | 0.8441 | ||
| Standard deviation | 0.1030 | 0.0816 | 0.0411 | Standard deviation | 0.1034 | 0.0665 | 0.0975 | ||
| 2002 | Mean | 0.8034 | 0.8480 | 0.9513 | 2011 | Mean | 0.7833 | 0.8705 | 0.8929 |
| Median | 0.7755 | 0.8391 | 0.9680 | Median | 0.7549 | 0.8655 | 0.8769 | ||
| Standard deviation | 0.1330 | 0.1068 | 0.0477 | Standard deviation | 0.0841 | 0.0589 | 0.0659 | ||
| 2003 | Mean | 0.7775 | 0.8506 | 0.9165 | 2012 | Mean | 0.8220 | 0.9064 | 0.9008 |
| Median | 0.7821 | 0.8648 | 0.9310 | Median | 0.8087 | 0.8884 | 0.8793 | ||
| Standard deviation | 0.1093 | 0.0826 | 0.0656 | Standard deviation | 0.0634 | 0.0427 | 0.0531 | ||
| 2004 | Mean | 0.7989 | 0.8655 | 0.9233 | 2013 | Mean | 0.8115 | 0.9024 | 0.8922 |
| Median | 0.8056 | 0.8931 | 0.9576 | Median | 0.7971 | 0.8888 | 0.8732 | ||
| Standard deviation | 0.1063 | 0.0729 | 0.0714 | Standard deviation | 0.0650 | 0.0501 | 0.0558 | ||
| 2005 | Mean | 0.8058 | 0.8929 | 0.9032 | 2014 | Mean | 0.7978 | 0.8948 | 0.8838 |
| Median | 0.8268 | 0.9254 | 0.9533 | Median | 0.7975 | 0.8872 | 0.8682 | ||
| Standard deviation | 0.1161 | 0.0648 | 0.1057 | Standard deviation | 0.0512 | 0.0397 | 0.0623 | ||
| 2006 | Mean | 0.8038 | 0.8815 | 0.8965 | 2015 | Mean | 0.7851 | 0.8895 | 0.8715 |
| Median | 0.7806 | 0.8924 | 0.9155 | Median | 0.7803 | 0.8899 | 0.8596 | ||
| Standard deviation | 0.1040 | 0.0613 | 0.0833 | Standard deviation | 0.0633 | 0.0461 | 0.0663 | ||
| 2007 | Mean | 0.7766 | 0.8824 | 0.8833 | 2016 | Mean | 0.7866 | 0.9032 | 0.8571 |
| Median | 0.7563 | 0.8965 | 0.9150 | Median | 0.7821 | 0.9049 | 0.8527 | ||
| Standard deviation | 0.1078 | 0.0763 | 0.0928 | Standard deviation | 0.0595 | 0.0405 | 0.0661 | ||
| 2008 | Mean | 0.7543 | 0.8474 | 0.8909 | 2017 | Mean | 0.7847 | 0.9154 | 0.8358 |
| Median | 0.7392 | 0.8194 | 0.8993 | Median | 0.7921 | 0.9272 | 0.8468 | ||
| Standard deviation | 0.1151 | 0.0787 | 0.0760 | Standard deviation | 0.0580 | 0.0473 | 0.0542 |
Table 4.
Annual bootstrap OTE, bootstrap PTE, and the SE for the third stage.
| Year | Measures | Bootstrap OTE | Bootstrap PTE | SE | Year | Measures | Bootstrap OTE | Bootstrap PTE | SE |
|---|---|---|---|---|---|---|---|---|---|
| 2000 | Mean | 0.9013 | 0.9006 | 0.9829 | 2009 | Mean | 0.6179 | 0.6677 | 0.9111 |
| Median | 0.9040 | 0.8994 | 1.0000 | Median | 0.5676 | 0.6544 | 0.9458 | ||
| Standard deviation | 0.0348 | 0.0228 | 0.0419 | Standard deviation | 0.1643 | 0.1362 | 0.1003 | ||
| 2001 | Mean | 0.8804 | 0.9009 | 0.9614 | 2010 | Mean | 0.5958 | 0.6373 | 0.9312 |
| Median | 0.9001 | 0.9033 | 0.9984 | Median | 0.5424 | 0.5796 | 0.9584 | ||
| Standard deviation | 0.0603 | 0.0146 | 0.0772 | Standard deviation | 0.1317 | 0.1299 | 0.0945 | ||
| 2002 | Mean | 0.7566 | 0.7864 | 0.9462 | 2011 | Mean | 0.6251 | 0.6641 | 0.9433 |
| Median | 0.7240 | 0.7653 | 0.9726 | Median | 0.5435 | 0.6068 | 0.9700 | ||
| Standard deviation | 0.0970 | 0.0919 | 0.0893 | Standard deviation | 0.1759 | 0.1794 | 0.0650 | ||
| 2003 | Mean | 0.7353 | 0.7783 | 0.9440 | 2012 | Mean | 0.6730 | 0.7072 | 0.9504 |
| Median | 0.7356 | 0.7773 | 0.9704 | Median | 0.6043 | 0.6735 | 0.9743 | ||
| Standard deviation | 0.1178 | 0.1315 | 0.0865 | Standard deviation | 0.1813 | 0.1752 | 0.0620 | ||
| 2004 | Mean | 0.7783 | 0.8206 | 0.9464 | 2013 | Mean | 0.6462 | 0.6758 | 0.9509 |
| Median | 0.7775 | 0.8343 | 0.9713 | Median | 0.6046 | 0.6639 | 0.9798 | ||
| Standard deviation | 0.1013 | 0.1054 | 0.0757 | Standard deviation | 0.1531 | 0.1432 | 0.0694 | ||
| 2005 | Mean | 0.8267 | 0.8634 | 0.9568 | 2014 | Mean | 0.6954 | 0.7128 | 0.9592 |
| Median | 0.8683 | 0.8993 | 0.9954 | Median | 0.6786 | 0.7133 | 0.9875 | ||
| Standard deviation | 0.1068 | 0.1006 | 0.0854 | Standard deviation | 0.1762 | 0.1564 | 0.0561 | ||
| 2006 | Mean | 0.8481 | 0.8779 | 0.9603 | 2015 | Mean | 0.7044 | 0.7237 | 0.9557 |
| Median | 0.8723 | 0.8923 | 0.9934 | Median | 0.6918 | 0.6988 | 0.9856 | ||
| Standard deviation | 0.0760 | 0.0499 | 0.0801 | Standard deviation | 0.1508 | 0.1278 | 0.0580 | ||
| 2007 | Mean | 0.8882 | 0.8894 | 0.9764 | 2016 | Mean | 0.6551 | 0.6937 | 0.9168 |
| Median | 0.8933 | 0.8917 | 1.0000 | Median | 0.6383 | 0.6409 | 0.9367 | ||
| Standard deviation | 0.0432 | 0.0251 | 0.0558 | Standard deviation | 0.1580 | 0.1296 | 0.0850 | ||
| 2008 | Mean | 0.7449 | 0.8022 | 0.9163 | 2017 | Mean | 0.7258 | 0.7748 | 0.8942 |
| Median | 0.7520 | 0.8064 | 0.9284 | Median | 0.6965 | 0.7894 | 0.9877 | ||
| Standard deviation | 0.0787 | 0.0802 | 0.0863 | Standard deviation | 0.1684 | 0.0796 | 0.1787 |
Table 5.
Results of pairwise t-test for years.
| Stage 1 | |||||
|---|---|---|---|---|---|
| Year | Efficiency | p-Value | Year | Efficiency | p-Value |
| 2008–2015 | PTE | 0.072 * | 2010–2017 | PTE | 0.055 * |
| 2008–2016 | PTE | 0.096* | 2011–2015 | PTE | 0.009 *** |
| 2010–2015 | PTE | 0.031 ** | 2011–2016 | PTE | 0.014 ** |
| 2010–2016 | PTE | 0.043 ** | 2011–2017 | PTE | 0.019 ** |
| Stage 3 | |||||
| 2000–2009 | OTE | 0.028 ** | 2000–2010 | PTE | 0.017 ** |
| 2000–2010 | OTE | 0.011 ** | 2000–2011 | PTE | 0.057 * |
| 2000–2011 | OTE | 0.037 ** | 2000–2013 | PTE | 0.091 * |
| 2000–2013 | OTE | 0.083 * | 2001–2009 | PTE | 0.065 * |
| 2001–2009 | OTE | 0.063 * | 2001–2010 | PTE | 0.017 ** |
| 2001–2010 | OTE | 0.027 ** | 2001–2011 | PTE | 0.056 * |
| 2001–2011 | OTE | 0.082 * | 2001–2013 | PTE | 0.090 * |
| 2006–2010 | OTE | 0.091 * | 2005–2010 | PTE | 0.087 * |
| 2007–2009 | OTE | 0.047 ** | 2006–2010 | PTE | 0.048 ** |
| 2007–2010 | OTE | 0.019 ** | 2007–2010 | PTE | 0.029 ** |
| 2007–2011 | OTE | 0.062 * | 2007–2011 | PTE | 0.09 * |
| 2000–2009 | PTE | 0.066 * | |||
***: Significant at 1%, **: Significant at 5%, *: Significant at 10%.
Table 6.
Bootstrap OTE, bootstrap PTE, and SE for the banks over the study period (2000–2017).
| Stage 1 | |||||||||
| Bank | Measures | Bootstrap OTE | Bootstrap PTE | SE | Bank | Measures | Bootstrap OTE | Bootstrap PTE | SE |
| RBC | Mean | 0.8171 | 0.8432 | 0.9740 | CIBC | Mean | 0.8876 | 0.8962 | 0.9877 |
| Median | 0.8084 | 0.8256 | 0.9851 | Median | 0.8608 | 0.8722 | 0.9867 | ||
| Standard deviation | 0.0685 | 0.0771 | 0.0286 | Standard deviation | 0.0563 | 0.0514 | 0.0084 | ||
| TD | Mean | 0.8387 | 0.8615 | 0.9719 | BMO | Mean | 0.8162 | 0.8396 | 0.9735 |
| Median | 0.8436 | 0.8622 | 0.9782 | Median | 0.8128 | 0.8330 | 0.9746 | ||
| Standard deviation | 0.0523 | 0.0424 | 0.0253 | Standard deviation | 0.0592 | 0.0518 | 0.0185 | ||
| Scotia | Mean | 0.8602 | 0.8978 | 0.9604 | NBC | Mean | 0.7466 | 0.9433 | 0.7694 |
| Median | 0.8616 | 0.8853 | 0.9796 | Median | 0.7407 | 0.9468 | 0.7584 | ||
| Standard deviation | 0.0179 | 0.0434 | 0.0434 | Standard deviation | 0.0657 | 0.0212 | 0.0528 | ||
| Stage 2 | |||||||||
| Bank | Measures | Bootstrap OTE | Bootstrap PTE | SE | Bank | Measures | Bootstrap OTE | Bootstrap PTE | SE |
| RBC | Mean | 0.7202 | 0.8570 | 0.8330 | CIBC | Mean | 0.7561 | 0.8143 | 0.9278 |
| Median | 0.7160 | 0.8517 | 0.8159 | Median | 0.7448 | 0.7912 | 0.9349 | ||
| Standard deviation | 0.0339 | 0.0504 | 0.0587 | Standard deviation | 0.0404 | 0.0590 | 0.0259 | ||
| TD | Mean | 0.7162 | 0.8617 | 0.8219 | BMO | Mean | 0.8194 | 0.8943 | 0.9093 |
| Median | 0.6881 | 0.8426 | 0.8235 | Median | 0.7892 | 0.8837 | 0.8941 | ||
| Standard deviation | 0.0847 | 0.0832 | 0.0463 | Standard deviation | 0.0833 | 0.0390 | 0.0651 | ||
| Scotia | Mean | 0.8408 | 0.9156 | 0.9074 | NBC | Mean | 0.8962 | 0.9314 | 0.9785 |
| Median | 0.8012 | 0.9131 | 0.8987 | Median | 0.9052 | 0.9390 | 0.9943 | ||
| Standard deviation | 0.0737 | 0.0434 | 0.0534 | Standard deviation | 0.0303 | 0.0178 | 0.0320 | ||
| Stage 3 | |||||||||
| Bank | Measures | Bootstrap OTE | Bootstrap PTE | SE | Bank | Measures | Bootstrap OTE | Bootstrap PTE | SE |
| RBC | Mean | 0.8866 | 0.8841 | 0.9748 | CIBC | Mean | 0.7479 | 0.7571 | 0.9840 |
| Median | 0.9038 | 0.8910 | 0.9998 | Median | 0.7424 | 0.7492 | 0.9844 | ||
| Standard deviation | 0.0627 | 0.0373 | 0.0431 | Standard deviation | 0.1387 | 0.1305 | 0.0131 | ||
| TD | Mean | 0.6981 | 0.7329 | 0.9405 | BMO | Mean | 0.6672 | 0.6794 | 0.9802 |
| Median | 0.7031 | 0.7911 | 0.9739 | Median | 0.6522 | 0.6615 | 0.9915 | ||
| Standard deviation | 0.1633 | 0.1510 | 0.1074 | Standard deviation | 0.1652 | 0.1628 | 0.0195 | ||
| Scotia | Mean | 0.7836 | 0.7913 | 0.9785 | NBC | Mean | 0.6494 | 0.7809 | 0.8098 |
| Median | 0.8112 | 0.8320 | 0.9915 | Median | 0.6273 | 0.7753 | 0.8116 | ||
| Standard deviation | 0.1200 | 0.1094 | 0.0345 | Standard deviation | 0.1161 | 0.1193 | 0.0453 | ||
Table 7.
The results of pairwise t-test for banks.
| Stage 1 | |||||
|---|---|---|---|---|---|
| Banks | Efficiency | p-Value | Banks | Efficiency | p-Value |
| RBC-CIBC | OTE | 0.003 *** | Scotia-BMO | PTE | 0.010 *** |
| RBC-NBC | OTE | 0.003 *** | Scotia-NBC | PTE | 0.086 * |
| TD-NBC | OTE | 0.000 *** | CIBC-BMO | PTE | 0.014 ** |
| Scotia-NBC | OTE | 0.000 *** | CIBC-NBC | PTE | 0.067 * |
| CIBC-BMO | OTE | 0.003 *** | BMO-NBC | PTE | 0.000 *** |
| CIBC-NBC | OTE | 0.000 *** | RBC-NBC | SE | 0.000 *** |
| BMO-NBC | OTE | 0.004 *** | TD-NBC | SE | 0.000 *** |
| RBC-Scotia | PTE | 0.020 ** | Scotia-NBC | SE | 0.000 *** |
| RBC-CIBC | PTE | 0.026 ** | CIBC-NBC | SE | 0.000 *** |
| RBC-NBC | PTE | 0.000 *** | BMO-NBC | SE | 0.000 *** |
| TD-NBC | PTE | 0.000 *** | |||
| Stage 2 | |||||
| RBC-Scotia | OTE | 0.000 *** | TD-NBC | PTE | 0.002 ** |
| RBC-BMO | OTE | 0.000 *** | Scotia-CIBC | PTE | 0.000 *** |
| RBC-NBC | OTE | 0.000 *** | CIBC-BMO | PTE | 0.000 *** |
| TD-Scotia | OTE | 0.000 *** | CIBC-NBC | PTE | 0.000 *** |
| TD-BMO | OTE | 0.000 *** | RBC-Scotia | SE | 0.000 *** |
| TD-NBC | OTE | 0.000 *** | RBC-CIBC | SE | 0.000 *** |
| CIBC-BMO | OTE | 0.001 ** | RBC-BMO | SE | 0.000 *** |
| Scotia-NBC | OTE | 0.090 * | RBC-NBC | SE | 0.000 *** |
| CIBC-BMO | OTE | 0.034 ** | TD-Scotia | SE | 0.000 *** |
| CIBC-NBC | OTE | 0.000 *** | TD-CIBC | SE | 0.000 *** |
| BMO-NBC | OTE | 0.005 ** | TD-BMO | SE | 0.000 *** |
| RBC-Scotia | PTE | 0.015 ** | TD-NBC | SE | 0.000 *** |
| RBC-NBC | PTE | 0.000 *** | Scotia-NBC | SE | 0.000 *** |
| TD-Scotia | PTE | 0.032 ** | CIBC-NBC | SE | 0.029 ** |
| TD-CIBC | PTE | 0.084 * | BMO-NBC | SE | 0.000 *** |
| TD-NBC | PTE | 0.002 ** | |||
| Stage 3 | |||||
| RBC-TD | OTE | 0.000 *** | RBC-BMO | PTE | 0.000 *** |
| RBC-CIBC | OTE | 0.026 ** | Scotia-BMO | PTE | 0.088 * |
| RBC-BMO | OTE | 0.000 *** | RBC-NBC | SE | 0.000 *** |
| RBC-NBC | OTE | 0.000 *** | TD-NBC | SE | 0.000 *** |
| Scotia-BMO | OTE | 0.097 *** | Scotia-NBC | SE | 0.000 *** |
| Scotia-NBC | OTE | 0.034 *** | CIBC-NBC | SE | 0.000 *** |
| RBC-TD | PTE | 0.006 ** | BMO-NBC | SE | 0.000 *** |
| RBC-CIBC | PTE | 0.034 ** | |||
***: Significant at 1%, **: Significant at 5%, *: Significant at 10%.
Table 8.
Network Data Envelopment Analysis (DEA) vs. black box DEA.
| Bank | Network DEA | Black Box DEA | ||||
|---|---|---|---|---|---|---|
| OTE | PTE | SE | OTE | PTE | SE | |
| RBC | 0.5226 | 0.6370 | 0.7908 | 0.9515 | 0.9651 | 0.9976 |
| TD | 0.4116 | 0.5386 | 0.7530 | 0.9040 | 0.9139 | 0.9948 |
| Scotia | 0.5654 | 0.6524 | 0.8537 | 0.9351 | 0.9465 | 0.9907 |
| CIBC | 0.4998 | 0.5505 | 0.9015 | 0.9270 | 0.9477 | 0.9829 |
| BMO | 0.4557 | 0.5130 | 0.8683 | 0.9160 | 0.9473 | 0.9743 |
| NBC | 0.4381 | 0.6874 | 0.6094 | 0.8554 | 0.9701 | 0.8755 |
© 2020 by the authors. Licensee MDPI, Basel, Switzerland. This article is an open access article distributed under the terms and conditions of the Creative Commons Attribution (CC BY) license (http://creativecommons.org/licenses/by/4.0/).
Share and Cite
MDPI and ACS Style
Dia, M.; Golmohammadi, A.; Takouda, P.M. Relative Efficiency of Canadian Banks: A Three-Stage Network Bootstrap DEA. J. Risk Financial Manag. 2020, 13, 68. https://doi.org/10.3390/jrfm13040068
AMA Style
Dia M, Golmohammadi A, Takouda PM. Relative Efficiency of Canadian Banks: A Three-Stage Network Bootstrap DEA. Journal of Risk and Financial Management. 2020; 13(4):68. https://doi.org/10.3390/jrfm13040068
Chicago/Turabian StyleDia, Mohamed, Amirmohsen Golmohammadi, and Pawoumodom M. Takouda. 2020. "Relative Efficiency of Canadian Banks: A Three-Stage Network Bootstrap DEA" Journal of Risk and Financial Management 13, no. 4: 68. https://doi.org/10.3390/jrfm13040068