How Does Aggregate Tax Policy Uncertainty Affect Default Risk?

1
Department of Economics, College of Business, University of Nevada, Reno, NV 89557, USA
2
Department of Finance, College of Business, University of Nevada, Reno, NV 89557, USA
*
Author to whom correspondence should be addressed.
J. Risk Financial Manag. 2020, 13(12), 319; https://doi.org/10.3390/jrfm13120319
Submission received: 12 November 2020
/
Revised: 3 December 2020
/
Accepted: 9 December 2020
/
Published: 12 December 2020
(This article belongs to the Special Issue Tax Policy and Public Finance)
Abstract
:We examine the impact of aggregate tax policy uncertainty on firm-level default risk. Due to uncertainties associated with tax policies, firms could have difficulties in determining their optimal debt level and use too much debt to increase their values. This can increase firms’ financial risk and default probabilities. At the same time, tax policy uncertainty may lead some firms to take less risk which could lower their use of debt and in turn lower the probability of default. We find that tax policy uncertainty is positively associated with firms’ expected default probabilities. In terms of economic significance, our findings show an increase of 14.83% in expected default probability, on a relative basis. Our results are robust to controlling for conditions of the economy, conditions of the stock market, financial constraints of firms, and credit quality of firms. Our evidence adds to two strands of research: research on taxation and firms’ risk profiles and the impact of policy uncertainty on firms’ decisions.
1. Introduction
How does uncertainty associated with tax policies affect firms’ risk profiles? The existing literature examines this question by focusing on firm-level tax policies. Specifically, through complex tax planning policies, firm managers can hide bad news from investors (Desai and Dharmapala 2006) or manipulate earnings (Desai and Dharmapala 2009). Thus, tax avoidance activities enable managerial opportunistic policies and bad news hoarding for an extended period, which can lead to stock price crashes. Consistently, (Kim et al. 2011) find that aggressive tax avoidance is positively associated with firm-specific stock price crash risk as far as three years into the future. Moreover, (Rego and Wilson 2012) document that a firm’s tax risk is positively related to both stock return volatility and managers’ equity risk incentives. (Guenther et al. 2017) results indicate that the volatility of the firm’s cash effective tax rates are leading indicators of risk and associated with uncertainty regarding the firm’s future cash flows. On the other hand, (Jalan et al. 2016) theoretically predict and empirically show that tax sheltering activities are negatively associated with bankruptcy risk.
While the relation between firm-level tax policies and the firm’s risk has been studied from different perspectives, the impact of uncertainty associated with systematic tax policies on the firm’s risk has received less attention. However, tax policy is one of the largest sources of policy uncertainty, especially in recent years (Baker et al. 2016). To this end, this paper explores the relation between the systematic tax policy uncertainty and the firms’ default risk. Our investigation is motivated by one of the most important theories of capital structure: trade-off theory (e.g., Fama and French 2002). In the trade-off theory of debt, while the interest tax shield associated with debt financing pushes firms toward higher target leverage, expected costs associated with default push firms toward lower target leverage. Thus, the optimal debt level equates the marginal benefit of the interest tax shield and the marginal cost of the additional exposure to default. In addition, (DeAngelo and Masulis 1980) theoretical model predicts that non-debt corporate tax shields such as depreciation deductions or investment tax credits are also important determinants of the firm’s target leverage. Thus, taxes play a significant role in firms’ target leverage. Firms’ target leverage ratios are also an important determinant of their default probabilities and many firms actively adjust their capital structure towards leverage targets (Löffler and Maurer 2011). Since tax policy is one of the largest sources of policy uncertainty (Baker et al. 2016), uncertainties associated with tax policies may make it difficult for a firm to determine optimal debt level. As debt financing increases firm value due to the tax shield on interest payments (e.g., Graham 2000), the firm may use too much debt to increase its value, leading to high default risk. However, some firms may still think that the tax benefits of debt are not guaranteed due to tax policy uncertainty and avoid using too much debt. Hence the association between tax policy uncertainty and firms’ default risk needs to be examined empirically.
Our analysis requires us to determine firm-level default risk and tax policy uncertainty. Following (Brogaard et al. 2017; Bharath and Shumway 2008), we measure firm-level default risk with expected default frequency (EDF). (Bharath and Shumway 2008) develop EDF measure using the same inputs as (Merton 1974) structural distance-to-default model. This measure has the same functional form as (Merton 1974) structural distance-to-default model, but it does not require the iterative solution process. (Brogaard et al. 2017; Bharath and Shumway 2008) emphasize that EDF works well at forecasting bankruptcies. We proxy tax policy uncertainty with (Baker et al. 2016) tax policy uncertainty index (TPU), which is the federal tax code change uncertainty measured by the dollar impact of tax provisions set to expire in the near future. Similar to our approach, using (Baker et al. 2016) different policy uncertainty indices, including tax policy uncertainty index (TPU), (Gulen and Ion 2016) find a negative association between firm-level investment and the uncertainty associated with future policy outcomes.
Using a sample of 9888 U.S. firms from 1987 to 2018, we document that aggregate tax policy uncertainty (TPU) is positively associated with the firm’s default risk (EDF). The impact of tax policy uncertainty on default risk is also economically significant. Specifically, our findings show that a one-standard-deviation increase in TPU increases EDF by 0.69%. For comparison, the mean EDF in our sample period equals 4.62%, thus our findings show an increase of 14.83% on a relative basis. To strengthen our analysis, we conduct several robustness tests. First, we estimate the default risk regression separately for each of the Fama and French 12 industries and show that the impact of tax policy uncertainty on default risk is not driven only by a single industry but it is observed across the economy. Second, following (Pástor and Veronesi 2013), we control for economic conditions and stock market conditions and show that the positive impact of tax uncertainty on default risk holds regardless of economic conditions and the stock market conditions. Third, since the firms’ financial constraints are strongly related to their financial distress (Asquith et al. 1994), we analyze the impact of tax policy uncertainty on default risk across financial constraint quartiles and show that the positive relationship between tax policy uncertainty and default risk holds both in financially constrained and unconstrained firms. Fourth, since the firm’s credit quality is an important determinant of its financial distress (e.g., Kisgen 2006), we analyze how credit quality and having a credit rating affects the association between tax policy uncertainty and default risk. Our results indicate that tax policy uncertainty is positively associated with default risk regardless of the firms’ credit quality and having a bond rating or not. Finally, we employ an instrumental variable approach and show that our results are robust to any endogeneity concerns.
This study contributes to two different strands of research. First, by providing evidence on the aggregate tax policy uncertainty’s positive effect on default risk, we add to the literature on tax and firms’ risk profiles. While the existing literature documents significant relations between firm-level tax policies and the firms’ risk (Kim et al. 2011; Rego and Wilson 2012; Guenther et al. 2017; Jalan et al. 2016), our study shows that aggregate tax policy uncertainty also affects the firms’ risk profile through default risk. Second, our study also adds to the literature on the effects of policy uncertainty. Recent studies find that policy uncertainty affects firms’ credit spreads (Kaviani et al. 2020), mergers and acquisitions (Bonaime et al. 2018; Nguyen and Phan 2017), investment (Gulen and Ion 2016), research and development (Atanassov et al. 2015), and stock prices (Pastor and Veronesi 2012, 2013). Our findings show that tax policy uncertainty also affects firms’ default risk.
2. Related Literature and Hypothesis Development
One strand of research examines the relation between firm-level tax planning policies and the firm’s risk profile. (Guenther et al. 2017) examine the impact of firm-level tax avoidance strategies on future overall firm risk. They find that corporate tax avoidance activities do not increase firm risk. Their findings also show that tax rate volatility is positively related to overall firm risk. (Jalan et al. 2016) theoretically predict and empirically show that bankruptcy risk and leverage negatively affect the firm’s tax planning policies (e.g., sheltering income from taxes). They also document that the negative relation between default risk, leverage, and tax planning is stronger for riskier firms and weaker for profitable and well-governed firms. (Rego and Wilson 2012) hypothesize that firm managers need incentives to implement aggressive tax avoidance strategies because aggressive tax planning entails uncertainty and potential costs for managers and firms. Consistently, (Rego and Wilson 2012) document a positive relation between equity risk incentives and risky tax strategies. Their findings show that equity risk incentives are a significant determinant of corporate tax aggressiveness. (Kim et al. 2011) argue that tax avoidance strategies provide firm managers with tools that enable them to hide their opportunistic behaviors and hoard bad news for long time periods. When the accumulated bad news is released at once, the firm’s stock price crashes. Consistently, (Kim et al. 2011) find that the firm’s corporate tax avoidance is positively related to the firm’s stock price crash risk.
Another line of research documents the effects of default events. (Lang and Stulz 1992) find that a firm’s bankruptcy announcement negatively affects its competitors’ equity value. Similarly, (Ferris et al. 1997) examine the effects of Chapter 11 filings and find that competitors of Chapter 11 filing firms experience significant losses around the Chapter 11 announcements. (Hertzel et al. 2008) document that customer firms’ bankruptcy filings negatively affect supplier firms’ stock prices. (Eckbo et al. 2016) find that bankruptcy filings may impose large equity losses and forced career changes for CEOs of bankruptcy filing firms. (Almeida and Philippon 2007) estimates the risk-adjusted value of financial distress costs and shows that marginal distress costs can be as high as marginal benefits of debt reported by (Graham 2000). These findings indicate that financial distress risk can lead firms to use debt conservatively. Using (Merton 1974) option pricing model, (Vassalou and Xing 2004) examine the impact of default risk on firms’ equity returns and find that size and book-to-market factors contain information related to default risk that is systematic. (Campbell et al. 2008) study the impact of financial distress on stock returns and find that financial distress reduces stock returns and increases stock return volatilities. Their results indicate that size and book-to-market effects are associated with financial distress risk. Using the decimalization regulation in 2001 as an exogenous shock to stock liquidity,1 (Brogaard et al. 2017) examine the impact of stock liquidity on default risk. They find that increased stock liquidity improves stock price informational efficiency and corporate governance by blockers and thus decreases firm default risk.
A third line of research documents the impacts of political uncertainty on the firms’ credit risk and credit spread. (Liu and Zhong 2017) examine the impact of political uncertainty on the firms’ credit risk in an international setting. Using national elections in 30 countries as a proxy for political uncertainty, (Liu and Zhong 2017) document that political uncertainty is positively associated with the firms’ credit risk. Using (Baker et al. 2016) economic policy uncertainty index, (Wang et al. 2019) document that political uncertainty increases credit default swap spreads and decreases CDS liquidity. Their results indicate that with increasing EPU buying, credit protections become costly and difficult to purchase. Using (Baker et al. 2016) EPU index, (Kaviani et al. 2020) find a positive relationship between political uncertainty and changes in credit spreads. They also show that the impact of political uncertainty on borrowing costs is greater for firms in industries with high tax rates. (Waisman et al. 2015) find that both political uncertainty associated with U.S. presidential elections and political uncertainty measured with (Baker et al. 2016) index are positively associated with corporate bond spreads.
We motivate our hypothesis with the trade-off model. According to trade-off theory, firms determine their optimal debt levels by equating the marginal benefit of the interest tax deductibility and the marginal cost of the additional exposure to default (e.g., Fama and French 2002). Moreover, non-debt corporate tax shields such as R&D expenditure and depreciation have significant effects on the firm’s target leverage (DeAngelo and Masulis 1980). Accordingly, taxes are important determinants of firms’ target leverage. (Löffler and Maurer 2011) findings indicate that firms’ target leverage ratios are significant predictors of their default probabilities. Due to uncertainties associated with tax policies, it may be difficult for a firm to use the optimal amount of debt, and thus the firm may utilize too much debt to increase its value.2 On the other hand, tax policy uncertainty may make some firms more risk-averse towards debt since any tax benefits of using debt would be uncertain as well. This could lead firms to incur lower debt than usual. Given these two opposing arguments, we need to examine empirically the relationship between tax policy uncertainty and firms’ default risk.
3. Research Design
3.1. Data and Sample
Our sample consists of all US common stocks from 1987 to 2019, which are both in the Compustat and Center for Research in Security Prices (CRSP) databases. Our sample starts from 1987 because it is the first year the TPU index is available. Since capital requirement regulations affect financial firms’ accounting items, following (Brogaard et al. 2017), we exclude financial firms (standard industrial classification (SIC) codes between 6000 and 6999). We also require all firms to have non-missing data for all variables in our main regressions. Our final sample has 9888 unique firms and 84,132 firm-year observations. All variable definitions are in Table 1.3
3.2. Measuring Tax Policy Uncertainty (TPU)
We use the tax policy uncertainty (TPU) index of (Baker et al. 2016). For each firm, we define tax-related policy uncertainty following (Gulen and Ion 2016). Specifically, tax policy uncertainty (TPU) is defined as the natural logarithm of the arithmetic average of the (Baker et al. 2016) index for policy uncertainty related to tax code each year. (Baker et al. 2016) index reflects uncertainty with the change in the federal tax code measured by the dollar impact of tax provisions set to expire in the near future, which is obtained from the congressional Joint Committee on Taxation.4 (Baker et al. 2016) index proxies for movements in policy-related economic uncertainty and withstands extensive checks.5
3.3. Variable Construction and Empirical Model
We compute the expected default frequency as in (Brogaard et al. 2017; Bharath and Shumway 2008). Specifically, we define the expected default frequency (EDF) as follows:
and
where is the market value of equity defined as the number of shares outstanding times stock price at the end of the year; is the face value of debt defined as debt in current liabilities plus one half of long-term debt at the end of the year; firm i’s past annual return, is calculated from monthly stock returns over the previous year; is the stock return volatility for firm i during year t estimated using the monthly stock return from the previous year; , calculated from is an approximation of the volatility of firm assets; and is set to one year. is calculated for all sample firms as the last day of each year and is the cumulative normal distribution function.
We examine the impact of tax policy uncertainty on the expected default frequency in a multivariate setting. In our empirical model specification, we closely follow (Brogaard et al. 2017; Bharath and Shumway 2008). Specifically, we estimate the following regression:
where EDFit is the expected default frequency of the firm i in year t. For each firm i, TPU is defined as the natural logarithm of the arithmetic average of the (Baker et al. 2016) index for policy uncertainty related to tax code each year. Our TPU definition is similar to (Gulen and Ion 2016) definition and given in Section 3.2.
We control for all the factors (Brogaard et al. 2017) control in their expected default frequency regressions. Specifically, we control for the natural logarithm of the market value of equity where the market value of equity is defined as the product of the number of shares outstanding and the stock price at the end of the year. Our second control variable is the natural logarithm of the face value of debt. Face value of debt is defined as the sum of debt in current liabilities and one-half of long-term debt. We also control for the inverse of the annual stock return volatility which is computed as one divided by annualized stock return volatility. Annualized stock return volatility was computed as the standard deviation of stock monthly returns over the prior year. Our fourth control variable is excess return, which is defined as the difference between firm stock return and the market return (the CRSP value-weighted market return) over the same period. Our final control is the income to assets ratio, which is the ratio of net income to the total asset. All variables are defined in Appendix A. We winsorize all variables, except EDF, at 1st and 99th percentiles to mitigate the impacts of outliers.
Table 1 presents descriptive statistics for the variables that are used in our analysis. Panel A shows that in our sample period, the average tax policy uncertainty (TPU) is around 4.20. Our expected default frequency (EDF) measure’s mean and standard deviation are 4.62% and 19.60%. These values are very close to the EDF’s mean and standard deviation in (Brogaard et al. 2017). The values of averages of debt, equity, excess return, inverse standard deviation, and income-to-assets ratio in our sample period are also consistent with (Brogaard et al. 2017) descriptive statistics associate with these variables.
Table 1 panel C presents the Pearson correlations of variables we used in our analysis. As expected, the results indicate that excess returns and income-to-assets ratio are negatively correlated with the expected default frequency. The results also indicate that inverse standard deviation is negatively correlated with EDF. Thus, as the standard deviation increases EDF decreases. While the correlations of ln(debt), ln(equity), and ln(TPU) with EDF are not statistically significant, in our multivariate regressions ln(debt), ln(equity) and ln(TPU) have statistically significant associations with EDF (e.g., see Table 2).
Figure 1 plots the mean of EDF (%) and ln(TPU) over our sample period from 1987 to 2019. The figure shows that around the early 1990s recession, the Dot-com bubble burst (2000–2002) and the Subprime mortgage crisis (2007–2010) EDF peaks. Ln(TPU) mostly follows a similar pattern to the EDF. EDF and ln(TPU) show similar upward and downward trends particularly after 2010.
4. Empirical Results
4.1. Impact of Tax Policy Uncertainty on Default Risk: Main Regression Results
We summarize the results of our baseline regressions in Table 2. Panel A presents the results for the overall sample. The estimated coefficient of tax policy uncertainty (TPU) is positive and statistically significant at the 1% level. This finding indicates that tax policy uncertainty is positively associated with the firm’s default risk (EDF). In terms of economic significance, a one-standard-deviation increase in TPU increases EDF by 0.69% (=0.0041 × 1.6707). Given that the mean EDF in our sample period equals 4.62%, our results represent an increase of 14.83%, on a relative basis. In terms of control variables, all our controls have consistent signs with (Brogaard et al. 2017) results. Default risk is negatively associated with equity financing, income to asset ratio, excess returns, and inverse standard deviation. Conversely, debt financing is positively related to default risk.
To examine whether the impact of tax policy uncertainty on default risk is driven by only a single industry or it is observed across the economy, we estimate the EDF regression separately for each of the Fama and French 12 industries. Since we exclude financial firms or sample, we report results for 11 industries in our sample. Table 2 panel B presents the estimated coefficients of tax policy uncertainty from regressions with EDF as the dependent variable for each of the Fama and French 12 industries. All regressions include control variables from Equation (4) and firm fixed effects. To save space, we report only the estimated coefficients of TPU variables. T-statistics reported in parentheses are calculated using standard errors that are clustered at the firm level and are robust to heteroskedasticity. The coefficients of tax policy uncertainty are positive and statistically significant in 7 out of 11 industries. Overall, our results are not driven by a single industry and the positive association between tax policy uncertainty and default risk holds across industries.
To assess the economic significance of our findings at the industry level, we calculate the impact of a one-standard-deviation increase in TPU on EDF, on a relative basis.6 The last column of Table 2 (Eco. Imp.) shows the economic impact of a one-standard-deviation increase in TPU on the default risk on a relative basis. While we observe the highest impact in the durables industry (37.60%), the lowest impact is observed in the utilities industry (10.85%).
4.2. Impact of Tax Policy Uncertainty on Default Risk Conditioned on Overall Economy
(Pástor and Veronesi 2013) theoretically predict and empirically document that policy uncertainty is lower in strong economic conditions and higher in weak economic conditions. Political uncertainty positively affects the equity risk premium and stock return volatilities and correlations, more in weak economic conditions. Accordingly, we test whether the impact of tax policy uncertainty on default risk varies with the economic conditions. We proxy economic conditions as in (Pástor and Veronesi 2013). Specifically, we use industrial production growth (IPG), from the Board of Governors, the Chicago Fed National Activity Index (CFI), constructed by the Federal Reserve from 85 monthly indicators of economic activity, and the National Bureau of Economic Research recession dummy (Recession), equal to one during recession months and zero otherwise. As in (Pástor and Veronesi 2013), we include economic condition proxies in our main model specification, Equation (4). Table 3 presents our results when we control for economic conditions. In all models, the estimated coefficients of tax policy uncertainty are positive and statistically significant. In terms of economic significance, the results indicate that even after controlling for conditions of the overall economy, a one-standard-deviation increase in TPU increases EDF by 6.51% to 10.12%, on a relative basis. These results indicate that the positive impact of tax uncertainty on default risk holds regardless of economic conditions.
4.3. Impact of Tax Policy Uncertainty on Default Risk Conditioned on Stock Market Conditions
(Pástor and Veronesi 2013) theoretical predictions and empirical findings indicate that impact of political uncertainty on the equity risk premium and stock returns may vary with the conditions of the stock market. Thus, we test if the impact of tax policy uncertainty on default risk changes with the stock market conditions. We proxy stock market conditions with the cyclically adjusted price-to-earnings ratio for the aggregate stock market (P/E), downloaded from Robert Shiller’s website, and down-market binary variable that is set equal to one if the CRSP value-weighted market index annual return is less than zero, zero otherwise. Table 4 presents regression results when we control for market conditions. In all models, the estimated coefficient on tax policy uncertainty variable is positive and statistically significant. In terms of economic impact, a one-standard-deviation increase in TPU increases EDF by 27.84% in down markets and 20.61% in up markets. These findings indicate that the positive relationship with tax policy uncertainty holds regardless of the stock market conditions.
4.4. Impact of Tax Policy Uncertainty on Default Risk Conditioned on Financial Constraints
According to (Asquith et al. 1994), the firm’s financial constraints are closely associated with its financial distress. Thus, in this section, we analyze if the impact of tax policy uncertainty on default risk varies with the firm’s financial constraints. We compute a four-variable version of the (Kaplan and Zingales 1997) measure, KZ4, as in (Baker et al. 2003; Bakke and Whited 2010) to proxy for financial distress. KZ4 increases with financial constraints. KZ4 is calculated as the sum of cash flow (items 18 plus 14), cash dividends (items 19 plus 21), and cash balances (item 1), all scaled by lagged assets (item 6) and leverage ratio (items 9 plus 34)/(items 9 plus 34 plus 216))7:
Table 5 summarizes our results for the impact of tax policy uncertainty on default risk across financial constraint quartiles. The coefficient of tax policy uncertainty variable is positive and statistically significant across all quartiles. Interestingly, the positive effect of TPU on EDF is increasing with financial constraints. Specifically, a one-standard-deviation increase in TPU increases EDF by 4.70% in the least constrained firms’ sample and 15.55% in the most constrained firms’ sample. Overall, the results in Table 5 document that the positive impact of tax policy uncertainty on default risk holds both in financially constrained and unconstrained firms.
4.5. Impact of Tax Policy Uncertainty on Default Risk Conditioned on Credit Quality and Access to Debt Market
Firms with high credit quality are less likely to face financial distress than firms with low credit quality (e.g., Kisgen 2006). Thus, in the final section, we analyze how credit quality and having credit rating affects the association between tax policy uncertainty and default risk. We compute credit quality proxy similar to (Lemmon and Roberts 2010). Specifically, we assign an observation into the subsample of investment-grade if a firm’s debt has an investment-grade rating (BBB− and above), otherwise, we assign the firm to the subsample of noninvestment grade (firms with bonds rated BB+ and below or no rating). We define having a credit rating as similar to (Kashyap et al. 1994). Particularly, we define a rating binary variable that is set to one if the firm has a Standard and Poor’s bond rating as of the beginning of the year and zero otherwise. We divide our sample into two subsamples: firms with and without a bond rating.
Table 6 presents our results for the subsamples of firms with investment-grade ratings and those with noninvestment grade ratings (models 1 and 2) and firms with bond ratings and firms without bond ratings (models 3 and 4). Models 1 and 2 show that the coefficients on tax policy uncertainty in both investment grade and noninvestment grade firm subsamples are positive and statistically significant. Specifically, in the investment-grade firms’ sample, the economic impact of a one-standard-deviation increase in TPU on EDF is 5.06%, while in non-investment grade firms’ sample, the impact is 13.74%. Models 3 and 4 document that the impact of tax policy uncertainty is positively associated with default risks of firms regardless of their having a bond rating or not.
Overall, our findings in Table 6 show that tax policy uncertainty’s positive impact on firms’ default risk holds regardless of their credit quality and having a bond rating or not.
4.6. Instrumental Variable Analysis
A potential concern with the TPU index is that it may capture other sources of macroeconomic uncertainty that are not policy-related, but that may still affect firms’ default risk. To address this concern in our previous tests we controlled for the conditions of the economy and stock market. To strengthen our analysis and isolate the causal relationship between TPU and default risk, we employed an instrumental variable approach. Specifically, we followed (Gulen and Ion 2016) and used the level of political polarization in the United States Senate as an instrumental variable. (Gulen and Ion 2016; McCarty 2012) state that political polarization can lead to policy gridlock and greater variation in policy. Thus, we expect the level of political polarization to be positively associated with TPU and satisfy the relevance condition as an instrumental variable. At the same time, the level of disagreement between politicians in the Senate is not expected to affect default risk in a way other than through its impact on policy uncertainty. Hence, we expect our instrumental variable to meet the exclusion requirement as well.
Following (Gulen and Ion 2016), we define two instrumental variables based on the Dynamic Weighted Nominal Three-Step Estimation (DW-NOMINATE) scores of (McCarty et al. 1997).8 These scores aim to capture legislators’ ideological positions over time (McCarty 2011; Gulen and Ion 2016). Consistent with (Gulen and Ion 2016), we focus on the first dimension of the DW-NOMINATE scores.9 We define our instrument, Polarization, as the mean of DW-NOMINATE scores for the Republican Party members in the Senate minus the mean for the Democratic Party members in the Senate.
Table 7 summarizes the results of our instrumental variable two-stage regressions. In the first-stage regression, we regress tax policy uncertainty on the instrumental variable, Polarization, and all firm-level control variables from Equation (4). As we expected, the estimated coefficient of Polarization is positive and statistically significant. The p-value for F-statistic for the Polarization coefficient indicates that our instrument satisfies the relevance condition. In the second stage, we estimate Equation (4) after replacing TPU with the fitted tax policy uncertainty measure from the first-stage regression. The estimated coefficient of the fitted TPU variable is positive and statistically significant. Our results show that the potential endogeneity issue does not seriously affect our main findings and that TPU is positively associated with default risk.
5. Conclusions
In the trade-off theory, firms weigh the costs (e.g., potential bankruptcy costs) and benefits of debt (e.g., tax savings on debt interest payments) to reach their optimal leverage and maximize their values. If uncertainties associated with tax policies make it difficult for a firm to determine its optimal debt levels, firms may end up using too much or too little debt financing. In turn, this can lead to higher or lower firm-level default risk. We find a positive association between aggregate tax policy uncertainty and the firms’ default risk. In several robustness tests, we show that our findings hold after controlling for conditions of the economy, conditions of the stock market, financial constraints of firms, and credit quality of firms.
Our results are also economically significant. In the overall sample, a one-standard-deviation increase in TPU increases EDF by 14.83%, on a relative basis. At the industry level, the highest impact of TPU on EDF is found in the durables industry (37.60%) and the lowest impact is found in the utilities industry (10.85%). Our results indicate that a one-standard-deviation increase in TPU increases EDF by 27.84% in down markets and 20.61% in up markets. The impact of TPU on EDF changes with the firms’ financial constraints; a one-standard-deviation increase in TPU increases EDF in the least constrained firms’ sample is 4.70% and in the most constrained firms’ sample it is 15.55%. The credit quality of the firm also affects the relation between TPU and EDF. In the investment-grade firms’ sample, the economic impact of a one-standard-deviation increase in TPU on EDF is 5.06%, while in the noninvestment grade firms’ sample, the impact is 13.74%.
Our findings add to two different strands of research. First, we contribute to the research on firm-level tax policies and the firms’ risk profile. In different settings, the existing literature documents that firm-level tax policies affect the firm risk (Kim et al. 2011; Rego and Wilson 2012; Guenther et al. 2017; Jalan et al. 2016). We extend this line of research and show that aggregate tax policy uncertainty also affects the firms’ default risk. Second, our results also contribute to the research on the impacts of policy uncertainty on firms. Employing different policy uncertainty proxies, previous research shows that aggregate policy uncertainty affects firms’ credit spreads (Kaviani et al. 2020), mergers and acquisitions (Bonaime et al. 2018; and Nguyen and Phan 2017), investment (Gulen and Ion 2016), research and development (Atanassov et al. 2015), and stock prices (Pastor and Veronesi 2012, 2013). Our results indicate that tax policy uncertainty also has significant impacts on firms’ default risk.
Author Contributions
Formal analysis, S.Y.; Project administration, M.S.T.; Writing—original draft, M.S.T. and S.Y.; Writing—review & editing, M.S.T. and S.Y. All authors have read and agreed to the published version of the manuscript.
Funding
This research received no external funding.
Conflicts of Interest
The authors declare no conflict of interest.
Appendix A

Table A1.
Variable definitions.
| Variable | Definition |
|---|---|
| Tax Policy Uncertainty (TPU) | Our TPU definition is similar to Gulen and Ion’s (2016) definition. Specifically, for each firm, the tax policy uncertainty variable (TPU) is measured as the natural logarithm of the arithmetic average of the Baker et al.’s (2016) index for policy uncertainty related to tax code in each year. We obtain tax policy uncertainty data from: http://www.policyuncertainty.com/index.html |
| Expected default frequency (EDF) | Expected default frequency, computed as N(-DD), where N(.) is the cumulative normal distribution function and DD is distance-to-default. DD is calculated following Brogaard et al. (2017) and Bharath and Shumway (2008). |
| Equity | Market value of equity (in millions of dollars) calculated as the product of the number of shares outstanding and stock price at the end of the year. |
| Debt | Face value of debt, in millions of dollars, computed as the sum of debt in current liabilities (Compustat quarterly data #45) and one-half of long-term debt (Compustat quarterly data #51). |
| Excess Return | Annual excess return, calculated as the difference between firm stock return and market return (the CRSP value-weighted market return) over the same period. |
| Inverse Stdev (1/ | One divided by annualized stock return volatility (). Annualized stock return volatility computed as the standard deviation of stock monthly returns over the prior year. |
| Income/Assets | Ratio of net income (Compustat quarterly data #69) to total asset (Compustat quarterly data #44). |
References
- Almeida, Heitor, and Thomas Philippon. 2007. The risk-adjusted cost of financial distress. The Journal of Finance 62: 2557–86. [Google Scholar] [CrossRef]
- Asquith, Paul, Robert Gertner, and David Scharfstein. 1994. Anatomy of financial distress: An examination of junk-bond issuers. The Quarterly Journal of Economics 109: 625–58. [Google Scholar] [CrossRef]
- Atanassov, Julian, Brandon Julio, and Tiecheng Leng. 2015. The Bright Side of Political Uncertainty: The Case of R&D. Available online: https://papers.ssrn.com/sol3/papers.cfm?abstract_id=2648252 (accessed on 11 December 2020).
- Baker, Malcolm, Jeremy C. Stein, and Jeffrey Wurgler. 2003. When does the market matter? Stock prices and the investment of equity-dependent firms. The Quarterly Journal of Economics 118: 969–1005. [Google Scholar] [CrossRef] [Green Version]
- Baker, Scott R., Nicholas Bloom, and Steven J. Davis. 2016. Measuring economic policy uncertainty. The Quarterly Journal of Economics 131: 1593–636. [Google Scholar] [CrossRef]
- Bakke, Tor-Erik, and Toni M. Whited. 2010. Which firms follow the market? An analysis of corporate investment decisions. Review of Financial Studies 23: 1941–80. [Google Scholar] [CrossRef]
- Bharath, Sreedhar T., and Tyler Shumway. 2008. Forecasting default with the Merton distance to default model. The Review of Financial Studies 21: 1339–69. [Google Scholar] [CrossRef]
- Bonaime, Alice, Huseyin Gulen, and Mihai Ion. 2018. Does policy uncertainty affect mergers and acquisitions? Journal of Financial Economics 129: 531–58. [Google Scholar] [CrossRef]
- Brogaard, Jonathan, Dan Li, and Ying Xia. 2017. Stock liquidity and default risk. Journal of Financial Economics 124: 486–502. [Google Scholar] [CrossRef] [Green Version]
- Campbell, John Y., Jens Hilscher, and Jan Szilagyi. 2008. In search of distress risk. The Journal of Finance 63: 2899–939. [Google Scholar] [CrossRef] [Green Version]
- DeAngelo, Harry, and Ronald W. Masulis. 1980. Optimal capital structure under corporate and personal taxation. Journal of Financial Economics 8: 3–29. [Google Scholar] [CrossRef]
- Desai, Mihir A., and Dhammika Dharmapala. 2006. Corporate tax avoidance and high-powered incentives. Journal of Financial Economics 79: 145–79. [Google Scholar] [CrossRef] [Green Version]
- Desai, Mihir A., and Dhammika Dharmapala. 2009. Earnings management, corporate tax shelters, and book-tax alignment. National Tax Journal 62: 169–86. [Google Scholar] [CrossRef] [Green Version]
- Eckbo, B. Espen, Karin S. Thorburn, and Wei Wang. 2016. How costly is corporate bankruptcy for the CEO? Journal of Financial Economics 121: 210–29. [Google Scholar] [CrossRef] [Green Version]
- Fama, Eugene F., and Kenneth R. French. 2002. Testing trade-off and pecking order predictions about dividends and debt. The Review of Financial Studies 15: 1–33. [Google Scholar] [CrossRef]
- Ferris, Stephen P., Narayanan Jayaraman, and Anil K. Makhija. 1997. The response of competitors to announcements of bankruptcy: An empirical examination of contagion and competitive effects. Journal of Corporate Finance 3: 367–95. [Google Scholar] [CrossRef]
- Graham, John R. 2000. How big are the tax benefits of debt? The Journal of Finance 55: 1901–41. [Google Scholar] [CrossRef]
- Guenther, David A., Steven R. Matsunaga, and Brian M. Williams. 2017. Is tax avoidance related to firm risk? The Accounting Review 92: 115–36. [Google Scholar] [CrossRef]
- Gulen, Huseyin, and Mihai Ion. 2016. Policy uncertainty and corporate investment. Review of Financial Studies 29: 523–64. [Google Scholar] [CrossRef]
- Hertzel, Michael G., Micah S. Officer, Zhi Li, and Kimberly J. Rodgers. 2008. Inter-firm linkages and the wealth effects of financial distress along the supply chain. Journal of Financial Economics 87: 374–87. [Google Scholar] [CrossRef]
- Jalan, Akanksha, Jayant R. Kale, and Costanza Meneghetti. 2016. Debt, Bankruptcy Risk, and Corporate Tax Aggressiveness. Available online: https://finance.business.uconn.edu/wp-content/uploads/sites/723/2014/08/Debt-Bankruptcy-Risk-and-Corporate-Tax-Aggressiveness.pdf (accessed on 11 December 2020).
- Kaplan, Steven N., and Luigi Zingales. 1997. Do Investment-Cash Flow Sensitivities Provide Useful Measures of Financing Constraints? Quarterly Journal of Economics 112: 169–215. [Google Scholar] [CrossRef] [Green Version]
- Kashyap, Anil K., Owen A. Lamont, and Jeremy C. Stein. 1994. Credit conditions and the cyclical behavior of inventories. The Quarterly Journal of Economics 109: 565–92. [Google Scholar] [CrossRef]
- Kaviani, Mahsa S., Lawrence Kryzanowski, Hosein Maleki, and Pavel Savor. 2020. Policy uncertainty and corporate credit spreads. Journal of Financial Economics 138: 838–65. [Google Scholar] [CrossRef]
- Kim, Jeong-Bon, Yinghua Li, and Liandong Zhang. 2011. Corporate tax avoidance and stock price crash risk: Firm-level analysis. Journal of Financial Economics 100: 639–62. [Google Scholar] [CrossRef]
- Kisgen, Darren J. 2006. Credit ratings and capital structure. The Journal of Finance 61: 1035–72. [Google Scholar] [CrossRef]
- Lang, Larry H., and Rene M. Stulz. 1992. Contagion and competitive intra-industry effects of bankruptcy announcements: An empirical analysis. Journal of Financial Economics 32: 45–60. [Google Scholar] [CrossRef]
- Lemmon, Michael, and Michael Roberts. 2010. The response of corporate financing and investment to changes in the supply of credit. Journal of Financial and Quantitative Analysis 45: 555–87. [Google Scholar] [CrossRef]
- Liu, Jinyu, and Rui Zhong. 2017. Political uncertainty and a firm’s credit risk: Evidence from the international CDS market. Journal of Financial Stability 30: 53–66. [Google Scholar] [CrossRef]
- Löffler, Gunter, and Alina Maurer. 2011. Incorporating the dynamics of leverage into default prediction. Journal of Banking and Finance 35: 3351–61. [Google Scholar] [CrossRef] [Green Version]
- McCarty, Nolan M. 2012. The policy consequences of partisan polarization in the united states 563–88. Unpublished paper. [Google Scholar]
- McCarty, Nolan M. 2011. The limits of electoral and legislative reform in addressing polarization. California Law Review 99: 359–71. [Google Scholar]
- McCarty, Nolan M., Keith T. Poole, and Howard Rosenthal. 1997. Income Redistribution and the Realignment of American Politics. Washington, DC: AEI Press. [Google Scholar]
- Merton, Robert C. 1974. On the pricing of corporate debt: The risk structure of interest rates. The Journal of Finance 29: 449–70. [Google Scholar]
- Nguyen, Nam H., and Hieu V. Phan. 2017. Policy uncertainty and mergers and acquisitions. Journal of Financial and Quantitative Analysis 52: 613–44. [Google Scholar] [CrossRef] [Green Version]
- Pastor, Lubos, and Pietro Veronesi. 2012. Uncertainty about government policy and stock prices. Journal of Finance 67: 1219–64. [Google Scholar] [CrossRef]
- Pástor, Ľubos, and Pietro Veronesi. 2013. Political uncertainty and risk premia. Journal of Financial Economics 110: 520–45. [Google Scholar] [CrossRef] [Green Version]
- Poole, Keith T., and Howard Rosenthal. 1985. A Spatial Model for Legislative Roll Call Analysis. American Journal of Political Science 29: 357–84. [Google Scholar] [CrossRef]
- Poole, Keith T., and Howard Rosenthal. 2000. Congress: A Political-Economic History of Roll Call Voting. Oxford: Oxford University Press on Demand. [Google Scholar]
- Rego, Sonja Olhoft, and Ryan Wilson. 2012. Equity Risk Incentives and Corporate Tax Aggresiveness. Journal of Accounting Research 50: 775–810. [Google Scholar] [CrossRef]
- Vassalou, Maria, and Yuhang Xing. 2004. Default risk in equity returns. The Journal of Finance 59: 831–68. [Google Scholar] [CrossRef]
- Waisman, Maya, Pengfei Ye, and Yun Zhu. 2015. The effect of political uncertainty on the cost of corporate debt. Journal of Financial Stability 16: 106–17. [Google Scholar] [CrossRef]
- Wang, Xinjie, Weike Xu, and Zhaodong Zhong. 2019. Economic policy uncertainty, CDS spreads, and CDS liquidy provision. The Journal of Futures Markets 39: 461–80. [Google Scholar]
| 1 | The Securities and Exchange Commission (SEC) decreased the minimum tick size from a 16th of a dollar to a 100th of a dollar in 2001. |
| 2 | Debt financing increases firm value because of the tax shield on interest payments (e.g., Graham 2000). |
| 3 | We winsorize all variables, except EDF, at 1st and 99th percentiles to mitigate the impacts of outliers. |
| 4 | We downloaded the TPU index data from Nick Bloom’s Web site (www.policyuncertainty.com). |
| 5 | (Baker et al. 2016) index is used by many influential studies such as (Pástor and Veronesi 2013; Gulen and Ion 2016). |
| 6 | The economic significance calculation procedure is the same as the overall sample procedure we explained above. |
| 7 | We winsorize the ingredients of the index at 1% and 99% before constructing it, as in (Baker et al. 2003). |
| 8 | The original Nominal Three-Step Estimation (NOMINATE) was developed in the 1980s by Keith T. Poole and Howard Rosenthal (Poole and Rosenthal 1985). |
| 9 | (Poole and Rosenthal 2000) state that the first dimension of the DW-NOMINATE scores be interpreted as the legislators’ position on government intervention in the economy. |
Figure 1.
The figure plots cumulative EDF (%) and ln(TPU) during the sample period from 1987 to 2019. Source: Computed by the authors.
Figure 1.
The figure plots cumulative EDF (%) and ln(TPU) during the sample period from 1987 to 2019. Source: Computed by the authors.
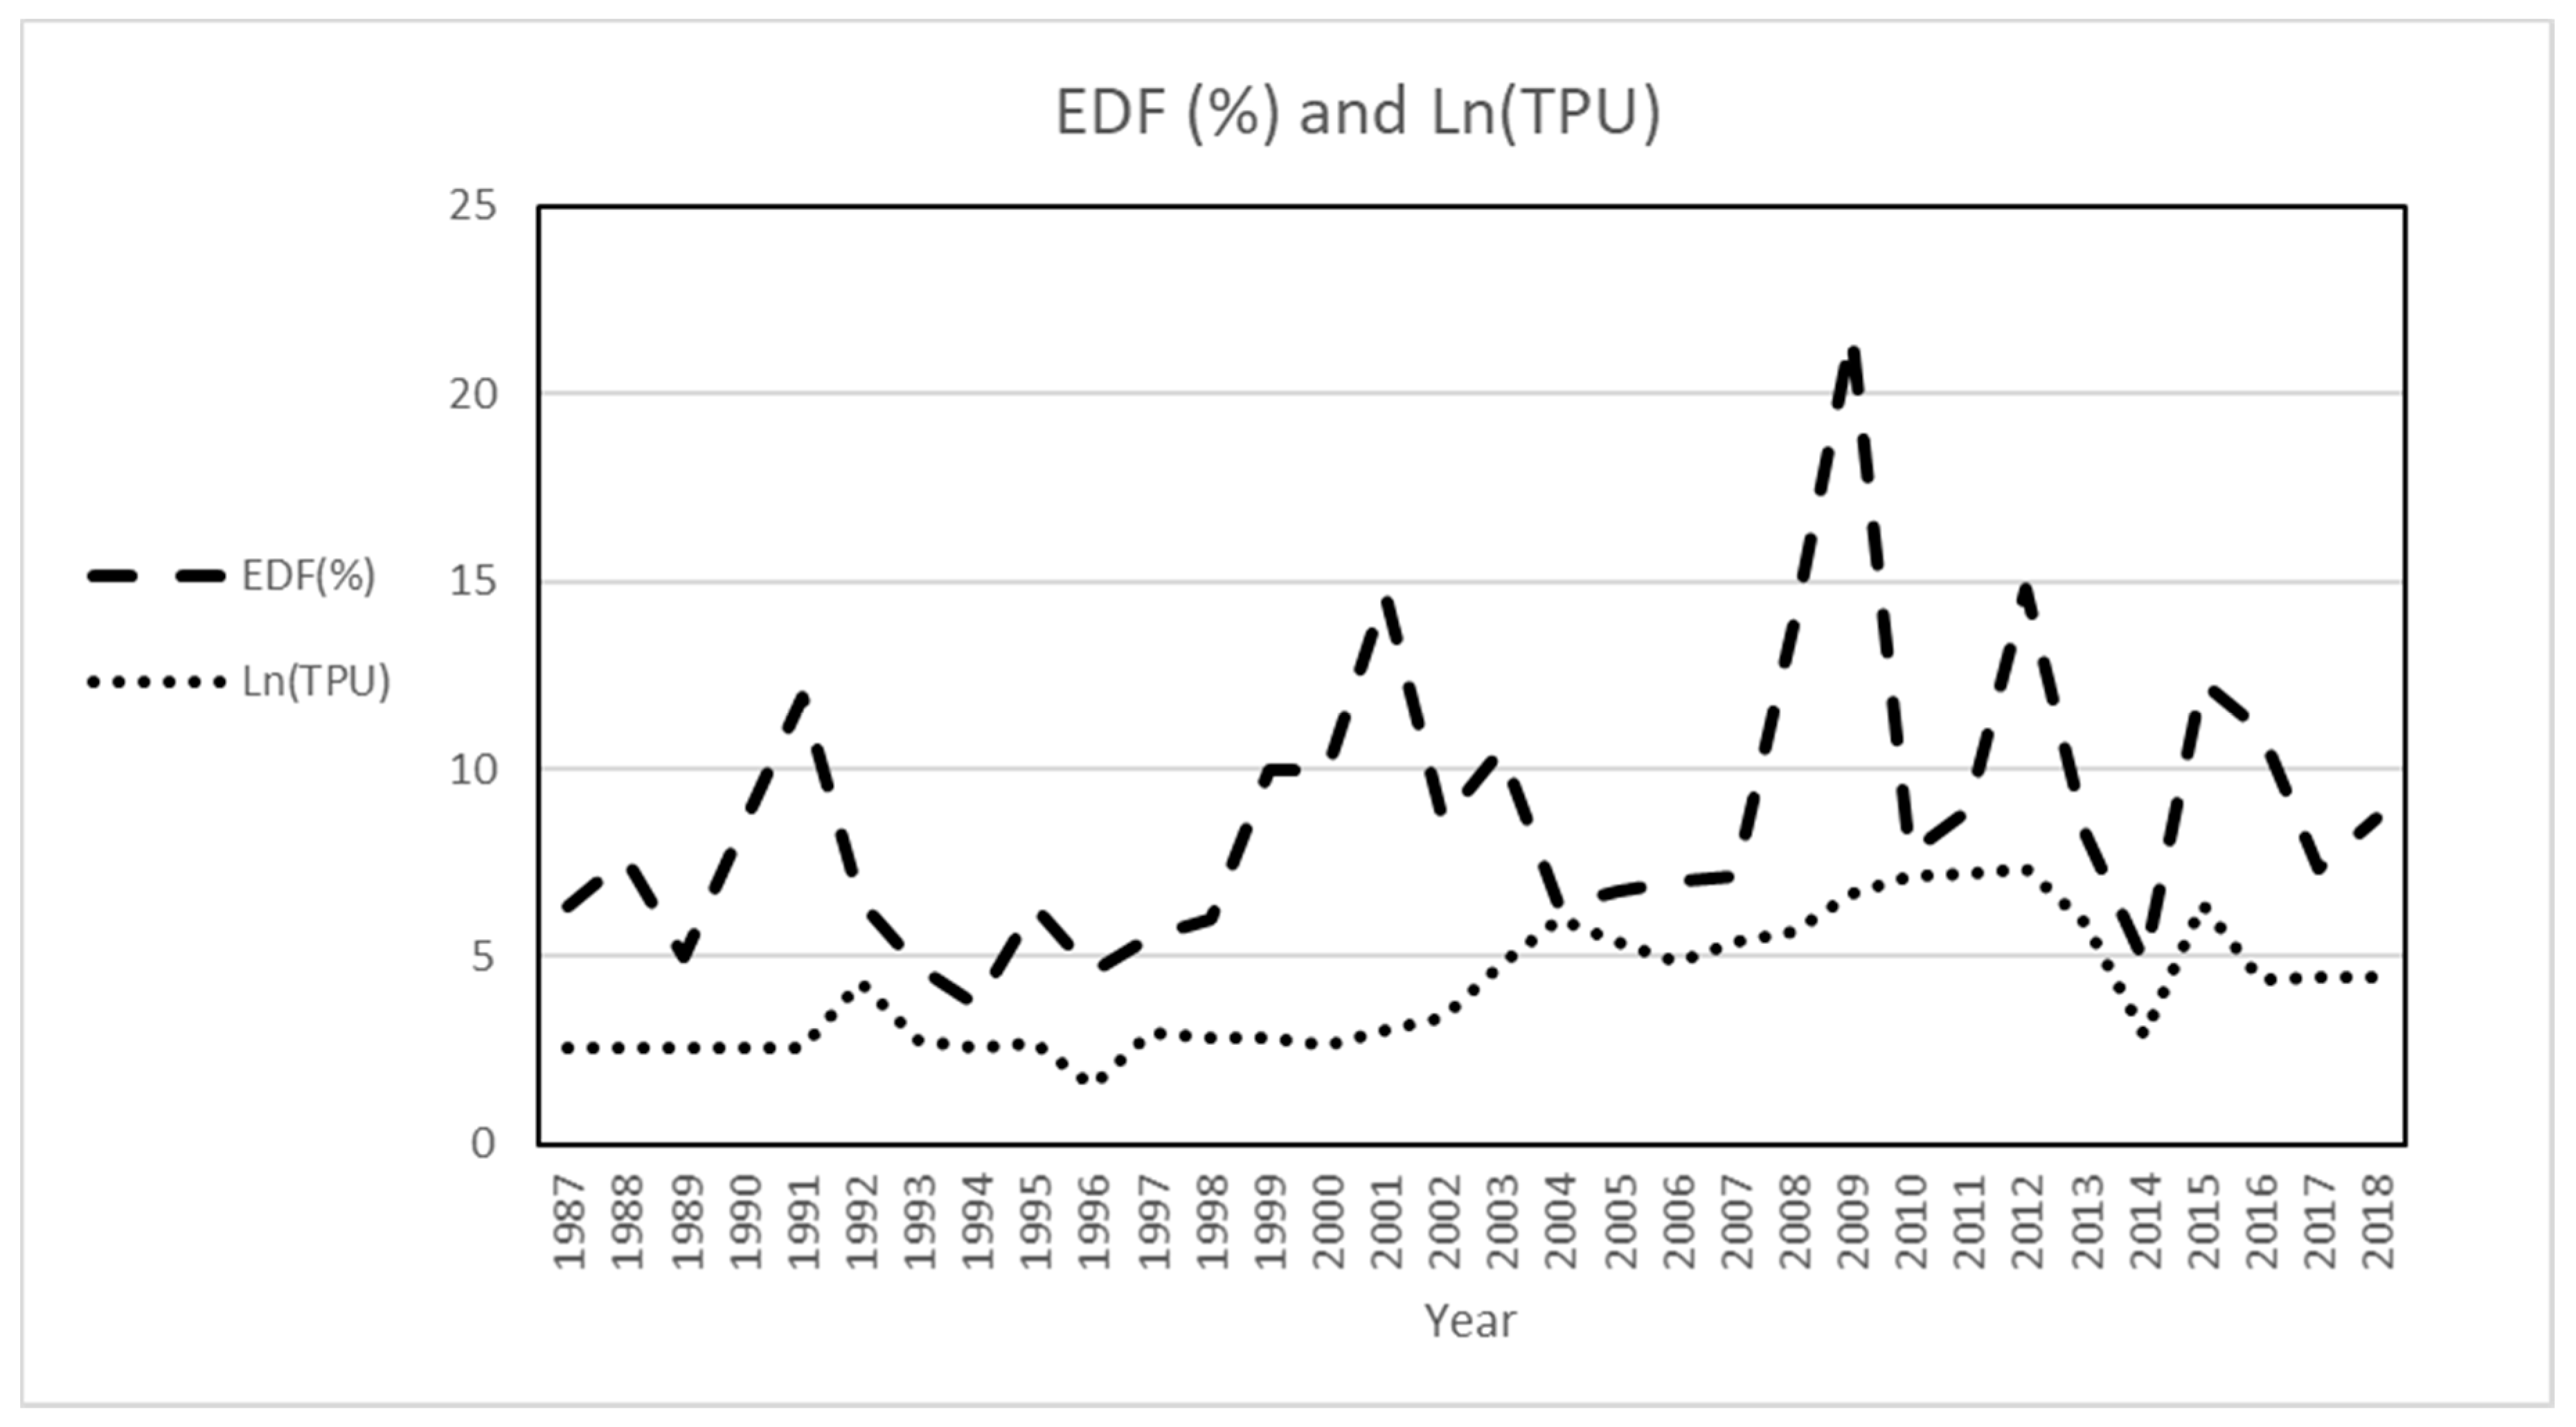
Table 1.
Descriptive Statistics—the initial sample consists of all U.S. common stocks from 1987 to 2019, which are both in the Compustat and Center for Research in Security Prices (CRSP) databases. Following (Brogaard et al. 2017), we exclude financial firms (standard industrial classification (SIC) codes between 6000 and 6999). We also require all firms to have non-missing data for all variables in our main regressions. The final sample has 9888 unique firms and 84,132 firm-year observations. Variable definitions are as in Table A1.
| Panel A: Descriptive Statistics for Tax Policy Uncertainty | ||||||
| N | Mean | Min | Median | Max | Stdev | |
| Ln(TPU) | 33 | 4.2018 | 1.5796 | 4.2992 | 7.3760 | 1.6707 |
| Panel B: Descriptive Statistics for Firm-Level Variables | ||||||
| N | Mean | Min | Median | Max | Stdev | |
| EDF | 84,132 | 0.0462 | 0.0000 | 0.0000 | 1.0000 | 0.1960 |
| Debt | 84,132 | 664.12 | 0.0005 | 59.4100 | 11,199.00 | 1797.45 |
| Ln(debt) | 84,132 | 3.8435 | −7.6009 | 3.9636 | 9.32358 | 2.6949 |
| Equity | 84,132 | 2911.47 | 2.6600 | 320.45 | 53,823.84 | 8176.10 |
| Ln(equity) | 84,132 | 5.7486 | 0.9798 | 5.7100 | 10.8934 | 2.1993 |
| Excess Ret. | 84,132 | 0.0329 | −1.5075 | 0.0124 | 1.9407 | 0.5219 |
| Inverse Stdev | 84,132 | 10.1572 | 1.7367 | 8.7396 | 32.5912 | 5.9122 |
| Income/Assets | 84,132 | −0.0081 | −0.5555 | 0.0086 | 0.1103 | 0.0734 |
| Panel C: Pearson Correlation Coefficients | ||||||
| EDF | Ln(debt) | Ln(equity) | Excess Ret. | Inverse Stdev | Income/Asset | |
| Ln(debt) | 0.0785 | |||||
| Ln(equity) | −0.1003 | 0.9443 *** | ||||
| Excess Ret. | −0.4416 ** | 0.0397 | 0.1155 | |||
| Inverse Stdev | −0.4096 ** | 0.3627 ** | 0.4307 ** | −0.2502 | ||
| Income/Asset | −0.5756 *** | −0.1835 | −0.1239 | −0.0434 | 0.4877 *** | |
| Ln(TPU) | 0.0149 | 0.6919 *** | 0.7093 ** | 0.2178 | 0.0892 | −0.0734 |
Tax policy uncertainty variable is available in time-series. We calculate the means of all firm-level variables each year and turn them into time-series and calculate correlation coefficients. Symbols **, and *** indicate statistical significance at 10%, 5%, and 1% levels, respectively.
Table 2.
Tax policy uncertainty and default risk fixed effect analysis—this table presents firm fixed effects regression results for the impact of tax policy uncertainty on default risk. The sample has 9888 unique firms and 84,132 firm-year observations from 1987 to 2019. In all models, the dependent variable is the expected default frequency (EDF). The main variable of interest tax policy uncertainty (TPU). Panel A presents the results for the overall sample. Panel B reports the coefficients for the TPUs from the regressions with EDF as the dependent variable for each of the Fama and French 12 industries. The last column (Eco. Imp.) reports the economic impact of a standard deviation increase in TPU on default risk on a relative basis. Variables are defined in Appendix A. T-statistics reported in parentheses are calculated using standard errors that are clustered at the firm level and are robust to heteroskedasticity. Symbols *, **, and *** indicate statistical significance at 10%, 5% and 1% levels, respectively.
| Panel A: Overall Sample | Panel B: Within Industry Regressions. | |||||
|---|---|---|---|---|---|---|
| Variables | EDF | Industry: Description | TPU | R2 | N | Eco. Imp. |
| Nondurables: Food, tobacco, textiles, apparel, leather, toys | 0.0063 *** | 0.1782 | 5790 | 22.78% | ||
| TPU | 0.0041 *** | (3.78) | ||||
| (8.48) | Durables: Cars, TVs, furniture, household appliances | 0.0104 *** | 0.1992 | 2952 | 37.60% | |
| ln(equity) | −0.0245 *** | (3.43) | ||||
| (−23.68) | Manufacturing: Machinery, trucks, planes, office furniture, paper, commercial printing | 0.0053 *** | 0.1699 | 11,859 | 19.17% | |
| ln(debt) | 0.0142 *** | (4.39) | ||||
| (22.42) | Energy: Oil, gas, and coal extraction and products | 0.0030 | 0.2547 | 4768 | 0.00% | |
| Inc./Asset | −0.1393 *** | (1.39) | ||||
| (−8.10) | Chemicals: Chemicals and allied products | 0.0062 ** | 0.1684 | 2985 | 22.42% | |
| Exc. Ret. | −0.1137 *** | (2.74) | ||||
| (−47.58) | Business equipment: Computers, software, and electronic equipment | 0.0006 | 0.1086 | 15,259 | 0.00% | |
| Inv. Stdev | −0.0034 *** | (0.61) | ||||
| (−23.45) | Telecommunications: Telephone and television transmission | 0.0051 | 0.2741 | 3139 | 0.00% | |
| (1.54) | ||||||
| Utilities: Utilities | 0.0030 * | 0.1975 | 4118 | 10.85% | ||
| Constant | 0.1524 *** | (1.91) | ||||
| (32.67) | Shops: Wholesale, retail, and some services (laundries, repair shops) | 0.0069 *** | 0.2186 | 9993 | 24.95% | |
| (4.62) | ||||||
| Obs. | 84,132 | Health: Health care, medical equipment, and drugs | 0.0004 | 0.1011 | 9613 | 0.00% |
| R-squared | 0.1676 | (0.40) | ||||
| Firm FE | YES | Other: Mines, construction, building materials, transportation, hotels, business services, entertainment | 0.0067 *** | 0.2318 | 13,656 | 24.22% |
| Clus. SE | YES | (4.96) | ||||
Table 3.
Impact of tax policy uncertainty on default risk conditioned on the overall economy—this table presents firm fixed effects regression results for the impact of tax policy uncertainty on default risk. The sample has 9888 unique firms and 84,132 firm-year observations from 1987 to 2019. In all models, the dependent variable is the expected default frequency (EDF). The main variable of interest tax policy uncertainty (TPU). All variables are defined in Appendix A. We proxy economic conditions as in (Pástor and Veronesi 2013). Specifically, we use industrial production growth (IPG), obtained from the Board of Governors. We proxy recessions with the National Bureau of Economic Research (NBER) recession dummy, equal to one during recession months and zero otherwise. We proxy economic activity with the Chicago Fed National Activity Index (CFI), constructed by the Federal Reserve from 85 monthly indicators of economic activity. The economic impact panel reports the economic impact of a standard deviation increase in TPU on default risk on a relative basis. T-statistics reported in parentheses are calculated using standard errors that are clustered at the firm level and are robust to heteroskedasticity. Symbols **, and *** indicate statistical significance at 10%, 5%, and 1% levels, respectively.
| (1) | (2) | (3) | |||
|---|---|---|---|---|---|
| Variables | EDF | Variables | EDF | Variables | EDF |
| TPU | 0.0024 *** | TPU | 0.0028 *** | TPU | 0.0018 *** |
| (4.89) | (6.12) | (4.07) | |||
| IPG | 0.0671 *** | Recession | 0.0173 *** | CFI | −0.0042 *** |
| (9.15) | (19.93) | (−24.46) | |||
| Ln(equity) | −0.0286 *** | Ln(equity) | −0.0237 *** | Ln(equity) | −0.0243 *** |
| (−23.38) | (−23.28) | (−23.88) | |||
| Ln(debt) | 0.0131 *** | Ln(debt) | 0.0140 *** | Ln(debt) | 0.0128 *** |
| (20.71) | (22.10) | (20.58) | |||
| Income/Assets | −0.1324 *** | Income/Assets | −0.1346 *** | Income/Assets | −0.1332 *** |
| (−7.69) | (−7.91) | (−7.83) | |||
| Excess Ret. | −0.1121 *** | Excess Ret. | −0.1125 *** | Excess Ret. | −0.1114 *** |
| (−46.97) | (−47.75) | (−47.68) | |||
| Inverse Stdev | −0.0034 *** | Inverse Stdev | −0.0031 *** | Inverse Stdev | −0.0032 *** |
| (−23.62) | (−22.06) | (−22.22) | |||
| Constant | 0.1164 ** | Constant | 0.1389 *** | Constant | 0.1616 *** |
| (22.56) | (28.89) | (34.39) | |||
| Observations | 84,132 | Observations | 84,132 | Observations | 84,132 |
| R-squared | 0.1691 | R-squared | 0.1760 | R-squared | 0.1792 |
| Firm FE | YES | Firm FE | YES | Firm FE | YES |
| Clustered SE | YES | Clustered SE | YES | Clustered SE | YES |
| Economic impact | 8.68% | Economic impact | 10.12% | Economic impact | 6.51% |
Table 4.
Impact of tax policy uncertainty on default risk conditioned on stock market conditions—This table presents firm fixed effects regression results for the impact of tax policy uncertainty on default risk. The sample has 9888 unique firms from 1987 to 2019. In all models, the dependent variable is the expected default frequency (EDF). The main variable of interest tax policy uncertainty (TPU). All variables are defined in Appendix A. We proxy the stock market conditions similar to (Pástor and Veronesi 2013). Specifically, we obtain the cyclically adjusted price-to-earnings ratio for the aggregate stock market (P/E), downloaded from Robert Shiller’s website. The down-market binary variable is set equal to one if the CRSP value-weighted market index annual return is less than zero, zero otherwise. The economic impact panel reports the economic impact of a standard deviation increase in TPU on default risk on a relative basis. T-statistics reported in parentheses are calculated using standard errors that are clustered at the firm level and are robust to heteroskedasticity. Symbols *** indicate statistical significance at 10%, 5%, and 1% levels, respectively.
| Market Conditions | Adjusted P/E | Down Market | Up Market |
|---|---|---|---|
| Models | (1) | (2) | (3) |
| Variables | EDF | EDF | EDF |
| TPU | 0.0051 *** | 0.0077 *** | 0.0057 *** |
| (10.07) | (5.02) | (11.30) | |
| Ln(equity) | −0.0258 *** | −0.0206 | −0.0259 *** |
| (−23.56) | (−8.89) | (−23.46) | |
| Ln(debt) | 0.0140 *** | 0.0147 *** | 0.0133 *** |
| (22.13) | (10.23) | (20.02) | |
| Income/Assets | −0.1377 *** | −0.1839 *** | −0.1366 *** |
| (−8.01) | (−4.56) | (−6.58) | |
| Excess return | −0.1131 *** | −0.1197 *** | −0.1107 *** |
| (−47.38) | (−27.43) | (−41.49) | |
| Inverse Stdev | −0.0033 *** | −0.0039 *** | −0.0029 |
| (−22.71) | (−12.99) | (−19.43) | |
| Adjusted P/E | 0.0006 *** | ||
| (4.71) | |||
| Constant | 0.1411 | 0.1221 *** | 0.1372 *** |
| (29.09) | (12.81) | (26.34) | |
| Observations | 84,132 | 20,604 | 63,528 |
| R-squared | 0.1680 | 0.1813 | 0.1677 |
| Firm FE | YES | YES | YES |
| Clustered SE | YES | YES | YES |
| Economic impact | 18.44% | 27.84% | 20.61% |
Table 5.
Impact of tax policy uncertainty on default risk conditioned on financial constraints—this table presents firm fixed effects regression results for the impact of tax policy uncertainty on default risk. The sample has 9888 unique firms from 1987 to 2019. In all models, the dependent variable is the expected default frequency (EDF). The main variable of interest tax policy uncertainty (TPU). All variables are defined in Appendix A. The subsamples are defined into quartiles by the measure of financial constraints as in (Kaplan and Zingales 1997). The economic impact panel reports the economic impact of a standard deviation increase in TPU on default risk on a relative basis. T-statistics reported in parentheses are calculated using standard errors that are clustered at the firm level and are robust to heteroskedasticity. Symbols *, **, and *** indicate statistical significance at 10%, 5%, and 1% levels, respectively.
| Subsamples | (Q1) | (Q2) | (Q3) | (Q4) |
|---|---|---|---|---|
| Least Constrained | Most Constrained | |||
| Models | (1) | (2) | (3) | (4) |
| Variables | EDF | EDF | EDF | EDF |
| TPU | 0.0013 * | 0.0015 *** | 0.0018 ** | 0.0043 *** |
| (1.91) | (2.77) | (2.35) | (3.45) | |
| Ln(equity) | −0.0038 *** | −0.0068 *** | −0.0243 *** | −0.0623 |
| (−2.63) | (−5.08) | (−10.25) | (−21.31) | |
| Ln(debt) | 0.0026 *** | 0.0048 *** | 0.0239 *** | 0.0607 *** |
| (3.76) | (6.45) | (9.92) | (17.00) | |
| Income/Assets | −0.0209 | −0.0119 | −0.1062 *** | −0.1968 *** |
| (−0.55) | (−0.56) | (−3.35) | (−5.94) | |
| Excess Return | −0.0273 *** | −0.0231 *** | −0.0667 *** | −0.2140 *** |
| (−8.09) | (−9.86) | (−18.15) | (−47.38) | |
| Inverse Stdev | −0.0011 *** | −0.0008 *** | −0.0015 *** | −0.0061 *** |
| (−5.49) | (−5.17) | (−7.59) | (−14.95) | |
| Constant | 0.0382 *** | 0.0410 *** | 0.0761 *** | 0.1799 *** |
| (5.23) | (6.89) | (11.01) | (13.63) | |
| Observations | 14,597 | 19,809 | 24,993 | 24,201 |
| R-squared | 0.0333 | 0.0319 | 0.0992 | 0.3265 |
| Firm FE | YES | YES | YES | YES |
| Clustered SE | YES | YES | YES | YES |
| Economic impact | 4.70% | 5.42% | 6.51% | 15.55% |
Table 6.
Impact of tax policy uncertainty on default risk conditioned on credit quality and access to debt market—this table presents firm fixed effects regression results for the impact of tax policy uncertainty on default risk. The sample has 9888 unique firms from 1987 to 2019. In all models, the dependent variable is the expected default frequency (EDF). The main variable of interest tax policy uncertainty (TPU). All variables are defined in Appendix A. An observation is assigned into the subsample of investment-grade (noninvestment grade) if a firm has the credit grade of BBB− and above (BB+ and below or no credit rating) by Standard and Poor’s at the beginning of the year. As in (Kashyap et al. 1994), we proxy access to the bond market with a dummy variable that takes on the value one if the firm has a Standard and Poor’s bond rating as of the beginning of the year, and zero otherwise. The economic impact panel reports the economic impact of a standard deviation increase in TPU on default risk on a relative basis. T-statistics reported in parentheses are calculated using standard errors that are clustered at the firm level and are robust to heteroskedasticity. Symbols **, and *** indicate statistical significance at 10%, 5% and 1% levels, respectively.
| Subsamples | Investment Grade | Non-Investment Grade | Firms without Bond Rating | Firms with Bond Rating |
|---|---|---|---|---|
| Models | (1) | (2) | (3) | (4) |
| Variables | EDF | EDF | EDF | EDF |
| TPU | 0.0014 ** | 0.0038 *** | 0.0037 *** | 0.0039 *** |
| (2.27) | (6.60) | (5.90) | (5.15) | |
| Ln(equity) | −0.0113 *** | −0.0245 *** | −0.0206 *** | −0.0372 *** |
| (−4.56) | (−21.80) | (−17.87) | (−14.47) | |
| Ln(debt) | 0.0072 *** | 0.0143 *** | 0.0125 *** | 0.0229 |
| (4.37) | (21.32) | (18.43) | (10.55) | |
| Income/Assets | −0.2367 *** | −0.1309 *** | −0.1177 *** | −0.2649 *** |
| (−2.86) | (−7.49) | (−6.57) | (−4.79) | |
| Excess Return | −0.0754 *** | −0.1169 *** | −0.0998 *** | −0.1647 *** |
| (−9.84) | (−46.81) | (−39.83) | (−29.30) | |
| Inverse Stdev | −0.0011 *** | −0.0044 *** | −0.0035 *** | −0.0025 *** |
| (−6.47) | (−23.85) | (−18.87) | (−11.86) | |
| Constant | 0.0754 *** | 0.1606 | 0.1329 *** | 0.2014 *** |
| (6.04) | (31.77) | (26.70) | (15.93) | |
| Observations | 14,211 | 69,921 | 58,693 | 25,439 |
| R-squared | 0.0598 | 0.1767 | 0.1517 | 0.2219 |
| Firm FE | YES | YES | YES | YES |
| Clustered SE | YES | YES | YES | YES |
| Economic impact | 5.06% | 13.74% | 13.38% | 14.10% |
Table 7.
Two-stage least square regression results for the relationship between tax policy uncertainty and the expected default frequency—this table presents two-stage least square regression results for the relationship between Tax Policy Uncertainty (TPU) and default risk. In the first stage, TPU is the dependent variable and Polarization is the instrumental variable. We define our instrument, Polarization, as the mean of DW-NOMINATE scores for the Republican party members in the Senate minus the mean for the Democratic party members in the Senate. The p-value of the F-statistic is reported for the validity test of the instrument. In the second stage, the regression model is the same as Table 1 panel A, except that fitted values of TPU from the first stage are used. All variables are defined in Appendix A. The T-statistics reported in parentheses are calculated using standard errors that are clustered at the firm level and are robust to heteroskedasticity. Symbols *** indicate statistical significance at 10%, 5%, and 1% levels, respectively.
| First Stage | Second Stage | ||
|---|---|---|---|
| Variables | TPU | Variables | EDF |
| IV(Polarization) | 6.6334 *** | Fitted TPU | 0.0792 *** |
| (57.69) | (10.41) | ||
| Ln(equity) | 0.1367 *** | Ln(equity) | −0.0296 *** |
| (11.90) | (−21.10) | ||
| Ln(debt) | 0.0397 *** | Ln(debt) | 0.0113 *** |
| (4.98) | (16.59) | ||
| Income/Assets | −0.2819 *** | Income/Assets | −0.1421 *** |
| (−2.97) | (−7.32) | ||
| Excess Return | 0.0405 *** | Excess Return | −0.1071 *** |
| (4.00) | (−41.85) | ||
| Inverse Stdev | −0.0224 *** | Inverse Stdev | −0.0031 *** |
| (−15.42) | (−21.14) | ||
| Constant | −1.5909 *** | Constant | 0.0975 *** |
| (−25.54) | (15.51) | ||
| Observations | 81,892 | Observations | 72,178 |
| R-squared | 0.1768 | R-squared | 0.1641 |
| Firm FE | YES | Firm FE | YES |
| Clustered SE | YES | Clustered SE | YES |
| p-value of F-test for IV validity | 0.0000 |
Publisher’s Note: MDPI stays neutral with regard to jurisdictional claims in published maps and institutional affiliations. |
© 2020 by the authors. Licensee MDPI, Basel, Switzerland. This article is an open access article distributed under the terms and conditions of the Creative Commons Attribution (CC BY) license (http://creativecommons.org/licenses/by/4.0/).
Share and Cite
MDPI and ACS Style
Tosun, M.S.; Yildiz, S. How Does Aggregate Tax Policy Uncertainty Affect Default Risk? J. Risk Financial Manag. 2020, 13, 319. https://doi.org/10.3390/jrfm13120319
AMA Style
Tosun MS, Yildiz S. How Does Aggregate Tax Policy Uncertainty Affect Default Risk? Journal of Risk and Financial Management. 2020; 13(12):319. https://doi.org/10.3390/jrfm13120319
Chicago/Turabian StyleTosun, Mehmet Serkan, and Serhat Yildiz. 2020. "How Does Aggregate Tax Policy Uncertainty Affect Default Risk?" Journal of Risk and Financial Management 13, no. 12: 319. https://doi.org/10.3390/jrfm13120319