Multifractal Analysis of Market Efficiency across Structural Breaks: Implications for the Adaptive Market Hypothesis


Symbiosis Institute of Business Management, Pune, Maharashtra 412115, India
*
Author to whom correspondence should be addressed.
J. Risk Financial Manag. 2020, 13(10), 248; https://doi.org/10.3390/jrfm13100248
Submission received: 29 September 2020
/
Revised: 14 October 2020
/
Accepted: 16 October 2020
/
Published: 20 October 2020
(This article belongs to the Special Issue Market Anomalies in Emerging and Frontier Markets)
Abstract
:The primary objective of this paper is to assess the behavior of long memory in price, volume, and price-volume cross-correlation series across structural breaks. The secondary objective is to find the appropriate structural breaks in the price series. The structural breaks in the series are identified using the Bai and Perron procedure, and in each segment, Multifractal Detrended Fluctuation Analysis (MFDFA) and Multifractal Detrended Cross-Correlation Analysis (MFDCCA) are conducted to capture the long memory in each series. The price series is persistent in small fluctuations and anti-persistent in large fluctuations across all the structural segments. This confirms that long memory in the series is not affected by the structural breaks. Both volume and price-volume cross-correlation are anti-persistent in all the structural segments. In other words, volume acts as a carrier of the information only in the non-volatile (normal) market. The varying Hurst exponent across the structural segments indicates the varying levels of persistence and signifies the volatile market. The findings of the study are useful for understanding the practical implications of the Adaptive Market Hypothesis (AMH).
1. Introduction
Prices in an informationally efficient market have no memory and therefore present no opportunities for investors to make excess returns for the level of risk taken (Fama 1970). The presence of long memory in a series thus contradicts the tenets of the Efficient Market Hypothesis (EMH) and implies the inefficiency of a market. In an inefficient market having long memory properties, prices are dependent on past values, making it possible to forecast the returns and make excess returns. The focal point of the weak form of market efficiency is the past value of prices, trading volume (Rizvi and Arshad 2017). Since investors make their allocation decisions based on the market information, the presence of an inefficient market affects their investment horizon and portfolio allocation decisions (Lo 1991).
The weak form of the market efficiency is studied in terms of linear auto-correlation, unit root, and variance ratio tests in a return series (see (Gozbasi et al. 2014; Kim 2009; Konak and Şeker 2014)) and in terms of contemporaneous and causal studies in the price-volume relationship (e.g., (Chen 2012; Gupta and Yang 2011; Lee and Swaminathan 2000)). Mandelbrot et al. (1997) claimed that asset returns are multifractal in nature. Many studies have been conducted to capture the market inefficiency using this multifractal nature of the assets (Kantelhardt et al. 2002; Zunino et al. 2008, 2009).
In an inefficient market, the investment decisions are conditional on the behavioral facet of the investors (De Bondt and Thaler 1985) and are limited by their rationality in understanding the time-varying market environment (Lo 2004, 2012). Thus, investors adapt to the changing business environments and change their investment decision, which leads to the adaptive market hypothesis as proposed by Lo 2004. Di Matteo et al. (2003, 2005), Cajueiro and Tabak (2004, 2005), and Eom et al. (2008) have found that in many cases, under-developed markets exhibit long memory. The presence of long memory has implications for the policymakers of a country as they have to draft policies that reduce this investment imbalance. Therefore, the policymakers need to be sure of the presence of long memory in a series before the policies are implemented.
Diebold and Inoue (2001) showed that the structural breaks in a series are misinterpreted as the presence of long memory in a series. Long memory in a series is represented by an auto-correlation that decays asymptotically hyperbolically and represents dependence on its past values. Structural breaks in a series may instigate the slow decay in the auto-correlation (Lamoureux and Lastrapes 1990), and it may be construed as the presence of long memory in a series (Granger and Hyung 2004). Thus, assessing the role of the structural changes in the models that estimate the long memory is essential before the conclusions are drawn.
Structural breaks may be an artifact of the regulatory or environmental factors such as a change in the trading system to a country’s FIIpolicy. India too has seen these changes in its stock market, and it has impacted the efficiency of the market (Shah 1999). The efficiency of the Indian market was studied by Hiremath and Kumari (2014); Razdan (2002); Stošić et al. (2015) among others using the past price series. Very few studies have been conducted in the price-volume relationship to assess the Indian market efficiency (Dutta et al. 2016; Hasan and Salim 2017). No multifractal study has been carried out to test the relation between price and volume across structural breaks in India. This is the motivation for conducting this study with the following objectives:
- To assess the impact of structural breaks on the long-memory in the price, volume, and price-volume relationship;
- To detect the possible change in the price-volume relationship among these breaks.
2. Literature Review
2.1. Multifractality and Price-Volume Relationship
Fluctuation in a time series is heterogenic in nature (Cont 2001). Mandelbrot et al. (1997) found that the fluctuation of the series over different time segments is fractal in nature. This fractal nature of the series was further established by Kantelhardt et al. (2002) and studied by Zunino et al. (2009). Zunino et al. (2008) argued further that multifractal analysis has been used empirically extensively to capture market efficiency. The multifractality in prices was studied by Arshad and Rizvi (2015); Horta et al. (2014); Stošić et al. (2015); Tiwari et al. (2019), and Ferreira et al. (2017), to name a few.
In an inefficient market, the volume contains information that can be derived by the investors (Blume et al. 1994; Suominen 2001). Since the seminal study of Karpoff (1986, 1987), the price-volume relationship has been studied by researchers using different models such as Sequential arrival of Information Flow (SIF) by Copeland (1976) and the Mixture of Distribution Models (MDM) by Clark (1973) and Epps and Epps (1976). There is no agreement on the exact relationship between the price and volume.
In the multivariate version of the MFDFA, the cross-correlation between price and volume was studied by Bolgorian and Gharli (2011); Rak et al. (2015), and El Alaoui (2017).
2.2. MFDCCA and the Adaptive Market Hypothesis
In the context of the time-varying market efficiency, Lo (2004) presented the concept of the adaptive market hypothesis based on the behavioral aspect of the investors. The series exhibiting the time-varying dependence structure adheres to the principles of the AMH (Kristoufek and Vosvrda 2013). A few studies that conducted multifractal cross-correlation analysis to corroborate the AMH were by Ferreira (2019); Hasan and Salim (2017); Ruan et al. (2016); Sukpitak and Hengpunya (2016), and Stošić et al. (2015). For an exhaustive review of the literature on the market efficiency and price-volume relationship, readers are directed to Patil and Rastogi (2019).
3. Methodology
3.1. Structural Breaks
Optimal breakpoints are required to be calculated in regression relationships in order to identify the segments on which further analysis can be performed. In this study, structural change is identified based on the regression-based method. Bai (1994) provided the base for calculating breakpoints in regression models, which was further modified by Bai (1997) and Bai and Perron (1998 and 2003) to identify multiple breakpoints. This study employs the procedure detailed in Bai and Perron (2003). The procedure tests the fluctuation from stability in the regression modeling given by:
The procedure to identify breaks begins with an assumption that there are m breakpoints, which is equivalent to having segments. The coefficients are shifted from one balanced regression to another as shown in Equation (2), and segments are chosen that have the minimum Residual Sum of Squares (RSS) and have the lowest Bayesian Information Criteria (BIC) value.
where j indicates the segment number.
3.2. Detrended Fluctuation Analysis
Detrended Fluctuation Analysis (DFA) captures the structure of a series and determines the properties that define the long memory in a series. The DFA was developed by Kantelhardt et al. (2002) to address the issue of series having a trend. The modified version called the multifractal-DFA (MFDFA) can be applied to a nonstationary time series. Fundamentally, the method calculates the Hurst exponent and constructs a multifractal spectrum. Kantelhardt et al. (2002); Peng et al. (1995), and Jiang et al. (2019) described the method of calculating the multifractal spectrum.
3.3. MFDFA
This method involves calculating the detrended residuals of a random walk-like time series, which are split into same-size segments such that the segments are not overlapping. In each segment, the root mean square of these residuals is calculated, the average of which is termed the local detrended fluctuation function. Further, the qth order of this local detrended fluctuation function is calculated. The relationship between the segment size and fluctuation function is governed by the power law. This power law relationship is captured in the Hurst exponent and explained with a multifractal spectrum. The above steps are carried out using the following equations:
- a
- The detrended residuals are calculated using the following equation:
- b
- The fluctuation function is calculated as the RMS of the detrended residuals:
- c
- The order of the fluctuation function is calculated for a given value of q.
- d
- The power law relation is then described by the equation:
The singularity spectrum explains the fractal dimension of these multifractals, where is the singularity strength. This fractal dimension expressed in terms of is calculated as:
where is expressed in terms of generalized Hurst exponent :
or:
3.4. MFDCCA
The multivariate version of the MFDFA was improved by Zhou (2008) after the work of Podobnik and Stanley (2008). This method was described by Jiang et al. (2019) and is explained next. As with the MFDFA case, the detrended residuals of these two series are divided into segments of equal size, s. In each segment, the root mean square of the residuals is calculated, the average of which is termed the cross-correlation. The qth order of the cross-correlation follows the power law. This power law relationship is captured in the Hurst exponent and explained with a multifractal spectrum. Similar steps for cross-correlation are calculated as in the MFDFA case, and the fluctuation function is calculated using equation:
The qth order cross-correlation between the series is calculated as:
and the scaling relation is expressed by:
4. Data and Analysis
4.1. Data
The price and volume (number of trades) data are obtained for the Indian stock market index, Sensex, from 13 July 1995 to 6 August 2019. The natural logarithms of the price and volume series are taken to calculate the return and volume change. Further analysis is done using these data. The following Table 1 gives the summary statistics of the data used for the analysis. A cursory glance at Figure 1 shows that the volume series has higher volatility.
4.2. Analysis of Structural Breaks
In identifying structural breaks, generally, the first break dates are found by determining a change in the linear coefficients (or error variance), and then, on these break dates, the error variance (change in coefficients) is tested (Perron and Yamamoto 2019). The Cumulative sum of Squares (CUMSQ) tests for testing the changes in the variance only (elaborated by Chen and Gupta (1997); Inclan and Tiao (1994), and Wied et al. (2012)) is adequate under the assumption of no change in the coefficients for a normally distributed time series. In the present study, we do not comply with the assumptions. Therefore, first, the structural breaks are identified using changes in the coefficients, and then, the variance (fluctuation) in each break is tested using the MFDFA method.
Structural breaks were identified using strucchange package (Zeileis et al. 2002) in the R software (R Core Team 2020). The breakpoints were calculated using the method prescribed in Zeileis et al. (2003) based on the procedure of Bai and Perron (2003). The optimal number of structural breaks was chosen at the lowest BIC value. The lowest BIC was obtained at four breaks (i.e., five segments), as shown in Figure 2.
The break dates were obtained on 10 October 2002 (Market crash of 2002, Enron fraud, etc.), 25 January 2006 (China and India estimated to grow at 7–8%), 7 September 2009 (the Financial Crisis), and 30 May 2014 (the Russian Crisis). Based on the break dates, the data were split into segments to conduct further analysis. The primary analysis produces the summary statistics of the structural breaks in the series as shown in Table 2.
Figure 3 shows the structural breaks at these breakpoints superimposed on the price series with the corresponding linear regression lines.
Next, a multifractal analysis of these segments is conducted and is covered in the next subsection.
4.3. Multifractal Analysis
The multifractal analysis was done using the MFDFA package (Laib et al. 2019). The series was transformed into a random walk-like structure before the DFA test was applied. As the return and volume change series are noise-like structures, they were transformed into random walks by deducting the mean and integrating the series. Each segment identified was further analyzed using MFDFA by setting the values of a sample size of non-overlapping segments, called scale, to vary from 10 to 100. The order of moments, q, in each such sample was then set to vary between and 10. The order of the polynomial for detrending, m, was set to one.
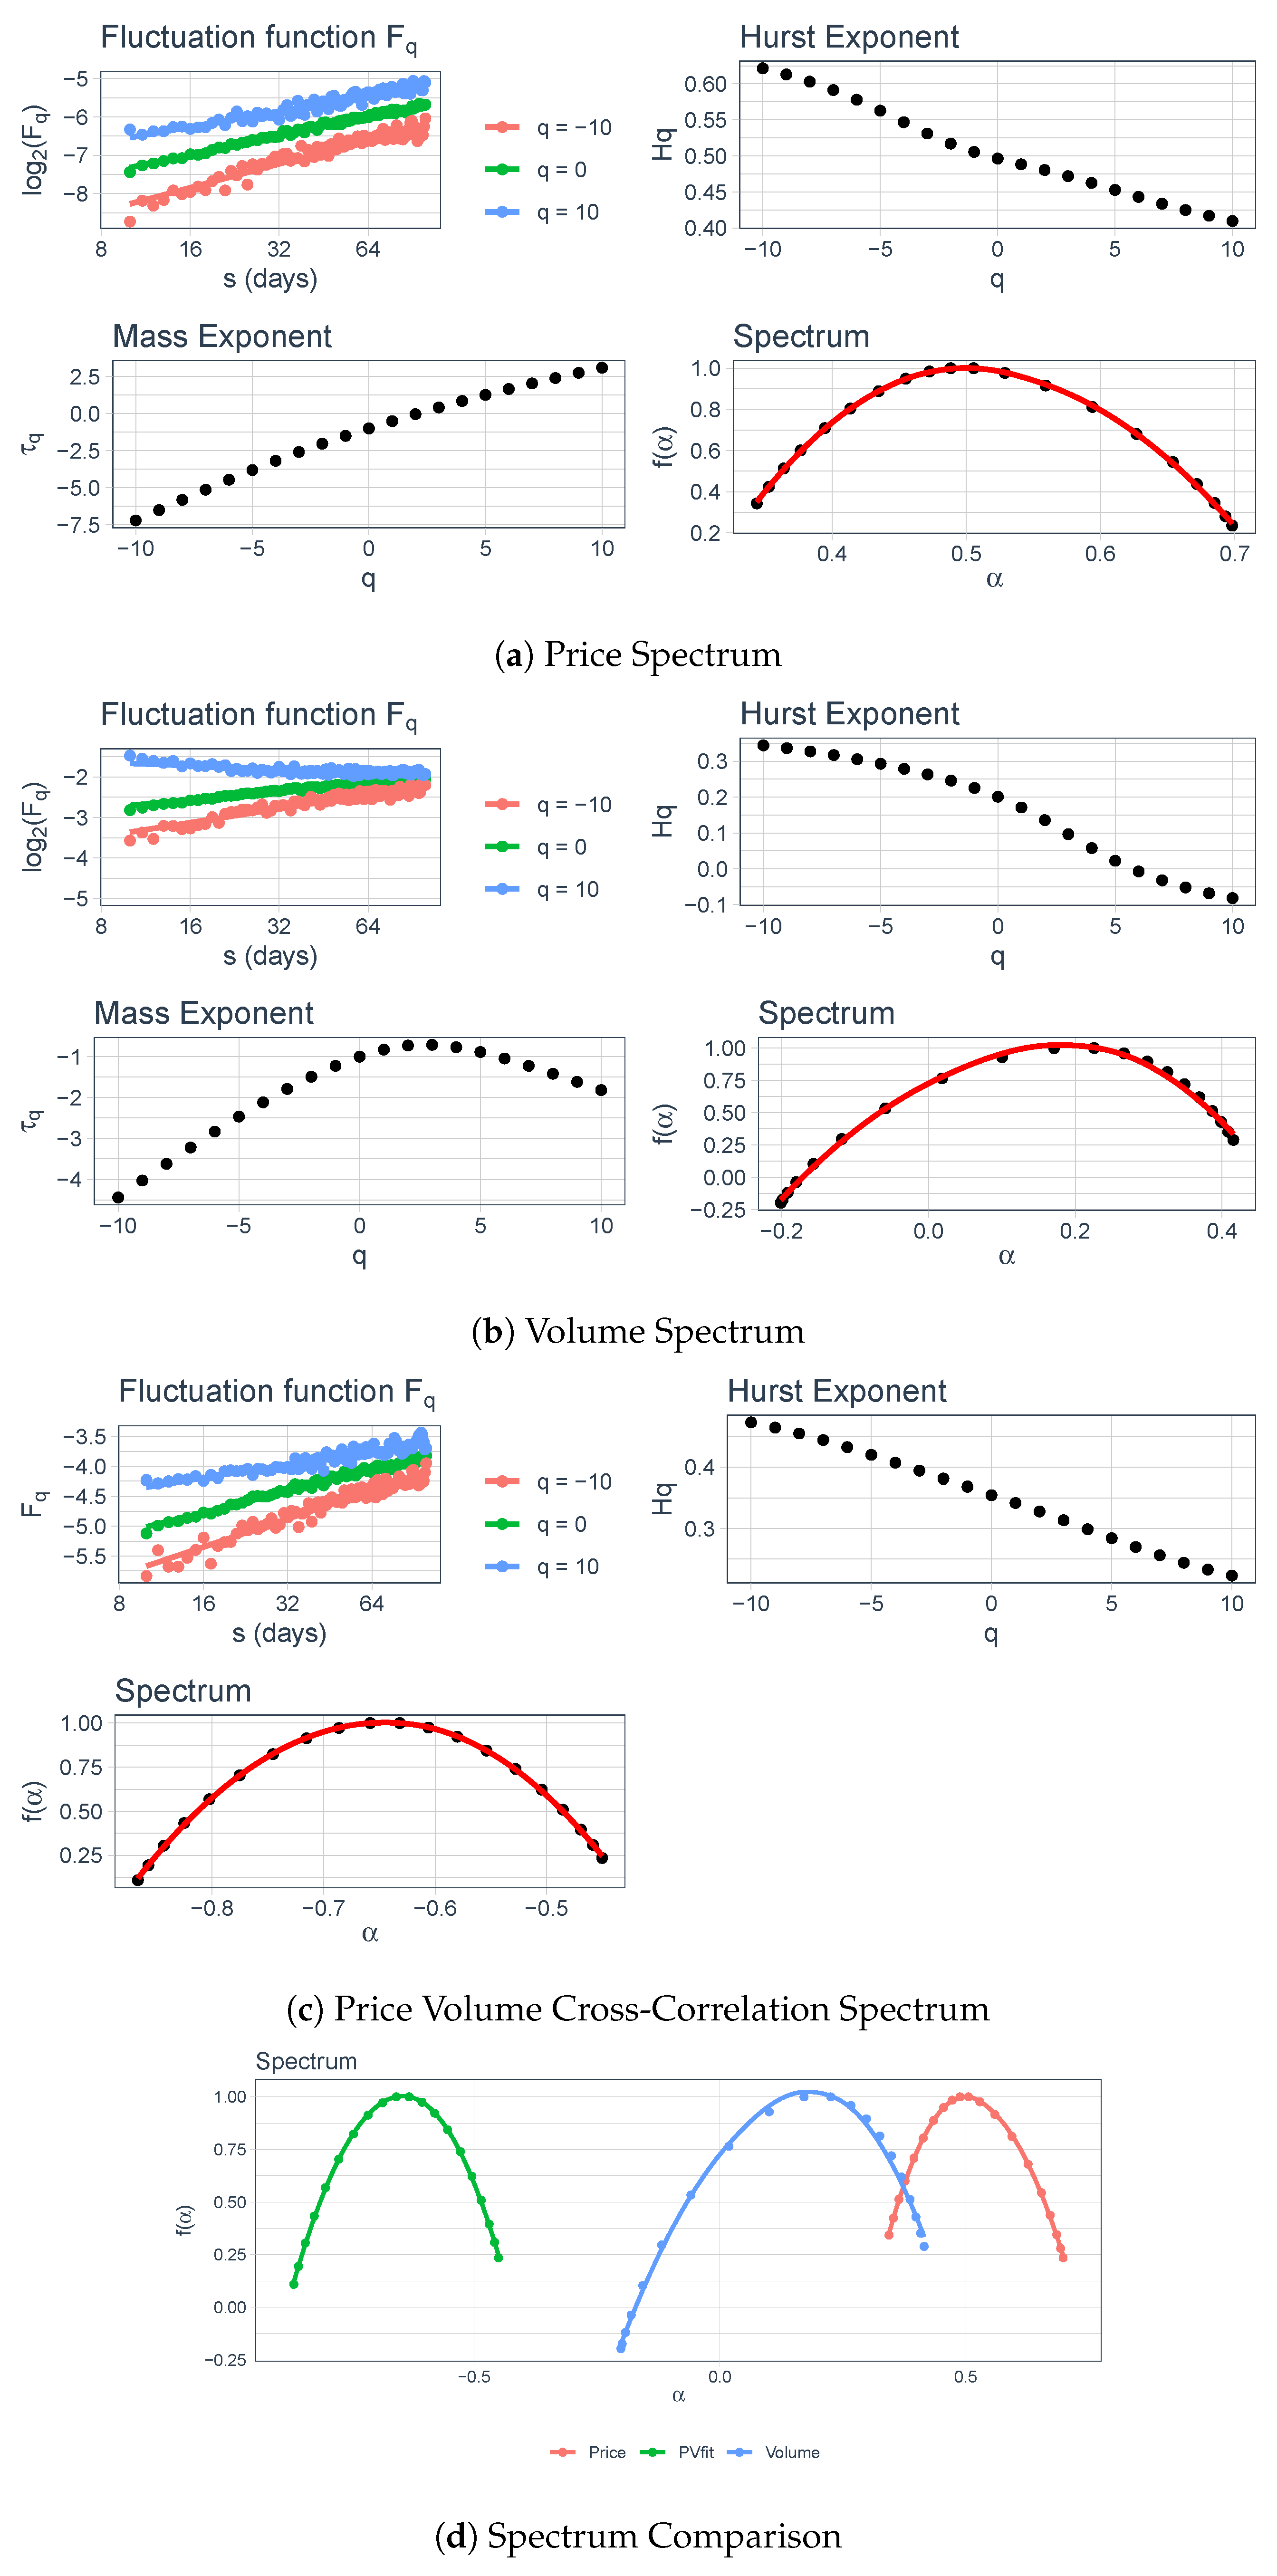
Interpretation of the Graphs
Each figure contains four panels: Panel (a) covers the price; Panel (b) covers the volume; Panel (c) covers the price-volume cross-correlation; and Panel (d) covers the comparison of the spectrum. Panel (a) and Panel (b) further include the fluctuation function (refer to Equation (5)), Hurst exponent (refer to Equation (8)), mass exponent (refer to Equation (9)), and singularity spectrum (refer to Equation (7). Panel (c) includes only the fluctuation function, Hurst exponent, and singularity spectrum.
Each graph is then interpreted in terms of the fluctuation function, Hurst exponent, and multifractal spectrum as detailed in Kantelhardt et al. (2002) and Zhang et al. (2019). The fluctuation function indicates the change in the fluctuation in the time series across different time segments for different q values. The Hurst exponent indicates the persistent and anti-persistent properties. The mass exponent indicates the structure of the series, and the spectrum represents the fractality dimension.
(a) The value of the Hurst exponent between zero and indicates that the series is anti-persistent, i.e., they have no long memory. At , the data are random, and this corroborates the EMH. For the values between and one, the series are fractal and indicate the presence of long memory. (b) The mass exponent is nonlinear when the series exhibits multifractality. (c) The spectrum of the series that have no long memory (anti-persistent) is left-shifted from .
Further, Kantelhardt et al. (2002) proved that small fluctuations are represented by when q is negative and large fluctuations when q is positive.
The range of indicates the multifractal strength of the series, and the range of indicates the intensity and complexity of the time series data. The higher range of implies the higher fluctuation and uneven distribution.
5. Results and Discussion
5.1. Entire Data
The price spectrum in Figure 4a shows that large fluctuations in price with positive q values are anti-persistent, i.e., having values of between zero and . In the case of both volume and price-volume cross-correlation, the spectrum in Figure 4b,c confirms that both series are anti-persistent in large, as well as small fluctuations. The comparison of the spectrum in Figure 4d shows that price-volume cross-correlation is more anti-persistent than volume series.
5.2. Segment 1–Segment 5
The price spectrum in Panel (a)s of Figure 5 on page 9, Figure 6 on page 10, Figure 7 on page 12, Figure 8 on page 13, Figure 9 on page 14 shows that large fluctuations in price with positive q values are anti-persistent, i.e., having values of between zero and . In the case of both volume and price-volume cross-correlation, the Panel (b)s and Panel (c)s in Figure 5 on page 9 through Figure 9 on page 14 confirms that both series are anti-persistent in large and small fluctuations. The comparison of the spectrum in Panel (d)s of Figure 4 through Figure 9 shows that the price-volume cross-correlation is more anti-persistent than volume series across all segments.
In summary, the results of the MFDFA show that only the small fluctuations in price series across all segments and in all the data are persistent, i.e., small fluctuations have long memory. This signifies that small positive (negative) fluctuations are expected to precede small positive (negative) fluctuations. This implies that when the volatility is low, the markets are inefficient. This further establishes the fact that long memory in the series is not affected by the structural breaks.
The volume and price-volume cross-correlation have no long memory, and they are mean-reverting, i.e., large positive (negative) fluctuations are expected to precede large negative (positive) fluctuations. This implies that volume and price-volume cross-correlation are efficient and support the EMH. Put another way, volume acts as a carrier of the information only in the non-volatile (normal) market and does not influence the price in a volatile market.
In the volatile market, large positive fluctuations are followed by large negative fluctuations in all price, volume, and price-volume relationships. For example, large positive cross-correlation between price-volume is likely to be followed by large negative cross-correlation. It is in this context that volume may carry information about the price.
The time-varying Hurst exponent for both large and small fluctuations indicates the changing level of persistence. It can be seen that large fluctuations (both positive and negative) do arise in each segment, and the level of persistence for both large and small fluctuations changes in each segment. The changing dynamics implies the volatility in the market. This has implications for the AMH as the high volatility period is seen in each segment and market efficiency varies across each segment. This indicates the opportunity to achieve excess returns from time to time. Alternatively, it can be said that markets are efficient only when the market fluctuations are large.
A Comparison of long memory across segments is summarized in Table 3, and a comparison of multifractal strength and intensity is summarized in Table 4.
One can observe from Table 4 that both multifractal strength and the intensity and complexity of volume and price-volume correlation increased up to Segment 3 (i.e., up to the Financial Crisis) and decreased after the Financial Crisis. The increasing complexity and multifractality denote an uneven distribution and higher fluctuation. In other words, the volume and price-volume cross-correlation became unstable up to the crisis period. Thus, increasing complexity in volume may indicate the signal of the impending crisis period. However, price is indifferent to the segments and continues to decrease over the period, which indicates that the distribution of price is becoming stable with decreasing fluctuation. This signifies that price is becoming efficient over the period.
6. Conclusions
This paper conducts a multifractal analysis of price, volume, and price-volume cross-correlation across structural breaks. The MFDFA is conducted on the all the data from 1995 to 2019 and also across four structural breaks identified using the procedure of Bai and Perron (2003). The results indicate that the prices have long memory in both a normal and volatile market; however, the complexity and intensity of prices is decreasing, indicating that the prices are becoming efficient over the period. On the other hand, volume and price-volume correlation have low or no memory during the normal period and thus conform to the EMH. However, during the volatile period, volume and price-volume cross-correlation increase in complexity and thus indicate the conformance to the principles of the AMH.
The Hurst exponent varies across each segment, which implies a volatile market, and prices show long memory in such a market, creating opportunities for excess return occasionally, which is in line with the tenets of the AMH. Further research could be directed to compare the performance of various markets across different market indices within a country and across different countries.
Author Contributions
These authors contributed equally to this work. Conceptualization, A.C.P.; formal analysis, A.C.P.; investigation, S.R.; methodology, A.C.P.; software, A.C.P.; validation, S.R.; writing, review and editing, A.C.P. and S.R. All authors read and agreed to the published version of the manuscript.
Funding
This research received no external funding.
Conflicts of Interest
The authors declare no conflict of interest.
Abbreviations
The following abbreviations are used in this manuscript:
| AMH | Adaptive Market Hypothesis |
| BIC | Bayesian Information Criteria |
| EMH | Efficient Market Hypothesis |
| MFDFA | Multifractal Detrended Fluctuation Analysis |
| MFDCCA | Multifractal Detrended Cross-Correlation Analysis |
| MDM | Mixture of Distribution Model |
| RSS | Residual Sum of Squares |
| SIF | Sequential arrival of Information Flow |
References
- Arshad, Shaista, and Syed Aun R. Rizvi. 2015. The troika of business cycle, efficiency and volatility. an east asian perspective. Physica A Statistical Mechanics and Its Applications 419: 158–70. [Google Scholar] [CrossRef]
- Bai, Jushan, and Pierre Perron. 1998. Estimating and testing linear models with multiple structural changes. Econometrica 66: 47–78. [Google Scholar] [CrossRef]
- Bai, Jushan, and Pierre Perron. 2003. Computation and analysis of multiple structural change models. Journal of Applied Econometrics 8: 1–22. [Google Scholar] [CrossRef] [Green Version]
- Bai, Jushan. 1994. Least squares estimation of a shift in linear processes. Journal of Time Series Analysis 15: 453–72. [Google Scholar] [CrossRef] [Green Version]
- Bai, Jushan. 1997. Estimation of a change point in multiple regression models. Review of Economics and Statistics 79: 551–63. [Google Scholar] [CrossRef]
- Blume, Lawrence, David Easley, and Maureen O’hara. 1994. Market statistics and technical analysis: The role of volume. The Journal of Finance 49: 153–81. [Google Scholar] [CrossRef]
- Bolgorian, Meysam, and Zahra Gharli. 2011. A multifractal detrended fluctuation analysis of gold price fluctuations. Acta Physica Polonica B 42: 159–69. [Google Scholar] [CrossRef]
- Cajueiro, Daniel O., and Benjamin M. Tabak. 2004. The hurst exponent over time: Testing the assertion that emerging markets are becoming more efficient. Physica A Statistical Mechanics and Its Applications 336: 521–37. [Google Scholar] [CrossRef]
- Cajueiro, Daniel O., and Benjamin M. Tabak. 2005. Ranking efficiency for emerging equity markets ii. Chaos Solitons Fractals 23: 671–75. [Google Scholar] [CrossRef]
- Chen, Jie, and Arjun K. Gupta. 1997. Testing and locating variance changepoints with application to stock prices. Journal of the American Statistical association 92: 739–47. [Google Scholar] [CrossRef]
- Chen, Shiu-Sheng. 2012. Revisiting the empirical linkages between stock returns and trading volume. Journal of Banking Finance 36: 1781–88. [Google Scholar] [CrossRef] [Green Version]
- Clark, Peter K. 1973. A subordinated stochastic process model with finite variance for speculative prices. Econometrica 41: 135–55. [Google Scholar] [CrossRef]
- Cont, Rama. 2001. Empirical properties of asset returns: Stylized facts and statistical issues. Quantitative Finance 1: 223–36. [Google Scholar] [CrossRef]
- Copeland, Thomas E. 1976. A model of asset trading under the assumption of sequential information arrival. The Journal of Finance 31: 1149–68. [Google Scholar] [CrossRef]
- De Bondt, Werner F. M., and Richard Thaler. 1985. Does the stock market overreact? The Journal of Finance 40: 793–805. [Google Scholar] [CrossRef]
- Diebold, Francis X., and Atsushi Inoue. 2001. Long memory and regime switching. Journal of Econometrics 105: 131–59. [Google Scholar] [CrossRef] [Green Version]
- Di Matteo, Tiziana, Tomaso Aste, and Michel M. Dacorogna. 2003. Scaling behaviors in differently developed markets. Physica A Statistical Mechanics and Its Applications 324: 183–88. [Google Scholar] [CrossRef]
- Di Matteo, Tiziana, Tomaso Aste, and Michel M. Dacorogna. 2005. Long-term memories of developed and emerging markets: Using the scaling analysis to characterize their stage of development. Journal of Banking Finance 29: 827–51. [Google Scholar] [CrossRef] [Green Version]
- Dutta, Srimonti, Dipak Ghosh, and Sucharita Chatterjee. 2016. Multifractal detrended cross correlation analysis of foreign exchange and sensex fluctuation in indian perspective. Physica A Statistical Mechanics and Its Applications 463: 188–201. [Google Scholar] [CrossRef]
- El Alaoui, Marwane. 2017. Price–volume multifractal analysis of the moroccan stock market. Physica A Statistical Mechanics and Its Applications 486: 473–85. [Google Scholar] [CrossRef]
- Eom, Cheoljun, Gabjin Oh, and Seunghwan Kim. 2008. Statistical investigation of connected structures of stock networks in financial time series. Journal of the Korean Physical Society 53: 3837–41. [Google Scholar] [CrossRef] [Green Version]
- Epps, Thomas W., and Mary Lee Epps. 1976. The stochastic dependence of security price changes and transaction volumes: Implications for the mixture-of-distributions hypothesis. Econometrica 44: 305–21. [Google Scholar] [CrossRef]
- Fama, Eugene F. 1970. Efficient capital markets: A review of theory and empirical work. The Journal of Finance 25: 383–417. [Google Scholar] [CrossRef]
- Ferreira, Paulo, Andreia Dionísio, and SMS Movahed. 2017. Assessment of 48 stock markets using adaptive multifractal approach. Physica A Statistical Mechanics and Its Applications 486: 730–50. [Google Scholar] [CrossRef] [Green Version]
- Ferreira, Paulo. 2019. Assessing the relationship between dependence and volume in stock markets: A dynamic analysis. Physica A Statistical Mechanics and Its Applications 516: 90–97. [Google Scholar] [CrossRef]
- Gozbasi, Onur, Ilhan Kucukkaplan, and Saban Nazlioglu. 2014. Re-examining the turkish stock market efficiency: Evidence from nonlinear unit root tests. Economic Modelling 38: 381–84. [Google Scholar] [CrossRef]
- Granger, Clive W. J., and Namwon Hyung. 2004. Occasional structural breaks and long memory with an application to the s&p 500 absolute stock returns. Journal of Empirical Finance 11: 399–421. [Google Scholar]
- Gupta, Rakesh, and Junhao Yang. 2011. Testing weak form efficiency in the indian capital market. International Research Journal of Finance and Economics 75: 108–19. [Google Scholar]
- Hasan, Rashid, and M. Mohammed Salim. 2017. Power law cross-correlations between price change and volume change of indian stocks. Physica A Statistical Mechanics and Its Applications 473: 620–31. [Google Scholar] [CrossRef]
- Hiremath, Gourishankar S., and Jyoti Kumari. 2014. Stock returns predictability and the adaptive market hypothesis in emerging markets: Evidence from india. SpringerPlus 3: 428. [Google Scholar] [CrossRef] [Green Version]
- Horta, Paulo, Sérgio Lagoa, and Luis Martins. 2014. The impact of the 2008 and 2010 financial crises on the hurst exponents of international stock markets: Implications for efficiency and contagion. International Review of Financial Analysis 35: 140–53. [Google Scholar] [CrossRef]
- Inclan, Carla, and George C. Tiao. 1994. Use of cumulative sums of squares for retrospective detection of changes of variance. Journal of the American Statistical Association 89: 913–23. [Google Scholar]
- Jiang, Zhi-Qiang, Wen-Jie Xie, Wei-Xing Zhou, and Didier Sornette. 2019. Multifractal analysis of financial markets: A review. Reports on Progress in Physics 82: 125901. [Google Scholar] [CrossRef] [Green Version]
- Kantelhardt, Jan W., Stephan A. Zschiegner, Eva Koscielny-Bunde, Shlomo Havlin, Armin Bunde, and H. Eugene Stanley. 2002. Multifractal detrended fluctuation analysis of nonstationary time series. Physica A Statistical Mechanics and Its Applications 316: 87–114. [Google Scholar] [CrossRef] [Green Version]
- Karpoff, Jonathan M. 1986. A theory of trading volume. The Journal of Finance 41: 1069–87. [Google Scholar] [CrossRef]
- Karpoff, Jonathan M. 1987. The relation between price changes and trading volume: A survey. Journal of Financial and Quantitative Analysis 22: 109–26. [Google Scholar] [CrossRef]
- Kim, Jae H. 2009. Automatic variance ratio test under conditional heteroskedasticity. Finance Research Letters 6: 179–85. [Google Scholar] [CrossRef]
- Konak, Fatih, and Yasin Şeker. 2014. The efficiency of developed markets: Empirical evidence from ftse 100. Journal of Advanced Management Science 2: 29–32. [Google Scholar] [CrossRef]
- Kristoufek, Ladislav, and Miloslav Vosvrda. 2013. Measuring capital market efficiency: Global and local correlations structure. Physica A Statistical Mechanics and Its Applications 392: 184–93. [Google Scholar] [CrossRef] [Green Version]
- Laib, Mohamed, Luciano Telesca, and Mikhail Kanevski. 2019. MFDFA: MultiFractal Detrended Fluctuation Analysis. R Package Version 1.1. Available online: https://CRAN.R-project.org/package=MFDFA (accessed on 20 September 2020).
- Lamoureux, Christopher G., and William D Lastrapes. 1990. Heteroskedasticity in stock return data: Volume versus garch effects. The Journal of Finance 45: 221–29. [Google Scholar] [CrossRef]
- Lee, Charles, and Bhaskaran Swaminathan. 2000. Price momentum and trading volume. The Journal of Finance 55: 2017–69. [Google Scholar] [CrossRef]
- Lo, Andrew W. 1991. Long-term memory in stock market prices. Econometrica 59: 1279–313. [Google Scholar] [CrossRef]
- Lo, Andrew W. 2004. The adaptive markets hypothesis. Journal of Portfolio Management 30: 15–29+10. [Google Scholar] [CrossRef]
- Lo, Andrew W. 2012. Adaptive markets and the new world order (corrected may 2012). Financial Analysts Journal 68: 18–29. [Google Scholar] [CrossRef] [Green Version]
- Mandelbrot, Benoit B., Adlai J. Fisher, and Laurent E. Calvet. 1997. A multifractal Model of Asset Returns. Cowles Foundation Discussion Paper 1164, Sauder School of Business Working Paper. New Haven: Cowles Foundation for Research in Economics. [Google Scholar]
- Patil, Ashok Chanabasangouda, and Shailesh Rastogi. 2019. Time-varying price-volume relationship and adaptive market efficiency: A survey of the empirical literature. Journal of Risk and Financial Management 12: 105. [Google Scholar] [CrossRef] [Green Version]
- Peng, Chung-Kang, Shlomo Havlin, H. Eugene Stanley, and Ary L. Goldberger. 1995. Quantification of scaling exponents and crossover phenomena in nonstationary heartbeat time series. Chaos An Interdisciplinary Journal of Nonlinear Science 5: 82–87. [Google Scholar] [CrossRef] [PubMed]
- Perron, Pierre, and Yohei Yamamoto. 2019. Pitfalls of two-step testing for changes in the error variance and coefficients of a linear regression model. Econometrics 7: 22. [Google Scholar] [CrossRef] [Green Version]
- Podobnik, Boris, and H Eugene Stanley. 2008. Detrended cross-correlation analysis: A new method for analyzing two nonstationary time series. Physical Review Letters 100: 084102. [Google Scholar] [CrossRef] [Green Version]
- R Core Team. 2020. R: A Language and Environment for Statistical Computing. Vienna: R Foundation for Statistical Computing. [Google Scholar]
- Rak, Rafał, Stanisław Drożdż, Jarosław Kwapień, and Paweł Oświecimka. 2015. Detrended cross-correlations between returns, volatility, trading activity, and volume traded for the stock market companies. EPL (Europhysics Letters) 112: 48001. [Google Scholar] [CrossRef] [Green Version]
- Razdan, Ashok. 2002. Scaling in the bombay stock exchange index. Pramana 58: 537–44. [Google Scholar] [CrossRef] [Green Version]
- Rizvi, Syed Aun R., and Shaista Arshad. 2017. Analysis of the efficiency–integration nexus of japanese stock market. Physica A Statistical Mechanics and Its Applications 470: 296–308. [Google Scholar] [CrossRef]
- Ruan, Qingsong, Wei Jiang, and Guofeng Ma. 2016. Cross-correlations between price and volume in chinese gold markets. Physica A Statistical Mechanics and Its Applications 451: 10–22. [Google Scholar] [CrossRef]
- Shah, Ajay. 1999. Institutional change in india’s capital markets. Economic and Political Weekly XXXIV: 183–94. [Google Scholar]
- Stošić, Dusan, Darko Stošić, Tatijana Stošić, and H. Eugene Stanley. 2015. Multifractal properties of price change and volume change of stock market indices. Physica A Statistical Mechanics and Its Applications 428: 46–51. [Google Scholar] [CrossRef]
- Sukpitak, Jessada, and Varagorn Hengpunya. 2016. The influence of trading volume on market efficiency: The dcca approach. Physica A Statistical Mechanics and its Applications 458: 259–65. [Google Scholar] [CrossRef]
- Suominen, Matti. 2001. Trading volume and information revelation in stock market. Journal of Financial and Quantitative Analysis 36: 545–65. [Google Scholar] [CrossRef]
- Tiwari, Aviral Kumar, Goodness C Aye, and Rangan Gupta. 2019. Stock market efficiency analysis using long spans of data: A multifractal detrended fluctuation approach. Finance Research Letters 28: 398–411. [Google Scholar] [CrossRef] [Green Version]
- Wied, Dominik, Matthias Arnold, Nicolai Bissantz, and Daniel Ziggel. 2012. A new fluctuation test for constant variances with applications to finance. Metrika 75: 1111–27. [Google Scholar] [CrossRef]
- Zeileis, Achim, Christian Kleiber, Walter Krämer, and Kurt Hornik. 2003. Testing and dating of structural changes in practice. Computational Statistics Data Analysis 44: 109–23. [Google Scholar] [CrossRef] [Green Version]
- Zeileis, Achim, Friedrich Leisch, Kurt Hornik, and Christian Kleiber. 2002. Strucchange: An r package for testing for structural change in linear regression models. Journal of Statistical Software 7: 1–38. [Google Scholar] [CrossRef] [Green Version]
- Zhang, Xike, Gui Zhang, Luo Qiu, Bo Zhang, Yurong Sun, Zifan Gui, and Qiuwen Zhang. 2019. A modified multifractal detrended fluctuation analysis (mfdfa) approach for multifractal analysis of precipitation in dongting lake basin, china. Water 11: 891. [Google Scholar] [CrossRef] [Green Version]
- Zhou, Wei-Xing. 2008. Multifractal detrended cross-correlation analysis for two nonstationary signals. Physical Review E 77: 066211. [Google Scholar] [CrossRef] [PubMed] [Green Version]
- Zunino, Luciano, Benjamin Miranda, Tabak A. Figliola, Darío G. Pérez, M. Garavaglia, and Osvaldo A. Rosso. 2008. A multifractal approach for stock market inefficiency. Physica A Statistical Mechanics and Its Applications 387: 6558–66. [Google Scholar] [CrossRef]
- Zunino, Luciano, Massimiliano Zanin, Benjamin M. Tabak, Darío G Pérez, and Osvaldo A Rosso. 2009. Forbidden patterns, permutation entropy and stock market inefficiency. Physica A Statistical Mechanics and Its Applications 388: 2854–64. [Google Scholar] [CrossRef]
Figure 1.
Visualization of the data.
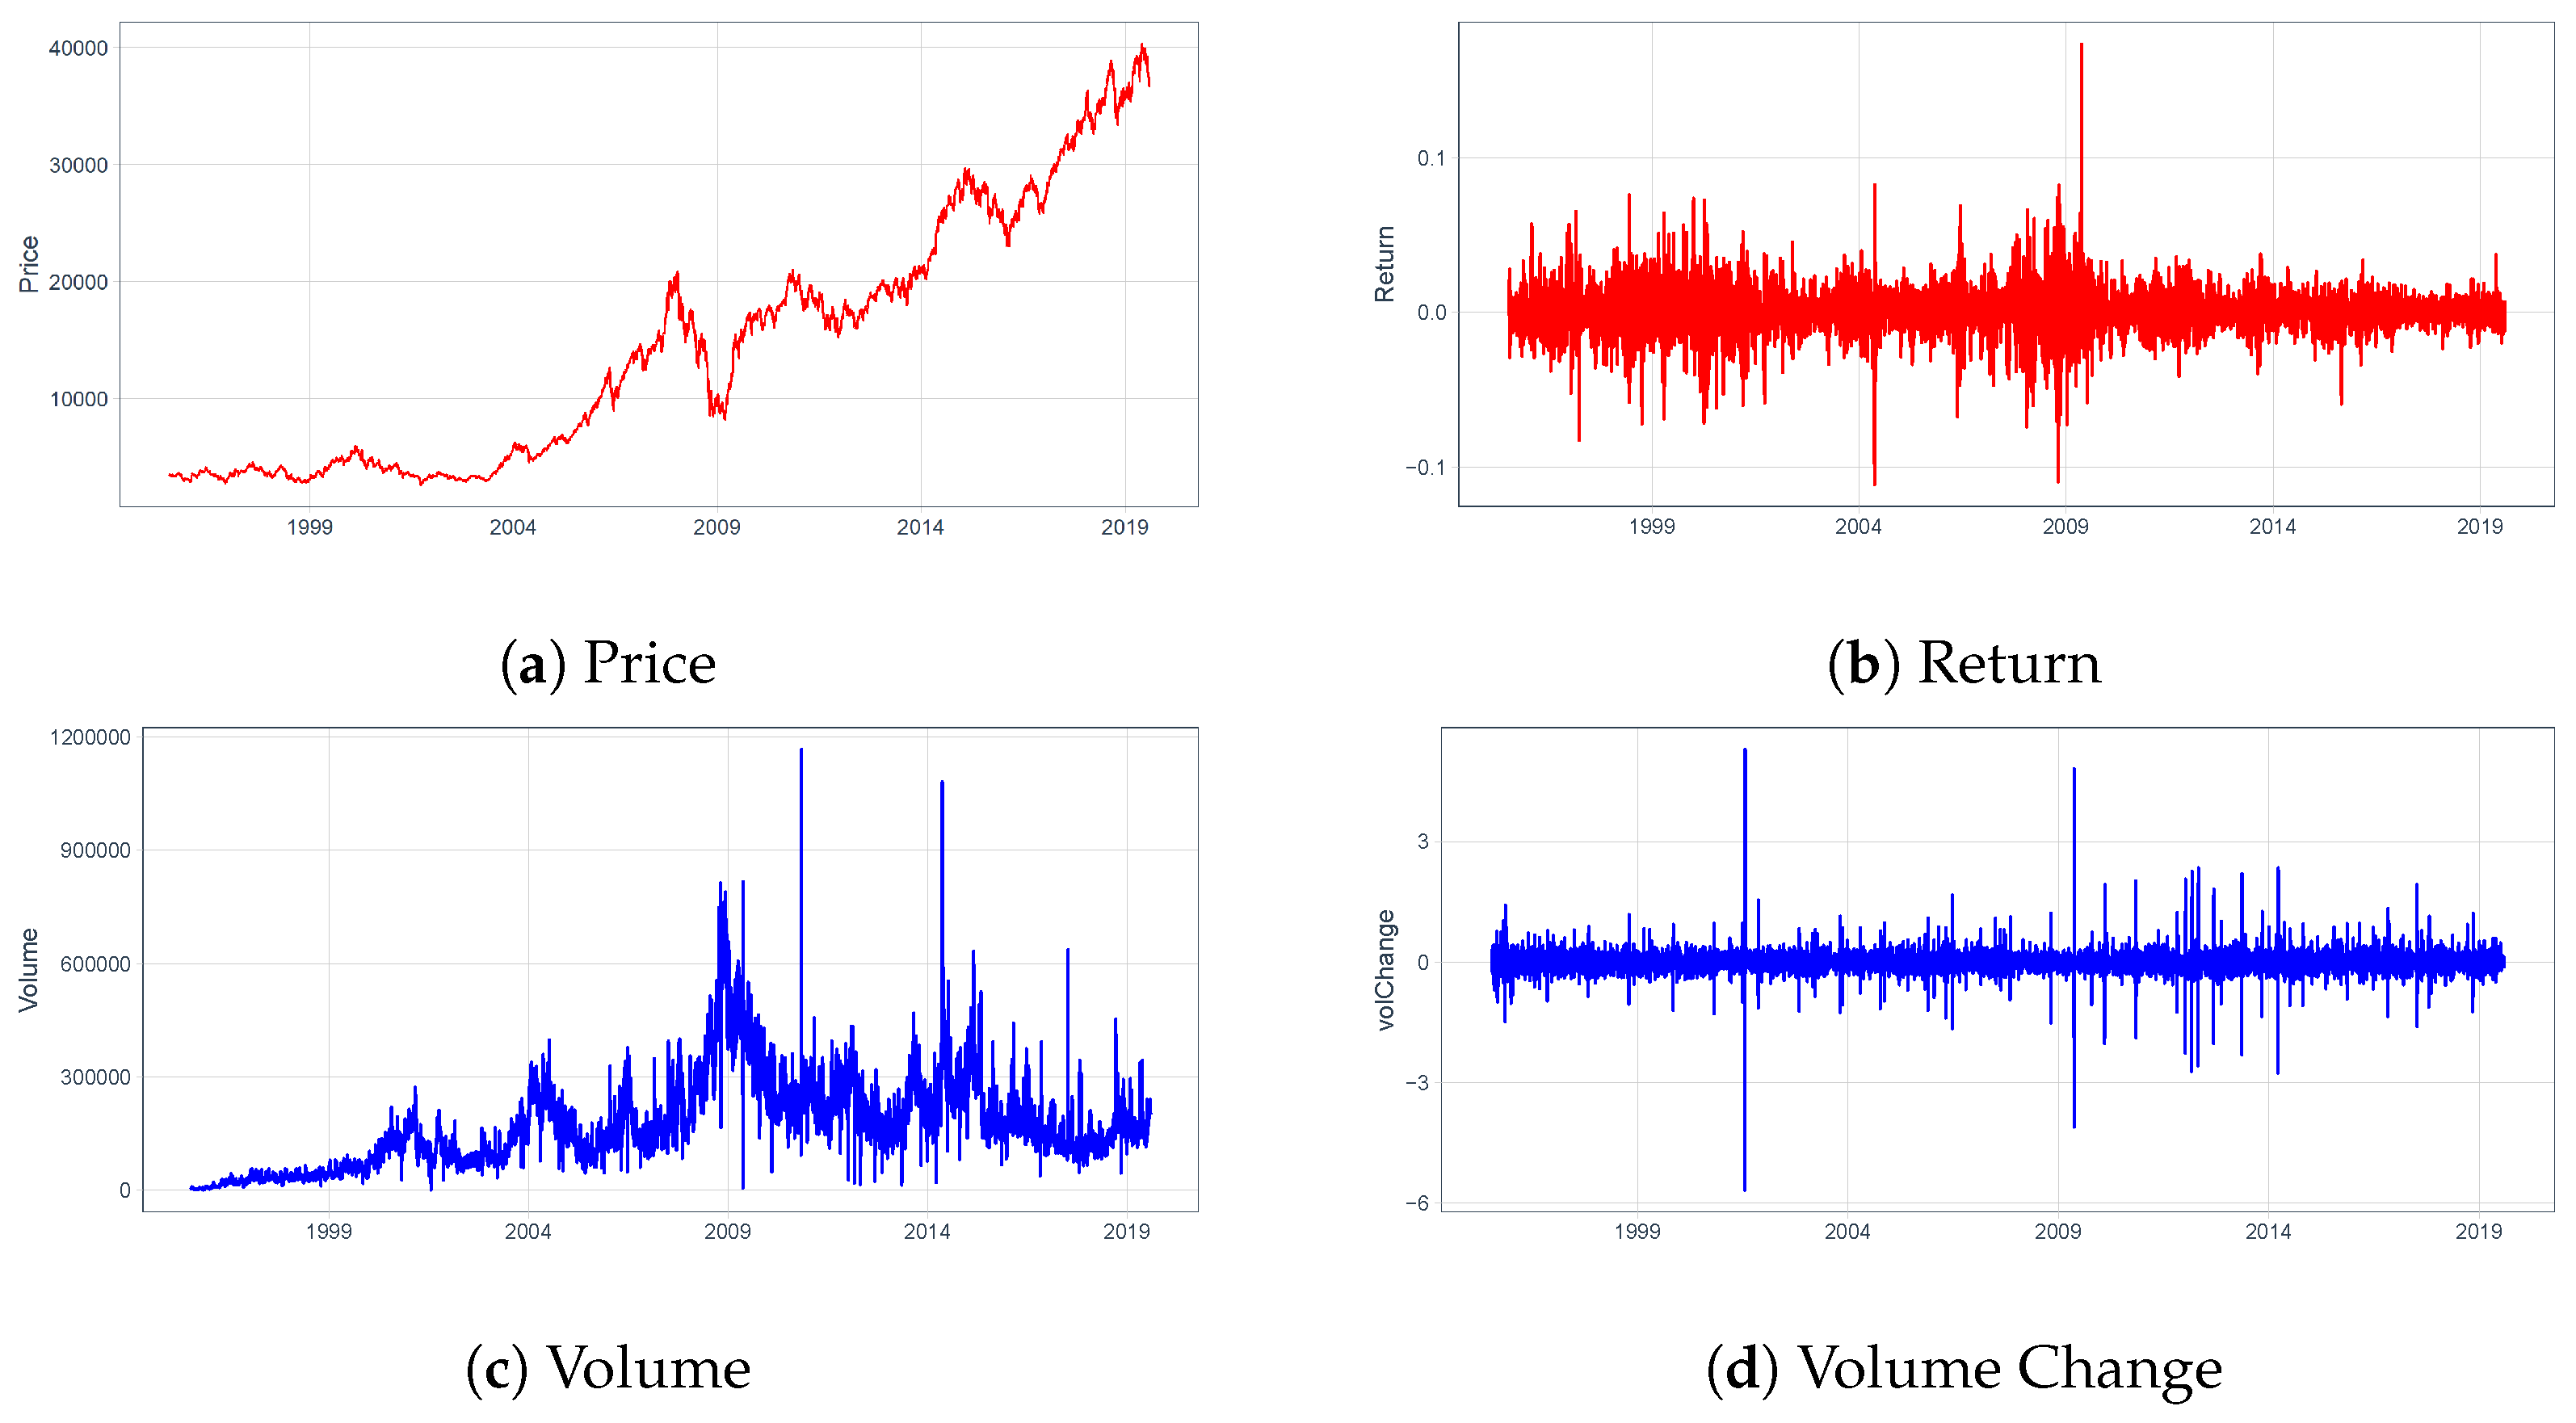
Figure 2.
BIC and residual sum of squares.
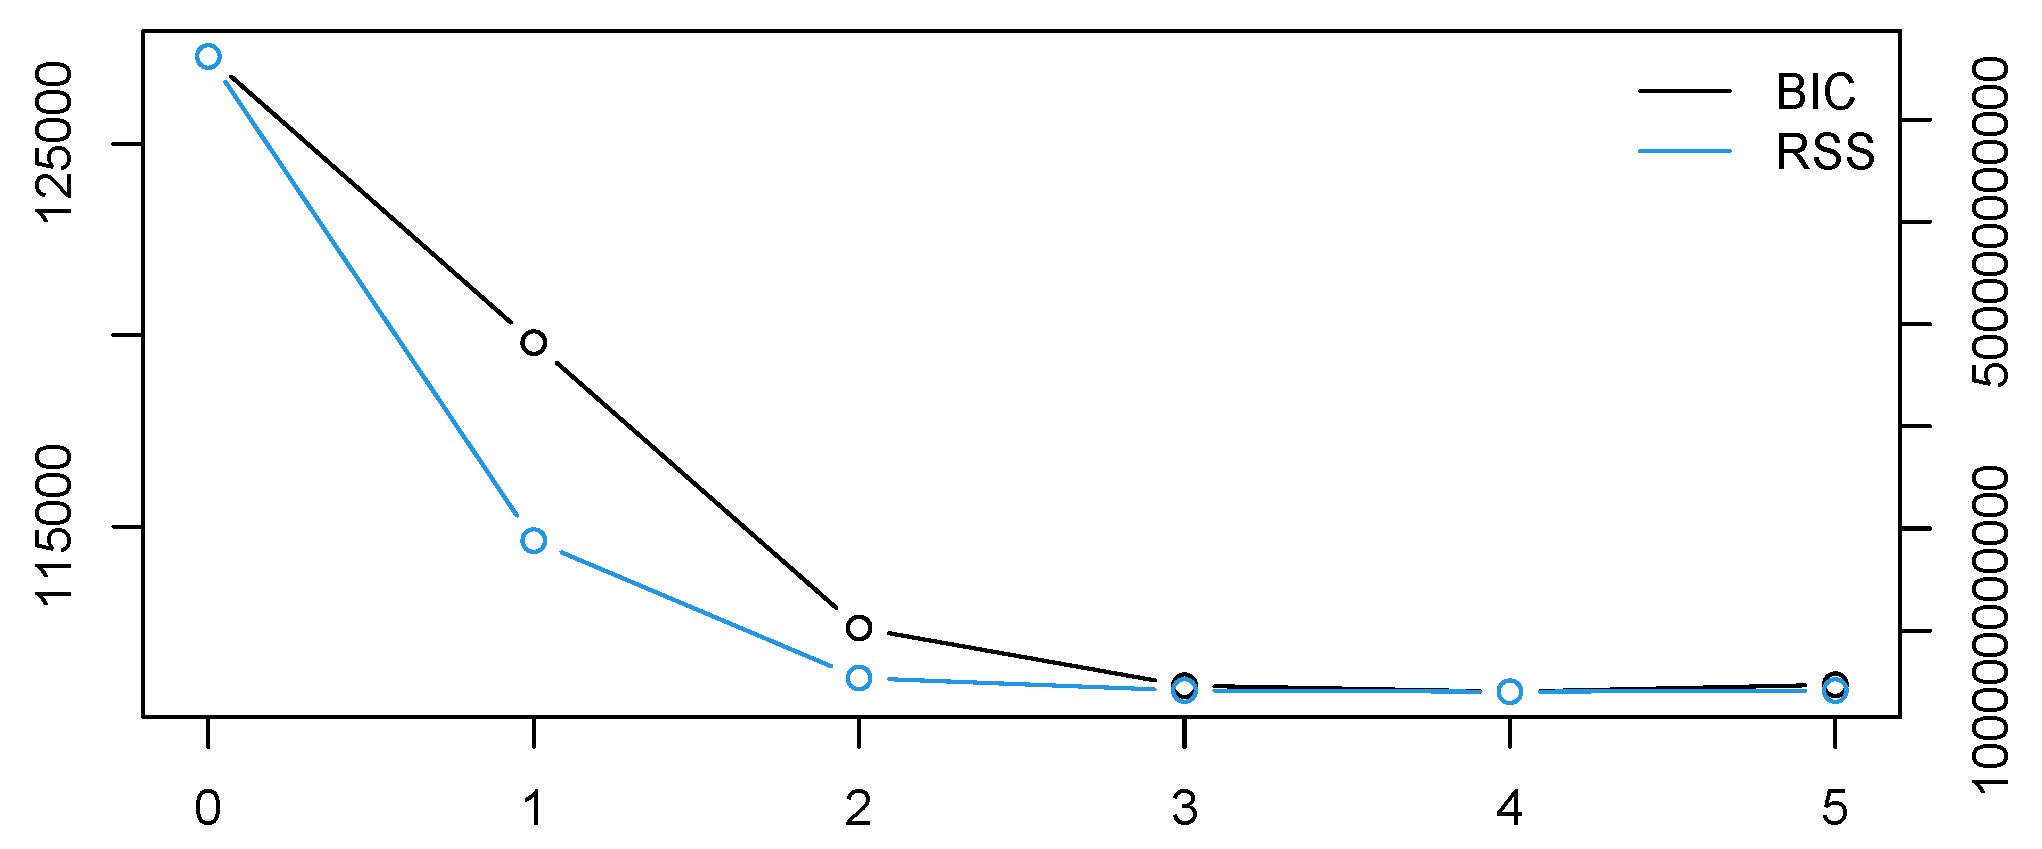
Figure 3.
Visualization of segment-wise structural breaks.
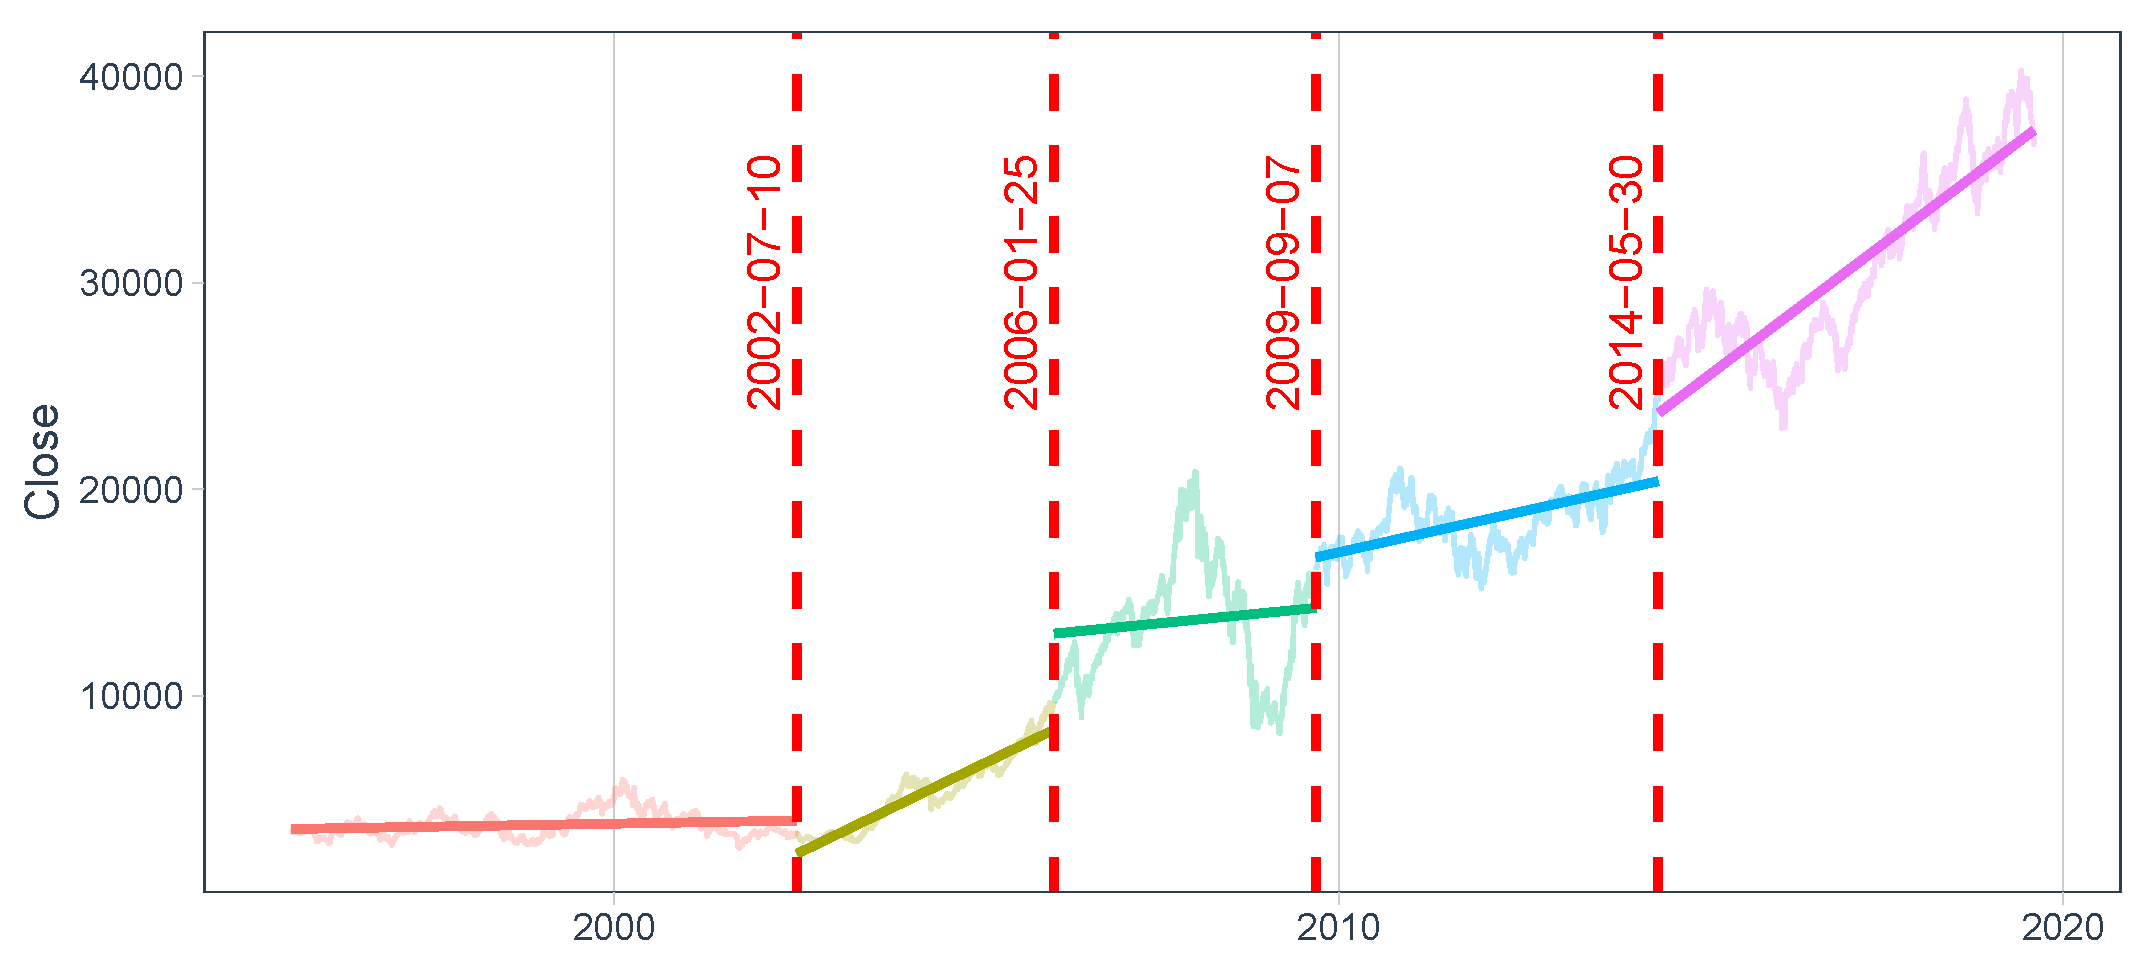
Figure 4.
Whole data price, volume, and price-volume cross-correlation spectrum.
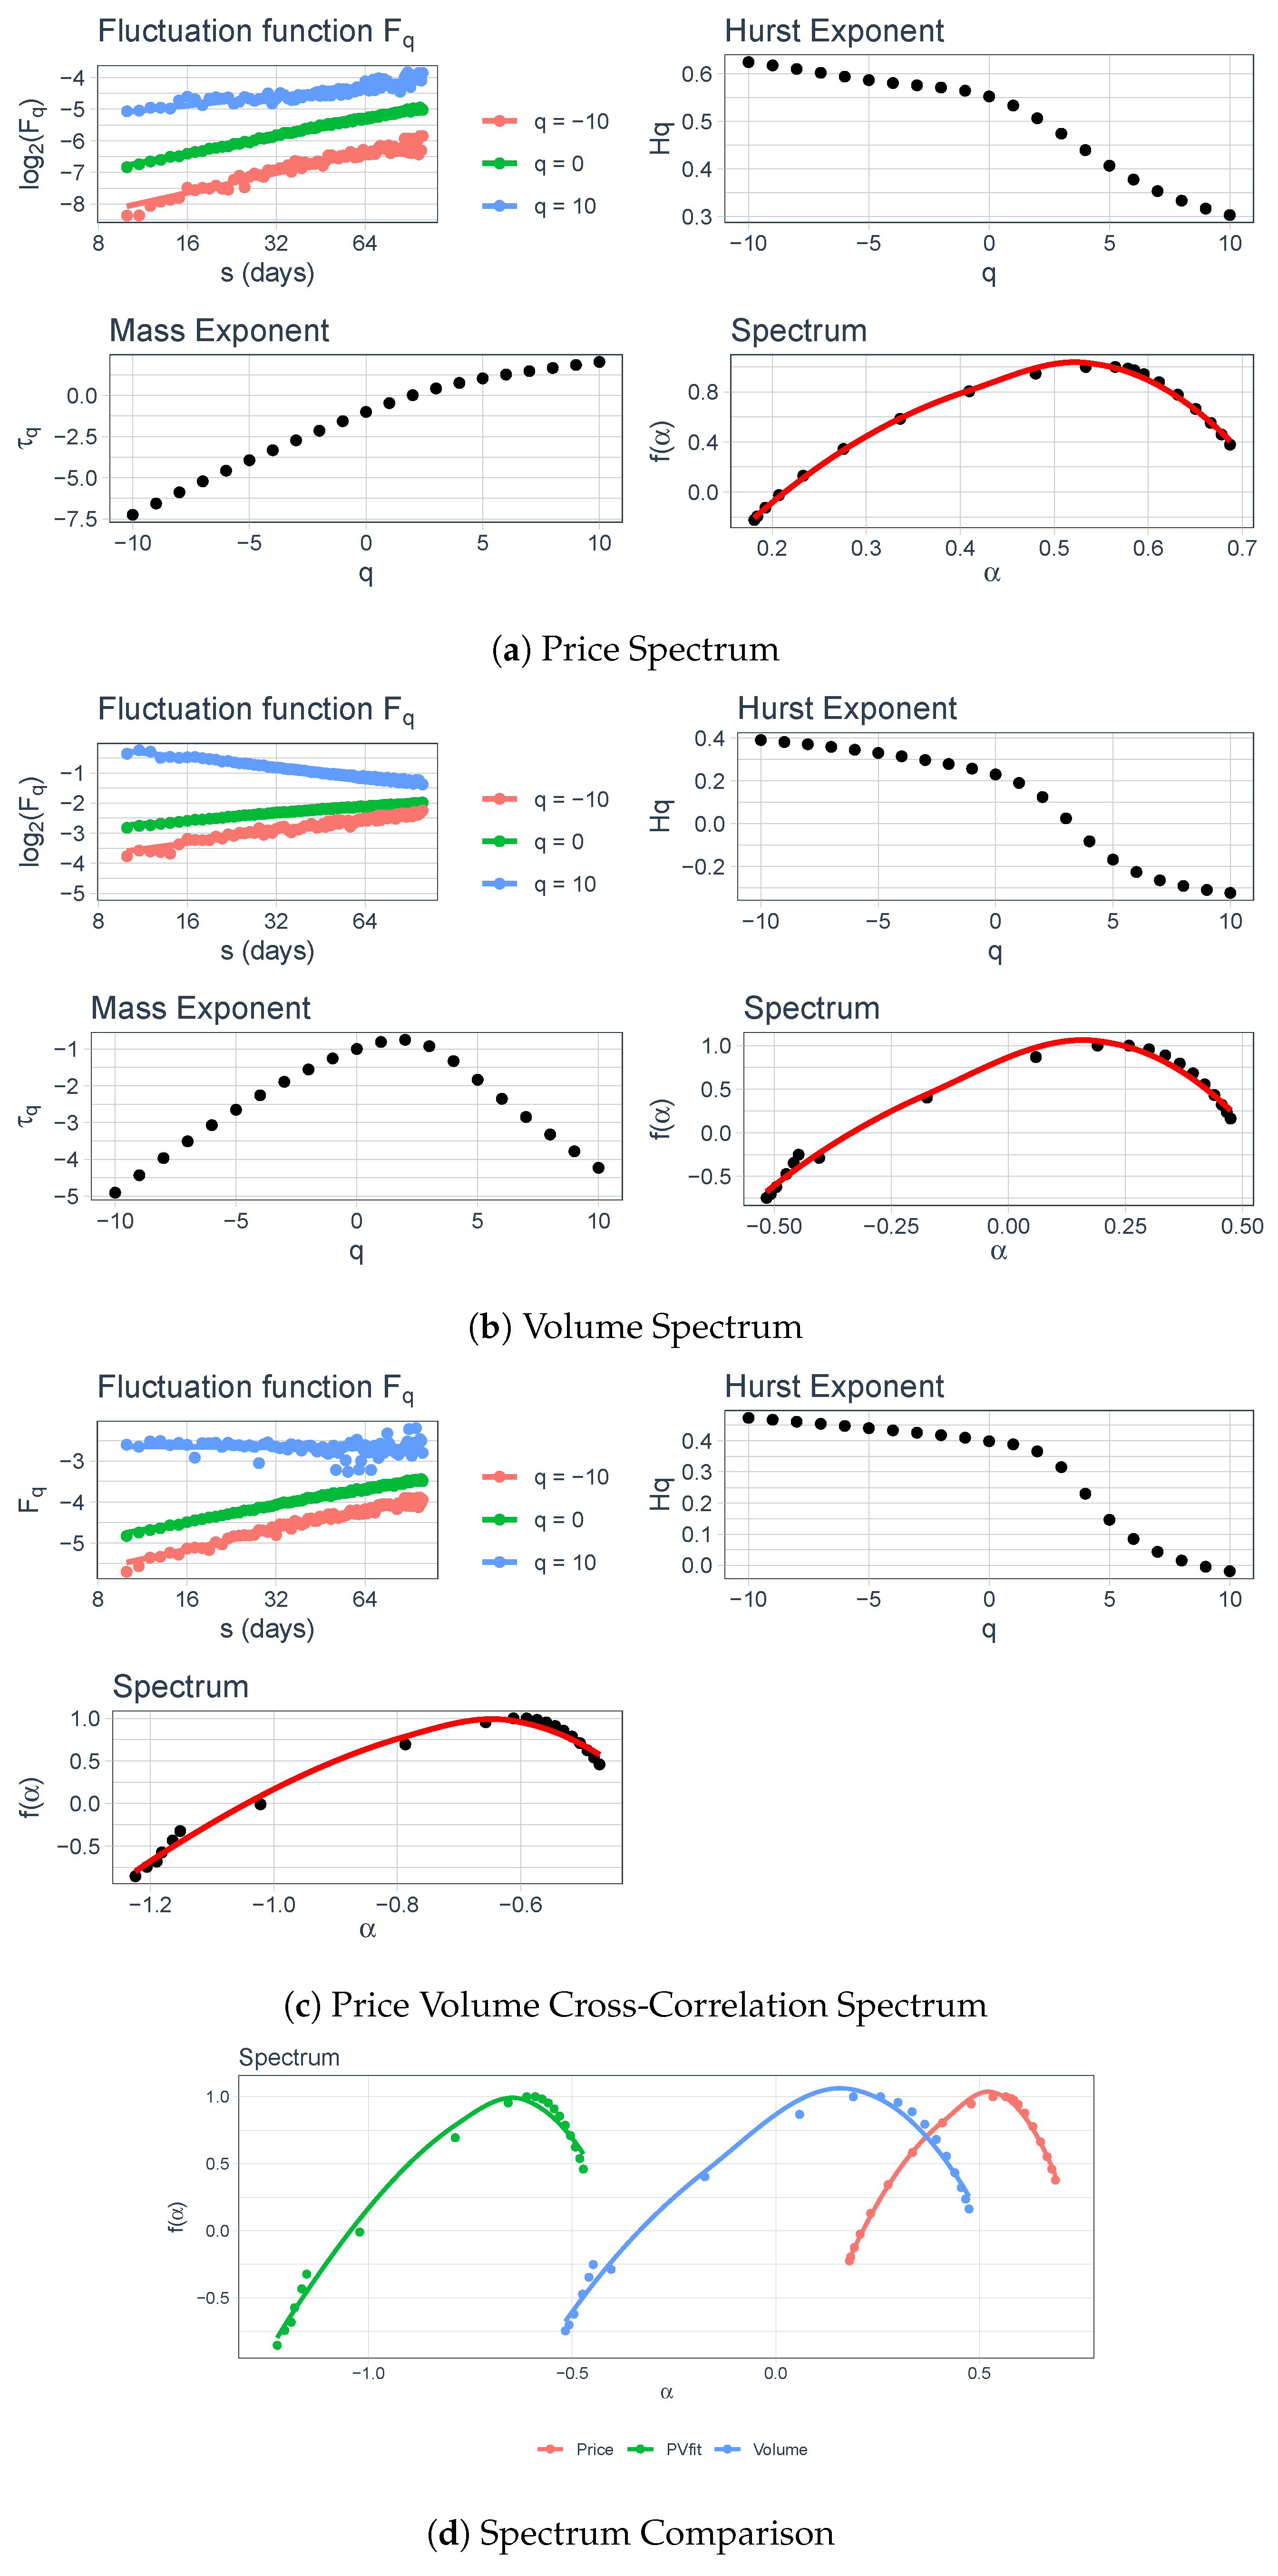
Figure 5.
Segment 1 price, volume, and price-volume cross-correlation spectrum.
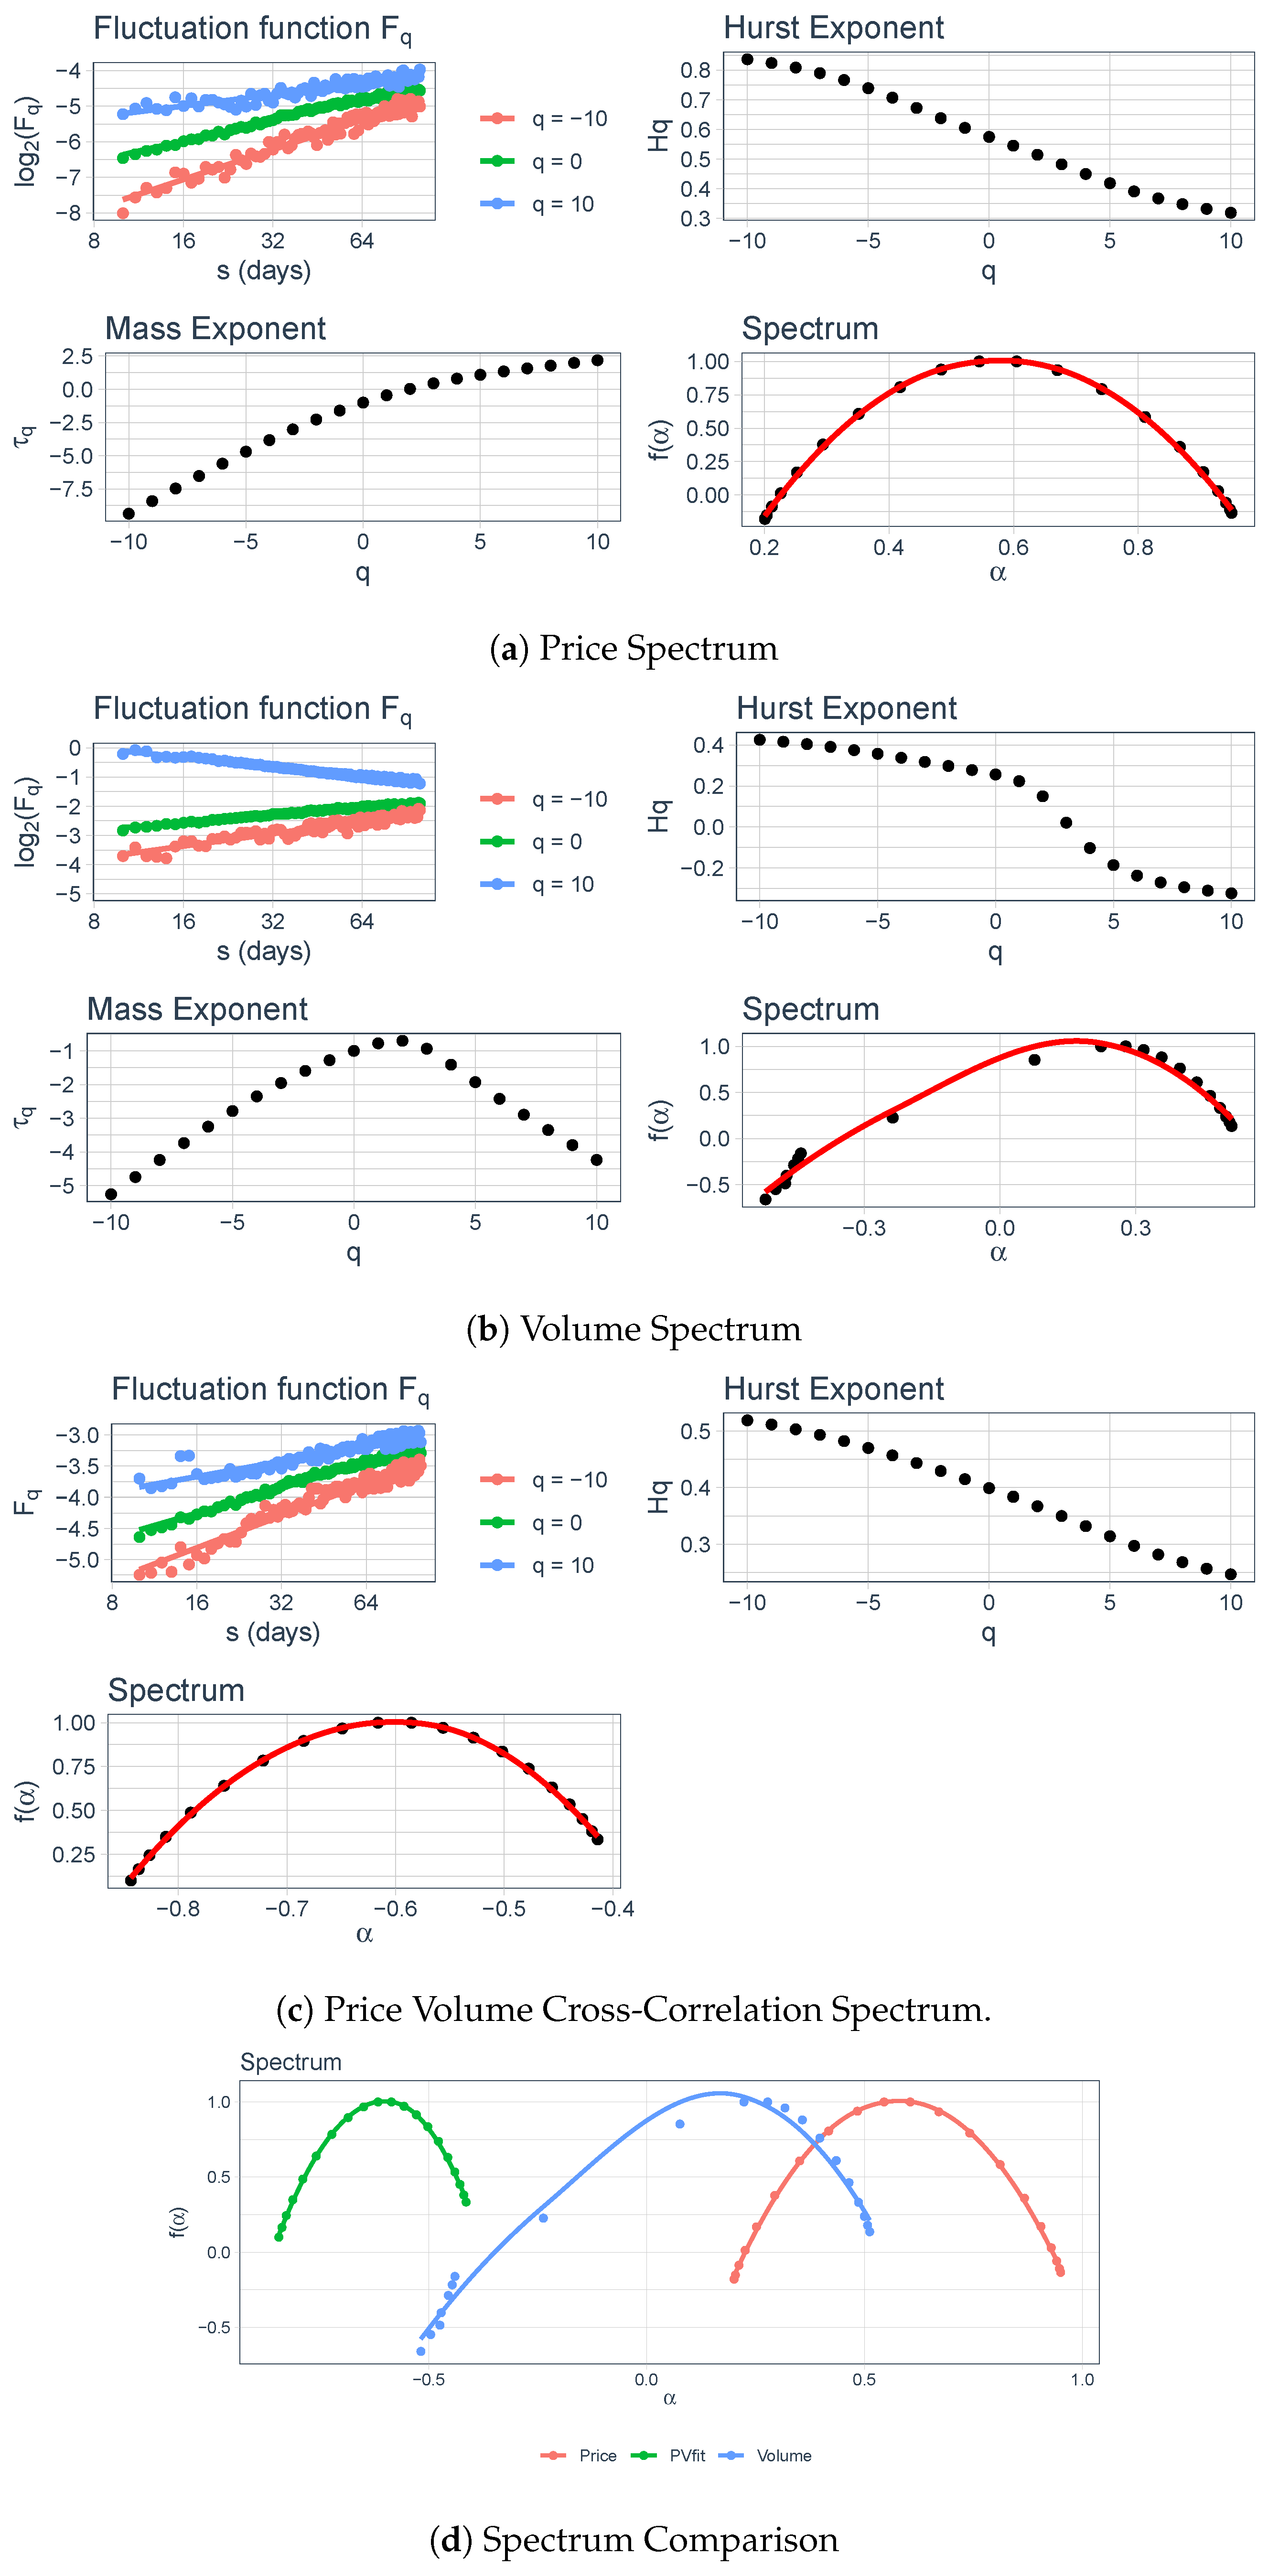
Figure 6.
Segment 2 price, volume, and price-volume cross-correlation spectrum.
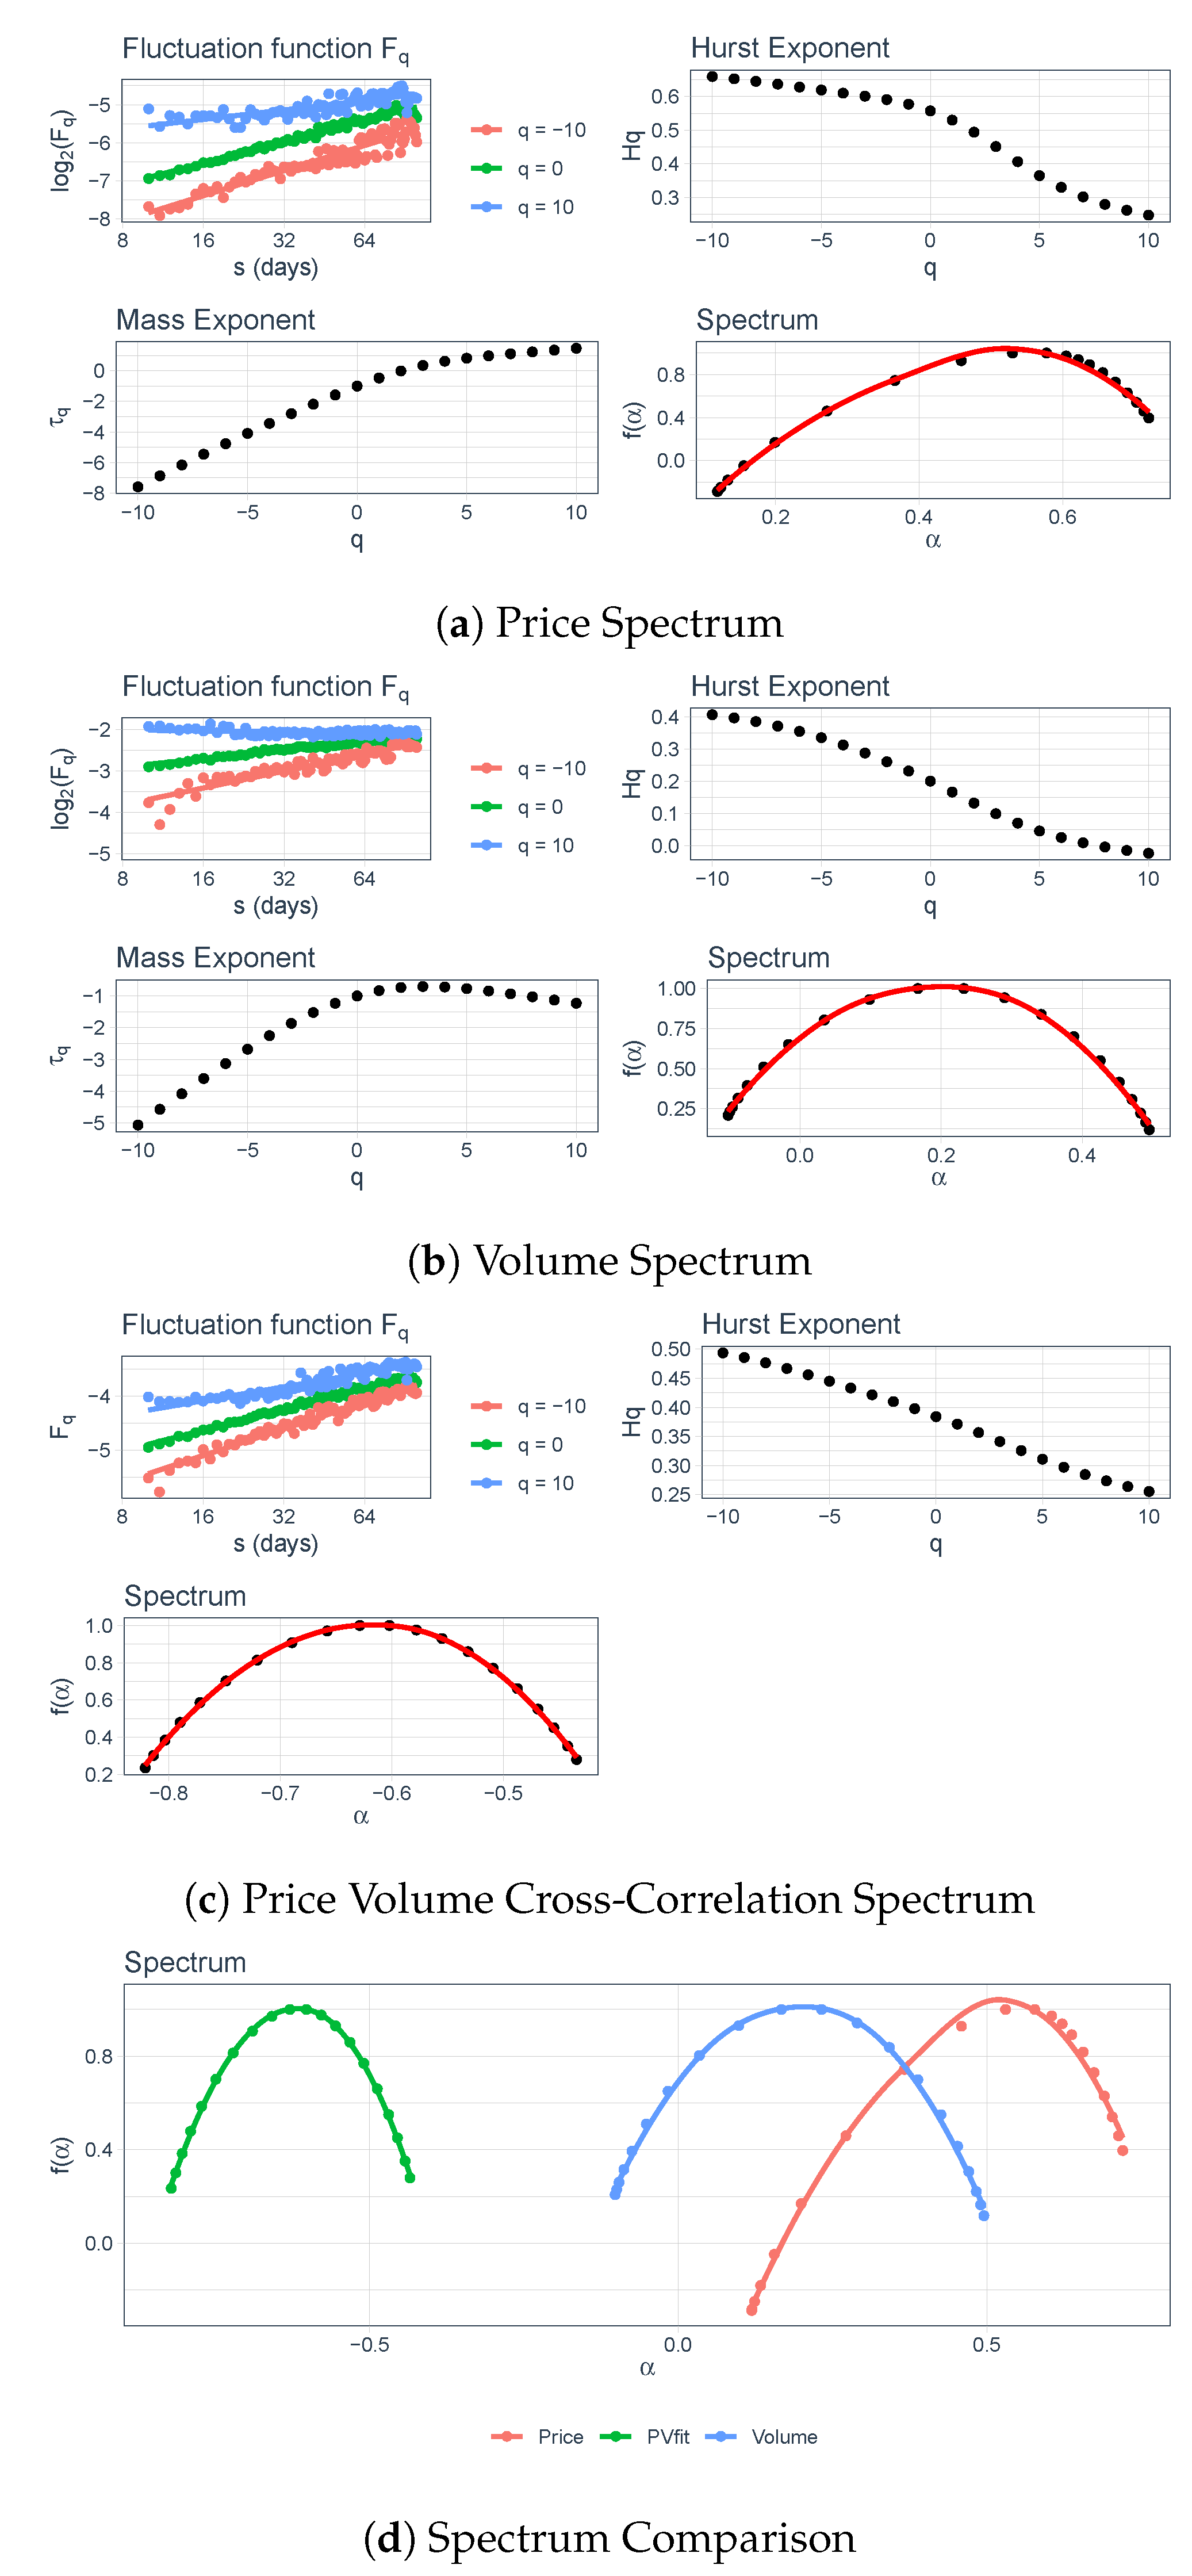
Figure 7.
Segment 3 price, volume, and price-volume cross-correlation spectrum.
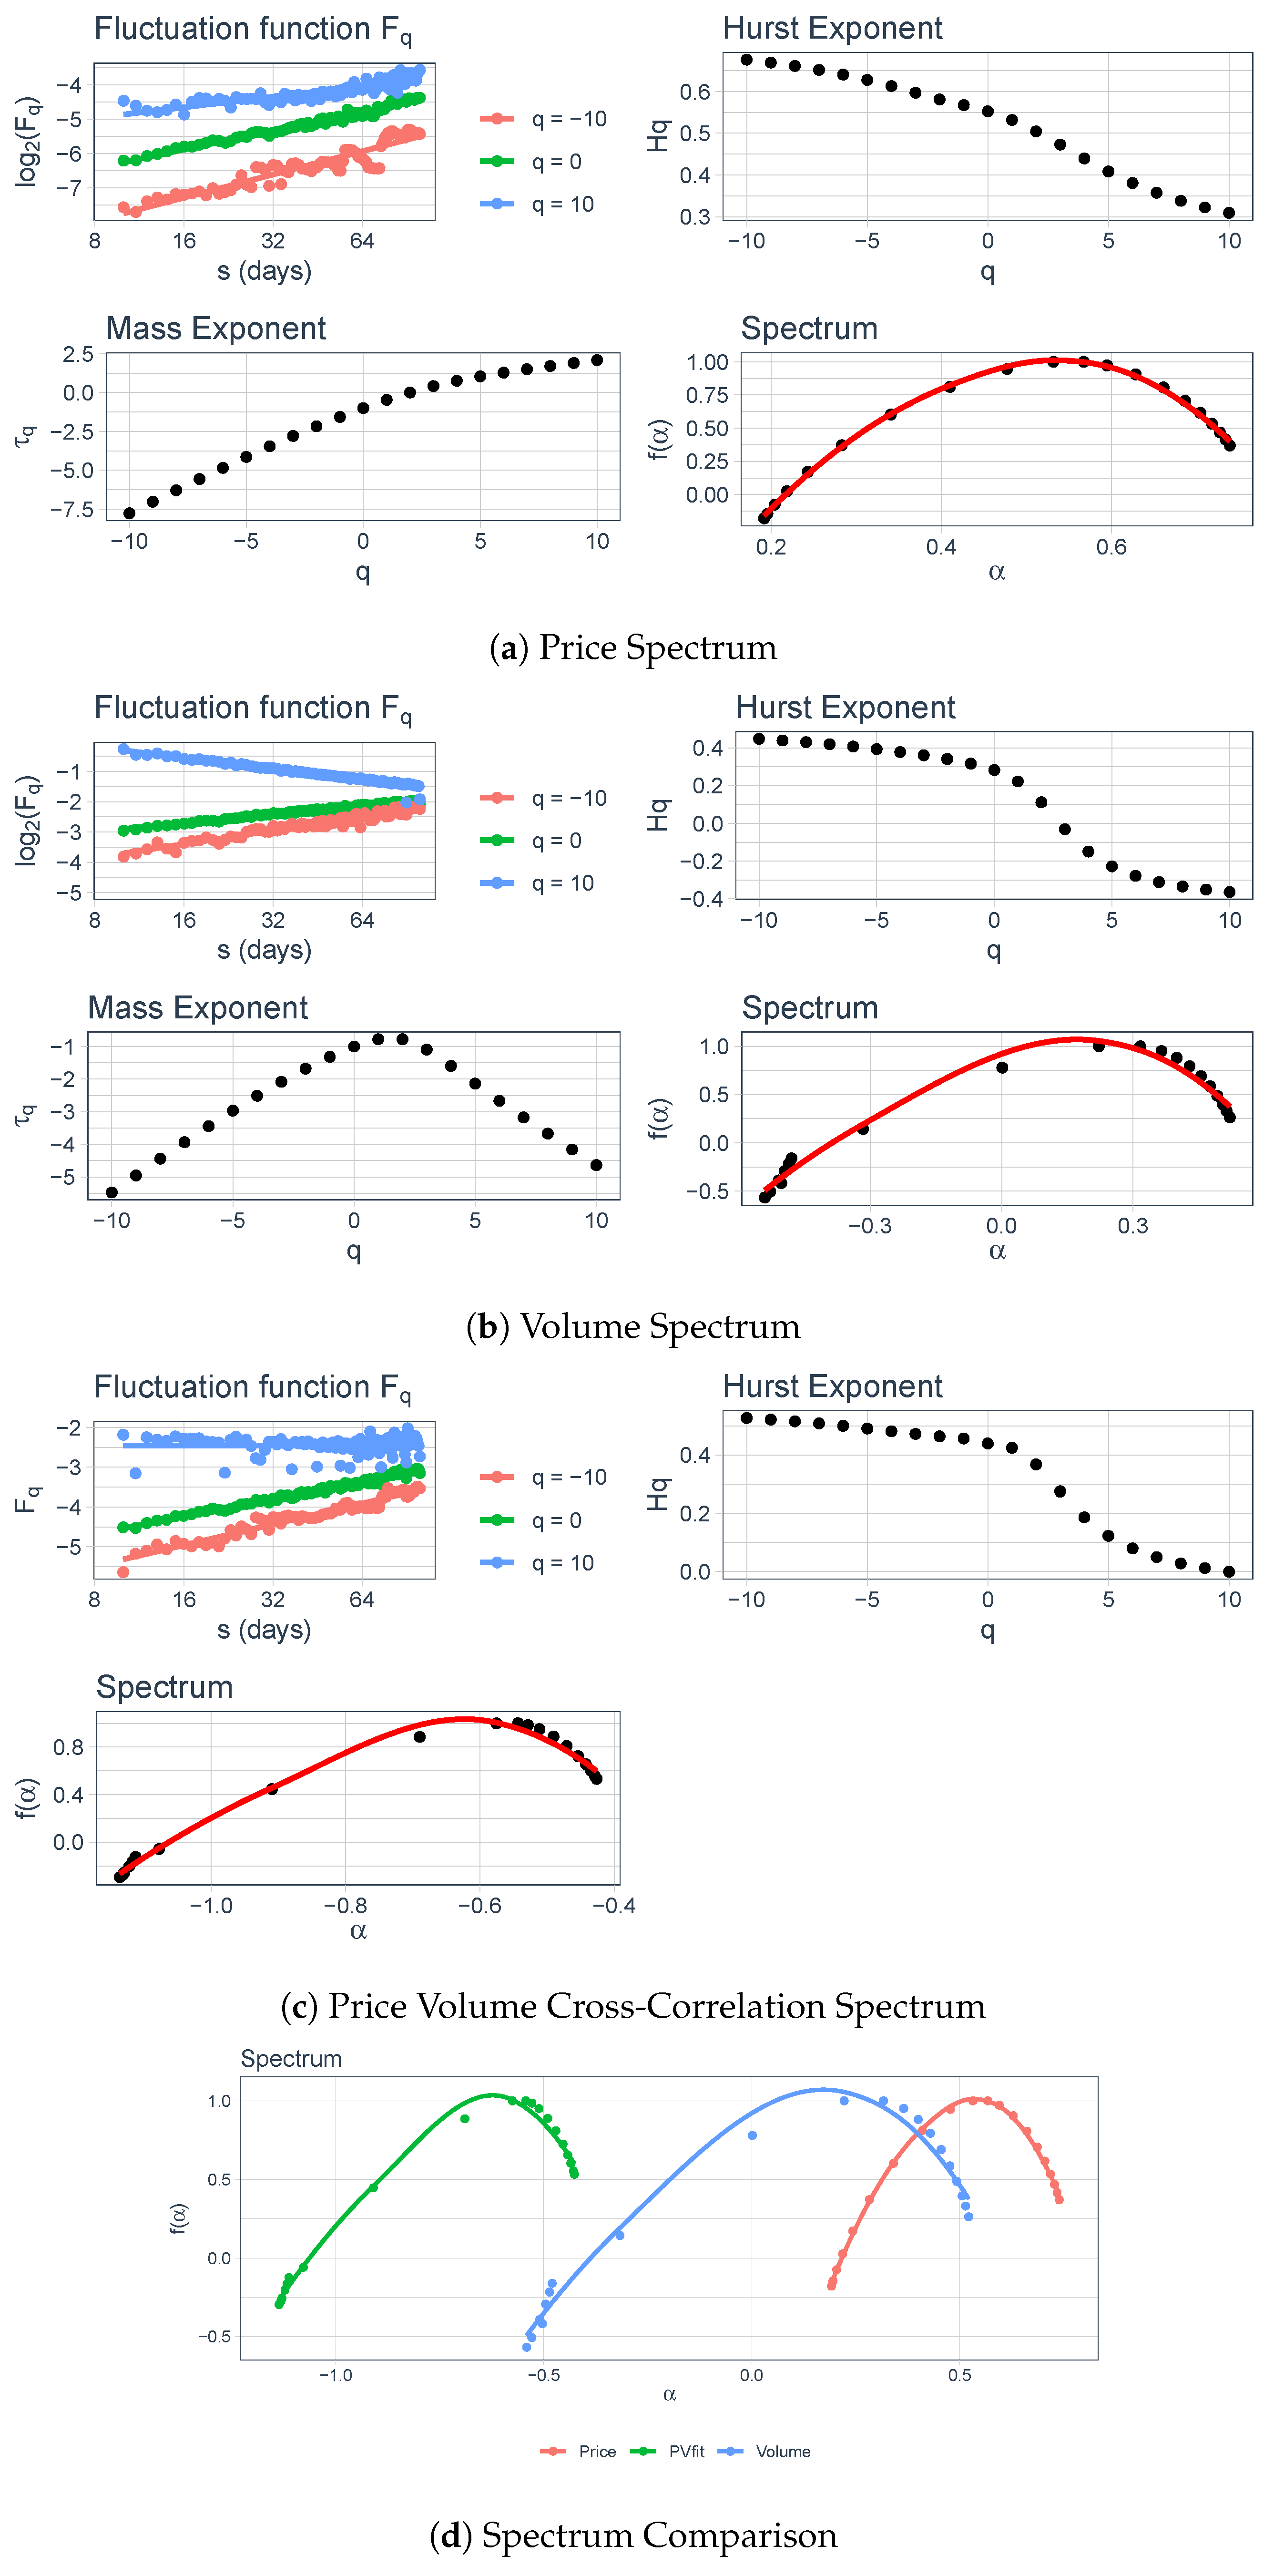
Figure 8.
Segment 4 price, volume, and price-volume cross-correlation spectrum.
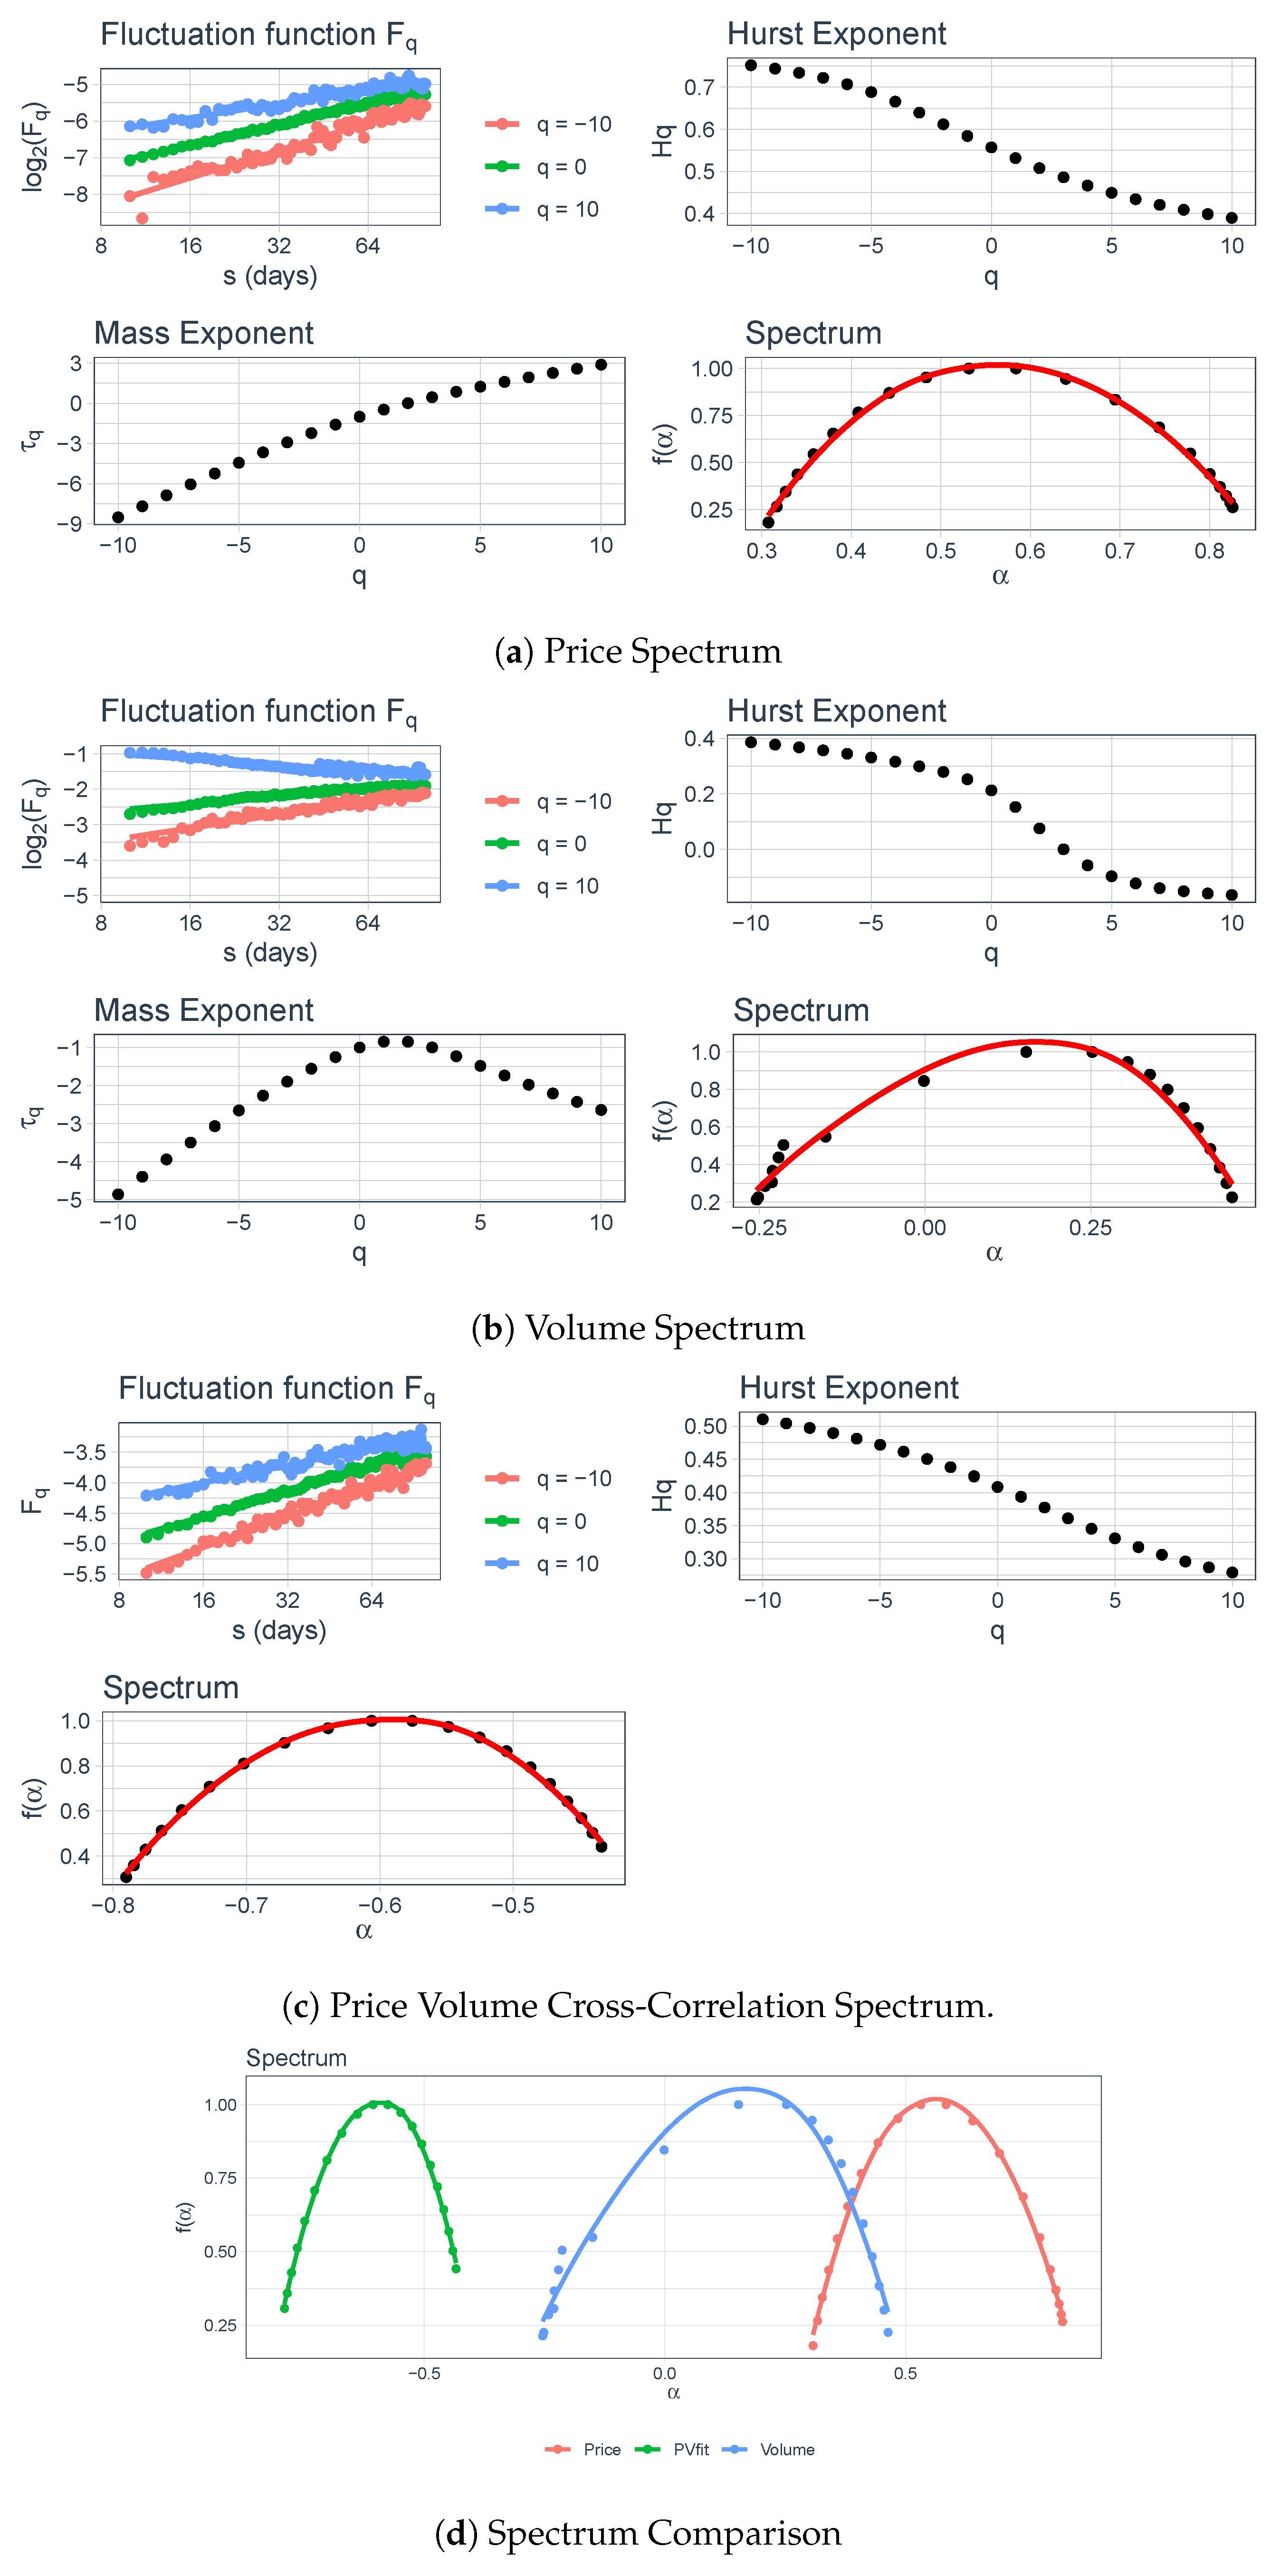
Figure 9.
Segment 5 price, volume, and price-volume cross-correlation spectrum.

Table 1.
Summary statistics of the data.
| Price | Volume | Return | volChange | |
|---|---|---|---|---|
| Number of observations | 5957 | 5957 | 5957 | 5957 |
| Minimum | 2600.12 | 423 | −0.11 | −5.68 |
| Maximum | 40,267.6 | 1,166,709 | 0.17 | 5.29 |
| Median | 13,156.7 | 148,410 | 0 | 0 |
| Mean | 14,153.1 | 167,683 | 0 | 0 |
| SE of mean | 136.58 | 1513.21 | 0 | 0 |
| CI of mean 0.95 | 267.74 | 2966.44 | 0 | 0.01 |
| Standard deviation | 10,541.3 | 116,792 | 0.01 | 0.29 |
Note: SE and CI stand for the Standard Error and Confidence Interval of the mean.
Table 2.
Break-wise summary statistics of the data.
| Price Segments | [1995-07-17, 2002-07-10] | [2002-07-10, 2006-01-25] | [2006-01-25, 2009-09-07] | [2009-09-07, 2014-05-30] | [2014-05-30, 2019-08-06] |
|---|---|---|---|---|---|
| Number of observations | 1710 | 893 | 895 | 1178 | 1280 |
| Minimum | 2600.12 | 2834.41 | 8160.4 | 15,175.1 | 22,951.83 |
| Maximum | 5933.56 | 9648.08 | 20,873.3 | 24,716.9 | 40,267.62 |
| Median | 3575.04 | 5358.35 | 13,799.5 | 18,342 | 28,798.47 |
| Mean | 3742.69 | 5341.6 | 13,614.1 | 18,536.4 | 30,533.3 |
| SE of mean | 15.11 | 60.62 | 98.07 | 49.89 | 124.99 |
| CI of mean 0.95 | 29.64 | 118.97 | 192.47 | 97.89 | 245.22 |
| Standard deviation | 624.87 | 1811.44 | 2933.86 | 1712.46 | 4471.93 |
Note: SE and CI stand for the Standard Error and Confidence Interval of the mean, respectively. The confidence interval is at the 95 percent probability level.
Table 3.
Segment-wise comparison of results.
| Segment | Fluctuation Type | Price Is Persistent | Volume Is Persistent | Price-Volume |
|---|---|---|---|---|
| Cross-Correlation | ||||
| Is Persistent | ||||
| Entire Data | Large fluctuations | No | No | No |
| Small fluctuations | Yes | No | No | |
| 1 | Large fluctuations | No | No | No |
| Small fluctuations | Yes | No | No | |
| 2 | Large fluctuations | No | No | No |
| Small fluctuations | Yes | No | No | |
| 3 | Large fluctuations | No | No | No |
| Small fluctuations | Yes | No | No | |
| 4 | Large fluctuations | No | No | No |
| Small fluctuations | Yes | No | No | |
| 5 | Large fluctuations | No | No | No |
| Small fluctuations | Yes | No | No |
Table 4.
Strength and complexity across structural breaks.
| Segment | Multifractal Strength | Intensity and Complexity | ||||
|---|---|---|---|---|---|---|
| Price | Volume | Price-Volume Correlation | Price | Volume | Price-Volume Correlation | |
| All Data | 0.322 | 0.714 | 0.493 | 0.506 | 0.991 | 0.752 |
| 1 | 0.518 | 0.749 | 0.273 | 0.749 | 1.030 | 0.430 |
| 2 | 0.412 | 0.430 | 0.238 | 0.601 | 0.597 | 0.387 |
| 3 | 0.367 | 0.811 | 0.527 | 0.548 | 1.063 | 0.710 |
| 4 | 0.363 | 0.550 | 0.231 | 0.518 | 0.717 | 0.356 |
| 5 | 0.212 | 0.426 | 0.251 | 0.354 | 0.617 | 0.416 |
Note: multifractal strength = range of h(q), intensity and complexity = range of alpha.
Publisher’s Note: MDPI stays neutral with regard to jurisdictional claims in published maps and institutional affiliations. |
© 2020 by the authors. Licensee MDPI, Basel, Switzerland. This article is an open access article distributed under the terms and conditions of the Creative Commons Attribution (CC BY) license (http://creativecommons.org/licenses/by/4.0/).
Share and Cite
MDPI and ACS Style
Patil, A.C.; Rastogi, S. Multifractal Analysis of Market Efficiency across Structural Breaks: Implications for the Adaptive Market Hypothesis. J. Risk Financial Manag. 2020, 13, 248. https://doi.org/10.3390/jrfm13100248
AMA Style
Patil AC, Rastogi S. Multifractal Analysis of Market Efficiency across Structural Breaks: Implications for the Adaptive Market Hypothesis. Journal of Risk and Financial Management. 2020; 13(10):248. https://doi.org/10.3390/jrfm13100248
Chicago/Turabian StylePatil, Ashok Chanabasangouda, and Shailesh Rastogi. 2020. "Multifractal Analysis of Market Efficiency across Structural Breaks: Implications for the Adaptive Market Hypothesis" Journal of Risk and Financial Management 13, no. 10: 248. https://doi.org/10.3390/jrfm13100248