Default Risk and Cross Section of Returns


Gabelli School of Business, Fordham University, New York, NY 10023, USA
*
Author to whom correspondence should be addressed.
J. Risk Financial Manag. 2019, 12(2), 95; https://doi.org/10.3390/jrfm12020095
Submission received: 7 May 2019
/
Revised: 24 May 2019
/
Accepted: 4 June 2019
/
Published: 6 June 2019
(This article belongs to the Special Issue Quantitative Risk)
Abstract
:Prior research uses the basic one-period European call-option pricing model to compute default measures for individual firms and concludes that both the size and book-to-market effects are related to default risk. For example, small firms earn higher return than big firms only if they have higher default risk and value stocks earn higher returns than growth stocks if their default risk is high. In this paper we use a more advanced compound option pricing model for the computation of default risk and provide a more exhaustive test of stock returns using univariate and double-sorted portfolios. The results show that long/short hedge portfolios based on Geske measures of default risk produce significantly larger return differentials than Merton’s measure of default risk. The paper provides new evidence that mediates between the rational and behavioral explanations of value premium.
1. Introduction
There is widespread evidence that stocks with a high book-to-market ratio (so-called value stocks) have higher expected returns compared to stocks with a low book-to-market ratio (so-called growth stocks)1. However, there is disagreement regarding the economic reason behind this difference in returns. The out-performance of value stocks has been attributed to compensation for higher risk by Fama and French (1992), an interpretation that is supported by the consistently low return on high B/M stocks (Fama and French 1995 and Penman 1991), as well as the high correlation between B/M, leverage, and other measures of financial risk (Fama and French 1992; Chen and Zhang 1998 and Vassalou and Xing 2004). However, Santos and Veronesi (2010) show that stocks with a high book-to-market ratio have similar betas compared to stocks with a low book-to-market ratio and the difference in expected returns cannot be explained by a difference in beta. In contrast to the “efficient market” interpretation, the “mispricing” hypothesis holds that high B/M stocks represent neglected stocks, leading to “pessimistic” expectations about future performance (Lakonishok et al. 1994), as evidenced by positive earnings surprises at subsequent quarterly earnings announcements (LaPorta et al. 1997). This explanation is in line with the investment advice of Graham and Dodd (1934).
The risk-based explanation of the value premium has been questioned by some authors. Novy-Marx (2013) shows that gross profitability has roughly the same power as the book-to-market ratio in predicting the cross section of average returns, and that controlling for profitability dramatically increases the performance of value strategies, especially among the largest and most liquid stocks. This result is hard to reconcile with the risk-based explanation of value premium because profitable firms are less likely to be in financial distress. In another important paper, Piotroski and So (2012) show that the returns to traditional value strategies are concentrated among those firms where expectations implied by their current value classification are ex ante incongruent with the strength of their fundamentals. Value stocks with strong fundamentals produce higher returns. These results cast considerable doubt on the risk-based explanation favored by proponents of efficient rational markets, and indicate a need to re-examine the link between value stock returns and financial risk.
Vassalou and Xing (2004) provide a direct test of the impact of default risk on equity returns and their paper motivates our research proposal. Vassalou and Xing (2004) uses Merton’s (1974) option pricing model to compute default measures for individual firms and conclude that both the size and book-to-market effects are related to default risk. Small firms earn a higher return than big firms only if they have higher default risk and value stocks earn higher returns than growth stocks if their default risk is high. These results contradict the intuition of Novy-Marx (2013) and Piotroski and So (2012).
The goal of this paper is to extend the results of Vassalou and Xing (2004) by using Geske (1979) instead of Merton (1974) in computing the likelihood of default. This is the first paper that uses Geske’s compound option pricing model to compute default probabilities for individual companies and examines the relationship between cross-sectional returns and default probabilities calculated from Geske’s model. The advantage of using Geske’s two-period compound option model is that we can compute three default probabilities: a short-term default probability (which is the probability that the firm will default at the end of the first period), a forward default probability (which is the probability that the firm will default in the second period after no default in the first period), and a total default probability (which is the probability today that the firm will default either in the first or second period). In contrast to Geske’s model, the Merton model gives a single default probability because it is a one-period model.
We thoroughly re-examine the link between default risk, size premium, and value premium by using a more advanced option pricing model for the computation of default risk and a more exhaustive test of stock returns based on univariate sorts and independent double sorts. Our sample includes all stocks from July 1963 to December 2013. Our results can be summarized as follows: The results based on Merton’s default probability are very similar to the results based on Geske’s short-term default probability and total default probability. A new default measure (short-term minus forward default probability provides a much stronger results based on univariate as well as independent double-sorts. The average return differential between high and low default probability portfolios is 0.81% (the t-statistic is 2.34) for Merton’s model. Whereas the average return differential for total default probability is 0.63% (t-statistic is 1.90). The average return differential for short-term default probability is 0.77% per month (t-statistic is 2.27). The return differential for forward default probability is -0.29% per month (not significant). However, the results for short-term minus forward default probability has the highest return differential and statistical significance. The return differential for short-term minus forward default probabilities is 1.10% per month (t-statistic is 4.56) for equally weighted portfolios. For value-weighted portfolios, the return differential is 0.52% per month (t-statistic is 2.07).
For double-sorted portfolios based on size and Merton’s default probability, the higher the default probability, higher the size premium. The default risk premium exists only for small stock. The results for total and short-term default probability are very similar to the results from Merton’s default probability. The results from short-term minus forward default probability are also very similar.
For double-sorted portfolios based on the book-to-market ratio and Merton’s default probability, the higher the default probability, higher the value premium. The default premium exists only for two of the highest book-to-market quantiles. The results for short-term and total default probability from the Geske model are very similar to the results of Merton’s. However, the results based on short-term minus forward probability are quite interesting. The value premium for all default quintiles are large and significant. Also, the default premiums are quite large and significant for every book-to-market quantile.
2. Methodology
2.1. Measuring Default Risk
2.1.1. Merton’s Model
In Merton’s model (1974), the equity of a firm is viewed as a call option on the firm’s assets. This is because the equity of the firm has a residual claim of the firm’s assets. In a simple example where the firm has only one zero-coupon bond, the face value of the debt is the exercise price of the call option. If the asset value at the maturity of the debt is above the face value, the firm will pay off its debt and equity receives the residual value. When the value of the firm’s assets is less than the strike price, the value of equity is zero.
Our approach to calculating default risk measures using Merton’s model is very simple. We assume that the capital structure of the firm includes both equity and debt.
Since the market value of equity can be thought of as a call option on the value of the assets (V) with time to expiration equal to T. The market value of equity, E, will then be given by the Black and Scholes (1973) formula for call options:
where
where r is the risk-free rate, is the volatility of the assets, K is the face value of debt, and N is the cumulative density function of the standard normal distribution.
E = V N(d1) − K e−rT N(d2),
In the Merton model, we have another useful relationship (which can be derived from Ito’s Formula):
Equations (1) and (3) can be used to calculate V and . Note that there is no closed-form solution. This can only be done using numerical procedures. Once we solve for V and , we can calculate the risk-neutral default probability as N(−d2). The default probabilities are calculated at the end of every month.
Note that N(−d2) is the risk-neutral default probability (RNDP), where d2 is known as the risk-neutral distance to default. As explained in detail by Delianedis and Geske (2003), “RNDPs are the correct pricing probabilities, and their changes possess the same information as the price changes. RNDPs are easier to estimate and more accurately estimated than the actual, risk-adjusted default probabilities (RADPs).” RNDP serves as an upper bound for RADP, and both RNDP and RADP have the same sensitivities to the variables that affect option value. As a consequence, our results that are based on risk-neutral probabilities should not be qualitatively different from those that use actual probabilities.
2.1.2. Compound Option Methodology
The compound option model by Geske (1979) extends Merton’s model to include multiple debts. Assume that the firm issues two zero-coupon bonds expiring at time T1 and T2 with face values K1 and K2, respectively. Default at T1 is defined by Geske (1977) as the firm value less than the face value of the first debt plus the market value of the second debt, that is V1 < K1 + D(T1,T2) where D(T1,T2) is the market value of K2 at time T1. So, if we assume a two period example, the solution to the equity value and equity volatility can be derived from Geske’s compound call option (call on call) model:
where N(.) is the univariate standard normal probability and M(.,.;ρ) is the bivariate standard normal probability, and
E(t) = V(t) M(h1+, h2+; ρ) − e−r(T2−t) K2 M (h1−, h2−; ρ) − e−r(T1−t) K1 N(h1−)
Note that can be solved by solving V(T1) − K1 = E(T1) for V(T1), is the critical value of default at time T1 and = K2 is the critical value for the assets to trigger default at T2, which is just the face value of the last debt. E(T1) is the Black-Scholes value of the equity at time T1.
Again, V and sigma can be calculated numerically. Once the asset values and volatility are solved, the default probabilities can be calculated. We calculate the default probabilities at the end of every month for each company.
The closed-form solution actually relies upon the numerical solution of the default point at time . Using Geske’s model, we calculate the default probabilities at the end of the every month. With Geske model, we can calculate three different probabilities: (1) short-term default probability; (2) total default probability; (3) forward default probability. Short-term default probability is the probability that a company will default in the first year (t = 1). Total default probability is the probability that a company will default either in the first year or during the second year. Forward probability is the probability that a company will default during the second period, assuming there was no default during the first year.
There are two main strands in our methodology. The first strand is that we extend Vassalou and Xing (2004) paper to include more complicated model of Geske. By using Geske’s (1979) compound-option model we get a lot more information of the default probability of the firm. In estimating default probabilities from Geske model, we follow Ren-Raw Chen (2013). This is a two-period (three date) model that produces a short-term (end of first period) default probability and a long-term, forward, default probability (end of second period). Initial tests indicate that the forward default probability may be interesting information even when the total default probability by the Geske model is highly correlated to the Merton measure. These early tests indicate that when the total default probability is decomposed into a short and a forward component, each is more significant than the total probability and the forward is more significant than the short.
The second strand of our methodology is to follow standard practice in current asset-pricing literature and to exhaustively analyze stock returns after forming portfolios that are sorted by default risk, size, book-to-market ratio, etc. We follow the methodology presented in Cakici (2015); Fama and French (2017) and Novy-Marx (2013).
In Merton (1974), the equity of a firm is viewed as a call-option on the firm’s assets. The exercise price of the call option is the value of the liabilities. Our approach to calculating default probability in the Merton model is the same as in Vassalou and Xing (2004), and we use 50% of the liabilities as “Debt Due in One Year.” For Geske’s model, we use the current liabilities as “Debt Due in One Year” and we assume that all long-term liabilities have a maturity of two years.
3. Data
Our sample includes all U.S companies. We use the Compustat annual files to get the firm’s book value, firm’s debt in one year, and long-term debt series for all companies. As the book value of debt we use the debt in one year plus half the long-term debt. This is exactly the same as in Vassalou and Xing (2004). Our sample period is from July 1963 to December 2013. We get the daily and monthly returns and market values from the CRSP daily and monthly files. Firms with negative book-to-market ratios are excluded from the sample. The average number of firms per month in our sample is 2900.
4. Results
4.1. Pairwise Correlations between Variables
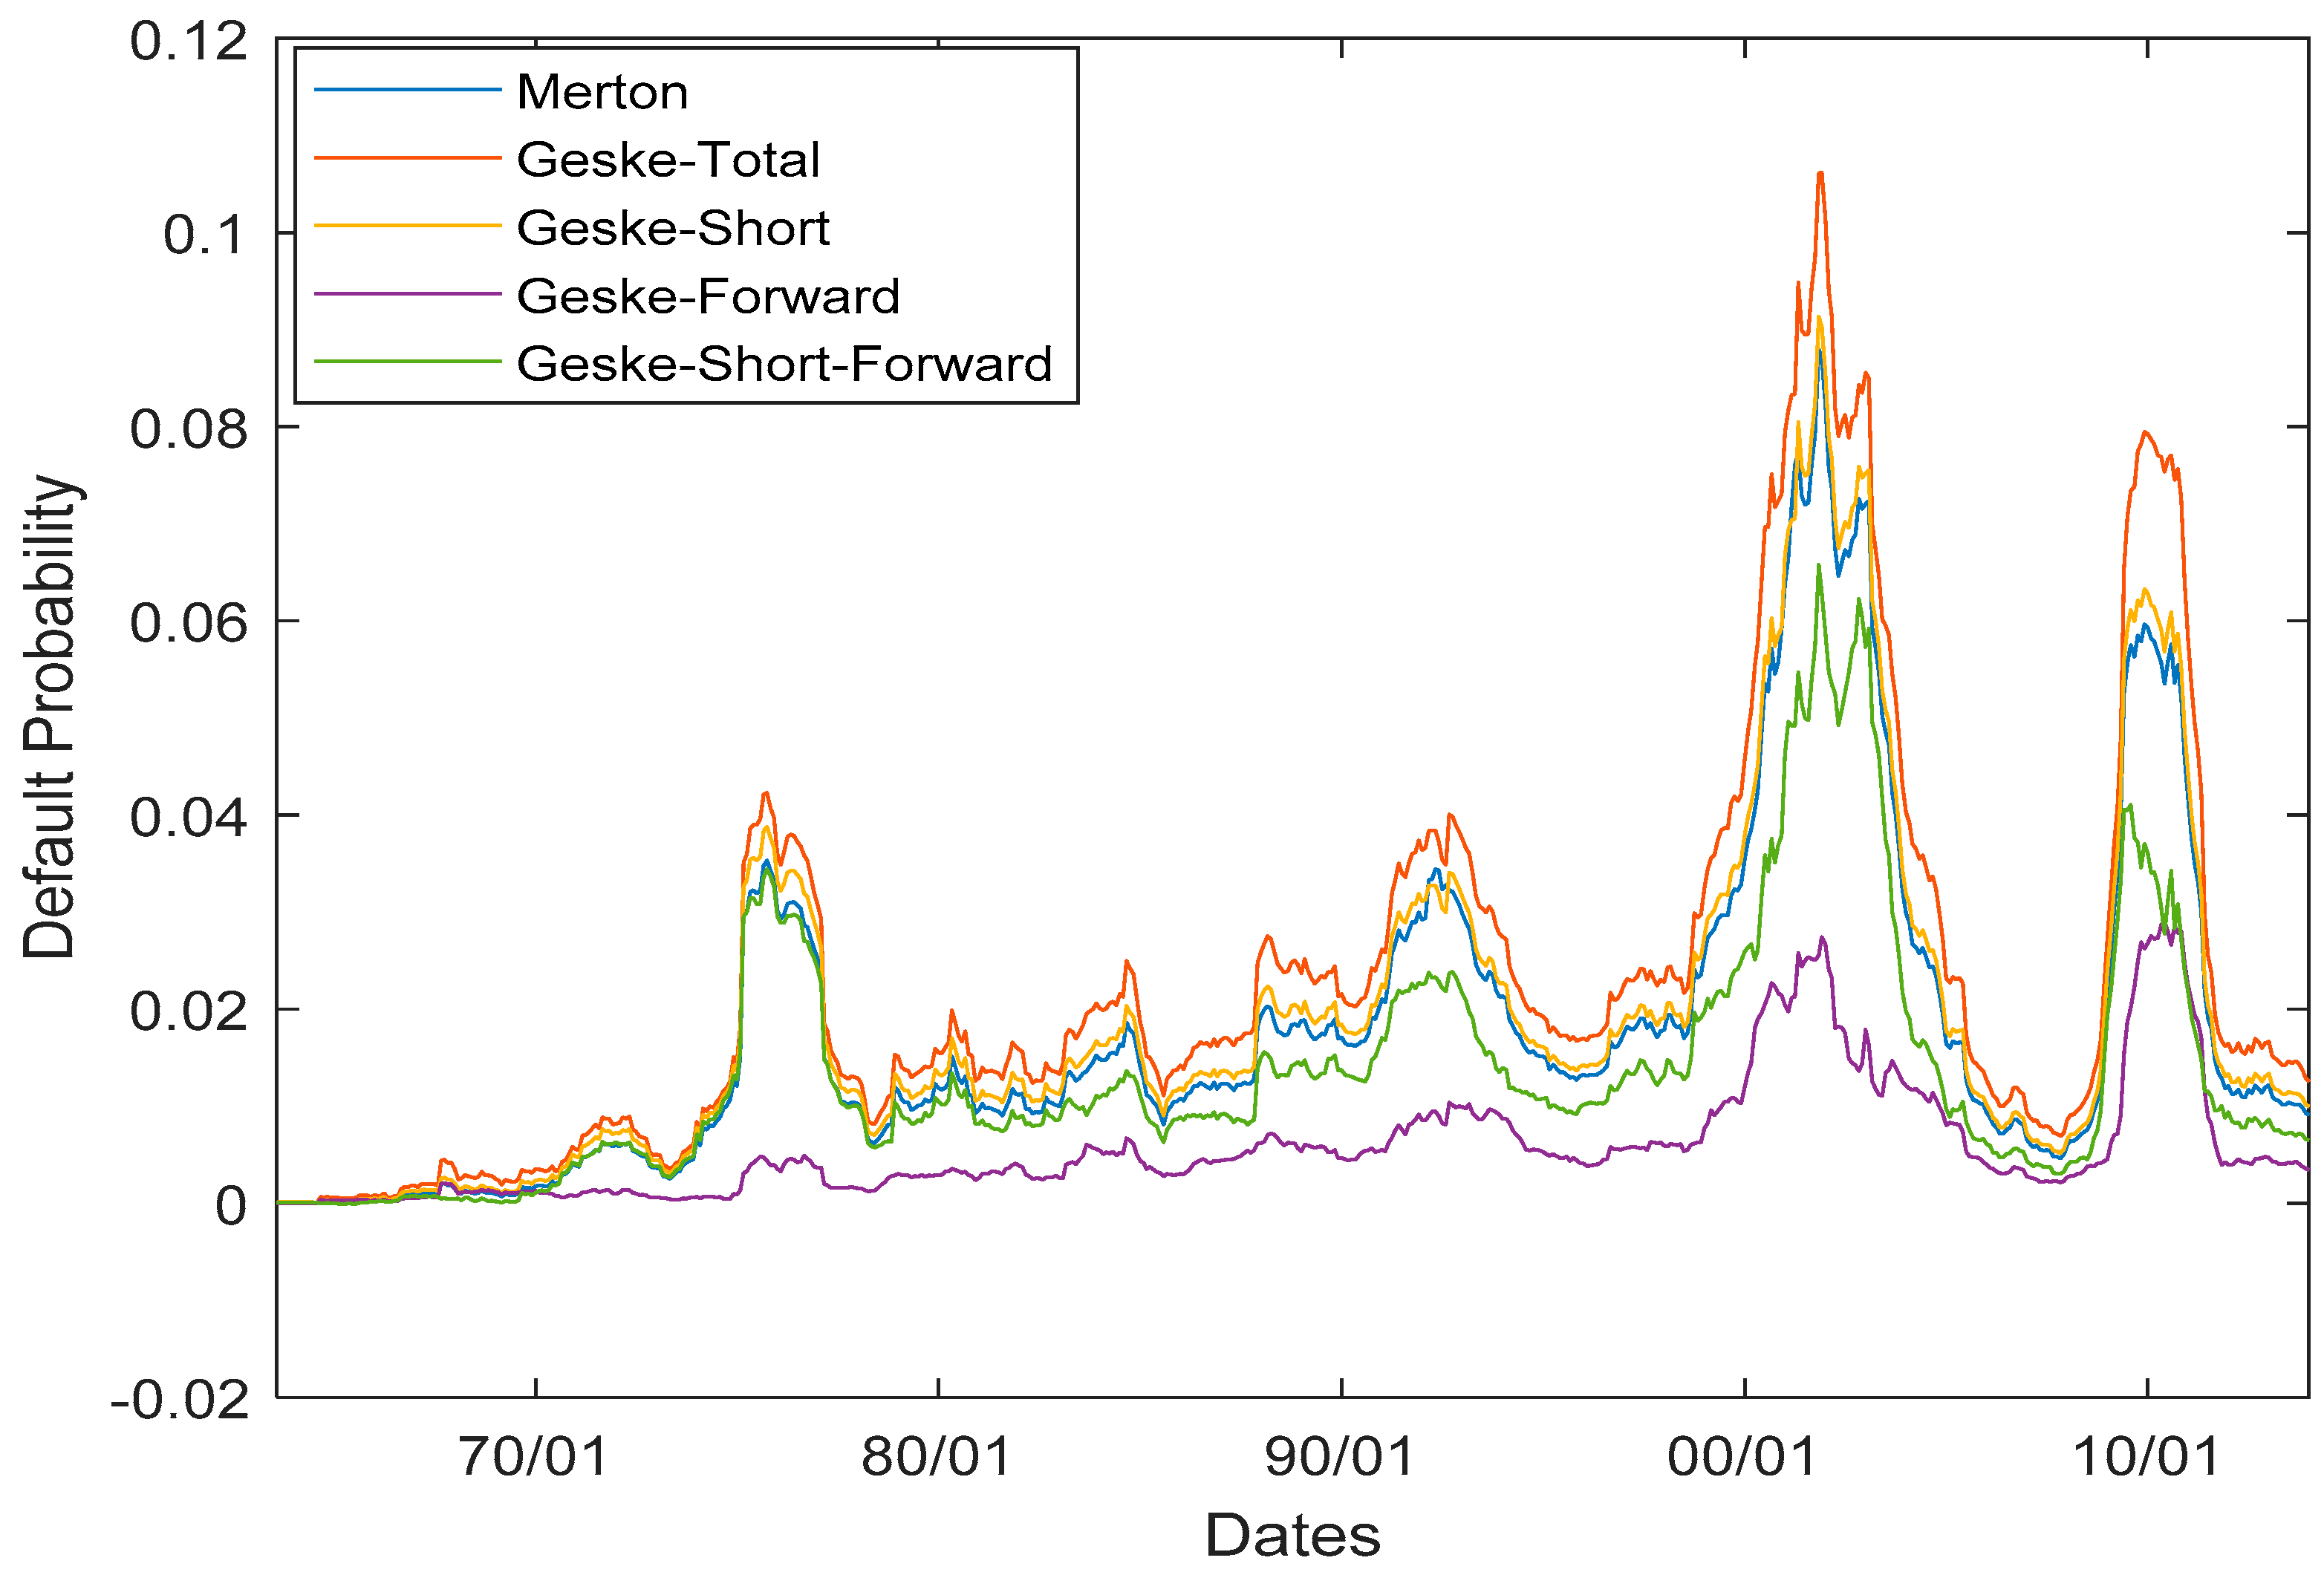
Table 1 presents the pairwise correlations between different measures of default probability, beta, size, and book-to-market ratio for the sample of firms covering July 1963 to December 2013. From the Merton model we get one measure of default probability. The Geske model provides three measures: (1) the total default probability at time t = 0 of incurring default at t = 1 or t = 2; (2) the short-term default probability of incurring default at t = 1; and (3) the forward default probability of incurring default at t = 2 if there is no default at t = 1. Therefore, the Geske model gives a term structure of default probabilities and we examine a fourth measure by computing the difference between the short-term and the forward default probabilities as a measure of the slope of this term structure of default probability.
The Merton default probability is very highly correlated to Geske’s total default probability (0.96) and to Geske’s short-term default probability (1.00), but its correlation coefficient with Geske’s forward default probability is 0.58. It is positively correlated to “short-forward” default probability (0.77). The average values of all five default probabilities are plotted in Figure 1.
4.2. Average Returns from Portfolios Sorted by Default Risk
In Table 2, for each month of the sample period, Merton’s default probability is used to sort all stocks into deciles at the end of each month. We compute the equally weighted and value-weighted returns over the next month for each decile portfolio. Table 2 shows the average monthly returns for the decile portfolios over the sample period. The equally weighted portfolios show that average returns are monotonically higher with increasing default risk. This is consistent with the results in Vassalou and Xing (2004). The difference between the average returns for the highest default risk portfolio and the lowest default risk portfolio has a Newey-West t-statistic of 2.34. The average returns from the “high–low” portfolios cannot be completely explained by the standard risk factors; the ‘alpha’ from the 4-factor model is 0.66 with a t-statistic of 2.13.
Table 3, Table 4 and Table 5 replicate the results in Table 2 by using the three measures of default probability from Geske’s model. Table 3 uses Geske’s total default probability, Table 4 uses Geske’s short-term default probability, and Table 5 uses Geske’s forward default probability. The results in Table 3 and Table 4 are similar to the results in Table 2, i.e., average returns on equally weighted portfolios are higher for higher total default risk and higher short-term default risk. Table 3 shows that the “high–low” deciles of Geske’s total default probability have an average return of 0.63 (Newey-West t-statistic is 1.90), and the “alpha’ from the four-factor model is 0.48 (t-value is 1.63). Table 4 shows that the “high–low” deciles of Geske’s short-term default probability have an average return of 0.77 (Newey-West t-statistic is 2.27), and the “alpha’ from the four-factor model is 0.63 (t-value is 2.08).
In contrast to these results, the forward default probability produces a completely different picture. Table 5 shows that the average returns on decile portfolios formed on the basis of Geske’s forward default probability do not increase with increasing risk. In fact, the average return from “high–low” portfolios is −1.29 (Newey-West t-statistic is −1.07), and the “alpha” from the four-factor model is -0.55 (t-value is −3.65). Table 6 shows the average returns for decile portfolios formed on the basis of the slope of the default risk term structure (i.e., the difference between the short-term default probability and the forward default probability). The return differential for equally weighted high and low portfolios is 1.10 (Newey-West t-statistic is 4.56) and the return differential for value-weighted portfolios is 0.52 (Newey-West t-statistic is 2.07) and the four-factor alpha for equally weighted portfolios is 1.24 (Newey-west t-statistic is 4.61). So, using Geske model creates a much larger return differential than Merton’s model. Not only did the Geske model create a larger return differential, but the value-weighted return differential is significant. These are new results that have not been reported in previous research.
4.3. Average Returns from Portfolios Double Sorted by Size and Default Risk
Table 7 shows the average returns on quintile portfolios double-sorted on size and Merton’s default probability. There are 25 such portfolios. The portfolios that are constructed at the end of each month are the combination of five portfolios formed on size and five portfolios formed on the default probability. The results based on Merton’s model are consistent with Vassalou and Xing (2004). We see that the monotonically increasing effect of default risk on average returns is most pronounced for the smallest size firms. The average return on “high–low” for the smallest size quintile is 1.02 (Newey-West t-statistic is 3.27). The average return differential for the other size quintiles is not statistically significant. On the other hand, the size effect is statistically significant for all default risk quintile portfolios. The size effect is most pronounced for the quintile portfolio with the highest default risk (average return for “small–big” is 1.31, with the Newey-West t-statistic being 4.29).
Table 8, Table 9 and Table 10 replicate Table 7 by using Geske’s total default probability, Geske’s short-term default probability, and Geske’s forward default probability. The results in Table 8 and Table 9 are similar to the results reported in Table 7, i.e., default risk is most pronounced for the smallest quintile and average returns for the smallest size quintile increase monotonically with default risk. However, Table 10 produces a different picture. The average returns on portfolios sorted by forward default risk are negatively related to this measure of risk; in addition, the effect is seen in all size quintiles (with varying t-values). However, the size effect is statistically significant in all forward default quintiles and is similar to what is reported in Table 8 and Table 9.
Table 11 shows the average returns on double-sorted portfolios when we use the short-term minus forward default probability to sort on the risk dimension. The results in Table 11 show that default risk is significant not only among small stocks, but also for big firms. This implies that Geske’s model provides more information that Merton’s model.
4.4. Returns from Portfolios Double-Sorted by Book-to-Market Ratio and Default Risk
In this section we present the returns from portfolios independently double-sorted by book-to-market ratio and default probability. The portfolios that are constructed at the end of each month, are a combination of five portfolios formed on the book-to-market ratio and five portfolios formed on the default probability.
Table 12 shows the average returns on quintile portfolios double-sorted by book-to-market ratio and Merton’s default probability. The average return for every book-to-market quintile is increasing in default risk, but the effect is most pronounced for the highest book-to-market quintile (so-called value stocks), with the average “high–low” return being 0.81 (Newey-West t-statistic = 2.77). Value stocks earn a significantly higher average return for every default risk quintile.
Table 13, Table 14 and Table 15 replicate Table 12 by using the three default measures from the Geske model. As we have seen previously, the results in Table 13 and Table 14 are similar to those reported in Table 12, but Table 15 produces a contrary picture. Table 16 uses the short-term minus forward default probability as the risk measure and the results in Table 16 gives much stronger results than Merton’s model. In Table 12, default risk is significant only for the fourth and fifth book-to-market quintiles, whereas in Table 16 all book-to-market quintiles are significant. This casts doubt on the risk explanation of the book-to-market anomaly. This result is in contrast to the results of Vassalou and Xing.
5. Conclusions
In this paper we report a detailed comparison between the Merton model (Merton 1974) and Geske’s compound option model (Geske 1979) regarding the effect of default risk on average stock returns. This is the first paper that uses Geske’s compound option pricing model to investigate the effect of default risk on average stock returns. We report several interesting results, including the importance of the forward default probability (which is a proxy for the term structure of default risk).
Our results can be summarized as follows. The results based on Merton’s default probability are very similar to the results based on Geske’s short-term default probability and total default probability. A new default measure (short-term minus forward default probability) provides much stronger results based on univariate as well as independent double-sorts. The average return differential between the high and low default probability portfolios is 0.81% (t-statistic is 2.34) for Merton’s model. Whereas the average return differential for total default probability is 0.63% (t-statistic is 1.90). The average return differential for short-term default probability is 0.77% per month (t-statistic is 2.27). The return differential for forward default probability is −0.29% per month (not significant). However, the results for short-term minus forward default probability show the highest return differential and statistical significance. The return differential for short-term minus forward default probabilities is 1.10% per month (t-statistic is 4.56) for equally weighted portfolios. For value-weighted portfolios the return differential is 0.52% per month (t-statistic is 2.07).
For double-sorted portfolios based on size and Merton’s default probability, the higher the default probability, the higher the size premium. The default risk premium exists only for small stock. The results for total and short-term default probability are very similar to the results from Merton’s default probability. The results from short-term minus forward default probability are also very similar.
For double-sorted portfolios based on the book-to-market ratio and Merton’s default probability, the higher the default probability, the higher the value premium. The default premium exists only for two of the highest book-to-market quantiles. The results for short-term and total default probability from the Geske model are very similar to the results of Merton’s. However, the results based on short-term minus forward probability are quite interesting. The value premium for all default quintiles are large and significant. The default premiums are also quite large and significant for every book-to-market quantile.
Author Contributions
All three authors have contributed to the motivation, research methodology, data analysis, and the writing of the paper.
Funding
The authors gratefully acknowledge research funding from the Gabelli School of Business at Fordham University.
Conflicts of Interest
The authors declare no conflict of interest.
References
- Asness, Clifford S., Tobias S. Moskowitz, and Lasse Heje Pederson. 2013. Value and momentum everywhere. Journal of Finance 68: 929–85. [Google Scholar] [CrossRef]
- Black, Fisher, and Myron Scholes. 1973. The Pricing of Options and Corporate Liabilities. Journal of Political Economy 81: 637–54. [Google Scholar] [CrossRef]
- Cakici, Nusret. 2015. Five Factor Fama-French Model: International Evidence. Available online: https://papers.ssrn.com/sol3/papers.cfm?abstract_id=2601662 (accessed on 15 January 2019).
- Chen, Ren-Raw. 2013. Financial Mathematics, 2nd ed. L’Aquila: Global Social Sciences Institute. [Google Scholar]
- Chen, Nai-Fu, and Feng Zhang. 1998. Risk and Return of Value Stocks. Journal of Business 71: 501–35. [Google Scholar] [CrossRef]
- Daniel, Kent, and Sheridan Titman. 2006. Market Reactions to Tangible and Intangible Information. Journal of Finance 61: 1605–43. [Google Scholar] [CrossRef]
- Delianedis, Gordon, and Robert Geske. 2003. Credit Risk and Risk Neutral Default Probabilities: Information about Rating Migrations and Defaults. Available online: https://papers.ssrn.com/sol3/papers.cfm?abstract_id=424301&download=yes (accessed on 15 January 2019).
- Fama, Eugene, and Kenneth French. 1992. The cross-section of expected stock returns. Journal of Finance 47: 427–65. [Google Scholar] [CrossRef]
- Fama, Eugene, and Kenneth French. 1995. Size and Book-to-Market Factors in Earnings and Returns. Journal of Finance 50: 131–55. [Google Scholar] [CrossRef]
- Fama, Eugene, and Kenneth French. 2006. Profitability, Investments, and Average Returns. Journal of Financial Economics 82: 491–518. [Google Scholar] [CrossRef]
- Fama, Eugene, and Kenneth French. 2008. Average Returns, B/M, and Share Issues. Journal of Finance 63: 2971–95. [Google Scholar] [CrossRef]
- Fama, Eugene, and Kenneth French. 2011. Size, Value and Momentum in International Stock Returns. Available online: http://ssrn.com/abstract=1720139 (accessed on 15 January 2019).
- Fama, Eugene, and Kenneth French. 2017. International tests of a five-factor asset pricing model. Journal of Financial Economics 123: 441–63. [Google Scholar] [CrossRef]
- Geske, Robert. 1977. The valuation of corporate liabilities as compound options. Journal of Financial and Quantitative Analysis 12: 541–52. [Google Scholar] [CrossRef]
- Geske, Robert. 1979. The valuation of compound options. Journal of Financial Economics 7: 63–81. [Google Scholar] [CrossRef]
- Graham, Benjamin, and David Dodd. 1934. Security Analysis. New York: McGraw-Hill. [Google Scholar]
- Lakonishok, Josef, Andrei Shleifer, and Robert W. Vishny. 1994. Contrarian Investment, Extrapolation, and Risk. Journal of Finance 49: 1541–78. [Google Scholar] [CrossRef]
- LaPorta, Rafael, Josef Lakonishok, Andrei Shleifer, and Robert Vishny. 1997. Good News for Value Stocks: Further Evidence on Market Efficiency. Journal of Finance 52: 859–74. [Google Scholar]
- Merton, Robert C. 1974. On the pricing of corporate debt: The risk structure of interest rates. Journal of Finance 29: 449–70. [Google Scholar]
- Novy-Marx, Robert. 2013. The other side of value: The gross profitability premium. Journal of Financial Economics 108: 1–28. [Google Scholar] [CrossRef] [Green Version]
- Penman, Stephen H. 1991. An evaluation of accounting rate of return. Journal of Accounting, Auditing and Finance 6: 233–55. [Google Scholar] [CrossRef]
- Piotroski, Joseph D. 2000. Value Investing: The Use of Financial Statement Information to Separate Winners from Losers. Journal of Accounting Research 38: 1–41. [Google Scholar] [CrossRef]
- Piotroski, Joseph D., and Eric C. So. 2012. Identifying Expectation Errors in Value/Glamour Strategies: A Fundamental Analysis Approach. Review of Financial Studies 25: 2841–75. [Google Scholar] [CrossRef]
- Rosenberg, Barr, Kenneth Reid, and Ronald Lanstein. 1985. Persuasive Evidence of Market Inefficiency. Journal of Portfolio Management 11: 9–16. [Google Scholar] [CrossRef]
- Santos, Tano, and Pietro Veronesi. 2010. Habit formation, the cross section of stock returns and the cash-flow risk puzzle. Journal of Financial Economics 98: 385–413. [Google Scholar] [CrossRef]
- Vassalou, Maria, and Yuhang Xing. 2004. Default risk in equity returns. Journal of Finance 59: 831–68. [Google Scholar] [CrossRef]
| 1 | The list of papers is quite long and includes Rosenberg et al. (1985); Fama and French (1992, 1995, 2006, 2008, 2011); Lakonishok et al. (1994); Chen and Zhang (1998); Piotroski (2000); Daniel and Titman (2006) and Asness et al. (2013) among others. |
Figure 1.
Default probabilities.

Table 1.
This table shows pairwise correlations between different measures of default probability, beta, size, and book-to-market ratio, for the period July 1963 to December 2013. M-Def. is Merton’s default probability, T-Def is the total default probability from Geske’s model, S-Def. is the short-term default probability, F-Def. is the forward default probability, S-F Def. is the short-term minus forward default probability from Geske’s model. Beta is the CAPM beta, size is the market value of equity, and bktmkt is the book-to-market ratio.
| M-Def. | T-Def. | S-Def. | F-Def. | S-F Def. | Beta | Stdev | Size | bktmkt | |
|---|---|---|---|---|---|---|---|---|---|
| M-Def. | 1.00 | 0.96 | 1.00 | 0.58 | 0.77 | −0.05 | 0.11 | 0.24 | 0.68 |
| T-Def. | 0.96 | 1.00 | 0.97 | 0.74 | 0.62 | −0.06 | 0.09 | 0.25 | 0.70 |
| S-Def. | 1.00 | 0.97 | 1.00 | 0.59 | 0.77 | −0.06 | 0.11 | 0.25 | 0.69 |
| F-Def. | 0.58 | 0.74 | 0.59 | 1.00 | 0.01 | −0.03 | 0.00 | 0.17 | 0.49 |
| S-F Def. | 0.77 | 0.62 | 0.77 | 0.01 | 1.00 | −0.05 | 0.13 | 0.18 | 0.49 |
| Beta | −0.05 | −0.06 | −0.06 | −0.03 | −0.05 | 1.00 | −0.07 | −0.05 | −0.16 |
| Stdev | 0.11 | 0.09 | 0.11 | 0.00 | 0.13 | −0.07 | 1.00 | −0.09 | −0.01 |
| Size | 0.24 | 0.25 | 0.25 | 0.17 | 0.18 | −0.05 | −0.09 | 1.00 | 0.47 |
| bktmkt | 0.68 | 0.70 | 0.69 | 0.49 | 0.49 | −0.16 | −0.01 | 0.47 | 1.00 |
Table 2.
Average returns from decile portfolios sorted by Merton’s default probability. From the data for July 1963 to December 2013, at the end of each month, we used the most recently calculated Merton’s default probability for each firm to sort all stocks into deciles. We then calculated the equally weighted and value-weighted returns over the next month. The returns are the average monthly returns over the sample period. Portfolio 1 is the portfolio with the lowest default risk and Portfolio 10 is the portfolio with the highest default risk. High-Low is the difference between the high and low default risk portfolios. t-values are calculated from Newey-West standard errors. Alphas are calculated using the CAPM, the three-factor Fama-French, and the four-factor model (Fama-French three-factor plus momentum).
| Deciles | ew_ret | vw_ret | Beta | Std | Size | bktmkt | MD | GTD | GSD | GF | GS-M | Nfirms |
|---|---|---|---|---|---|---|---|---|---|---|---|---|
| low | 1.05 | 0.89 | 0.58 | 6.16 | 6.43 | 0.51 | 0.00 | 0.00 | 0.00 | 0.00 | 0.00 | 290 |
| 2 | 1.11 | 0.99 | 0.79 | 7.67 | 6.01 | 0.59 | 0.00 | 0.00 | 0.00 | 0.00 | 0.00 | 290 |
| 3 | 1.20 | 0.99 | 0.93 | 8.80 | 5.59 | 0.63 | 0.00 | 0.00 | 0.00 | 0.00 | 0.00 | 290 |
| 4 | 1.20 | 1.07 | 1.03 | 9.88 | 5.19 | 0.67 | 0.00 | 0.01 | 0.01 | 0.00 | 0.00 | 290 |
| 5 | 1.27 | 0.99 | 1.13 | 10.99 | 4.83 | 0.71 | 0.02 | 0.04 | 0.03 | 0.00 | −0.02 | 290 |
| 6 | 1.30 | 1.05 | 1.22 | 12.13 | 4.50 | 0.74 | 0.08 | 0.13 | 0.11 | 0.00 | −0.08 | 290 |
| 7 | 1.38 | 1.03 | 1.31 | 13.43 | 4.18 | 0.79 | 0.26 | 0.40 | 0.36 | 0.00 | −0.27 | 290 |
| 8 | 1.41 | 0.98 | 1.41 | 15.08 | 3.79 | 0.83 | 0.82 | 1.15 | 1.03 | 0.02 | −0.81 | 290 |
| 9 | 1.53 | 1.02 | 1.53 | 17.61 | 3.35 | 0.88 | 2.53 | 3.33 | 2.93 | 0.06 | −2.40 | 290 |
| high | 1.86 | 0.97 | 1.84 | 24.51 | 2.71 | 0.92 | 9.95 | 12.46 | 10.62 | 0.49 | −8.21 | 290 |
| dif | 0.81 | 0.08 | ||||||||||
| t-stat | 2.34 | 0.23 | ||||||||||
| Capm_alpha | 0.42 | |||||||||||
| t-stat | 1.46 | |||||||||||
| FF3-alpha | 0.16 | |||||||||||
| t-stat | 0.73 | |||||||||||
| FF4-alpha | 0.66 | |||||||||||
| t-stat | 2.13 |
Table 3.
Average returns from ddecile portfolios sorted by Geske’s total default probability. From the data for July 1963 to December 2013, at the end of each month, we used the most recently calculated Geske’s total default probability for each firm to sort all stocks into deciles. We then calculated the equally weighted and value-weighted returns over the next month. The returns are the average monthly returns over the sample period. Portfolio 1 is the portfolio with the lowest default risk and Portfolio 10 is the portfolio with the highest default risk. High-Low is the difference between the high and low default risk portfolios. t-values are calculated from Newey-West standard errors. Alphas are calculated using the CAPM, the three-factor Fama-French, and the four-factor model (Fama-French three-factor plus momentum).
| Deciles | ew_ret | vw_ret | Beta | Std | Size | bktmkt | MD | GTD | GSD | GF | GS-M | Nfirms |
|---|---|---|---|---|---|---|---|---|---|---|---|---|
| low | 1.09 | 0.94 | 0.63 | 6.35 | 6.37 | 0.53 | 0.00 | 0.00 | 0.00 | 0.00 | 0.00 | 290 |
| 2 | 1.16 | 0.91 | 0.79 | 7.80 | 5.84 | 0.58 | 0.00 | 0.00 | 0.00 | 0.00 | 0.00 | 290 |
| 3 | 1.19 | 0.98 | 0.91 | 8.71 | 5.50 | 0.65 | 0.00 | 0.00 | 0.00 | 0.00 | 0.00 | 290 |
| 4 | 1.20 | 0.97 | 1.01 | 9.70 | 5.16 | 0.68 | 0.00 | 0.01 | 0.01 | 0.00 | −0.01 | 290 |
| 5 | 1.27 | 0.97 | 1.10 | 10.73 | 4.81 | 0.71 | 0.02 | 0.04 | 0.03 | 0.00 | −0.03 | 290 |
| 6 | 1.28 | 0.99 | 1.21 | 11.87 | 4.53 | 0.74 | 0.09 | 0.16 | 0.13 | 0.00 | −0.12 | 290 |
| 7 | 1.42 | 1.08 | 1.29 | 13.21 | 4.19 | 0.78 | 0.31 | 0.47 | 0.39 | 0.01 | −0.37 | 290 |
| 8 | 1.41 | 0.97 | 1.42 | 14.96 | 3.84 | 0.81 | 0.91 | 1.31 | 1.09 | 0.04 | −1.00 | 290 |
| 9 | 1.55 | 0.91 | 1.55 | 17.67 | 3.41 | 0.85 | 2.65 | 3.60 | 3.02 | 0.15 | −2.74 | 290 |
| high | 1.72 | 0.74 | 1.88 | 24.77 | 2.84 | 0.86 | 9.92 | 12.77 | 10.63 | 1.38 | −8.08 | 290 |
| dif | 0.63 | −0.20 | ||||||||||
| t-stat | 1.90 | −0.64 | ||||||||||
| Capm_alpha | 0.25 | |||||||||||
| t-stat | 0.90 | |||||||||||
| FF3-alpha | 0.03 | |||||||||||
| t-stat | 0.13 | |||||||||||
| FF4-alpha | 0.48 | |||||||||||
| t-stat | 1.63 |
Table 4.
Average returns from decile portfolios sorted by Geske’s short-term default probability. From the data for July 1963 to December 2013, at the end of each month, we used the most recently calculated Geske’s short-term default probability for each firm to sort all stocks into deciles. We then calculated the equally weighted and value-weighted returns over the next month. The returns are the average monthly returns over the sample period. Portfolio 1 is the portfolio with the lowest default risk and Portfolio 10 is the portfolio with the highest default risk. High-Low is the difference between the high and low default risk portfolios. t-values are calculated from Newey-West standard errors. Alphas are calculated using the CAPM, the three-factor Fama-French, and the four-factor model (Fama-French three-factor plus momentum).
| Deciles | ew_ret | vw_ret | Beta | Std | Size | bktmkt | MD | GTD | GSD | GF | GS-M | Nfirms |
|---|---|---|---|---|---|---|---|---|---|---|---|---|
| low | 1.07 | 0.92 | 0.62 | 6.32 | 6.44 | 0.53 | 0.00 | 0.00 | 0.00 | 0.00 | 0.00 | 290 |
| 2 | 1.13 | 0.90 | 0.79 | 7.79 | 5.89 | 0.57 | 0.00 | 0.00 | 0.00 | 0.00 | 0.00 | 290 |
| 3 | 1.20 | 1.04 | 0.91 | 8.74 | 5.54 | 0.63 | 0.00 | 0.00 | 0.00 | 0.00 | 0.00 | 290 |
| 4 | 1.16 | 1.02 | 1.01 | 9.71 | 5.20 | 0.67 | 0.00 | 0.01 | 0.01 | 0.00 | 0.00 | 290 |
| 5 | 1.27 | 0.95 | 1.11 | 10.82 | 4.83 | 0.71 | 0.02 | 0.04 | 0.03 | 0.00 | −0.02 | 290 |
| 6 | 1.30 | 1.02 | 1.21 | 11.95 | 4.52 | 0.74 | 0.08 | 0.14 | 0.12 | 0.00 | −0.09 | 290 |
| 7 | 1.38 | 1.07 | 1.30 | 13.28 | 4.20 | 0.78 | 0.26 | 0.43 | 0.36 | 0.01 | −0.29 | 290 |
| 8 | 1.40 | 0.99 | 1.41 | 14.95 | 3.82 | 0.83 | 0.82 | 1.22 | 1.03 | 0.03 | −0.84 | 290 |
| 9 | 1.53 | 1.00 | 1.54 | 17.55 | 3.39 | 0.87 | 2.52 | 3.43 | 2.93 | 0.09 | −2.43 | 290 |
| high | 1.84 | 0.93 | 1.85 | 24.51 | 2.74 | 0.91 | 9.93 | 12.59 | 10.63 | 0.57 | −8.22 | 290 |
| dif | 0.77 | 0.01 | ||||||||||
| t-stat | 2.27 | 0.02 | ||||||||||
| Capm_alpha | 0.38 | |||||||||||
| t-stat | 1.36 | |||||||||||
| FF3-alpha | 0.14 | |||||||||||
| t-stat | 0.63 | |||||||||||
| FF4-alpha | 0.63 | |||||||||||
| t-stat | 2.08 |
Table 5.
Average returns from decile portfolios sorted by Geske’s forward default probability. From the data for July 1963 to December 2013, at the end of each month, we used the most recently calculated Geske’s forward default probability for each firm to sort all stocks into deciles. We then calculated the equally weighted and value-weighted returns over the next month. The returns are the average monthly returns over the sample period. Portfolio 1 is the portfolio with the lowest default risk and Portfolio 10 is the portfolio with the highest default risk. High-Low is the difference between the high and low default risk portfolios. t-values are calculated from Newey-West standard errors. Alphas are calculated using the CAPM, the three-factor Fama-French, and the four-factor model (Fama-French three-factor plus momentum).
| Deciles | ew_ret | vw_ret | Beta | Std | Size | bktmkt | MD | GTD | GSD | GF | GS-M | Nfirms |
|---|---|---|---|---|---|---|---|---|---|---|---|---|
| low | 1.41 | 0.97 | 0.75 | 8.03 | 5.44 | 0.75 | 0.00 | 0.00 | 0.00 | 0.00 | 0.00 | 290 |
| 2 | 1.54 | 1.16 | 0.88 | 9.80 | 4.56 | 0.74 | 0.06 | 0.07 | 0.07 | 0.00 | −0.07 | 290 |
| 3 | 1.37 | 0.98 | 0.93 | 10.65 | 4.37 | 0.70 | 0.01 | 0.01 | 0.01 | 0.00 | −0.01 | 290 |
| 4 | 1.31 | 0.88 | 0.94 | 10.03 | 4.90 | 0.72 | 0.00 | 0.00 | 0.00 | 0.00 | 0.00 | 290 |
| 5 | 1.30 | 0.92 | 1.02 | 10.29 | 5.01 | 0.71 | 0.00 | 0.01 | 0.01 | 0.00 | −0.01 | 290 |
| 6 | 1.33 | 0.94 | 1.10 | 11.15 | 4.83 | 0.71 | 0.01 | 0.02 | 0.02 | 0.00 | −0.02 | 290 |
| 7 | 1.29 | 0.85 | 1.21 | 12.16 | 4.68 | 0.71 | 0.03 | 0.05 | 0.05 | 0.00 | −0.04 | 290 |
| 8 | 1.30 | 0.95 | 1.32 | 13.49 | 4.52 | 0.69 | 0.09 | 0.21 | 0.16 | 0.04 | −0.12 | 290 |
| 9 | 1.29 | 0.91 | 1.49 | 15.67 | 4.24 | 0.67 | 0.41 | 0.97 | 0.63 | 0.26 | −0.33 | 290 |
| high | 1.13 | 0.70 | 1.81 | 21.72 | 3.72 | 0.63 | 3.39 | 7.15 | 4.26 | 2.42 | −0.75 | 290 |
| dif | −0.29 | −0.27 | ||||||||||
| t-stat | −1.29 | −1.07 | ||||||||||
| Capm_alpha | −0.56 | |||||||||||
| t-stat | −2.90 | |||||||||||
| FF3-alpha | −0.59 | |||||||||||
| t-stat | −3.94 | |||||||||||
| FF4-alpha | −0.55 | |||||||||||
| t-stat | −3.65 |
Table 6.
Average returns from decile portfolios sorted by Geske’s short-term minus forward default probability. From the data for July 1963 to December 2013, at the end of each month, we used the most recently calculated Geske’s short-term minus forward default probability for each firm to sort all stocks into deciles. We then calculated the equally weighted and value-weighted returns over the next month. The returns are the average monthly returns over the sample period. Portfolio 1 is the portfolio with the lowest default risk and Portfolio 10 is the portfolio with the highest default risk. High-Low is the difference between the high and low default risk portfolios. t-values are calculated from Newey-West standard errors. Alphas are calculated using the CAPM, the three-factor Fama-French and the four-factor model (Fama-French three-factor plus momentum).
| Deciles | ew_ret | vw_ret | Beta | Std | Size | bktmkt | MD | GTD | GSD | GF | GS-M | Nfirms |
|---|---|---|---|---|---|---|---|---|---|---|---|---|
| low | 0.88 | 0.72 | 1.41 | 14.81 | 4.91 | 0.50 | 0.07 | 0.64 | 0.17 | 0.46 | −0.21 | 290 |
| 2 | 0.93 | 0.76 | 0.87 | 8.42 | 6.06 | 0.55 | 0.00 | 0.00 | 0.00 | 0.00 | 0.00 | 290 |
| 3 | 1.15 | 0.98 | 0.71 | 6.94 | 6.12 | 0.58 | 0.00 | 0.00 | 0.00 | 0.00 | 0.00 | 290 |
| 4 | 1.24 | 1.10 | 0.84 | 8.15 | 5.59 | 0.63 | 0.00 | 0.00 | 0.00 | 0.00 | 0.00 | 290 |
| 5 | 1.30 | 1.18 | 0.96 | 9.50 | 5.09 | 0.70 | 0.01 | 0.01 | 0.01 | 0.00 | 0.01 | 290 |
| 6 | 1.33 | 1.07 | 1.09 | 10.89 | 4.61 | 0.76 | 0.04 | 0.06 | 0.06 | 0.00 | 0.05 | 290 |
| 7 | 1.45 | 1.15 | 1.22 | 12.34 | 4.25 | 0.81 | 0.17 | 0.23 | 0.22 | 0.00 | 0.19 | 290 |
| 8 | 1.44 | 1.03 | 1.33 | 14.08 | 3.84 | 0.86 | 0.61 | 0.77 | 0.74 | 0.00 | 0.66 | 290 |
| 9 | 1.57 | 1.13 | 1.47 | 16.71 | 3.37 | 0.91 | 2.09 | 2.48 | 2.38 | 0.02 | 2.10 | 290 |
| high | 1.98 | 1.25 | 1.75 | 23.05 | 2.66 | 0.96 | 8.78 | 9.87 | 9.38 | 0.05 | 8.22 | 290 |
| dif | 1.10 | 0.52 | ||||||||||
| t-stat | 4.56 | 2.07 | ||||||||||
| Capm_alpha | 0.98 | |||||||||||
| t-stat | 4.51 | |||||||||||
| FF3-alpha | 0.73 | |||||||||||
| t-stat | 3.39 | |||||||||||
| FF4-alpha | 1.24 | |||||||||||
| t-stat | 4.61 |
Table 7.
Average returns from double-sorted quantile portfolios (sorted by size and Merton’s default probability). From the data for July 1963 to December 2013, at the end of each month, stocks are independently sorted into 5 × 5 portfolios based on size and Merton’s default probability. The table shows average returns for each of 25 portfolios. Small-big is the return differential between the small and big firm portfolios within each default quantile. High-low is the return differential between the high and low default probability firms within each size quantile. t-statistics are calculated using Newey-West standard errors.
| Size | Low | 2 | 3 | 4 | High | High-Low | t-Stat |
|---|---|---|---|---|---|---|---|
| small | 1.36 | 1.53 | 1.59 | 1.91 | 2.37 | 1.02 | 3.27 |
| 2 | 1.23 | 1.26 | 1.31 | 1.28 | 1.09 | −0.15 | −0.52 |
| 3 | 1.08 | 1.23 | 1.25 | 1.26 | 1.07 | −0.01 | −0.03 |
| 4 | 1.18 | 1.20 | 1.24 | 1.20 | 0.99 | −0.19 | −0.73 |
| big | 0.97 | 1.05 | 1.08 | 0.98 | 1.07 | 0.09 | 0.34 |
| small-big | 0.38 | 0.48 | 0.51 | 0.93 | 1.31 | ||
| t-stat | 2.23 | 2.67 | 2.62 | 4.20 | 4.29 |
Table 8.
Average returns from double-sorted quantile portfolios (sorted by size and Geske’s total default probability). From the data for July 1963 to December 2013, at the end of each month, stocks are independently sorted into 5 × 5 portfolios based on size and Geske’s total default probability. The table shows average returns for each of 25 portfolios. Small-big is the return differential between the small and big firm portfolios within each default quantile. High-low is the return differential between the high and low default probability firms within each size quantile. t-statistics are calculated using Newey-West standard errors.
| Size | Low | 2 | 3 | 4 | High | High-Low | t-Stat |
|---|---|---|---|---|---|---|---|
| small | 1.42 | 1.51 | 1.61 | 2.00 | 2.35 | 0.93 | 3.18 |
| 2 | 1.28 | 1.28 | 1.30 | 1.26 | 1.07 | −0.20 | −0.76 |
| 3 | 1.16 | 1.27 | 1.26 | 1.25 | 1.05 | −0.11 | −0.45 |
| 4 | 1.20 | 1.23 | 1.20 | 1.21 | 0.98 | −0.22 | −0.89 |
| big | 1.00 | 1.06 | 1.06 | 1.03 | 0.81 | −0.19 | −0.73 |
| small-big | 0.42 | 0.46 | 0.56 | 0.98 | 1.55 | ||
| t-stat | 2.59 | 2.42 | 2.82 | 4.41 | 5.21 |
Table 9.
Average returns from double-sorted quantile portfolios (sorted by size and Geske’s short-term default probability). From the data for July 1963 to December 2013, at the end of each month, stocks are independently sorted into 5 × 5 portfolios based on size and Geske’s short-term default probability. The table shows average returns for each of 25 portfolios. Small–big is the return differential between the small and big firm portfolios within each default quantile. High–low is the return differential between the high and low default probability firms within each size quantile. t-statistics are calculated using Newey-West standard errors.
| Size | Low | 2 | 3 | 4 | High | High-Low | t-Stat |
|---|---|---|---|---|---|---|---|
| small | 1.38 | 1.49 | 1.63 | 1.92 | 2.38 | 1.00 | 3.35 |
| 2 | 1.26 | 1.26 | 1.32 | 1.27 | 1.08 | −0.17 | −0.65 |
| 3 | 1.11 | 1.24 | 1.28 | 1.26 | 1.08 | −0.04 | −0.14 |
| 4 | 1.19 | 1.23 | 1.23 | 1.20 | 0.99 | −0.20 | −0.78 |
| big | 0.98 | 1.10 | 1.06 | 0.98 | 0.98 | 0.00 | 0.01 |
| small-big | 0.40 | 0.39 | 0.57 | 0.95 | 1.40 | ||
| t-stat | 2.52 | 2.02 | 2.91 | 4.30 | 4.69 |
Table 10.
Average returns from double-sorted quantile portfolios (sorted by size and Geske’s forward default probability). From the data for July 1963 to December 2013, at the end of each month, stocks are independently sorted into 5 × 5 portfolios based on size and Geske’s forward default probability. The table shows average returns for each of 25 portfolios. Small-big is the return differential between the small and big firm portfolios within each default quantile. High-low is the return differential between the high and low default probability firms within each size quantile. t-statistics are calculated using Newey-West standard errors.
| Size | Low | 2 | 3 | 4 | High | High-Low | t-Stat |
|---|---|---|---|---|---|---|---|
| small | 2.15 | 2.31 | 2.05 | 1.96 | 1.88 | −0.27 | −2.13 |
| 2 | 1.36 | 1.36 | 1.32 | 1.19 | 0.97 | −0.39 | −2.61 |
| 3 | 1.27 | 1.29 | 1.25 | 1.29 | 1.00 | −0.27 | −1.90 |
| 4 | 1.22 | 1.37 | 1.20 | 1.16 | 1.05 | −0.17 | −1.07 |
| big | 1.10 | 1.01 | 1.01 | 1.01 | 0.82 | −0.28 | −1.43 |
| small-big | 1.05 | 1.30 | 1.05 | 0.94 | 1.06 | ||
| t-stat | 3.90 | 4.19 | 4.13 | 3.97 | 4.19 |
Table 11.
Average returns from double-sorted quantile portfolios (sorted by size and Geske’s short-term minus forward default probability). From the data for July 1963 to December 2013, at the end of each month, stocks are independently sorted into 5 × 5 portfolios based on size and Geske’s short-term minus forward default probability. The table shows average returns for each of 25 portfolios. Small-big is the return differential between the small and big firm portfolios within each default quantile. High-low is the return differential between the high and low default probability firms within each size quantile. t-statistics are calculated using Newey-West standard errors.
| Size | Low | 2 | 3 | 4 | High | High-Low | t-Stat |
|---|---|---|---|---|---|---|---|
| small | 1.20 | 1.55 | 1.52 | 1.91 | 2.44 | 1.24 | 5.20 |
| 2 | 0.86 | 1.41 | 1.38 | 1.34 | 1.15 | 0.29 | 1.47 |
| 3 | 0.91 | 1.22 | 1.35 | 1.36 | 1.11 | 0.19 | 0.97 |
| 4 | 1.04 | 1.23 | 1.30 | 1.27 | 1.11 | 0.07 | 0.33 |
| big | 0.82 | 1.11 | 1.19 | 1.05 | 1.39 | 0.57 | 2.04 |
| small-big | 0.38 | 0.44 | 0.33 | 0.86 | 1.06 | ||
| t-stat | 1.56 | 2.68 | 1.79 | 4.03 | 3.55 |
Table 12.
Average returns from double-sorted quantile portfolios (sorted by book-to-market ratio and Merton’s default probability). From the data for July 1963 to December 2013, at the end of each month, stocks are independently sorted into 5 × 5 portfolios based on the book-to-market ratio and Merton’s default probability. The table shows average returns for each of 25 portfolios. Small-big is the return differential between the small and big firm portfolios within each default quantile. High-low is the return differential between the high and low default probability firms within each size quantile. t-statistics are calculated using Newey-West standard errors.
| Low | 2 | 3 | 4 | High | High-Low | t-Stat | |
|---|---|---|---|---|---|---|---|
| Low BM | 0.94 | 0.92 | 0.65 | 0.63 | 1.09 | 0.15 | 0.47 |
| 2 | 1.12 | 1.14 | 1.25 | 1.22 | 1.40 | 0.28 | 0.92 |
| 3 | 1.15 | 1.26 | 1.34 | 1.48 | 1.66 | 0.51 | 1.54 |
| 4 | 1.11 | 1.34 | 1.45 | 1.65 | 1.77 | 0.66 | 2.06 |
| High BM | 1.29 | 1.44 | 1.61 | 1.74 | 2.10 | 0.81 | 2.77 |
| High-low BM | 0.36 | 0.52 | 0.96 | 1.11 | 1.02 | ||
| t-stat | 2.06 | 2.58 | 4.93 | 5.64 | 4.64 |
Table 13.
Average returns from double-sorted quantile portfolios (sorted by book-to-market ratio and Geske’s total default probability). From the data for July 1963 to December 2013, at the end of each month, stocks are independently sorted into 5 × 5 portfolios based on the book-to-market ratio and Geske’s total default probability. The table shows average returns for each of 25 portfolios. Small-big is the return differential between the small and big firm portfolios within each default quantile. High-low is the return differential between the high and low default probability firms within each size quantile. t-statistics are calculated using Newey-West standard errors.
| Low | 2 | 3 | 4 | High | High-Low | t-Stat | |
|---|---|---|---|---|---|---|---|
| Low BM | 0.95 | 0.93 | 0.69 | 0.73 | 0.96 | 0.01 | 0.03 |
| 2 | 1.19 | 1.09 | 1.20 | 1.22 | 1.41 | 0.22 | 0.78 |
| 3 | 1.22 | 1.28 | 1.30 | 1.48 | 1.61 | 0.39 | 1.26 |
| 4 | 1.18 | 1.37 | 1.43 | 1.67 | 1.74 | 0.56 | 1.86 |
| High BM | 1.31 | 1.49 | 1.65 | 1.75 | 2.10 | 0.79 | 2.75 |
| High-low BM | 0.36 | 0.56 | 0.96 | 1.02 | 1.14 | ||
| t-stat | 2.16 | 2.78 | 5.15 | 5.04 | 5.42 |
Table 14.
Average returns from double-sorted quantile portfolios (sorted by book-to-market ratio and Geske’s short-term default probability). From the data for July 1963 to December 2013, at the end of each month, stocks are independently sorted into 5 × 5 portfolios based on the book-to-market ratio and Geske’s short-term default probability. The table shows average returns for each of 25 portfolios. Small-big is the return differential between the small and big firm portfolios within each default quantile. High-low is the return differential between the high and low default probability firms within each size quantile. t-statistics are calculated using Newey-West standard errors.
| Low | 2 | 3 | 4 | High | High-Low | t-Stat | |
|---|---|---|---|---|---|---|---|
| Low BM | 0.94 | 0.92 | 0.69 | 0.63 | 1.06 | 0.12 | 0.37 |
| 2 | 1.16 | 1.10 | 1.24 | 1.21 | 1.41 | 0.24 | 0.81 |
| 3 | 1.18 | 1.29 | 1.35 | 1.49 | 1.65 | 0.47 | 1.46 |
| 4 | 1.17 | 1.35 | 1.47 | 1.65 | 1.76 | 0.59 | 1.89 |
| High BM | 1.29 | 1.48 | 1.61 | 1.72 | 2.11 | 0.82 | 2.85 |
| High-low BM | 0.35 | 0.57 | 0.93 | 1.10 | 1.05 | ||
| t-stat | 2.05 | 2.75 | 4.65 | 5.50 | 4.86 |
Table 15.
Average returns from double-sorted quantile portfolios (sorted by book-to-market ratio and Geske’s forward default probability). From the data for July 1963 to December 2013, at the end of each month, stocks are independently sorted into 5 × 5 portfolios based on the book-to-market ratio and Geske’s forward default probability. The table shows average returns for each of 25 portfolios. Small-big is the return differential between the small and big firm portfolios within each default quantile. High-low is the return differential between the high and low default probability firms within each size quantile. t-statistics are calculated using Newey-West standard errors.
| Low | 2 | 3 | 4 | High | High-Low | t-Stat | |
|---|---|---|---|---|---|---|---|
| Low BM | 1.01 | 1.08 | 0.85 | 0.83 | 0.62 | −0.39 | −2.11 |
| 2 | 1.38 | 1.24 | 1.19 | 1.15 | 1.09 | −0.30 | −1.94 |
| 3 | 1.51 | 1.53 | 1.27 | 1.32 | 1.25 | −0.26 | −1.52 |
| 4 | 1.54 | 1.39 | 1.46 | 1.43 | 1.53 | −0.01 | −0.05 |
| High BM | 1.92 | 1.73 | 1.73 | 1.76 | 1.72 | −0.20 | −1.37 |
| High-low BM | 0.91 | 0.65 | 0.87 | 0.92 | 1.10 | ||
| t-stat | 4.70 | 3.06 | 4.90 | 4.89 | 5.45 |
Table 16.
Average returns from double-sorted quantile portfolios (sorted by book-to-market ratio and Geske’s short-term minus forward default probability). From the data for July 1963 to December 2013, at the end of each month, stocks are independently sorted into 5 × 5 portfolios based on book-to-market and Geske’s short-term minus forward default probability. The table shows average returns for each of 25 portfolios. Small-big is the return differential between the small and big firm portfolios within each default quantile. High-low is the return differential between the high and low default probability firms within each size quantile. t-statistics are calculated using Newey-West standard errors.
| Low | 2 | 3 | 4 | High | High-Low | t-Stat | |
|---|---|---|---|---|---|---|---|
| Low BM | 0.57 | 0.95 | 0.87 | 0.67 | 1.28 | 0.71 | 2.68 |
| 2 | 0.95 | 1.22 | 1.21 | 1.32 | 1.50 | 0.55 | 2.14 |
| 3 | 1.00 | 1.35 | 1.41 | 1.49 | 1.73 | 0.73 | 2.55 |
| 4 | 1.14 | 1.29 | 1.50 | 1.61 | 1.81 | 0.68 | 2.63 |
| High BM | 1.38 | 1.42 | 1.57 | 1.73 | 2.10 | 0.72 | 2.87 |
| High-low BM | 0.82 | 0.47 | 0.71 | 1.06 | 0.82 | ||
| t-stat | 4.15 | 2.42 | 3.53 | 5.33 | 3.65 |
© 2019 by the authors. Licensee MDPI, Basel, Switzerland. This article is an open access article distributed under the terms and conditions of the Creative Commons Attribution (CC BY) license (http://creativecommons.org/licenses/by/4.0/).
Share and Cite
MDPI and ACS Style
Cakici, N.; Chatterjee, S.; Chen, R.-R. Default Risk and Cross Section of Returns. J. Risk Financial Manag. 2019, 12, 95. https://doi.org/10.3390/jrfm12020095
AMA Style
Cakici N, Chatterjee S, Chen R-R. Default Risk and Cross Section of Returns. Journal of Risk and Financial Management. 2019; 12(2):95. https://doi.org/10.3390/jrfm12020095
Chicago/Turabian StyleCakici, Nusret, Sris Chatterjee, and Ren-Raw Chen. 2019. "Default Risk and Cross Section of Returns" Journal of Risk and Financial Management 12, no. 2: 95. https://doi.org/10.3390/jrfm12020095