Volatility Spillovers Arising from the Financialization of Commodities

Department of Economics, Lazaridis School of Business and Economics, Wilfrid Laurier University, Waterloo, ON N2L 3C5, Canada
*
Author to whom correspondence should be addressed.
J. Risk Financial Manag. 2018, 11(4), 72; https://doi.org/10.3390/jrfm11040072
Submission received: 7 September 2018
/
Revised: 17 October 2018
/
Accepted: 25 October 2018
/
Published: 27 October 2018
(This article belongs to the Special Issue Stock Market Volatility Modelling and Forecasting)
Abstract
:This paper examines whether the proliferation of new index products, such as commodity-tracking exchange-traded funds (ETFs), amplified the volatility transmission channel introduced by financialization. This paper focuses on the volatility spillover effects among crude oil, metals, agriculture, and non-energy commodity markets. The results show financialization has an impact on the volatility of commodity prices, predominantly for non-energy commodities. However, the impact on volatility is not symmetric across all commodities. The analysis of index investment and investors’ positions in futures markets shows that, when a relationship exists, it is generally negatively correlated with the realized volatility of non-energy commodities. Using realized volatility in the difference-in-difference model provides estimates that are inconsistent with other findings that non-energy commodities, traded as a part of indices, have experienced higher volatility. The results are similar to the index investment and futures market analysis, where increased participation by investors through new investment products has put download pressure on realized volatility.
Keywords:
financialization; realized volatility; commodity markets; non-energy commodities; exchange-traded fund; speculative positionsJEL Classification:
G1; G11; Q021. Introduction
The rapid growth of index investment has greatly increased the ability for investors to access the commodity markets and, hence, expedited the market integration of commodities. The large inflows of investment capital into commodity markets precipitated a process commonly referred as financialization. Traditionally, commodity markets are partially segmented from outside financial markets, and are mostly dominated by specialized investors, who provide insurance to hedgers to earn a risk premium. Financialization enables commodities to become a popular asset class for many institutional investors, who have very different investment incentives from the traditional market participants. A conservative estimate shows that the commodity index traders more than quadrupled between 2000 and 2010 (Adams and Glück 2015).
These new types of commodity index investors may lead to dramatic increase in commodity prices and market volatilities. Policy makers are concerned that the financialization of the commodity market may lead to unnecessary increase in the cost of food and energy (Masters 2008). Acharya et al. (2013) propose a theoretical model to posit that speculators have time-varying risk appetites owing to risk constraints and potential financial distress, therefore, they can transmit external shocks to commodity markets. Tang and Xiong (2012) provide empirical evidence that commodity index traders (CIT) lead to a transmission channel to spill volatility from outside financial markets onto, and across, commodity markets. The correlation between various non-energy commodities and oil increased markedly after 2004, when significant index investment capital began to flow into the commodity futures markets. Our research will investigate the volatility transmission mechanism by analyzing how the total amount of capital invested in the commodity index and the total number of long and short orders impact the volatility of various non-energy commodities.
Previous studies find that commodity prices tend to be more correlated with other equity markets with the increase in CIT trading. Cheng and Xiong (2014) suggest that financialization has substantially changed commodity markets through its impact on risk sharing and information discovery. Büyüksahin et al. (2008) find that correlations across commodity contracts have increased significantly since 2004. Tang and Xiong (2012) provide evidence that commodities in two popular commodity indices, the S&P Goldman Sachs Commodity Index (GSCI) and Dow Jones-UBS Commodity Index (DJ-UBSCI), are significantly more correlated with oil prices than off-index commodities. Ji and Fan (2012) posit that the financialization effect creates a transmission channel, for outside non-commodity asset shocks, to impact commodity markets through investors rebalancing their portfolios of commodity assets. The impacts of common shocks, such as slowing global economic growth or financial crises, on commodity markets, have increased in magnitude because of information spillover effects. Adams and Glück (2015) show that financialization has changed the behavior and dependence structure between commodities and the general stock market. They argue that commodities have become an investment style for institutional investors, and the spillover between commodities and stock market would remain high.
The literature on volatility spillover effects has been focused on explaining the timing and dynamics of an increase in correlation between the commodity markets and equity markets. However, the details on how the trading of commodity index futures impacts the volatility of different commodities is still nascent. This paper fills the gap by comparing whether the proliferation of new index products, such as commodity-tracking exchange-traded funds (ETFs), has different effect on volatilities of energy, metals, and agriculture commodities.
We first use a difference-in-difference (DID) analysis, following Tang and Xiong (2012), to analyze if non-energy commodities included in the S&P GSCI experience increased volatility compared to their off-index peers, for a longer sample period of 1998–2016. We then use two OLS models to analyze how commodity index future trading volume and the change of long and short positions by financial investors impact realized volatility.
Similar to Tang and Xiong (2012), we find that non-energy commodities in S&P GSCI index have experienced higher volatility measured by pooled squared returns. However, when we use realized volatility generated from high frequency data, we find the opposite effect, that indexed commodity investing has put downward pressure on realized volatility. Our OLS analyses show that the impacts on volatility from index trading volume and investors’ positions in future markets are not symmetric across all commodities. When a relationship exists, it is generally negative. These findings suggest that policymakers should be cautious in their mandate to potentially impose limits on investment in commodity index. The findings are also important for investors to manage risk exposures as commodity futures contracts are increasingly integrated into their investment portfolios.
We contribute to the literature by providing the first empirical evidence that index investment trading and investors’ position in future market have different impact on volatilities of various commodities. Index investing is found to be either unrelated or negatively impact the realized volatility of the non-energy commodities. We also compliment Tang and Xiong (2012) by extending the sample period from 1998–2016, which enables us to observe that the increase of volatility effect, found in the original study, does not persist for post-crisis years. In addition, we also use realized volatility as a key dependent variable, and find that the increase of volatility result does not hold for this volatility measure.
2. Methodology
We use three different frameworks to test the relationship between a commodity’s realized volatility and financialization. The first analysis follows the DID approach proposed by Tang and Xiong (2012) to investigate if non-energy commodities, included in the S&P GSCI experience, increased volatility compared to their off-index peers. We analyze volatilities for 23 non-energy commodities traded in the United States, among which, 14 are included in the S&P GSCI and the remaining nine are off-index. Front-month futures price data, from January 1998 to June 2016, are used to generate the variables. The regression is specified as the following:
where the dependent variable Voli,t is measured by either squared standardized daily returns or realized volatility. The standardized daily return is generated using pre-2004 average volatility and the whole sample mean. The realized volatility is generated using high frequency data following Andersen et al. (2001) and Andersen et al. (2003). Iy=t is a set of year dummies for each year after 2004, which equals to one for a specific year, and zero otherwise. Coefficient bt captures trend or baseline changes in volatility for each commodity over time. Iindex is an index dummy for whether a given commodity is in S&P GSCI index, which is equal to one for the 14 commodities that are part of the S&P GSCI index, and zero otherwise. Coefficient ct captures differences in volatility between non-energy commodities included in the S&P GSCI and those off-index.
The second analysis examines the relationship between the financialization of commodities and their realized volatility while controlling for changes in economic fundamentals, such as global demand and supply, and we estimate the following regression:
where the dependent variable Vol is the realized volatility. Overall AUM is a proxy for the level of financialization, and is measured by the amount of capital (assets under management or “AUM”) invested in an index which tracks the commodity. We choose two commodities with the highest weight in the S&P GSCI from each subgroup of energy commodities (crude oil and natural gas), metals (copper and gold), and agricultural commodities (corn and wheat) to estimate equation (2). The monthly survey data from the U.S. Commodity Futures Trading Commission (CFTC) on the amount of capital invested in commodity index investments are used to generate Overall AUM for the six chosen commodities. The control variables used are demand and supply for each commodity, measured by global consumptions and productions, as well as a cointegration term specified as logarithmic difference of the front-month futures prices. Monthly data is chosen because economic control variables are only available at monthly frequency.
Since the Commitment of Traders report is released weekly, the third analysis uses the weekly futures market data for the six chosen commodities to test whether changes in long and short positions by financial investors have impacts on realized volatility as per the following:
where Vol is the realized volatility. Long Positions and Short Positions are the aggregate future positions reported by CFTC’s Traders Report. Since the demand and supply control variables are not available for weekly frequency, we use implied volatility measured by the CBOE VIX index for U.S. dollar, 2-year U.S. Treasury bond yields, and S&P 500, as controls for general economic condition.
3. Data
The price data collected for Equation (1) are front-month futures prices between January 1998 and June 2016 for 23 non-energy commodities traded in the United States, as listed in Table 1. Out of the 28 commodities listed, we excluded four energy commodities following Tang and Xiong (2012), and excluded pork bellies, due to insufficient data. By isolating the analysis to U.S.-traded commodities, one can avoid the impact of exchange rates, transportation and other frictions between the United States and global markets.
The price data are used to generate realized volatility at various frequencies for the commodities analyzed. Realized volatility is calculated using the following equation:
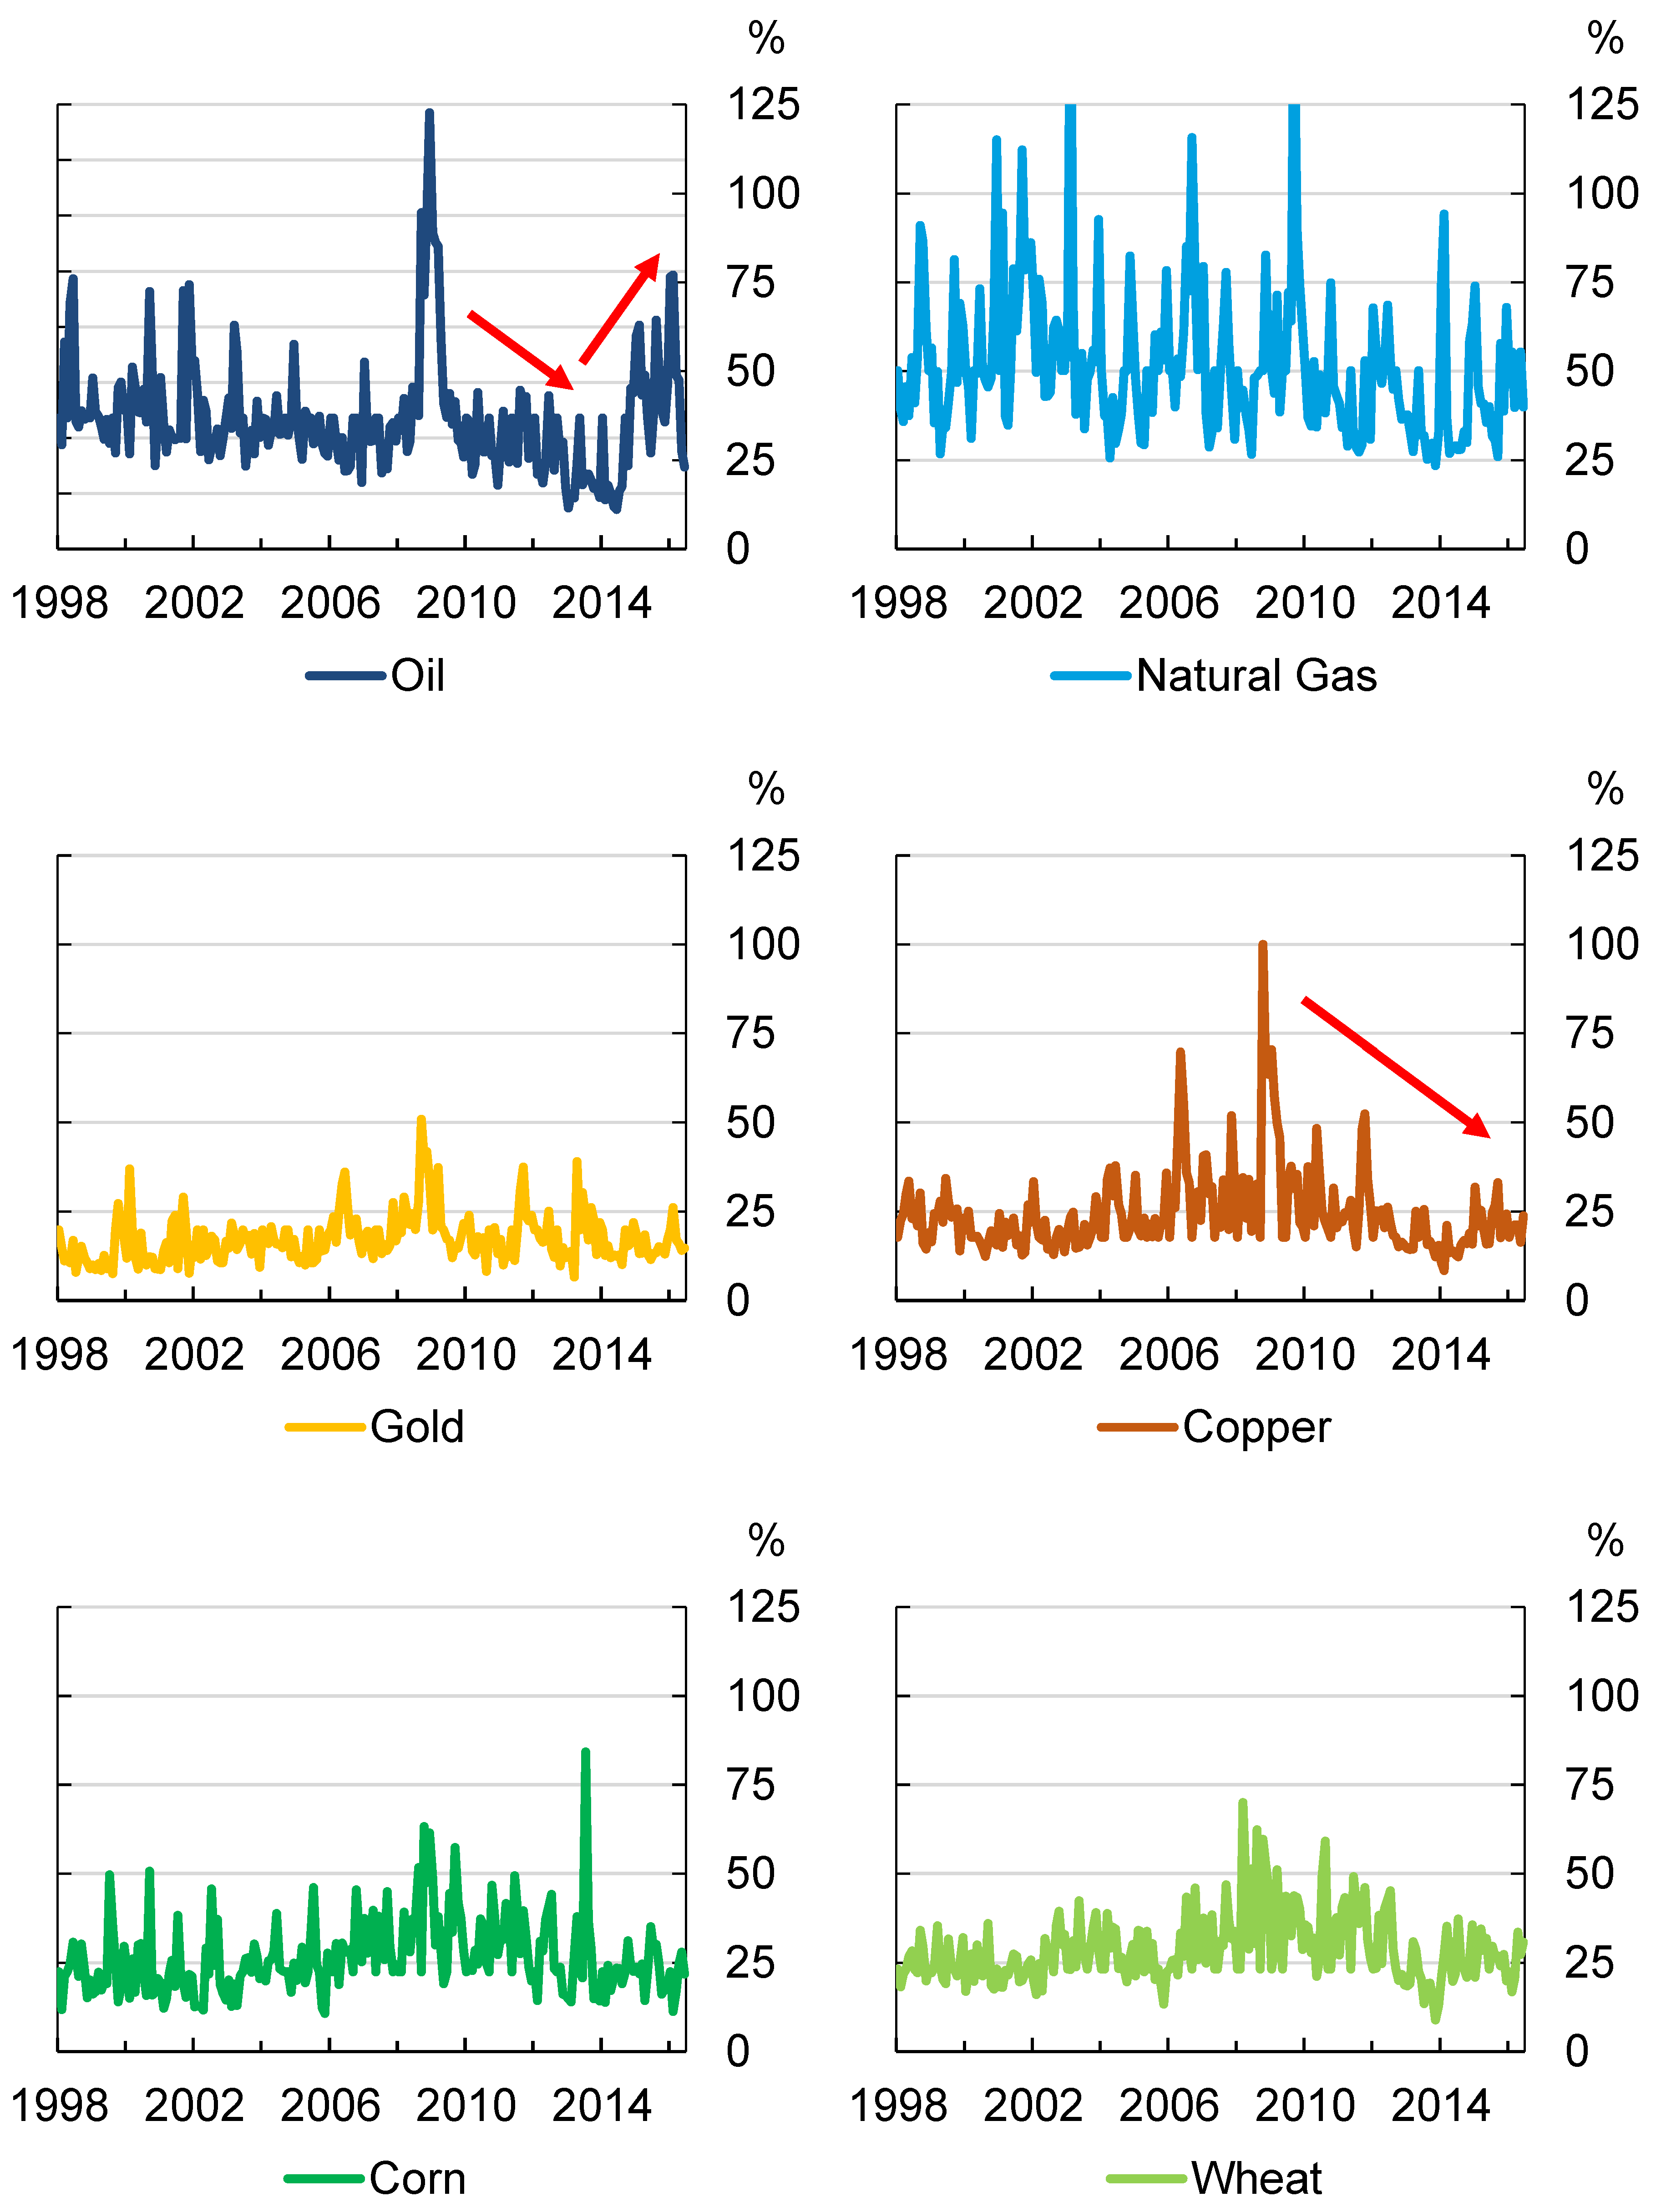
where is the squared daily return and n represents the number of trading days in the week or month. Summary statistics are provided in Table 2. Realized volatilities experience significant variations in the sample period, and this holds true across all commodities. For example, realized volatility of copper varies from as low as 8.43 to as high as 54.27. The maximum level of realized volatilities are at least twice as high as the sample mean for all commodities. Charts depicting the time series for each commodity are included in Figure 1. These commodities experienced lower-than-average volatility during the post-recovery period before increasing again during the large selloff of commodity in conjunction with oil price crash beginning in late 2014.
The financialization measurements Overall AUM in Equation (2) are collected from U.S. CFTC, which keeps track of these data from December 2007 through to October 2015.1 The frequency is quarterly until June 2010, at which point, it increased to monthly. We choose to use the monthly data from June 2010 to October 2015. The control variables supply and demand for each commodity, except gold, are the global consumption and production data collected from U.S. government agencies, such as the Energy Information Administration (EIA), the statistical arm of the Department of Energy (DOE), the U.S. Department of Agriculture (USDA), the Federal Reserve, the World Bureau of Metal Statistics (WBMS), and the Chicago Board Options Exchange (CBOE), correspondingly. For gold, because its price does not respond to changes in fundamentals, such as supply and demand, we treat it as a financial asset and use financial control variables, such as equity, measured by the VIX for supply and U.S. dollar volatility for demand. Summary statistics are reported in Table 3.
For the weekly regression of Equation (3), the trading positions held by financial investors in futures markets are used as proxies for financialization. These data are collected from the CFTC’s Commitment of Traders Report,2 which separate out the various market participants (commercial users, swap dealers, money managers, etc.). The disaggregated reports began in June 2006, and are released at a weekly frequency. Summary statistics of futures positions, from June 2006 to July 2016, are reported in Table 4. Large variation in both long and short positions are clearly shown, with copper trading as low as around 2 million contracts, to as high as over 66 million contracts for long positions.
4. Empirical Results
The difference-in-difference empirical results using squared standardized return as dependent variable are presented in Table 5. Consistent with Tang and Xiong (2012), the baseline effect coefficient b2004 is positive significant, indicating that the baseline volatility in the selected non-energy commodities began increasing in 2004, the onset of financialization. b2008 and b2009 are both positive significant, showing that volatilities increased significantly during the financial crisis. The DID coefficients c2004, c2006, c2007, c2009 to c2012, and c2015, are positive and significant, indicating that non-energy commodities that are traded as a part of the S&P GSCI have experienced larger volatility increases than did off-index commodities.
An alternative DID analysis is tested using realized volatility in lieu of squared standardized daily returns. The results are different from the squared return regression. The DID coefficient estimates c2004 to c2005, c2008 to c2010, and c2012 to c2016 are negative and significant, indicating that the commodities in the S&P GSCI index have lower realized volatility than the off-index commodities for those years. The difference in these results might be caused by the extended sample period; most of the negative coefficients happen during years not covered by the original Tang and Xiong (2012) study. Another reason is that realized volatility is generated using high frequency data, and might capture more details about volatility than the squared standardized returns.
To further investigate why realized volatility results are different from the standard squared return results, we augment regression (1) with interaction terms to control for impacts from various factors, including S&P500 return, core inflation rate, MSCI Emerging Markets equity return, U.S. bond index, and trade-weighted U.S. dollar index. The regression is revised to Equation (5) as the following:
where Xt denotes S&P500 return, core inflation rate, MSCI Emerging Markets equity return, U.S. bond index, and trade-weighted U.S. dollar index. The rest of the variables are similarly defined as in Equation (1). The coefficients dt are reported in Table 6, which capture how these factors impact the DID coefficients for the indexed commodities.
Table 6 shows significant difference in dt between the squared returns and realized volatilities regressions. For example, the coefficients for realized volatilities in 2016 are significant and negative for both S&P500 and MSCI Emerging Market index, but are insignificant for squared return. Similarly, d2013 is negative significant for realized volatility regression in 2013 for core inflation factor, but not significant for the squared return regression. These are likely to be the channel contributing to the negative coefficient of the realized volatility model from Equation (1). As for 2008, squared returns are affected by all factors except for the U.S. dollar index. By contrast, realized volatility is only influenced by core inflation. This is another contributing factor for the differences in 2008. Since realized volatility and squared returns are sensitive to different control factors in different years, the estimated coefficients in the original DID model reflect the influence by these factors.
The results of regression (2) are reported in Table 7 panel A. The coefficient for AUM is negative but insignificant for crude oil, indicating there is no statistical relationship between assets under management tracking crude oil indices and realized volatility for crude oil. Natural gas futures have a negative significant relationship with realized volatilities. These results imply that increased participation by financial market investors dampens volatility in the U.S. natural gas market. The supply and demand control variables are significant for explaining volatility. Similar to natural gas, the financialization effect is significant and negative for copper. The key determinants of volatility in U.S. copper markets are the changes in index investors’ positions and global supply levels. In the gold, corn, and wheat markets, the coefficients for AUM are insignificant. In general, monthly data regression reveals a negative relationship between financialization and realized volatility for natural gas and copper, and an insignificant relationship for other commodities.
The results of weekly futures market analysis using Equation (3) are reported in Table 7 panel B. An increase in investors’ long positions put upward pressure on the volatility of nature gas, while dampening volatilities for copper, gold, and wheat. Changes in short positions of the corresponding future contracts have a positive and significant relationship with oil’s volatility, but negative significant effects on nature gas, corn, and wheat volatilities. This shows that financialization does have a relationship with weekly realized volatilities, but the specific effects varies for different commodities. Most of the significant correlations are negative, with the crude oil and natural gas being the only commodities showing significant positive effect from investor future contract positions.
Comparing differences between monthly results and weekly results in Table 7, we find that the weekly analysis tends to reveal more significant effects. The monthly results from Panel A report two significant effects out of the six commodities, while the weekly analysis reported in Panel B shows significant coefficients for either the long or short positions for all six commodities are significant. More specifically, the monthly results in Panel A show that realized volatilities of wheat and corn are primarily influenced by changes in supply and demand factors—financialization does not have a significant relationship with realized volatilities. However, the weekly analysis shows that changes to both long and short positions in wheat contracts and short positions in corn contract put downward pressure on volatility in the U.S. wheat market.
In summary, both the monthly and weekly futures data suggest a significant relationship between realized volatility and financialization. Most of the coefficients tend to be negative significant, implying that financialization lead to lower realized volatilities.
5. Conclusions
Overall, the results show financialization has an impact on the volatility of commodity prices, predominantly for non-energy commodities. However, the impact on volatility is not symmetric across all commodities or investor types. The analysis of index investment and investors’ positions in futures markets shows that, when a relationship exists, it is generally negatively correlated with the realized volatility of non-energy commodities.
Using realized volatility in Tang and Xiong’s (2012) DID model provides estimates that are inconsistent with the original finding. We find non-energy commodities in commodity index have experienced lower volatility. These different results are similar to the index investment and futures market analysis, where increased participation by speculators through new investment products has put download pressure on realized volatility.
Commodity index investors typically manage well-diversified portfolios across various asset classes, which allows their increased presence in commodity markets to likely lead to improved sharing of price risk. This risk-sharing benefit should drive the risk premia lower in futures prices, allowing for producers (e.g., farmers, miners, etc.) to receive higher futures prices for their raw materials. Both Tang and Xiong (2012), and our paper, arrive at the same policy conclusion that financialization and the increased role of financial market participants in commodity markets leads to net benefit for market participants through risk-sharing.
Proposed financial market regulation, brought on by the fallout of the global financial crisis, has led to proposed position limits to curb the amount of financial investment and speculation in commodity markets (such as in Europe). Policymakers need to be cognizant of imposing constraints that limit capital flows that provide risk-sharing benefits.
Author Contributions
Conceptualization, W.H.C., B.S., and Y.W.W. and N.A.; Methodology, W.H.C., B.S., and Y.W.W.; Software, B.S..; Formal Analysis, W.H.C., B.S., and Y.W.W.; Resources, B.S.; Data Curation, B.S.; Writing-Original Draft Preparation, B.S.; Writing-Review & Editing, W.H.C., B.S., and Y.W.W.
Funding
This research received no external funding.
Conflicts of Interest
The authors declare no conflicts of interest.
References
- Acharya, Viral, Lars Lochstoer, and Tarun Ramadorai. 2013. Limits to Arbitrage and Hedging: Evidence from Commodity Markets. Journal of Financial Economics 109: 441–65. [Google Scholar] [CrossRef]
- Adams, Zeno, and Thorsten Glück. 2015. Financialization in Commodity Markets: A Passing Trend or the New Normal? Journal of Banking & Finance 60: 93–111. [Google Scholar]
- Andersen, Torben, Tim Bollerslev, Francis Diebold, and Heiko Ebens. 2001. The Distribution of Realized Stock Return Volatility. Journal of Financial Economics 61: 43–76. [Google Scholar] [CrossRef]
- Andersen, Torben, Tim Bollerslev, Francis Diebold, and Paul Labys. 2003. Modeling and Forecasting Realized Volatility. Econometrica 71: 579–625. [Google Scholar] [CrossRef] [Green Version]
- Büyüksahin, Bahattin, Michael Haigh, Jeffrey Harris, James Overdahl, and Michel Robe. 2009. Fundamentals, Trading Activity and Derivative Pricing. Paper presented at European Finance Association Meeting, Bergen, Norway, August 21, 2009. [Google Scholar]
- Cheng, Ing-Haw, and Wei Xiong. 2014. The Financialization of Commodity Markets. Annual Review of Financial Economics 6: 419–41. [Google Scholar] [CrossRef]
- Ji, Ying, and Qiang Fan. 2012. How Does Oil Price Volatility Affect Non-Energy Commodities? Applied Energy 89: 273–80. [Google Scholar] [CrossRef]
- Masters, Michael. 2008. Testimony before the Committee on Homeland Security and Government Affairs. Washington, DC: U.S. Senate. [Google Scholar]
- Tang, Ke, and Wei Xiong. 2012. Index Investment and the Financialization of Commodities. Financial Analysts Journal 68: 54–74. [Google Scholar] [CrossRef] [Green Version]
| 1 | The dataset can be accessed at http://www.cftc.gov/marketreports/indexinvestmentdata/index.htm. |
| 2 | The report can be accessed at http://www.cftc.gov/Marketreports/CommitmentsofTraders/index.htm. |
Figure 1.
Realized Volatility for Select Commodities.

Table 1.
Commodity Futures Traded in the United States and Weights in the S&P GSCI.
| Commodity | Weighting (%) 1 | Exchange |
|---|---|---|
| Energy | ||
| WTI crude oil | 23.0 | NYMEX |
| Diesel No. 2 (ULSD) | 5.2 | NYMEX |
| RBOB gasoline | 5.3 | NYMEX |
| Natural gas | 3.2 | NYMEX |
| Grains | ||
| Corn | 4.2 | CME Group |
| Soybeans | 3.0 | CME Group |
| Chicago wheat | 3.5 | CME Group |
| Kansas wheat | 0.9 | KCBT |
| Soybean oil | 0.0 | CME Group |
| Minneapolis wheat | 0.0 | MGE |
| Soybean meal | 0.0 | CME Group |
| Rough rice | 0.0 | CME Group |
| Oats | 0.0 | CME Group |
| Softs | ||
| Coffee | 0.9 | ICE |
| Cotton | 1.2 | ICE |
| Sugar | 1.6 | ICE |
| Cocoa | 0.5 | ICE |
| Lumber | 0.0 | CME Group |
| Orange juice | 0.0 | ICE |
| Livestock | ||
| Feeder cattle | 1.6 | CME Group |
| Lean hogs | 2.3 | CME Group |
| Live cattle | 4.8 | CME Group |
| Pork bellies | 0.0 | CME Group |
| Metals | ||
| Gold | 3.3 | NYMEX |
| Silver | 0.4 | NYMEX |
| Copper | 3.9 | NYMEX |
| Platinum | 0.0 | NYMEX |
| Palladium | 0.0 | NYMEX |
1 The weights do not sum to 100, due to the exclusion of non-U.S.-traded commodities, such as Brent crude oil and Low Sulphur Gasoil.
Table 2.
Summary Statistics—Realized Volatility.
| Copper | Corn | Gold | Natural Gas | Oil | Wheat | |
|---|---|---|---|---|---|---|
| Mean | 24.48 | 26.36 | 17.35 | 51.40 | 36.71 | 28.62 |
| Median | 21.61 | 23.38 | 16.51 | 49.96 | 34.99 | 26.51 |
| Maximum | 54.27 | 84.20 | 50.96 | 169.30 | 122.68 | 69.98 |
| Minimum | 8.43 | 10.70 | 6.58 | 23.44 | 11.11 | 8.87 |
| Std. Dev. | 11.57 | 10.50 | 6.81 | 20.63 | 15.97 | 9.43 |
Note: Sample period runs from January 1998 to June 2016 (222 observations).
Table 3.
Summary Statistics—Economic Control Variables.
| Copper 1 | Corn 2 | Gold 5 | Natural Gas 3 | Oil 4 | Wheat 2 | |
|---|---|---|---|---|---|---|
| A. Supply | ||||||
| Mean | 1756.02 | 325.01 | 18.43 | 66.73 | 91.31 | 57.85 |
| Median | 1726.60 | 317.98 | 16.95 | 66.12 | 90.81 | 57.96 |
| Maximum | 2048.74 | 367.68 | 42.96 | 75.24 | 96.70 | 61.76 |
| Minimum | 1523.32 | 271.94 | 11.40 | 57.22 | 87.20 | 52.85 |
| Std. Dev. | 124.08 | 31.27 | 5.96 | 4.75 | 2.58 | 2.70 |
| B. Demand | ||||||
| Mean | 1751.86 | 286.10 | 6.37 | 70.24 | 91.15 | 33.69 |
| Median | 1717.34 | 291.61 | 6.23 | 64.80 | 91.02 | 33.14 |
| Maximum | 2045.52 | 302.78 | 11.91 | 105.42 | 95.19 | 38.11 |
| Minimum | 1495.31 | 254.01 | 2.46 | 53.71 | 87.22 | 29.42 |
| Std. Dev. | 129.57 | 14.57 | 2.15 | 14.06 | 1.94 | 1.91 |
Note: Sample period runs from June 2010 to October 2015 (65 observations); 1 Global supply and demand in thousands of tones from the World Bureau of Metals Statistics (WBMS); 2 U.S. supply and demand in millions of bushels from the U.S. Department of Agriculture (USDA); 3 U.S. supply and demand in billions of cubic feet (bcf) from the Energy Information Administration (EIA); 4 Global supply and demand in millions of barrels per day (mb/d) from the EIA; 5 Gold is treated as a financial asset in the monthly OLS specification on the assumption its price does not respond to changes in fundamentals such as supply and demand. Instead, the model is specified with financial control variables, such as equity, measured by the VIX for supply and U.S. dollar volatility for demand.
Table 4.
Summary Statistics—Money Managers Futures Positions (‘000 contracts).
| Copper | Corn | Gold | Natural Gas | Oil | Wheat | |
|---|---|---|---|---|---|---|
| A. Long Positions | ||||||
| Mean | 27,193 | 243,077 | 147,416 | 168,748 | 223,099 | 72,463 |
| Median | 29,244 | 233,962 | 139,354 | 152,175 | 222,458 | 70,001 |
| Maximum | 66,450 | 441,653 | 315,643 | 344,030 | 378,701 | 134,151 |
| Minimum | 2262 | 87,793 | 56,144 | 41,799 | 101,855 | 42,163 |
| Std. Dev. | 13,518 | 72,487 | 47,665 | 69,344 | 67,279 | 17,350 |
| B. Short Positions | ||||||
| Mean | 25,574 | 108,101 | 28,946 | 223,013 | 67,118 | 79,282 |
| Median | 21,091 | 75,023 | 20,990 | 227,268 | 62,504 | 69,258 |
| Maximum | 78,551 | 385,274 | 121,238 | 415,112 | 200,975 | 173,831 |
| Minimum | 4742 | 3699 | 821 | 47,811 | 12,768 | 26,202 |
| Std. Dev. | 13,996 | 94,006 | 26,227 | 83,056 | 33,881 | 36,004 |
Note: Sample period runs from 13 June 2006 to 19 July 2016 (528 observations).
Table 5.
Difference-In-Difference Analysis of Non-Energy Commodities.
| Squared Returns | Realized Volatility | |||
|---|---|---|---|---|
| Estimate | t-Stat. | Estimate | t-Stat. | |
| A. Baseline Effects | ||||
| b2004 | 0.30 | 3.34 | 0.25 | 19.4 |
| b2005 | −0.12 | −1.97 | 0.05 | 3.46 |
| b2006 | −0.18 | −3.31 | 0.06 | 4.95 |
| b2007 | −0.19 | −3.47 | −0.02 | −1.30 |
| b2008 | 1.69 | 6.81 | 0.54 | 39.26 |
| b2009 | 0.58 | 5.39 | 0.36 | 28.23 |
| b2010 | 0.78 | 1.15 | 0.20 | 15.72 |
| b2011 | 0.01 | 0.22 | 0.17 | 13.63 |
| b2012 | −0.17 | −3.46 | 0.08 | 6.63 |
| b2013 | −0.24 | −3.00 | −0.03 | −2.51 |
| b2014 | −0.02 | −0.20 | −0.09 | −6.49 |
| b2015 | −0.15 | −3.58 | 0.11 | 9.78 |
| b2016 | −0.17 | −3.09 | 0.14 | 7.95 |
| B. Difference-In-Difference Effects | ||||
| c2004 | 0.22 | 2.02 | −0.09 | −6.08 |
| c2005 | 0.07 | 1.03 | −0.11 | −6.81 |
| c2006 | 0.61 | 6.78 | 0.02 | 1.65 |
| c2007 | 0.33 | 4.81 | 0.02 | 1.01 |
| c2008 | 0.14 | 0.53 | −0.14 | −9.35 |
| c2009 | 0.27 | 2.05 | −0.11 | −6.70 |
| c2010 | 0.21 | 2.84 | −0.14 | −8.67 |
| c2011 | 0.68 | 6.96 | 0.00 | 0.16 |
| c2012 | 0.23 | 3.96 | −0.10 | −5.96 |
| c2013 | 0.23 | 1.71 | −0.20 | −12.58 |
| c2014 | −0.14 | −1.16 | −0.05 | −3.40 |
| c2015 | 0.18 | 3.35 | −0.13 | −9.11 |
| c2016 | 0.12 | 1.72 | −0.19 | −8.70 |
Notes: The t-statistics are adjusted for heteroscedasticity and serial correlation by using the Newey–West method with five lags.
Table 6.
Estimated coefficients of the difference-in-difference (DID) model with different factors.
| Squared Return | Realized Volatility | |||||||||
|---|---|---|---|---|---|---|---|---|---|---|
| VARIABLES | S&P500 | Inflation | MSCI_EM | Bond Index | U.S.$ Index | S&P500 | Inflation | MSCI_EM | Bond Index | U.S.$ Index |
| d2004 | −0.133 | −1.684 | −0.215 ** | −0.059 | 0.333 | 0.016 | −0.167 | −0.009 | 0.009 | 0.016 |
| (0.124) | (1.027) | (0.091) | (0.151) | (0.291) | (0.015) | (0.156) | (0.011) | (0.022) | (0.029) | |
| d2005 | 0.037 | −0.079 | −0.013 | −0.278 ** | 0.285 | 0.002 | 0.177 | −0.015 | −0.069 ** | 0.016 |
| (0.083) | (0.397) | (0.078) | (0.134) | (0.233) | (0.018) | (0.123) | (0.016) | (0.033) | (0.044) | |
| d2006 | −0.121 | 2.686 ** | −0.219 | 0.229 | 0.635 | 0.000 | 0.138 | −0.006 | 0.048 | −0.018 |
| (0.169) | (1.086) | (0.170) | (0.252) | (0.508) | (0.016) | (0.162) | (0.010) | (0.035) | (0.044) | |
| d2007 | −0.050 | 1.025 | −0.135 * | 0.161 | 0.560 | 0.005 | 0.021 | −0.005 | 0.011 | 0.008 |
| (0.044) | (1.118) | (0.078) | (0.171) | (0.366) | (0.011) | (0.237) | (0.009) | (0.029) | (0.061) | |
| d2008 | −0.199 ** | −8.524 *** | −0.170 * | 0.492 ** | 0.289 | −0.005 | −1.299 *** | −0.005 | 0.015 | 0.037 |
| (0.083) | (1.487) | (0.087) | (0.228) | (0.561) | (0.005) | (0.135) | (0.006) | (0.020) | (0.030) | |
| d2009 | −0.094 | 4.403 *** | −0.056 | 0.082 | −0.577 | −0.005 | 0.945 *** | −0.009 | −0.018 | 0.016 |
| (0.059) | (1.318) | (0.079) | (0.140) | (0.536) | (0.006) | (0.183) | (0.007) | (0.016) | (0.028) | |
| d2010 | −0.069 | 2.466 ** | −0.153 ** | 0.075 | 0.278 | 0.005 | 0.503 ** | −0.009 | −0.021 | 0.014 |
| (0.061) | (1.130) | (0.062) | (0.144) | (0.227) | (0.011) | (0.206) | (0.010) | (0.024) | (0.038) | |
| d2011 | −0.136 ** | −3.797 * | −0.287 ** | 0.111 | 0.365 | −0.006 | −0.757 *** | −0.017 * | 0.003 | 0.031 |
| (0.066) | (2.230) | (0.115) | (0.237) | (0.424) | (0.008) | (0.227) | (0.009) | (0.022) | (0.032) | |
| d2012 | −0.098 | 2.635 ** | −0.020 | −0.082 | −0.186 | 0.009 | 1.537 *** | 0.001 | 0.001 | 0.002 |
| (0.080) | (1.341) | (0.073) | (0.143) | (0.249) | (0.016) | (0.287) | (0.014) | (0.030) | (0.048) | |
| d2013 | −0.384 | −2.653 | −0.072 | −0.142 | 0.301 | −0.027 | −0.725 *** | −0.013 | −0.004 | 0.003 |
| (0.249) | (2.679) | (0.190) | (0.360) | (0.637) | (0.017) | (0.201) | (0.014) | (0.029) | (0.052) | |
| d2014 | −0.125 *** | −0.507 | −0.172 ** | 0.352 ** | −0.192 | 0.005 | 0.471 * | −0.013 | −0.050 | 0.077 |
| (0.045) | (0.920) | (0.070) | (0.148) | (0.215) | (0.016) | (0.243) | (0.016) | (0.037) | (0.062) | |
| d2015 | 0.053 | −0.929 | 0.015 | −0.102 | 0.025 | −0.007 | −0.140 | −0.007 | −0.005 | 0.003 |
| (0.043) | (0.867) | (0.049) | (0.085) | (0.146) | (0.009) | (0.195) | (0.009) | (0.021) | (0.031) | |
| d2016 | −0.114 | 1.484 | −0.091 | 0.347 ** | −0.211 | −0.025 * | 1.667 *** | −0.025 ** | 0.021 | 0.049 |
| (0.070) | (1.505) | (0.058) | (0.174) | (0.202) | (0.014) | (0.376) | (0.011) | (0.042) | (0.037) | |
Note: Standard errors in parentheses (*** p < 0.01, ** p < 0.05, * p < 0.1). The coefficients are estimated from the DID model with different factors including S&P500 return, core inflation rate, MSCI Emerging market equity return, U.S. bond index, and trade weighted US dollar index.
Table 7.
Analysis of Financialization Impact on Volatility.
| A. Index Investment (Monthly Data) | ||||||
|---|---|---|---|---|---|---|
| Constant | Index AUM 1 | Supply | Demand | Cointegration Term 2 | ||
| Crude oil | 4.72 | −0.45 | −0.31 | 0.46 | −7.17 ** | |
| (0.45) | (−1.23) | (−0.10) | (0.14) | (−8.26) | ||
| Natural gas | 5.72 | −0.71 * | −1.63 ** | 0.67 ** | 0.35 | |
| (0.84) | (−2.62) | (−2.92) | (3.15) | (1.06) | ||
| Copper | 48.72 ** | −0.84 * | −2.05 * | −0.84 | −7.88 | |
| (4.43) | (−2.64) | (−2.51) | (−1.09) | (−1.90) | ||
| Gold | 3.40 ** | −0.18 | 0.12 | 0.33 ** | −0.39 ** | |
| (4.01) | (−1.15) | (0.76) | (4.00) | (−3.82) | ||
| Corn | −35.63 * | 0.18 | −5.90 ** | 8.98 ** | −0.89 | |
| (−2.56) | (0.47) | (−3.01) | (3.45) | (−1.10) | ||
| Wheat | 9.85 | −0.07 | 3.73 ** | −4.53 ** | −1.61 | |
| (1.03) | (−0.31) | (4.44) | (−5.29) | (−1.68) | ||
| B. Speculation in Futures Markets (Weekly Data) | ||||||
| Constant | Long Positions | Short Positions | US$ Volatility | Bond Volatility | Equity Volatility | |
| Crude oil | −4.17 | 0.07 | 0.41 ** | 0.28 ** | 0.06 ** | 0.51 ** |
| (−3.50) | (0.84) | (9.89) | (6.16) | (2.28) | (7.49) | |
| Natural gas | 3.84 ** | 0.28 ** | −0.40 ** | 0.14 ** | 0.10 ** | 0.28 ** |
| (3.32) | (3.25) | (−6.08) | (3.45) | (2.64) | (4.02) | |
| Copper | 4.30 ** | −0.27 ** | −0.03 | 0.21 ** | 0.05 | 0.46 ** |
| (6.32) | (−7.29) | (−0.87) | (5.87) | (1.83) | (8.17) | |
| Gold | 2.80 * | −0.21 ** | 0.05 | 0.24 ** | 0.05 * | 0.46 ** |
| (2.48) | (−2.93) | (1.83) | (5.74) | (2.33) | (7.41) | |
| Corn | 6.28 ** | −0.17 | −0.15 ** | 0.07 | 0.05 * | 0.17 * |
| (4.13) | (−1.83) | (−5.42) | (1.29) | (2.00) | (2.07) | |
| Wheat | 12.08 ** | −0.32 ** | −0.49 ** | 0.10* | −0.03 | 0.07 |
| (7.46) | (−3.26) | (−8.73) | (2.40) | (−1.39) | (1.11) | |
Note: The number in parentheses represents the estimate’s robust t-statistic; * significant at the 5% level; ** significant at the 1% level; 1 Represents total assets under management (AUM) tracking commodity indices in the United States using Commodity Futures Trading Commission (CFTC) Index Investment data; 2 Cointegration term is specified as logarithmic difference of the front-month futures prices in the model.
© 2018 by the authors. Licensee MDPI, Basel, Switzerland. This article is an open access article distributed under the terms and conditions of the Creative Commons Attribution (CC BY) license (http://creativecommons.org/licenses/by/4.0/).
Share and Cite
MDPI and ACS Style
Chan, W.H.; Shelton, B.; Wu, Y.W. Volatility Spillovers Arising from the Financialization of Commodities. J. Risk Financial Manag. 2018, 11, 72. https://doi.org/10.3390/jrfm11040072
AMA Style
Chan WH, Shelton B, Wu YW. Volatility Spillovers Arising from the Financialization of Commodities. Journal of Risk and Financial Management. 2018; 11(4):72. https://doi.org/10.3390/jrfm11040072
Chicago/Turabian StyleChan, Wing Hong, Bryce Shelton, and Yan Wendy Wu. 2018. "Volatility Spillovers Arising from the Financialization of Commodities" Journal of Risk and Financial Management 11, no. 4: 72. https://doi.org/10.3390/jrfm11040072