Customer Preferences and Implicit Tradeoffs in Accident Scenarios for Self-Driving Vehicle Algorithms

1
Zurich University of Applied Sciences, Center for Risk & Insurance, 8401 Winterthur, Switzerland
2
Ernst & Young AG, 8010 Zurich, Switzerland
*
Author to whom correspondence should be addressed.
J. Risk Financial Manag. 2018, 11(2), 28; https://doi.org/10.3390/jrfm11020028
Submission received: 18 April 2018
/
Revised: 30 May 2018
/
Accepted: 30 May 2018
/
Published: 4 June 2018
Abstract
:The development of self-driving vehicles is proceeding rapidly and with significant investment of resources. However, a full-scale deployment is not imminent. Among the challenges self-driving vehicles are facing, they will have to navigate complex ethical challenges. The algorithms governing their behavior will have to decide how to steer them in situations where accidents cannot be avoided. In some of these situations they will have to decide which of several potential parties to injure in the process. We investigate the preferences of Swiss customers for this decision by forcing a selection between simplified scenarios where a given number of car passengers or a given number of pedestrians will be killed in the accident. Both passengers and pedestrians can be adults or children. The passengers are explicitly identified as the respondent themselves and their family. While children are implicitly valued higher than adults, Swiss customers value passengers and pedestrians implicitly roughly equally, and assign increasingly higher marginal values to additional people, both passengers and pedestrians. These results seem to partially contradict similar studies conducted in other countries and recent statements by automotive companies, potentially indicating the need to adapt both corporate communications and steering algorithms in different geographies.
1. Introduction
Self-driving, or autonomous, vehicles seem poised to revolutionize transport. The benefits that can be gained from their introduction are projected to be significant: in the United States alone, benefits could reach 8% of GDP, or some $1.3 trillion. This in turn would imply global savings of $5.6 trillion per year. These benefits would range from a drastic reduction in accidents and related fatalities to better usage of scarce road and parking resources, to a reduction in the disutility of driving. Ultimately, self-driving cars can be a—if not the—key component of a safer, more efficient and more equitable transportation system (Thomopolous and Givoni 2015).
Because of the complexity of the existing transportation system and of the transition necessary from the current to the future, driverless system, it is not yet fully clear how the benefits will ultimately accrue and whether unexpected interdependencies and changes in behavior and planning might impact them. Milakis et al. (2017) review current literature using a ripple effect framework to analyze the impact of self-driving vehicles and indicate directions for future research. As first order implications, a 40% threshold penetration rate of driverless vehicles is projected to generate at least a 10% increase in road capacity, followed by a likely increase in travel demand between 3% and 27%. Second order implications are likely to be a change in vehicle ownership towards sharing models as well as shifts in land usage. Finally, third order effects on safety and public health benefits remain uncertain. Emission rates are projected to decrease with the introduction of autonomous vehicles. However, changes in behavior and increased mobility to underserved constituencies such the youth, the disabled and the elderly will counteract this trend, so that the net effect is uncertain. Similarly, self-driving vehicles are projected to improve traffic safety. However, during the transition period, cohabitation with human drivers will require adaptation from both parties, while in the long-term, overreliance on technology and potential cyberattacks might erode these benefits significantly. Metz (2018) also addresses the impact of autonomous vehicles, primarily on congestion, noting, however, that “there is a need to allocate responsibilities in the event of an accident,” and that this would require a policy response.
Parkin et al. (2018) review the literature to develop a set of research questions focusing on the interactions of autonomous vehicles with other vehicles, cycles, and pedestrians as well as general themes. They anchor their observations on the social aspects of interactions in the street environment from rules to non-verbal communication and aggressive behavior. They find that autonomous vehicles may be exposed to unsafe situations over which they have little control and therefore need to be equipped with the necessary technology and decision systems to confront potentially hazardous situations.
The development of autonomous vehicles is progressing rapidly, with several companies testing technology in several locations. Nikitas et al. (2017), however, note that “a full-scale launch of connected and autonomous vehicles is not imminent; it is likely to happen later than most expect.” and identify ten obstacles standing in the way of full-scale introduction. These obstacles range from vehicle technology and road infrastructure to user acceptance, especially in the case of recovery from system failure, to changes in business models. In this set of ten obstacles, they specifically identify vehicle behavior and decisions also in cases where real ethical questions remain open regarding decisions among two evils, e.g., running over pedestrians or sacrificing the vehicle occupants.
This paper focuses on this last obstacle to the introduction of autonomous vehicles by addressing customer preferences for decisions by self-driving vehicles regarding the sacrifice of pedestrians vs. vehicle occupants through a forced-choice survey of Swiss drivers.
1.1. Fatal Accident Tradeoffs
Decisions involving trading off injury or death among parties are philosophically difficult. Hayenhjelm and Wolff (2012) surveyed risk literature and concluded that neither consequentialism nor deontology provide guidance on how to specifically behave when entering risky activities in pursuit of some good. Consequentialism becomes problematic with increasing uncertainty of outcomes, while deontology fails to negotiate acceptable risks to individuals. In practice, however, public policy decisions have a long tradition of trading off financial investments with risk of injury or fatality, usually expressed as the value of a statistical life (VSL), in order to prioritize decisions. Viscusi and Aldy (2003), for example, review studies on the mortality risk premiums across 10 countries and conclude that different countries utilize different VSLs to make public policy decisions, most likely due to different levels of income in the country. In addition, they find that the magnitude of VSL decreases with age. Individuals also exhibit different preferences for risk. Hersch and Viscusi (1990) link risk behavior, in this case smoking or wearing seatbelts, to a person’s preference for risky or less risky work, as well as to the compensation they will be awarded for the risk taken. Therefore, while risk may be unavoidable, the level of risk is a personal choice.
Self-driving cars pose an interesting practical problem to be addressed in the risk management community: while their introduction is expected to bring an unprecedented level of safety to road traffic (for example, LaFrance 2015), there will be situations where accidents are not avoidable and the driving algorithm will need to make risk tradeoff decisions among potentially injured parties (for example, Lubin 2016). Goodall (2014) proposes a three-phased incremental approach to teaching ethics to self-driving algorithms, where in the first phase he introduces a rational system that minimizes global damage, potentially using value-of-life estimates.
Further, Goodall (2016) analyzes the legal framework for driving algorithms. “While a common response to morally ambiguous situations is to follow the law … (this) assumes that the law covers more than it does.” Drivers make specific decisions to break the law and may wish their self-driving cars to do likewise, e.g., speeding in order to at a hospital sooner. Gerdes and Thornton (2015) argue that we should not encode laws into cars as hard constraints. Indeed, Google has already acknowledged that their self-driving cars exceed the speed limit to keep up with traffic when going at a lower speed would be dangerous. Driving algorithms may need to optimize the risk profile in several driving scenarios, for example, when in the middle lane moving closer to a smaller car in the left lane than to a large truck in the right lane, or deciding how much buffer to leave for pedestrians. In each case, the redistribution of risk may be problematic, for example, posing a larger risk to the smaller car, or assigning less buffer to pedestrians in low-income neighborhoods. He concludes that the ethics of road-vehicle automation is a solvable problem, as comparable problems, for example, in donated organ distribution, have been solved. A solution does not need to be perfect, but it should be thoughtful and defensible.
Finding the right solution is especially important for the automotive companies. For example, Li et al. (2016) find that people do not treat automated vehicles as independent moral agents, so the responsibility lies with vehicle manufacturers and governments. They also find that human drivers have less obligations to decide according to moral norms compared to researchers and manufacturers because of the difference between acting in a split-second emergency as opposed to a deliberate programming decision.
Part of the debate has focused on tort liability laws. Hevelke and Nida-Rümelin (2015) focus on three core questions. First, tort liability should be designed so that car manufacturers are supported in the development and improvement of self-driving cars. Second, making the car manufacturers responsible would be the most obvious solution as the final product is coming from them. However, this liability burden may hinder further development, while protecting the car manufacturers to the fullest would provide disincentives to invest in safety measures and technology improvements. Third, should the owners be held partially or fully liable? This might make sense even if the user is not in the car, as more cars on the road increase the risks to all. Ultimately, they find that it might make sense to share the liability between the users and the manufacturers. Fleetwood (2017) analyzes the relationship between autonomous vehicles, ethics and public health. One aspect is finding a balance between giving private manufacturers enough freedom to innovate, while at the same time considering the responsibility regarding the protection of public health. The usage of forced-choice algorithms, in particular, raises different public health concerns. She advocates a transparent, collaborative, and inclusive decision process about the development and introduction of self-driving vehicles to develop, implement, and monitor adequate and rationally justifiable regulations.
1.2. Decisions by Self-Driving Vehicles
These approaches, while significant, do not yet address the core question of how self-driving vehicles should behave in case of an accident. Nyholm and Smids (2016) refute the structuring of this decision as a trolley problem. An important difference is in the timing of the decision-making. The trolley problem is usually formulated to force a decision at the time of the accident. Decisions for how self-driving cars should act or react are made much earlier, at the time of programming the software and are therefore much more deliberate. Another difference is that moral and especially legal responsibility is critical for the introduction of self-driving cars but are not considered in the trolley problem. Users or buyers of self-driving cars need to know and understand their responsibility and potential liability. Lastly, the outcome of the trolley decision is clear. This is not the case for autonomous cars as decisions are steeped in uncertainty. Estimations ranging from weather conditions and other environmental factors to the behavior of pedestrians, passengers, and animals are necessary to encode a decision.
Wintersberger et al. (2017) investigate driver preferences in the situations where accidents cannot be avoided in a simplified driver/pedestrian injury scenario. They find drivers in their pool of 40 subjects, mostly European students, will want their vehicles to make utilitarian choices, i.e., produce the highest societal utility, even when they themselves are facing certain death as an alternative. Their decisions are significantly dependent on the group size and type/age of pedestrians involved in the accident. In addition, they investigate how ethical attitudes impact the decision and influence the applicability to self-driving algorithms. They find a high degree of variance, with some drivers preferring their vehicles to act libertarian, i.e., save the driver, even as they acknowledge their decision is unjust and morally wrong.
Bonnefon et al. (2016) set up “The Moral Machine”, an online experiment focused on drivers in the United States to investigate the different potential decisions when facing an accident decision involving self-sacrifice. The majority of participants in the experiment chose to minimize the number of casualties—i.e., they decided according to utilitarian morality. However, respondents also indicated they would not purchase a vehicle that decides in this manner and potentially put themselves and their family at risk. This social dilemma could well have an impact on the go-to-market decisions of autonomous vehicles as drivers would simply not use the technology or insist driving algorithms behave in specific ways, and points to the need for additional research.
Noothigattu et al. (2017) developed a general approach to automating ethical decisions based on machine learning and computational social choice by using the data collected by “The Moral Machine.” They collect voting by humans on the alternatives and run them through a machine-learning system to model these preferences, then they aggregate these models into an aggregate model and apply this societal preference to single events. The results are encouraging, reaching an adequacy above 98%, meaning the tool can reach the same decision a person would prefer.
Automotive companies, interestingly, do not typically clearly state a preference for saving passenger or others, nor do they articulate how they will make that choice. Rather, they have focused on avoiding dangerous situations altogether, and emphasize that autonomous vehicles will severely reduce the estimated 80–95% of all traffic accidents caused by human error. However, the recent statements by Christian von Hugo of Mercedes Benz on how their cars will always prioritize the safety of the driver and passengers over others (Li and Cheer 2016), and the ensuing outrage and subsequent retraction, show how important and fraught this debate is for the future of autonomous vehicles.
2. Materials and Methods
To test our hypotheses, we set up an online forced-choice experiment based on “The Moral Machine.” We will use the same framework as Bonnefon et al. (2016) for our analysis, and are especially grateful to Prof. Rahwan for allowing us to use his group’s material and accident description for our investigation. The experiment, a survey, was created with a logical set-up based on three different types of questions asked to participants.
First, we asked participants to define which criteria should be used by autonomous vehicles when acting in a dangerous traffic situation, defined as one where people will inevitably be killed. Participants could select multiple criteria from a list including: (i) number of lives lost, (ii) the age, (iii) sacrificing car passengers, (iv) sacrificing pedestrians, and (v) illegal behavior in traffic (e.g., pedestrians crossing the road in spite of a red light). Second, we ask for demographic information on age, gender, and nationality.
The core of the survey is 16 forced-choice scenarios where the participants had to choose one of two options: (i) sacrifice themselves and their family members or (ii) kill the pedestrians. The actual graphic representation used is displayed in Figure 1.
Every one of the 16 scenarios forces a choice among different numbers of adults and children both as passengers and as pedestrians, as shown in Table 1.
Along the horizontal we see the pedestrians involved in each scenario; along the vertical the corresponding number of passengers in the vehicle. The letter “A” denotes adults, the letter “C” children. The number indicates the actual number of adults and/or children involved in the scenario. Each scenario forces a decision between killing all passengers involved or all pedestrians involved. The respondent is clearly identified as the driver/owner of the vehicle and the passengers are explicitly identified as the respondent’s family, whereas the pedestrians are not identified. Note that for each scenario there is one adult passenger; this is the driver of the vehicle and is identified as the respondent. We limit the scenarios to tradeoffs among passengers and pedestrians for clarity. Further, we limit the scenarios to tradeoffs among approximately the same number of people since we believe the critical decisions will occur at or near parity. Scenarios with large differences in the size of the injured parties will lead to clear and consistent decisions among respondents. We also limit the number of forced-choice scenarios to accommodate the time constraints for an acceptable survey.
In total, 107 participants took part in the survey, typically Swiss citizens (>80%) between 25 and 34 years of age (>75%). The respondents included a higher number of men (>60%) and were predominantly without children (approx. 80%). Participants were recruited among university master’s students and employees in a professional services firm. The survey ran over a five-week period in 2017. The relatively small size of this sample will present challenges in the generalization of the results. The consistency of the responses allows nonetheless interesting and useful insights into this problem.
2.1. Hypotheses
Given the country-specific differences in risk tradeoffs, we investigate the Swiss preferences for accident scenarios in self-driving vehicles. In particular, we investigate the preference for self-sacrifice in deadly accidents scenarios with autonomous vehicles under the consideration of number and age of people involved.
Based on the current literature we formulate three hypotheses to test with our research:
Hypothesis 1.
Customers will prefer self-driving vehicles to sacrifice pedestrians rather than themselves and their families/passengers. That is, the value assigned to the life of a passenger will be higher than the life of a pedestrian.
Hypothesis 2.
Customers will opt to sacrifice the lives adults before sacrificing the lives of children, regardless of the situation. That is, the value assigned to the life of a child will be higher than the value assigned to the life of an adult in any decision.
Hypothesis 3.
Customers will opt to sacrifice fewer lives before sacrificing more lives. However, the marginal value of each additional life will decrease. That is, the value assigned of the first life saved will be higher than the marginal value assigned to the second life saved, which in turn will be higher than the marginal value assigned to the third life saved, and so on.
Thus, we expect customers to favor passengers, especially children, over pedestrians, especially adult ones. At the same time, we expect a larger number of lives lost to be valued higher than a smaller number of lives lost. We will investigate how these two hypotheses interact when respondents are forced to trade off fewer passengers with more pedestrians, with children included in the decision
2.2. Calculations
We follow a 4-step process to calculate the implicit value of each marginal life by scenario, expressed in a common base of adult passenger lives.
Step 1: Forced Choice and Relative Scenario Preference
We force each respondent to articulate a choice between sacrificing pedestrians or passengers in different scenarios. The aggregate result is the percentage of respondents selecting one scenario over the other.
Step 2: Relative Scenario Value
From the respondent preferences between two scenarios we can calculate the implicit value of the two scenarios with respect to each other. For example, if in a forced choice between scenario A and B, 35% of the respondents choose scenario A, we can infer that the relative value of the two scenarios is 35% to 65%, so that scenario B is worth 0.65/0.35 = 1.86x scenario A.
In this methodology, scenarios with equal frequency of selection are considered equally valuable (50:50 choice = equal value), while a situation where a scenario is always selected leads to an infinite result. We should therefore take care to ask for decisions between scenarios that are somewhat close to each other to avoid the situation.
Step 3: Absolute Scenario Value
Given relative scenario value, we can fold back the value in an iterative process to express the value of each scenario in a common basis—the value of the life of the driver of the vehicle, expressed in our nomenclature as adult passenger lives equivalents. For some scenarios we will be able to calculate different values. In these situations, we will average the values and will use the averaged value as the basis for calculations of the subsequent scenarios.
Thus, we are potentially facing two issues: the first is that if the values for the same scenario vary widely between different calculation paths, we may either introduce an error by averaging or eliminate an interesting avenue of analysis by eliminating this variation. Secondly, if we carry the calculations over multiple steps we may introduce significant additive errors in the calculation. We will investigate the first issue by reviewing the spread of calculated value by scenario. The second we will mitigate by limiting the number of steps to four averaged calculations—two for passenger scenarios and two for pedestrian scenarios.
Step 4: Single Life Marginal Value Calculation
In the early, simpler scenarios we can read the marginal value of single lives directly. For the later scenarios we can calculate the marginal value of individual lives by subtracting the scenario values from each other. With these simple calculations we can estimate the implicit value of each life, under consideration of cardinality (first, second, or third life) and number of other people involved (number of other adults or children involved in the scenario).
3. Results
The results for each forced-choice scenario are shown in Table 2. From these results we calculated the implicit relative value of each of the options with respect to each other in the pair-wise comparisons, shown in Table 3. For example, facing the decision to sacrifice 1 adult passenger (driver) or 1 adult pedestrian (top left-hand corner of Table 2), approximately 46% of respondents decided to sacrifice the driver. Therefore the implicit value of 1 adult pedestrian is 0.46/(1 − 0.46) = 0.84 adult passengers.
We can now calculate the implicit absolute value assigned to each scenario, for both passengers and pedestrians, using a multi-step process. The value can be expressed as the number of adult driver lives as a reference.
The process begins with reading the value of pedestrian scenarios 1A (1 Adult) and 1C (1 Child) directly from Table 3. From these values we can calculate the value of the passenger scenario 1A1C (1 Adult and 1 Child on board) using the pedestrian scenarios 2A, 1A1C, and 2C and averaging the results. We continue the process working through the values on Table 3 downwards and to the right. This iterative process is shown graphically in Figure 2.
The actual calculations described in Figure 2 are shown in detail in Table 4. Where more than one option is presented to calculate scenario values, we use all options and use the average of these values for the subsequent calculations.
The averaged scenario values calculated in Table 4 show some variation based on the reference scenario taken for calculation. For example, Passenger scenario 1A1C exhibits a band of 3.13 to 4.45 around the average value of 3.94 adult passenger lives equivalents. Overall, pedestrian scenarios show variations around the average evaluation within a band of approximately +/− 10%. On the other hand, passenger scenario evaluations show a much broader band of approximately +/− 20% around the average calculated value, with a peak of a 25% variation. While we consider the variation around the calculated average for the pedestrian scenarios to be unproblematic, the wider band around the average passenger scenario calculations raises some concerns about the stability of the analysis, especially if the method is extended to additional iterations. For the number of iterations in our analysis the errors are not categorical, however, and we can proceed using these average values.
Using the answers from respondents we can calculate the implicit marginal value assigned to each person in the accident scenarios, both adults and children, shown in Table 5, and we can address directly our hypotheses.
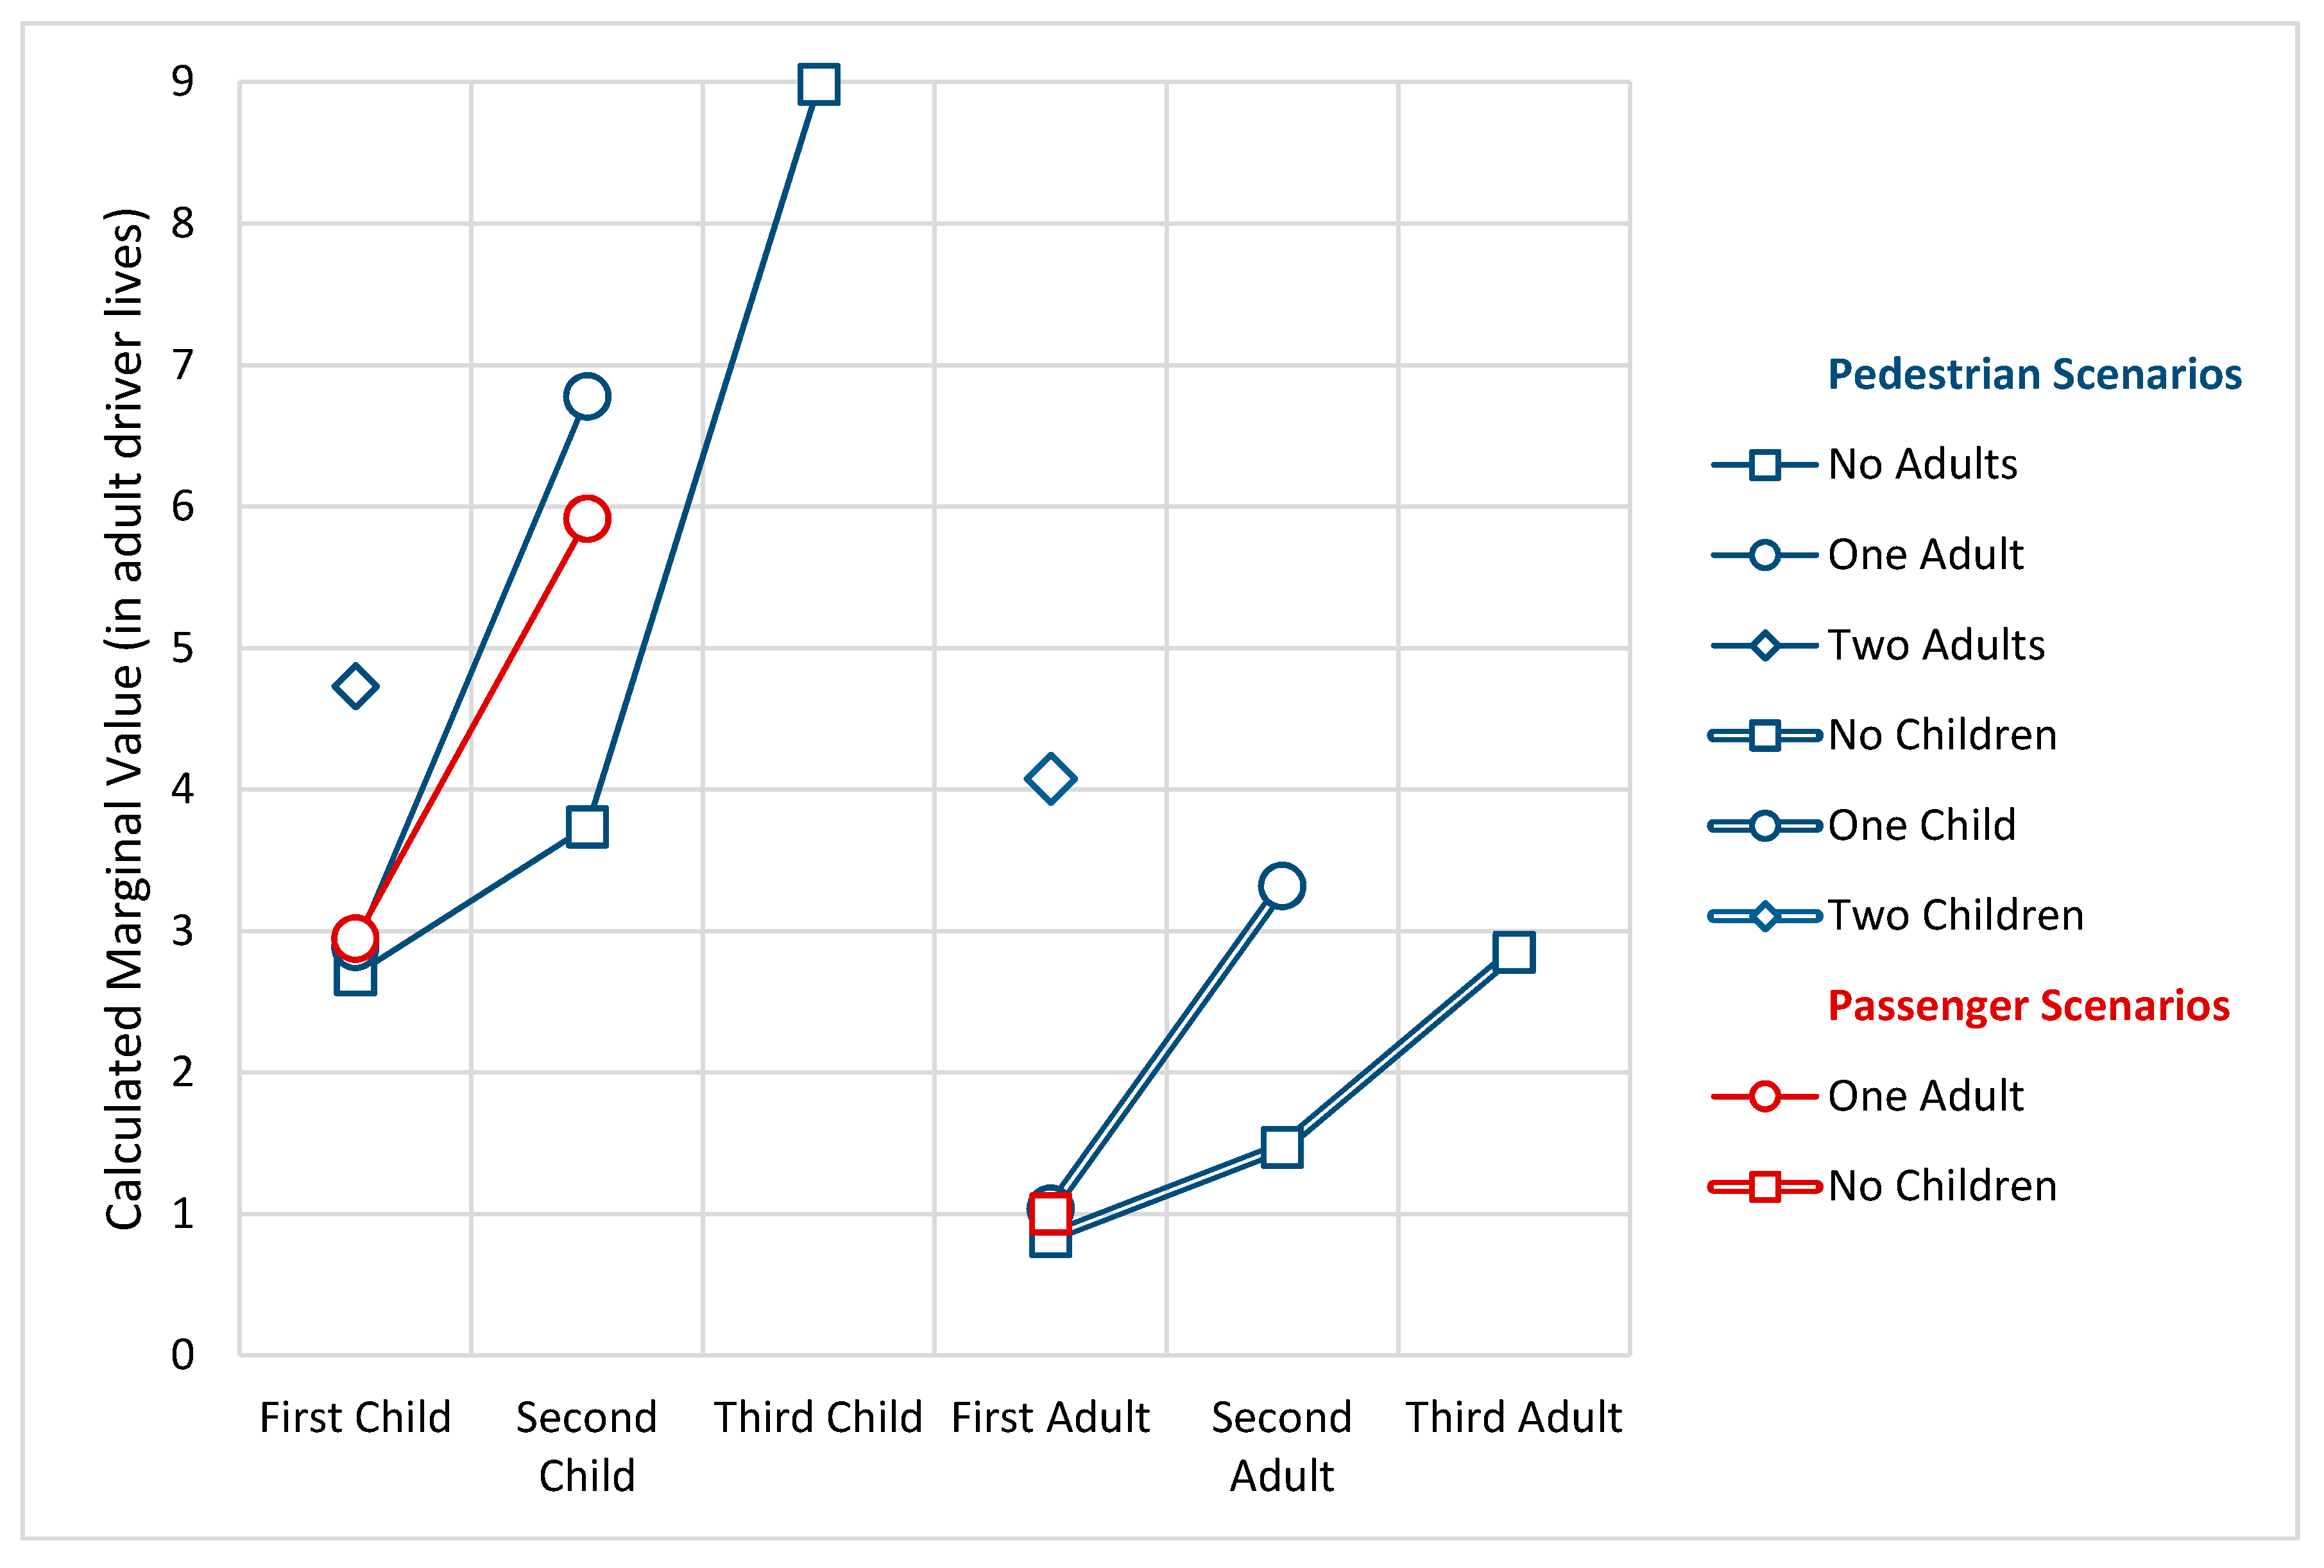
Figure 3 describes the value of adult and children lives expressed in adult driver lives equivalents. The lines link the marginal value of each life based on the number and age of other people impacted in the scenario.
The first significant observation from our results is that the implicit value of each life depends on the number of other people killed in the accident. So, for example, the marginal value of the second pedestrian adult life grows from 1.47 to 4.35 adult passenger lives when one child is added to the fatalities. This is in addition to the implicit value of the child’s life. Similarly, the marginal value of the second pedestrian child life grows from 3.74 to 6.78 adult passenger equivalents when an adult is added to the fatalities.
Secondly, cardinality has a significant and growing effect on the marginal value of each life. Consider the scenarios where only pedestrian adults are killed. The marginal value of the first life is 0.84 adult passenger equivalents, growing to 1.47 for the second adult and ultimately to 2.85 for the third adult. Similarly, in the scenarios where the fatalities are only pedestrian children, the marginal value of the first child’s life is 2.69 adult passenger lives, growing to 3.74 for the second child’s life and ultimately to 8.98 adult passenger lives for the third child.
The third observation we can draw from our results is that children lives are consistently valued higher than adult lives, correcting for cardinality and the number of other people involved. However, the relative value changes according to the scenario, from a factor of approximately 3x for the scenarios with fewer people or with only adults or children involved to a factor of approximately 1.5x for more complex scenarios.
Finally, pedestrian lives are valued lower than passenger lives, but by a lower margin than expected. For example, the value of the first adult life is 16% lower, while the value of the first child life differs by less than 2%. The value of the second child’s life, however, differs by approximately 30% between pedestrians and passengers.
4. Discussion
The results from our experiments indicate the following insights into the hypotheses we formulated at the beginning of this paper.
Hypothesis 1a.
Customers will prefer self-driving vehicles to sacrifice pedestrians rather than passengers. We see only relatively small evidence to support this hypothesis. Depending on the scenario, lives are considered to have fundamentally the same value, up to a maximum difference of approximately a third.
Hypothesis 2a.
Customers will value the lives of children higher than the lives of adults. There is strong evidence to support this hypothesis. This effect is both large and consistent across all scenarios, although the range of this difference is relatively large, from 1.5x to 3x.
Hypothesis 3a.
Customers value more lives higher than fewer lives, however, the marginal value of each additional life decreases. There is clear evidence to support the first part of this hypothesis, with scenarios involving more people consistently valued higher than scenarios with few fatalities, correcting for passenger/pedestrian status and adult/children mix.
Somewhat unexpectedly, however, we find strong evidence against the second part of the hypothesis. The marginal value of additional lives increases with the increasing number of fatalities, at least in the range investigated. Logically, we would expect this effect to disappear with increasing numbers of fatalities, as it should become more difficult to differentiate between an accident provoking, for example, 100 fatalities vs. 101 fatalities.
Thus, our experiment shows that (i) Swiss consumers value the lives of passengers and pedestrians approximately equally, (ii) they value children’s lives significantly higher that adult lives and (iii) the value of additional lives lost increases with the size of the accident.
5. Conclusions
On a broader level, the results of this experiment point to two areas of significance and further analysis by car manufacturers, software developers, and regulators.
The first one is that there is the potential for significant differences in societal preferences for accident decisions and outcomes. Our results show that, at least in Switzerland, preferences are clearly utilitarian, aiming at minimizing the overall number of fatalities. Indeed, rather than showing diminishing returns, additional fatalities are weighted even more heavily. In this situation, an algorithm that protects passengers at the expense of pedestrians will face a significant societal and thus political blowback. Whether this is a quirk of the experimental setup or a characteristic shared throughout Swiss society and across cultures should be investigated in future work.
Secondly, because of this phenomenon, car manufacturers and software developers need to pay close attention to their marketing message. It is naturally tempting to tout one’s vehicle and steering algorithm as particularly safe for one’s own customers, but pushing this message can in fact create negative ramifications for the company and its brand. In addition, this messaging could ultimately be used in a court of law to show intent in case of litigations involving traffic fatalities. It is therefore vital that especially car manufacturers, with their established brands, pay close attention to the decision-making and messaging at a local level.
Author Contributions
All activities related to this article were conducted jointly and equitably by both authors, with the following exceptions: C.P. developed the calculation methodology, R.S. collected the data.
Acknowledgments
The authors were not provided funding. However, we would like to acknowledge and thank Iyad Rahwan at the Massachusetts Institute of Technology for the permission to use the accident graphics from the Moral Machine.
Conflicts of Interest
The authors declare no conflict of interest
References
- Bonnefon, Jean-François, Azim Shariff, and Iyad Rahwan. 2016. The social dilemma of autonomous vehicles. Science 352: 1573–76. [Google Scholar] [CrossRef] [PubMed]
- Fleetwood, Janet. 2017. Public Health, Ethics, and Autonomous Vehicles. American Journal of Public Health 107: 532–37. [Google Scholar] [CrossRef] [PubMed]
- Gerdes, J. Christian, and Sarah M. Thornton. 2015. Implementable Ethics for Autonomous Vehicles, Autonomes Fahren. Berlin/Heidelberg: Springer. [Google Scholar]
- Goodall, Noah. 2014. Ethical Decision Making During Automated Vehicle Crashes. Transportation Research Record: Journal of the Transportation Research Board 2424: 58–65. [Google Scholar] [CrossRef]
- Goodall, Noah J. 2016. Can You Program Ethics into a Self-Driving Car? IEEE Spectrum 53: 28–58. [Google Scholar] [CrossRef]
- Hayenhjelm, Madeleine, and Jonathan Wolff. 2012. The Moral Problem of Risk Impositions: A Survey of Literature. European Jourrnal of Philosophy 20: E26–E51. [Google Scholar] [CrossRef]
- Hersch, Joni, and W. Kip Viscusi. 1990. Cigarette Smoking, Seatbelt Use, and Differences in Wage-Risk Tradeoffs. The Journal of Human Resources 25: 202–27. [Google Scholar] [CrossRef]
- Hevelke, Alexander, and Julian Nida-Rümelin. 2015. Responsibility for Crashes of Autonomous Vehicles: An Ethical Analysis. Science and Engineering Ethics 21: 619–30. [Google Scholar] [CrossRef] [PubMed]
- LaFrance, Adrienne. 2015. Self-Driving Cars Could Save 300,000 Liver Per Decade in America. The Atlantic. Available online: https://www.theatlantic.com/technology/archive/2015/09/self-driving-cars-could-save-300000-lives-per-decade-in-america/407956/ (accessed on 9 November 2017).
- Li, Tanya, and Louise Cheer. 2016. Mercedes- Benz Admits Automated Driverless Cars Would Run over a Child Rather Than Swerve and Risk Injuring the Passengers Inside. The Daily Mail. Available online: http://www.dailymail.co.uk/news/article-3837453/Mercedes-Benz-says-driverless-cars-hit-child-street-save-passengers-inside.html (accessed on 9 November 2017).
- Li, Jamy, Xuan Zhao, Mu-Jung Cho, Wendy Ju, and Bertram F. Malle. 2016. From Trolley to Autonomous Vehicle: Perceptions of Responsibility and Moral Norms in Traffic Accidents with Self-Driving Cars. Warrendale: SAE Technical Paper. Warrendale: SAE Technical Paper. [Google Scholar]
- Lubin, Gus. 2016. Self-Driving Cars Are Already Deciding Who to Kill. Business Insider. Available online: http://www.businessinsider.com/self-driving-cars-already-deciding-who-to-kill-2016-12 (accessed on 9 November 2017).
- Metz, Davud. 2018. Developing Policy for Urban Autonomous Vehicles: Impact on Congestion. Urban Science 2: 23. [Google Scholar] [CrossRef]
- Milakis, Dimitris, Bart Van Arem, and Bert Van Wee. 2017. Policy and Society Related Implications of Automated Driving: A Review of Literature and Directions for Future Research. Journal of Intelligent Transportation Systems 21: 324–48. [Google Scholar] [CrossRef]
- Nikitas, Alexandros, Ioannis Kougias, Elena Alyavina, and Eric Njoya Tchouamou. 2017. How Can Autonomous and Connected Vehicles, Electromobility, BRT, Hyperloop, Shared Use Mobility and Mobility-As-Service Shape Transport Futures for the Context of Smart Cities? Urban Science 1: 36. [Google Scholar] [CrossRef]
- Noothigattu, Ritesh, Snehalkumar Neil S. Gaikwad, Edmond Awad, Sohan Dsouza, Iyad Rahwan. Pradeep Ravikumar, and Ariel D. Procaccia. 2017. A Voting-Based System for Ethical Decision Making. arXiv, arXiv:1709.06692. [Google Scholar]
- Nyholm, Sven, and Jilles Smids. 2016. The Ethics of Accident-Algorithms for Self-Driving Cars: An Applied Trolley Problem? Ethical Theory and Moral Practice 19: 1275–89. [Google Scholar] [CrossRef]
- Parkin, John, Benjamin Clark, Willaim Clayton, Miriam Ricci, and Graham Parkhurst. 2018. Autonomous Vehicle Interactions in the Urban Street Environment: A Research Agenda. Proceedings of the Institution of Civil Engineers: Municipal Engineer 171: 15–25. [Google Scholar] [CrossRef]
- Schläpfer, Remo. 2017. Self-driving Cars: Would You Want to Be Sacrificed?—A New Technology between a Social Dilemma and Life Trade-Offs. Master’s thesis, Zurich University of Applied Sciences, Zurich, Switzerland. [Google Scholar]
- Thomopoulos, Nikolas, and Moshe Givoni. 2015. The Autonomous Car—A Blessing or a Curse for the Future of Low Carbon Mobility? An Exploration of Likely vs. Desirable Outcomes. European Journal of Futures Research 3: 14. [Google Scholar] [CrossRef]
- Viscusi, W. Kip, and Joseph E. Aldy. 2003. The Value of a Statistical Life: A Critical Review of Market Estimates throughout the World. Journal of Risk and Uncertainty 27: 5–76. [Google Scholar] [CrossRef]
- Wintersberger, Philipp Anna-Katharina Prison, Andreas Riener, and Sinan Hasirlioglu. The Experience of Ethics: Evaluation of Self-Harm Risks in Automated Vehicles. Paper presented at the IEEE Intelligent Vehicles Symposium (IV), Los Angeles, CA, USA, June 11–14 2017; pp. 11–14. [Google Scholar]
Figure 1.
Sacrificing pedestrians vs. passengers (please note the skulls indicating the fatalities).
Figure 1.
Sacrificing pedestrians vs. passengers (please note the skulls indicating the fatalities).
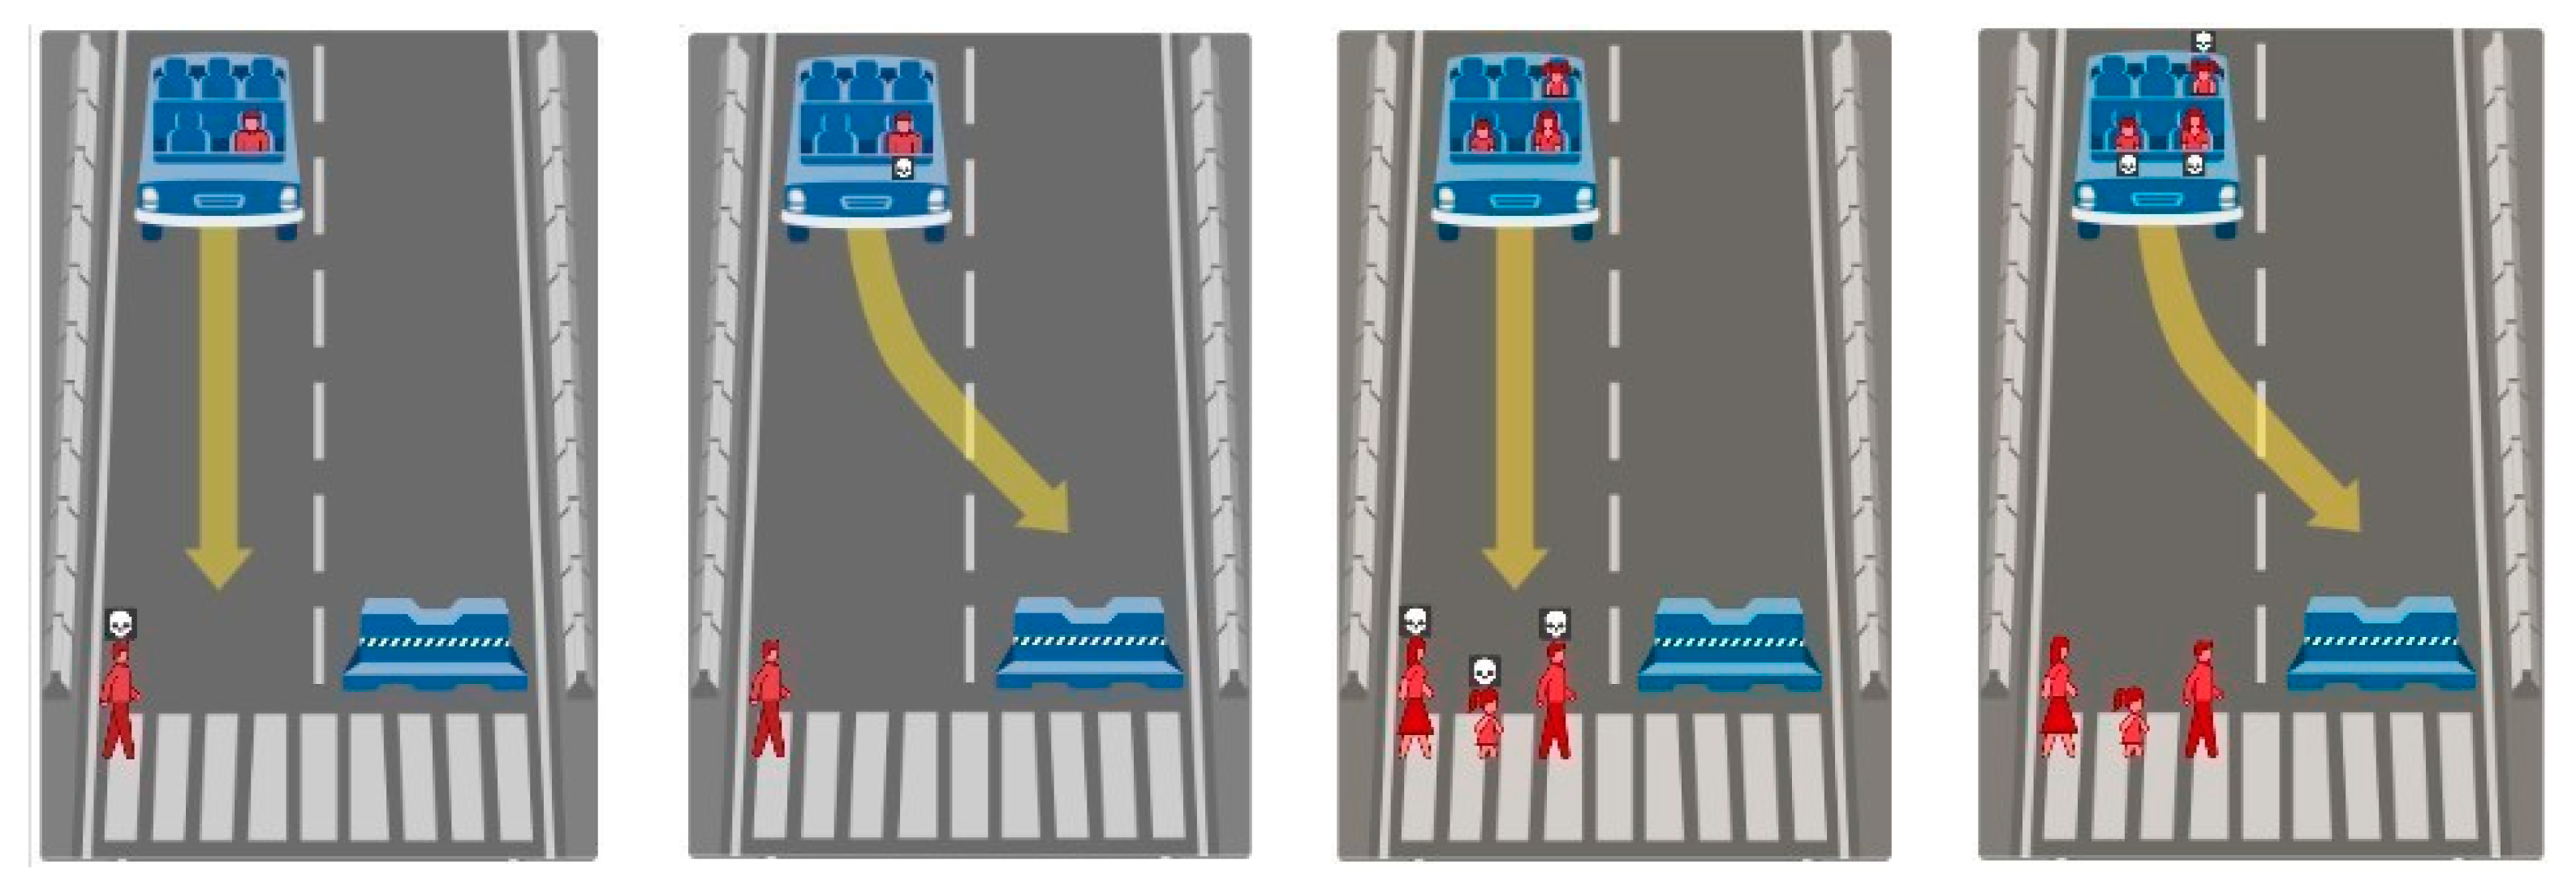
Figure 2.
Method for calculating scenario absolute values.

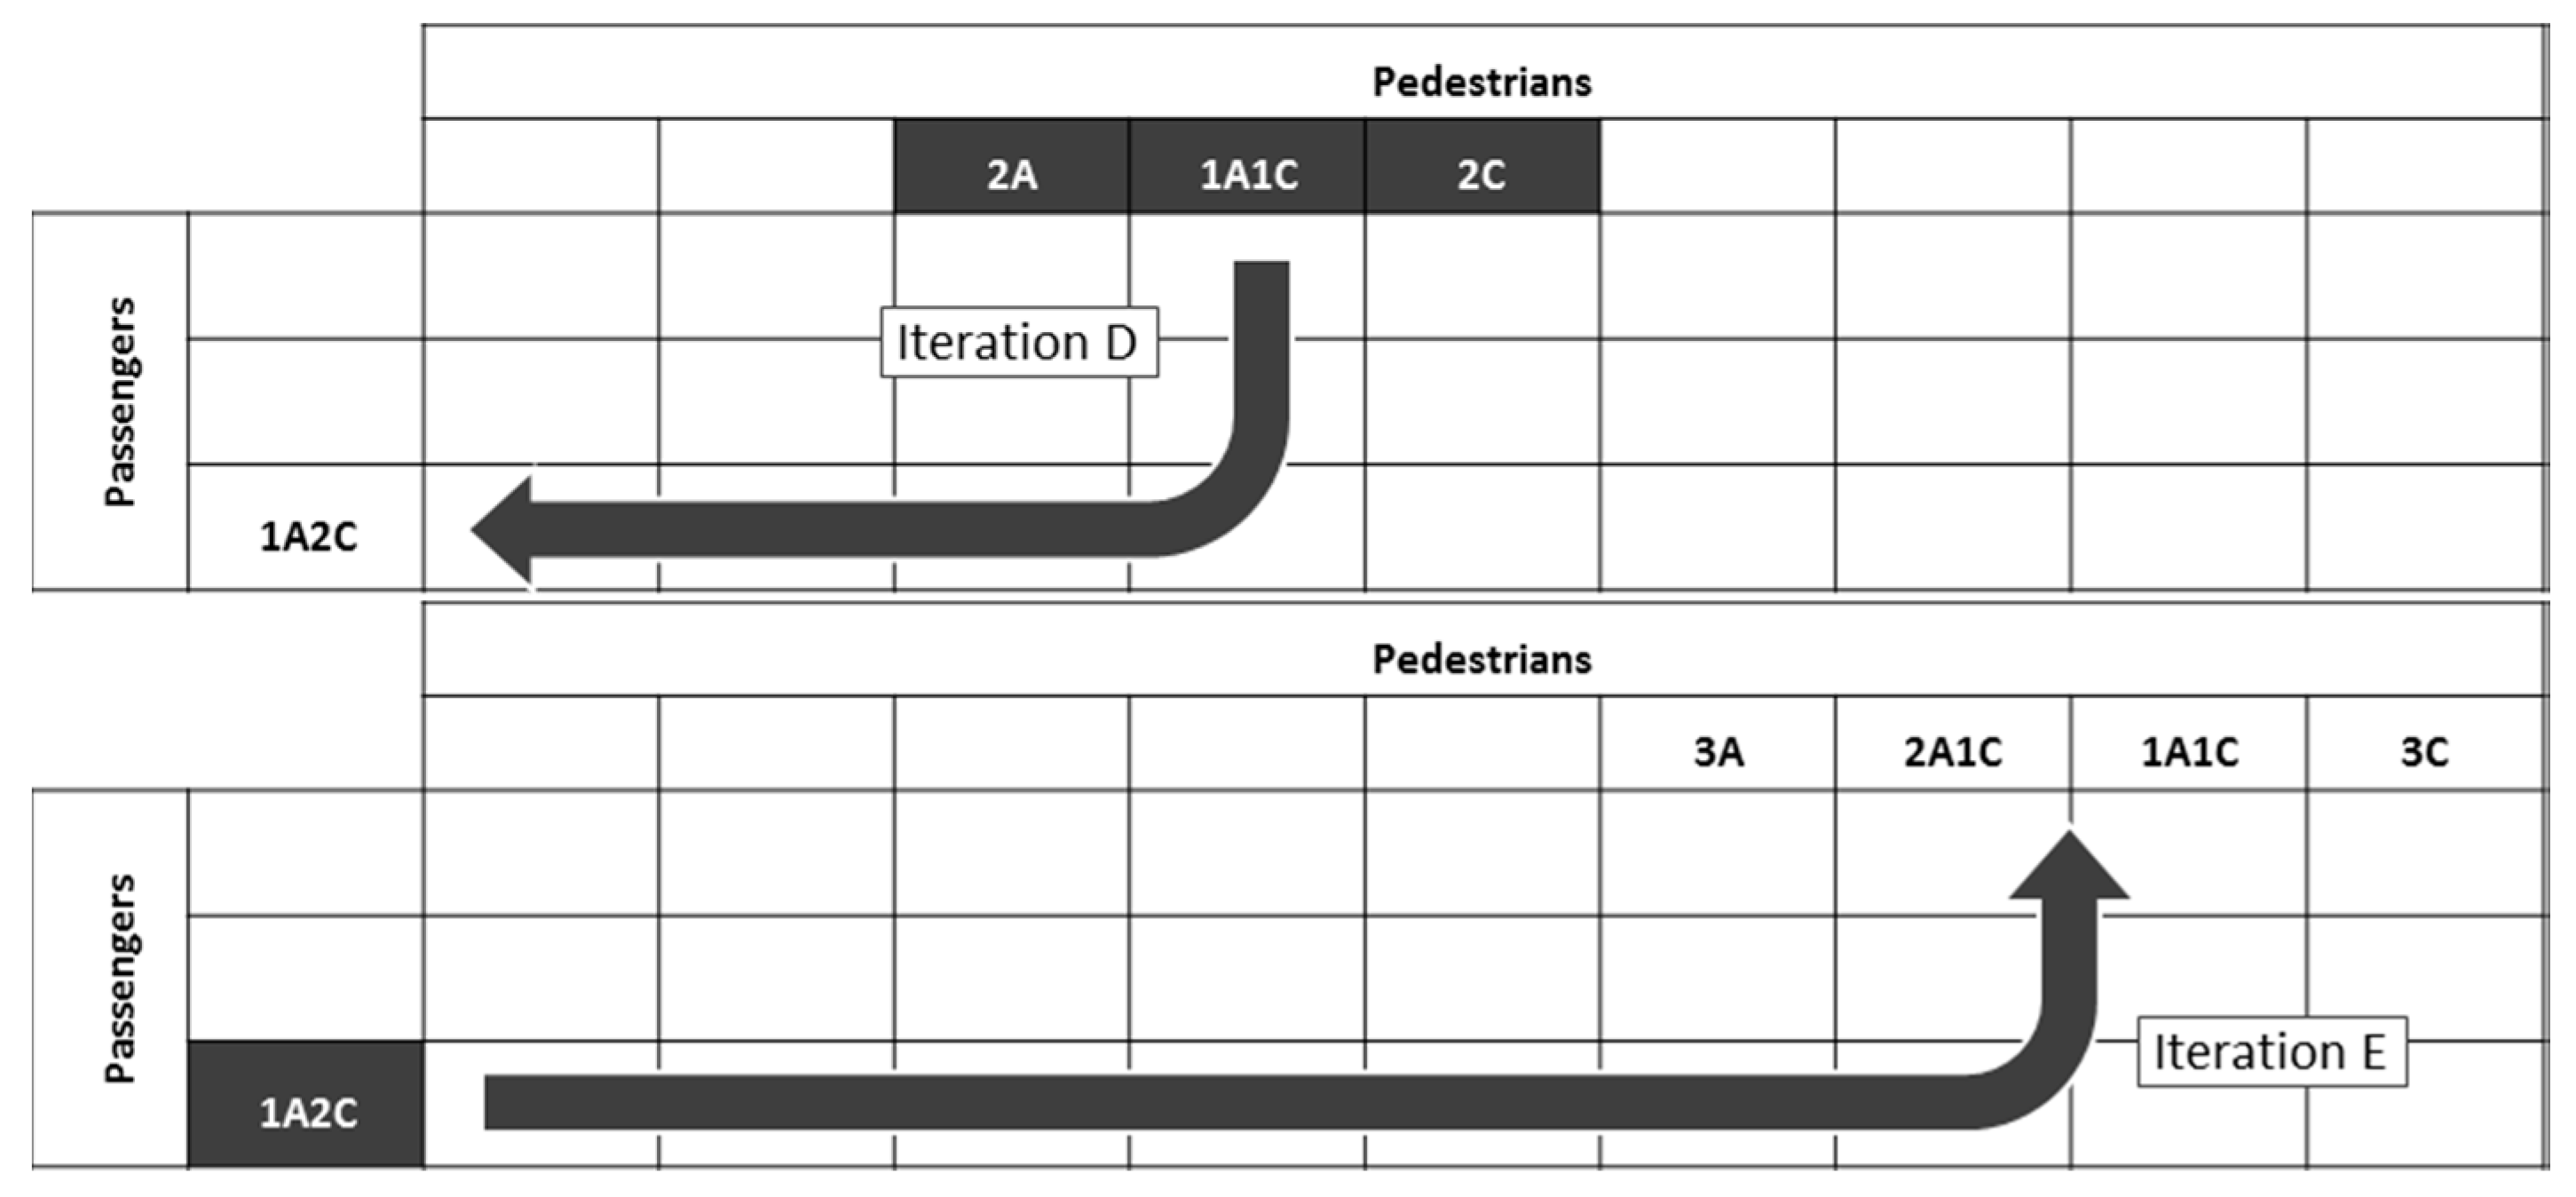
Figure 3.
Calculated marginal value of life (expressed as adult driver lives) by number and age of other people involved in the accident.
Figure 3.
Calculated marginal value of life (expressed as adult driver lives) by number and age of other people involved in the accident.

Table 1.
The 16 forced-choice scenarios (A = Adult, C = Child).
| Pedestrian (s) | ||||||||||
|---|---|---|---|---|---|---|---|---|---|---|
| 1A | 1C | 2A | 1A1C | 2C | 3A | 2A1C | 1A2C | 3C | ||
| Passenger (s) | 1A | tested | tested | tested | tested | tested | not tested | not tested | not tested | not tested |
| 1A1C | not tested | not tested | tested | tested | tested | tested | tested | tested | tested | |
| 1A2C | not tested | not tested | not tested | not tested | not tested | tested | tested | tested | tested | |
Table 2.
Percentage of respondents selecting to sacrifice passengers by scenario (A = Adult, C = Child).
Table 2.
Percentage of respondents selecting to sacrifice passengers by scenario (A = Adult, C = Child).
| Pedestrians | ||||||||||
|---|---|---|---|---|---|---|---|---|---|---|
| 1A | 1C | 2A | 1A1C | 2C | 3A | 2A1C | 1A1C | 3C | ||
| Passengers | 1A | 0.46 | 0.73 | 0.71 | 0.79 | 0.85 | - | - | - | - |
| 1A1C | - | - | 0.36 | 0.48 | 0.64 | 0.54 | 0.65 | 0.75 | 0.78 | |
| 1A2C | - | - | - | - | - | 0.36 | 0.40 | 0.49 | 0.64 | |
Table 3.
Relative weighting of the scenarios in the pair-wise comparisons (value of pedestrian scenario as a proportion of passenger scenario).
Table 3.
Relative weighting of the scenarios in the pair-wise comparisons (value of pedestrian scenario as a proportion of passenger scenario).
| Pedestrians | ||||||||||
|---|---|---|---|---|---|---|---|---|---|---|
| 1A | 1C | 2A | 1A1C | 2C | 3A | 2A1C | 1A1C | 3C | ||
| Passengers | 1A | 0.84 | 2.69 | 2.45 | 3.86 | 5.69 | - | - | - | - |
| 1A1C | - | - | 0.55 | 0.91 | 1.82 | 1.18 | 1.89 | 2.96 | 3.46 | |
| 1A2C | - | - | - | - | - | 0.57 | 0.67 | 0.95 | 1.74 | |
Table 4.
Absolute value by scenario (expressed in adult driver lives equivalents).
| Scenario | Calculations | Calculated Value | Average Value |
|---|---|---|---|
| Iteration A | |||
| Passenger 1A | By definition | - | 1.00 |
| Pedestrian 1A | From Table 3. | - | 0.84 |
| Pedestrian 1C | From Table 3. | - | 2.69 |
| Iteration B | |||
| Passenger 1A1C | Pedestrian 2A = 2.45x Passenger 1A = 0.55x Passenger 1A1C | 4.45 | 3.94 |
| Pedestrian 1A1C = 3.86x Passenger 1A = 0.91x Passenger 1A1C | 4.24 | ||
| Pedestrian 2C = 5.69x Passenger 1A = 1.82x Passenger 1A1C | 3.13 | ||
| Iteration C | |||
| Pedestrian 2A | Pedestrian 2A = 2.45x Passenger 1A | 2.45 | 2.31 |
| Pedestrian 2A = 0.55x Passenger 1A1C | 2.17 | ||
| Pedestrian 1A1C | Pedestrian 1A1C = 3.86x Passenger 1A | 3.86 | 3.73 |
| Pedestrian 1A1C = 0.91x Passenger 1A1C | 3.59 | ||
| Pedestrian 2C | Pedestrian 2C = 5.69x Passenger 1A | 5.69 | 6.43 |
| Pedestrian 2C = 1.82x Passenger 1A1C | 7.16 | ||
| Iteration D | |||
| Passenger 1A2C | Pedestrians 3A = 1.18x Passenger 1A1C = 0.57x Passenger 1A2C | 8.14 | 9.85 |
| Pedestrians 2A1C = 1.89x Passenger 1A1C = 0.67x Passenger 1A2C | 11.10 | ||
| Pedestrians 1A2C = 1.89x Passenger 1A1C = 0.67x Passenger 1A2C | 12.36 | ||
| Pedestrians 3C = 1.89x Passenger 1A1C = 0.67x Passenger 1A2C | 7.86 | ||
| Iteration E | |||
| Pedestrian 3A | Pedestrian 3A = 1.18x Passenger 1A1C | 4.67 | 5.16 |
| Pedestrian 3A = 0.57x Passenger 1A2C | 5.65 | ||
| Pedestrian 2A1C | Pedestrian 2A1C = 1.89x Passenger 1A1C | 7.46 | 7.04 |
| Pedestrian 2A1C = 0.67x Passenger 1A2C | 6.62 | ||
| Pedestrian 1A2C | Pedestrian 1A2C = 2.96x Passenger 1A1C | 11.68 | 10.50 |
| Pedestrian 1A2C = 0.95x Passenger 1A2C | 9.32 | ||
| Pedestrian 3C | Pedestrian 3C = 3.46x Passenger 1A1C | 13.64 | 15.41 |
| Pedestrian 3C = 1.74x Passenger 1A2C | 17.18 | ||
Table 5.
Calculated implicit value by scenario.
| ID | Pedestrian Scenario | Implicit Value | Calculation | Value of 1st Child | Value of 2nd Child | Value of 3rd Child | Calculation | Value of 1st Adult | Value of 2nd Adult | Value of 3rd Adult |
| (a) | 1A | 0.84 | 0.84 | |||||||
| (b) | 1C | 2.69 | 2.69 | |||||||
| (c) | 2A | 2.31 | (c) − (a) | 1.47 | ||||||
| (d) | 1A1C | 3.73 | (d) − (a) | 2.89 | (d) − (b) | 1.04 | ||||
| (e) | 2C | 6.43 | (e) − (b) | 3.74 | ||||||
| (f) | 3A | 5.16 | (f) − (c) | 2.85 | ||||||
| (g) | 2A1C | 7.04 | (g) − (c) | 4.73 | (g) − (d) | 3.32 | ||||
| (h) | 1A2C | 10.50 | (h) − (d) | 6.78 | (h) − (e) | 4.08 | ||||
| (i) | 3C | 15.41 | (i) − (e) | 8.98 | ||||||
| (j) | 1A | 1.00 | 1.00 | |||||||
| (k) | 1A1C | 3.94 | (k) − (j) | 2.94 | ||||||
| (l) | 1A2C | 9.85 | (l) − (k) | 5.91 |
© 2018 by the authors. Licensee MDPI, Basel, Switzerland. This article is an open access article distributed under the terms and conditions of the Creative Commons Attribution (CC BY) license (http://creativecommons.org/licenses/by/4.0/).
Share and Cite
MDPI and ACS Style
Pugnetti, C.; Schläpfer, R. Customer Preferences and Implicit Tradeoffs in Accident Scenarios for Self-Driving Vehicle Algorithms. J. Risk Financial Manag. 2018, 11, 28. https://doi.org/10.3390/jrfm11020028
AMA Style
Pugnetti C, Schläpfer R. Customer Preferences and Implicit Tradeoffs in Accident Scenarios for Self-Driving Vehicle Algorithms. Journal of Risk and Financial Management. 2018; 11(2):28. https://doi.org/10.3390/jrfm11020028
Chicago/Turabian StylePugnetti, Carlo, and Remo Schläpfer. 2018. "Customer Preferences and Implicit Tradeoffs in Accident Scenarios for Self-Driving Vehicle Algorithms" Journal of Risk and Financial Management 11, no. 2: 28. https://doi.org/10.3390/jrfm11020028