<?xml version="1.0" encoding="UTF-8"?>
<!DOCTYPE article PUBLIC "-//NLM//DTD Journal Publishing DTD v2.3 20070202//EN" "journalpublishing.dtd">
<article xmlns:mml="http://www.w3.org/1998/Math/MathML" xmlns:xlink="http://www.w3.org/1999/xlink" xml:lang="en" article-type="research-article">
  <front>
    <journal-meta>
      <journal-id journal-id-type="publisher-id">ijerph</journal-id>
      <journal-title>International Journal of Environmental Research and Public Health</journal-title>
      <abbrev-journal-title abbrev-type="publisher">Int. J. Environ. Res. Public Health</abbrev-journal-title>
      <abbrev-journal-title abbrev-type="pubmed">International journal of environmental research and public health</abbrev-journal-title>
      <issn pub-type="epub">1660-4601</issn>
      <publisher>
        <publisher-name>MDPI</publisher-name>
      </publisher>
    </journal-meta>
    <article-meta>
      <article-id pub-id-type="doi">10.3390/ijerph9051887</article-id>
      <article-id pub-id-type="publisher-id">ijerph-09-01887</article-id>
      <article-categories>
        <subj-group>
          <subject>Article</subject>
        </subj-group>
      </article-categories>
      <title-group>
        <article-title>Assessment of Runoff and Sediment Yields Using the AnnAGNPS Model in a Three-Gorge Watershed of China</article-title>
      </title-group>
      <contrib-group>
        <contrib contrib-type="author">
          <name>
            <surname>Hua</surname>
            <given-names>Lizhong</given-names>
          </name>
          <xref rid="af1-ijerph-09-01887" ref-type="aff">1</xref>
          <xref rid="af2-ijerph-09-01887" ref-type="aff">2</xref>
        </contrib>
        <contrib contrib-type="author">
          <name>
            <surname>He</surname>
            <given-names>Xiubin</given-names>
          </name>
          <xref rid="af2-ijerph-09-01887" ref-type="aff">2</xref>
          <xref rid="c1-ijerph-09-01887" ref-type="corresp">*</xref>
        </contrib>
        <contrib contrib-type="author">
          <name>
            <surname>Yuan</surname>
            <given-names>Yongping</given-names>
          </name>
          <xref rid="af3-ijerph-09-01887" ref-type="aff">3</xref>
          <xref rid="c1-ijerph-09-01887" ref-type="corresp">*</xref>
        </contrib>
        <contrib contrib-type="author">
          <name>
            <surname>Nan</surname>
            <given-names>Hongwei</given-names>
          </name>
          <xref rid="af2-ijerph-09-01887" ref-type="aff">2</xref>
        </contrib>
      </contrib-group>
	  <aff id="af1-ijerph-09-01887"><label>1 </label>Department of Spatial Information Science and Engineering, Xiamen University of Technology, Xiamen 361024, China; Email: <email>lzhua@xmut.edu.cn</email></aff>
      <aff id="af2-ijerph-09-01887"><label>2 </label>Institute of Mountain Hazards and Environment, Chinese Academy of Sciences, Chengdu 610041, China; Email: <email>nanhw@126.com</email></aff>
      <aff id="af3-ijerph-09-01887"><label>3 </label>USEPA-Office of Research and Development, 944 E. Harmon Ave, Las Vegas, NV 89119, USA</aff>
      <author-notes>
        <corresp id="c1-ijerph-09-01887"><label>* </label>Authors  to whom correspondence should be addressed; Email: <email>Yuan.yongping@epa.gov</email> (Y.Y.); <email>xiubinh@imde.ac.cn</email> (X.H.); Tel.: +1-702-798-2112 (Y.Y.); +86-28-8523105 (X.H.); Fax: +1-702-798-2208.</corresp>
      </author-notes>
      <pub-date pub-type="epub">
        <day>16</day>
        <month>05</month>
        <year>2012</year>
      </pub-date>
      <pub-date pub-type="ppub">
        <month>05</month>
		<year>2012</year>
      </pub-date>
      <volume>9</volume>
      <issue>5</issue>
      <fpage>1887</fpage>
      <lpage>1907</lpage>
      <history>
        <date date-type="received">
          <day>06</day>
          <month>02</month>
          <year>2012</year>
        </date>
        <date date-type="rev-recd">
          <day>26</day>
          <month>03</month>
          <year>2012</year>
        </date>
        <date date-type="accepted">
          <day>29</day>
          <month>04</month>
          <year>2012</year>
        </date>
      </history>
      <permissions>
        <copyright-statement>©  2012 by the authors; licensee MDPI, Basel, Switzerland.</copyright-statement>
        <copyright-year>2012</copyright-year>
        <license xmlns:xlink="http://www.w3.org/1999/xlink" license-type="open-access" xlink:href="http://creativecommons.org/licenses/by/3.0/">
          <p>This article is an open-access article distributed under the terms and conditions of the Creative Commons Attribution license (http://creativecommons.org/licenses/by/3.0/).</p>
        </license>
      </permissions>
      <abstract>
        <p>Soil erosion has been recognized as one of the major threats to our environment and water quality worldwide, especially in China. To mitigate nonpoint source water quality problems caused by soil erosion, best management practices (BMPs) and/or conservation programs have been adopted. Watershed models, such as the Annualized Agricultural Non-Point Source Pollutant Loading model (AnnAGNPS), have been developed to aid in the evaluation of watershed response to watershed management practices. The model has been applied worldwide and proven to be a very effective tool in identifying the critical areas which had serious erosion, and in aiding in decision-making processes for adopting BMPs and/or conservation programs so that cost/benefit can be maximized and non-point source pollution control can be achieved in the most efficient way. The main goal of this study was to assess the characteristics of soil erosion, sediment and sediment delivery of a watershed so that effective conservation measures can be implemented. To achieve the overall objective of this study, all necessary data for the 4,184 km<sup>2</sup> Daning River watershed in the Three-Gorge region of the Yangtze River of China were assembled. The model was calibrated using observed monthly runoff from 1998 to 1999 (Nash-Sutcliffe coefficient of efficiency of 0.94 and <italic>R</italic><sup>2</sup> of 0.94) and validated using the observed monthly runoff from 2003 to 2005 (Nash-Sutcliffe coefficient of efficiency of 0.93 and <italic>R</italic><sup>2</sup> of 0.93). Additionally, the model was validated using annual average sediment of 2000–2002 (relative error of −0.34) and 2003–2004 (relative error of 0.18) at Wuxi station. Post validation simulation showed that approximately 48% of the watershed was under the soil loss tolerance released by the Ministry of Water Resources of China (500 t·km<sup>−2</sup>·y<sup>−1</sup>). However, 8% of the watershed had soil erosion of exceeding 5,000 t·km<sup>−2</sup>·y<sup>−1</sup>. Sloping areas and low coverage areas are the main source of soil loss in the watershed.</p>
      </abstract>
      <kwd-group>
        <kwd>AnnAGNPS</kwd>
        <kwd>modeling</kwd>
        <kwd>Daning River watershed</kwd>
        <kwd>Three-Gorge</kwd>
        <kwd>erosion and sediment</kwd>
      </kwd-group>
    </article-meta>
  </front>
  <body>
    <sec sec-type="intro">
      <title>1. Introduction</title>
      <p>Soil erosion has increased throughout the 20th century [<xref ref-type="bibr" rid="B1-ijerph-09-01887">1</xref>], and has become an extremely serious environmental problem worldwide. It has been recognized as a threat to the productivity of the farms and the quality of surface waters in the Three-Gorge area of the Yangtze River of China. The region is subjected to flooding, soil erosion and sedimentation hazards leading to environmental, social and economic problems. However, there is only limited research available to describe the erosion, sedimentation, and water quality dynamics on a watershed scale in this region. Thus, the accurate quantification of soil erosion and sediment in the watersheds of the region is urgently needed and essential for efficiently planning land use, enhancing agricultural production and productivity, reducing reservoir sedimentation and improving stream water quality. </p>
      <p>Watershed models are considered as a cost-effective and time-efficient method for assessment of pollutant loads and simulation of watershed processes and management practices in an effort to address non-point source pollution [<xref ref-type="bibr" rid="B2-ijerph-09-01887">2</xref>]. Several watershed-scale hydrological and water quality models, such as AnnAGNPS (Annualized AGricultural Non-Point Source) [<xref ref-type="bibr" rid="B3-ijerph-09-01887">3</xref>] and SWAT (Soil and Water Assessment Tool) [<xref ref-type="bibr" rid="B4-ijerph-09-01887">4</xref>], have been developed over the past decades to evaluate the hydrologic and water quality responses of a watershed to alternative management practices. AnnAGNPS, a parameter distributed and semi-physically based model, is designed to simulate water, sediment and chemical movement from agricultural watersheds on a continuous daily time step [<xref ref-type="bibr" rid="B5-ijerph-09-01887">5</xref>]. AnnAGNPS was developed as an expansion of the capabilities of the single event AGNPS with improved technology and significantly advanced features. The single event AGNPS model has received extensive evaluation and validation in the United States [<xref ref-type="bibr" rid="B6-ijerph-09-01887">6</xref>,<xref ref-type="bibr" rid="B7-ijerph-09-01887">7</xref>,<xref ref-type="bibr" rid="B8-ijerph-09-01887">8</xref>], Canada [<xref ref-type="bibr" rid="B9-ijerph-09-01887">9</xref>], Italy [<xref ref-type="bibr" rid="B10-ijerph-09-01887">10</xref>], and Germany [<xref ref-type="bibr" rid="B11-ijerph-09-01887">11</xref>]. </p>
      <p>AnnAGNPS has been successfully used for hydrology, sediment and nutrient loading predictions and evaluation of cost-effective alternative policy scenarios over a wide range of environments in the United States [<xref ref-type="bibr" rid="B12-ijerph-09-01887">12</xref>,<xref ref-type="bibr" rid="B13-ijerph-09-01887">13</xref>,<xref ref-type="bibr" rid="B14-ijerph-09-01887">14</xref>,<xref ref-type="bibr" rid="B15-ijerph-09-01887">15</xref>,<xref ref-type="bibr" rid="B16-ijerph-09-01887">16</xref>,<xref ref-type="bibr" rid="B17-ijerph-09-01887">17</xref>], Czechoslovakia [<xref ref-type="bibr" rid="B18-ijerph-09-01887">18</xref>], Nepal [<xref ref-type="bibr" rid="B19-ijerph-09-01887">19</xref>], Australia [<xref ref-type="bibr" rid="B2-ijerph-09-01887">2</xref>], Malaysia [<xref ref-type="bibr" rid="B20-ijerph-09-01887">20</xref>], and India [<xref ref-type="bibr" rid="B21-ijerph-09-01887">21</xref>]. </p>
      <p>The objectives of this study were to: (1) calibrate and validate the capability of AnnAGNPS to predict runoff on the watershed using field observed data; and (2) evaluate the characteristics of soil erosion, sediment and sediment delivery on the Daning River watershed after AnnAGNPS is validated.</p>
    </sec>
    <sec sec-type="results">
      <title>2. Results and Discussion</title>
      <p>Calibration and validation results for runoff are shown in <xref ref-type="table" rid="ijerph-09-01887-t001">Table 1</xref>. AnnAGNPS simulated and field observed monthly runoff from precipitation events which were available for model evaluation at the Wuxi gauging station are displayed in <xref ref-type="fig" rid="ijerph-09-01887-f001">Figure 1</xref> and <xref ref-type="fig" rid="ijerph-09-01887-f002">Figure 2</xref>. Characteristics of soil erosion and sediment yield within Daning River watershed for the current condition simulation are given in <xref ref-type="table" rid="ijerph-09-01887-t002">Table 2</xref>, <xref ref-type="table" rid="ijerph-09-01887-t003">Table 3</xref>, <xref ref-type="table" rid="ijerph-09-01887-t004">Table 4</xref> and <xref ref-type="fig" rid="ijerph-09-01887-f003">Figure 3</xref>, <xref ref-type="fig" rid="ijerph-09-01887-f004">Figure 4</xref>. Results for sediment delivery ratio are given in <xref ref-type="fig" rid="ijerph-09-01887-f005">Figure 5</xref>.</p>
      <table-wrap id="ijerph-09-01887-t001" position="anchor">
        <object-id pub-id-type="pii">ijerph-09-01887-t001_Table 1</object-id>
        <label>Table 1</label>
        <caption>
          <p>Statistics concerning the AnnAGNPS simulations of monthly runoff at Wuxi hydrological station during calibration and validation period.</p>
        </caption>
       <table>
          <thead>
            <tr align="center">
              <th valign="middle">Phase</th>
              <th valign="middle">Values</th>
              <th valign="middle">Mean (mm)</th>
              <th valign="middle">SD <sup>a</sup> (mm)</th>
              <th valign="middle">RE <sup>b</sup></th>
              <th valign="middle"><italic>R</italic><sup>2 c</sup></th>
              <th valign="middle">k</th>
              <th valign="middle">NSE <sup>d</sup></th>
              <th valign="middle">RMSE(%) <sup>e</sup></th>
            </tr>
          </thead>
          <tbody>
            <tr align="center">
              <td valign="middle">Calibration</td>
              <td valign="middle">Observed</td>
              <td valign="middle">81.97</td>
              <td valign="middle">109.33</td>
              <td valign="middle"> </td>
              <td valign="middle"> </td>
              <td valign="middle"> </td>
              <td valign="middle"> </td>
              <td valign="middle"> </td>
            </tr>
            <tr align="center">
              <td valign="middle"> </td>
              <td valign="middle">Simulated</td>
              <td valign="middle">82.05</td>
              <td valign="middle">120.96</td>
              <td valign="middle">0.01</td>
              <td valign="middle">0.94</td>
              <td valign="middle">1.04</td>
              <td valign="middle">0.94</td>
              <td valign="middle">28</td>
            </tr>
            <tr align="center">
              <td valign="middle">Validation</td>
              <td valign="middle">Observed</td>
              <td valign="middle">61.72</td>
              <td valign="middle">69.62</td>
              <td valign="middle"> </td>
              <td valign="middle"> </td>
              <td valign="middle"> </td>
              <td valign="middle"> </td>
              <td valign="middle"> </td>
            </tr>
            <tr align="center">
              <td valign="middle"> </td>
              <td valign="middle">Simulated</td>
              <td valign="middle">58.08</td>
              <td valign="middle">65.84</td>
              <td valign="middle">−0.06</td>
              <td valign="middle">0.93</td>
              <td valign="middle">0.94</td>
              <td valign="middle">0.93</td>
              <td valign="middle">29</td>
            </tr>
          </tbody>
        </table>
       <table-wrap-foot>
		<fn>
		<p><sup>a</sup> Standard deviation; <sup>b</sup> Relative error; <sup>c</sup> Coefficient of determination; <sup>d</sup> Nash-Sutcliffe coefficient of efficiency; <sup>e</sup> Root mean square error.</p>
		</fn>
		</table-wrap-foot>
      </table-wrap>
      <sec>
        <title>2.1. Model Evaluation</title>
        <p>As shown in <xref ref-type="table" rid="ijerph-09-01887-t001">Table 1</xref>, the total runoff predicted by AnnAGNPS compared well with the observed data (<italic>RE</italic> = 0.01) during the calibration period (1998–1999).
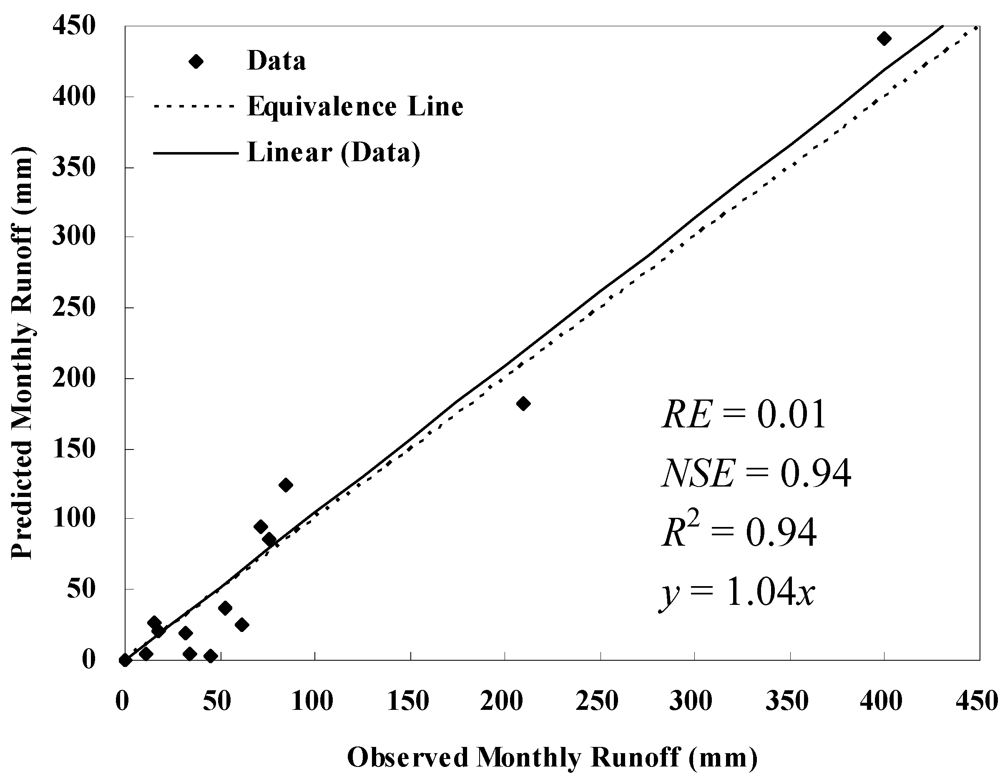
 </p>
		 <fig id="ijerph-09-01887-f001" position="anchor">
        <label>Figure 1</label>
        <caption>
          <p>Comparison of observed and predicted monthly runoff at Wuxi hydrological station during calibration year 1998–1999. </p>
        </caption>
        <graphic xmlns:xlink="http://www.w3.org/1999/xlink" xlink:href="ijerph-09-01887-g001.tif"/>
      </fig>
        <p>In addition, monthly runoff predicted by AnnAGNPS also compared well with the observed data (<italic>NSE</italic> = 0.94), and the regression of the monthly predicted runoff with the observed runoff on the line of equal values was satisfactory, with an <italic>R</italic>-square value of 0.94 (<italic>p</italic> &lt; 0.05) and a slope of 1.04. The mean and standard deviation of simulated runoff were close to the corresponding observed runoff as shown in <xref ref-type="table" rid="ijerph-09-01887-t001">Table 1</xref>. Thus, the model can predict monthly runoff well after calibration (<xref ref-type="fig" rid="ijerph-09-01887-f001">Figure 1</xref>). </p>
        <p>
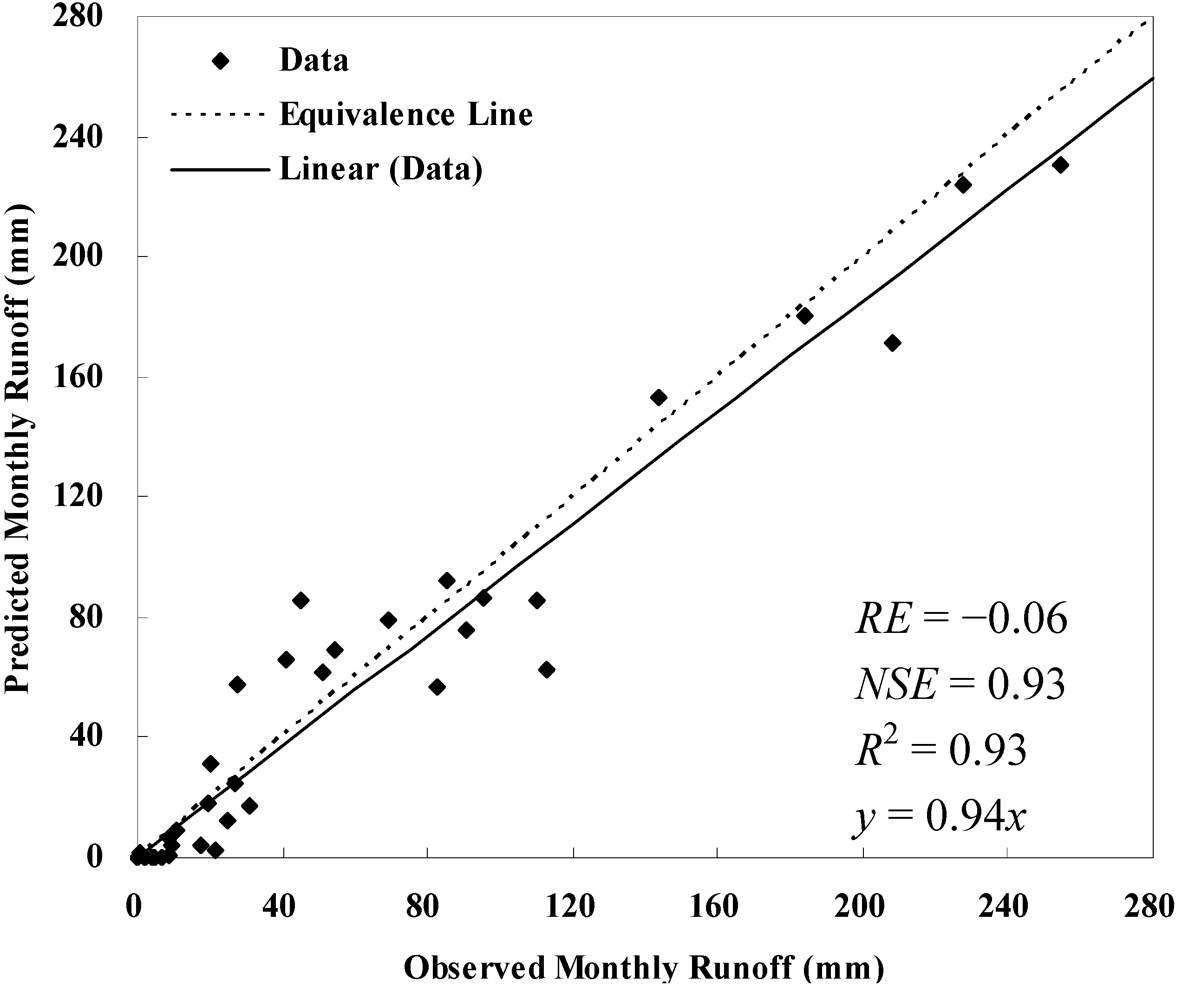
Comparisons of predicted and observed total runoff during the validation period (2003–2005) produced a <italic>RE</italic> of −0.06; and comparisons of predicted and observed monthly runoff during validation period produced a <italic>NSE</italic> of 0.93 and an R-square value of 0.93 (<italic>p</italic> &lt; 0.05), which again demonstrates a satisfactory fit with field data (<xref ref-type="fig" rid="ijerph-09-01887-f002">Figure 2</xref>). </p>
		<fig id="ijerph-09-01887-f002" position="anchor">
        <label>Figure 2</label>
        <caption>
          <p>Comparison of observed and predicted monthly runoff at the Wuxi hydrological station during validation year 2003–2005. </p>
        </caption>
        <graphic xmlns:xlink="http://www.w3.org/1999/xlink" xlink:href="ijerph-09-01887-g002.tif"/>
      </fig>
        <p>Studies performed by Licciardello <italic>et al</italic>. [<xref ref-type="bibr" rid="B22-ijerph-09-01887">22</xref>] in a Mediterranean watershed produced a <italic>NSE</italic> of 0.76 and <italic>RE</italic> of −0.4 for runoff comparison without calibration; after calibration, the <italic>NSE</italic> was 0.84 and <italic>RE</italic> was zero, and the <italic>NSE</italic> was 0.83 and <italic>RE</italic> was 0.32 during validation period. A <italic>NSE</italic> of 0.89 and <italic>RE</italic> of −0.16 for runoff were reported by Zema <italic>et al</italic>. [<xref ref-type="bibr" rid="B23-ijerph-09-01887">23</xref>] on the Ganspoel watershed (Belgium) without calibration. A NSE of 0.82 was achieved by Baginska <italic>et al</italic>. [<xref ref-type="bibr" rid="B24-ijerph-09-01887">24</xref>] on the Currency Creek experimental catchment of the Sydney Region (Australia) after calibration. Based on a thorough review of model evaluation methods done by Moriasi <italic>et al</italic>. [<xref ref-type="bibr" rid="B25-ijerph-09-01887">25</xref>], model simulation can be judged as satisfactory if <italic>NSE</italic> is greater than 0.50 and very good if <italic>NSE</italic> is greater than 0.75 for runoff. Thus, the overall model performance was good. Generally, the monthly runoff events were slightly underpredicted by AnnAGNPS, although a few monthly runoffs were over-predicted (<xref ref-type="fig" rid="ijerph-09-01887-f002">Figure 2</xref>). As pointed out by Yuan <italic>et al</italic>. [<xref ref-type="bibr" rid="B12-ijerph-09-01887">12</xref>], and also demonstrated by Baginska <italic>et al</italic>. [<xref ref-type="bibr" rid="B24-ijerph-09-01887">24</xref>], Licciardello <italic>et al</italic>. [<xref ref-type="bibr" rid="B22-ijerph-09-01887">22</xref>] and Yuan <italic>et al</italic>. [<xref ref-type="bibr" rid="B14-ijerph-09-01887">14</xref>], AnnAGNPS tended to under-predict runoff due to the assumption of a triangular hydrograph and some approximations of model parameters. </p>
        <p>Annual average sediment yields monitored at the Wuxi station during 2000–2002 and 2003–2004 were 1.44 × 10<sup>6</sup> t·y<sup>−1</sup> and 1.09 × 10<sup>6</sup> t·y<sup>−1</sup>, respectively [<xref ref-type="bibr" rid="B26-ijerph-09-01887">26</xref>]. Therefore, average sediment transport per square kilometer was calculated as 722 t·km<sup>−2</sup>·y<sup>−1</sup> for the period of 2000-2002 and 546 t·km<sup>−2</sup>·y<sup>−1</sup> for the period of 2003–2004, with the contribution area of 2000 km<sup>2</sup> above the Wuxi station. Annual average sediment yields predicted by AnnAGNPS were 0.95 × 10<sup>6</sup> t·y<sup>−1</sup> for the period of 2000-2002 and 1.29 × 10<sup>6</sup> t·y<sup>−1</sup> for the period of 2003-2004 with the sediment transport rate of 477 t·km<sup>−2</sup>·y<sup>−1</sup> and 645 t·km<sup>−2</sup>·y<sup>−1</sup>respectively, which are approximately 34% lower than the observed value during 2000–2002 and 18% higher than the observed value during 2003–2004. </p>
        <p>The use of RUSLE technology and the parameters associated with determining soil loss in AnnAGNPS are meant to be used as long term estimates. Yuan <italic>et al</italic>. [<xref ref-type="bibr" rid="B12-ijerph-09-01887">12</xref>] showed that AnnAGNPS adequately predicted average annual sediment load without calibration. Studies performed by Licciardello <italic>et al</italic>. [<xref ref-type="bibr" rid="B22-ijerph-09-01887">22</xref>] had a <italic>NSE</italic> of 0.51 and <italic>RE</italic> of 0.53 for sediment yield at event scale without calibration. A <italic>RE</italic> of 0.59 was achieved by Shrestha <italic>et al</italic>. [<xref ref-type="bibr" rid="B19-ijerph-09-01887">19</xref>] on a watershed in the Siwalik Hills of Nepal. Although no detailed observed sediment data were available for comparisons of the sediment simulation in this study, the <italic>RE</italic> of −0.34 and 0.18 without calibration indicates a satisfactory performance of AnnAGNPS application in simulation sediment. </p>
      </sec>
      <sec>
        <title>2.2. Watershed Soil Erosion and Sediment Yield Simulation of Current Conditions</title>
        <p>Based on terrain, soil, land use, and crop management information and eight-year climatic data from eleven stations in the watershed, results predicted by AnnAGNPS were used in evaluating characteristics of soil erosion, sediment and sediment delivery of the watershed.</p>
        <p>
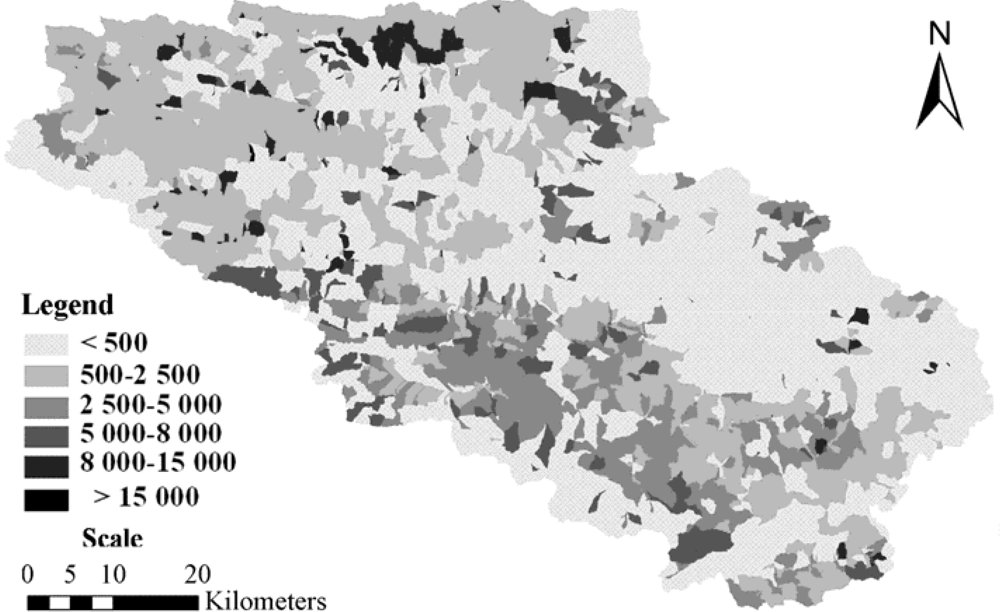
Soil erosion from individual cells was highly spatially variable (<xref ref-type="fig" rid="ijerph-09-01887-f003">Figure 3</xref>). The soil loss tolerance in earth-rock mountainous areas of southwest China is 500 t·km<sup>−2</sup> per year by the Ministry of Water Resources of China. </p>
		<fig id="ijerph-09-01887-f003" position="anchor">
        <label>Figure 3</label>
        <caption>
          <p>Spatial distribution map of average annual soil erosion by AnnAGNPS in the Daning River watershed. </p>
        </caption>
        <graphic xmlns:xlink="http://www.w3.org/1999/xlink" xlink:href="ijerph-09-01887-g003.tif"/>
      </fig>
        <p>Only 48% of the area of the total watershed, total area of 1,996.8 km<sup>2</sup>, is less than the tolerance value. The annual average soil erosion for the entire watershed is 1,551.7 t·km<sup>−2</sup>·y<sup>−1</sup> (<xref ref-type="table" rid="ijerph-09-01887-t002">Table 2</xref>), which is much larger than the tolerance value. A small portion (8%) of the watershed had soil erosion in excess of 5,000 t·km<sup>−2</sup>·y<sup>−1</sup> as shown in <xref ref-type="table" rid="ijerph-09-01887-t002">Table 2</xref>. Therefore, additional soil erosion control measures must be implemented to control soil erosion.</p>
	 <table-wrap id="ijerph-09-01887-t002" position="anchor">
        <object-id pub-id-type="pii">ijerph-09-01887-t002_Table 2</object-id>
        <label>Table 2</label>
        <caption>
          <p>Grades of soil erosion intensity predicted by AnnAGNPS for the watershed.</p>
        </caption>
        <table>
          <thead>
            <tr align="center">
              <th valign="middle">Grades</th>
              <th valign="middle">Soil erosion rate (t·km<sup>−2</sup>·y<sup>−1</sup>)</th>
              <th valign="middle">Area (km<sup>2</sup>)</th>
              <th valign="middle">Percent of area (%)</th>
              <th valign="middle">Average soil erosion rate (t·km<sup>−2</sup>·y<sup>−1</sup>)</th>
            </tr>
          </thead>
          <tbody>
            <tr align="center">
              <td valign="middle">Tiny</td>
              <td valign="middle">&lt;500 </td>
              <td valign="middle">1996.8</td>
              <td valign="middle">47.76</td>
              <td rowspan="6" valign="middle">1,551.7</td>
            </tr>
            <tr align="center">
              <td valign="middle">Slight</td>
              <td valign="middle">500–2,500 </td>
              <td valign="middle">1348.6</td>
              <td valign="middle">32.26</td>
            </tr>
            <tr align="center">
              <td valign="middle">Middle</td>
              <td valign="middle">2,500–5,000 </td>
              <td valign="middle">497.0</td>
              <td valign="middle">11.89</td>
            </tr>
            <tr align="center">
              <td valign="middle">Intense</td>
              <td valign="middle">5,000–8,000 </td>
              <td valign="middle">238.5</td>
              <td valign="middle">5.70</td>
            </tr>
            <tr align="center">
              <td valign="middle">Extreme</td>
              <td valign="middle">8,000–15,000 </td>
              <td valign="middle">99.2</td>
              <td valign="middle">2.37</td>
            </tr>
            <tr align="center">
              <td valign="middle">Violent</td>
              <td valign="middle">&gt;15,000 </td>
              <td valign="middle">0.8</td>
              <td valign="middle">0.02</td>
            </tr>
          </tbody>
        </table>
      </table-wrap>
        <p>The soil erosion amount varied greatly with different land use types (<xref ref-type="table" rid="ijerph-09-01887-t003">Table 3</xref>). The forestland, shrub forestland and higher coverage grassland had low erosion amounts. The sloping land and lower coverage grassland covered 22% and 5% of the total watershed area, respectively, but their erosion amount accounted for 56% and 11% of the watershed total. <xref ref-type="table" rid="ijerph-09-01887-t003">Table 3</xref> indicates that sloping land and lower coverage grassland are the main source of soil loss. Thus, the key of soil loss control is to control erosion from those lands and utilize those lands more rationally.</p>
		<table-wrap id="ijerph-09-01887-t003" position="anchor">
        <object-id pub-id-type="pii">ijerph-09-01887-t003_Table 3</object-id>
        <label>Table 3</label>
        <caption>
          <p>Soil erosion of different land use types predicted by AnnAGNPS.</p>
        </caption>
        <table>
          <thead>
            <tr align="center">
              <th valign="middle">Land use types</th>
              <th valign="middle">Percent of area (%)</th>
              <th valign="middle">Soil erosion (×10<sup>4</sup> t·y<sup>−1</sup>)</th>
              <th valign="middle">Percent of soil erosion (%)</th>
              <th valign="middle">Soil erosion rate (t·km<sup>−2</sup>·y<sup>−1</sup>)</th>
            </tr>
          </thead>
          <tbody>
            <tr align="center">
              <td valign="middle">Paddy field </td>
              <td valign="middle">0.36</td>
              <td valign="middle">0.13</td>
              <td valign="middle">0.02</td>
              <td valign="middle">86.7</td>
            </tr>
            <tr align="center">
              <td valign="middle">Dry field </td>
              <td valign="middle">22.33</td>
              <td valign="middle">364.12</td>
              <td valign="middle">55.59</td>
              <td valign="middle">3900.1</td>
            </tr>
            <tr align="center">
              <td valign="middle">Forestland</td>
              <td valign="middle">14.71</td>
              <td valign="middle">19.73</td>
              <td valign="middle">3.07</td>
              <td valign="middle">320.7</td>
            </tr>
            <tr align="center">
              <td valign="middle">Shrub Forestland</td>
              <td valign="middle">45.28</td>
              <td valign="middle">111.15</td>
              <td valign="middle">17.32</td>
              <td valign="middle">587.1</td>
            </tr>
            <tr align="center">
              <td valign="middle">Sparse forestland</td>
              <td valign="middle">1.56</td>
              <td valign="middle">9.33</td>
              <td valign="middle">1.52</td>
              <td valign="middle">1,430.9</td>
            </tr>
            <tr align="center">
              <td valign="middle">Higher coverage grassland</td>
              <td valign="middle">1.26</td>
              <td valign="middle">1.92</td>
              <td valign="middle">0.38</td>
              <td valign="middle">364.4</td>
            </tr>
            <tr align="center">
              <td valign="middle">Medium coverage Grassland </td>
              <td valign="middle">9.13</td>
              <td valign="middle">69.99</td>
              <td valign="middle">11.23</td>
              <td valign="middle">1,833.5</td>
            </tr>
            <tr align="center">
              <td valign="middle">Lower coverage Grassland </td>
              <td valign="middle">5.34</td>
              <td valign="middle">72.43</td>
              <td valign="middle">10.90</td>
              <td valign="middle">3,242.3</td>
            </tr>
            <tr align="center">
              <td valign="middle">Stream </td>
              <td valign="middle">0.02</td>
              <td valign="middle">0</td>
              <td valign="middle">0</td>
              <td valign="middle">0</td>
            </tr>
            <tr align="center">
              <td valign="middle">Residential areas</td>
              <td valign="middle">0.01</td>
              <td valign="middle">0</td>
              <td valign="middle">0</td>
              <td valign="middle">0</td>
            </tr>
            <tr align="center">
              <td valign="middle">Total</td>
              <td valign="middle">100.00</td>
              <td valign="middle">648.80</td>
              <td valign="middle">100.00</td>
              <td valign="middle">1,551.7</td>
            </tr>
          </tbody>
        </table>
      </table-wrap>
        <p>
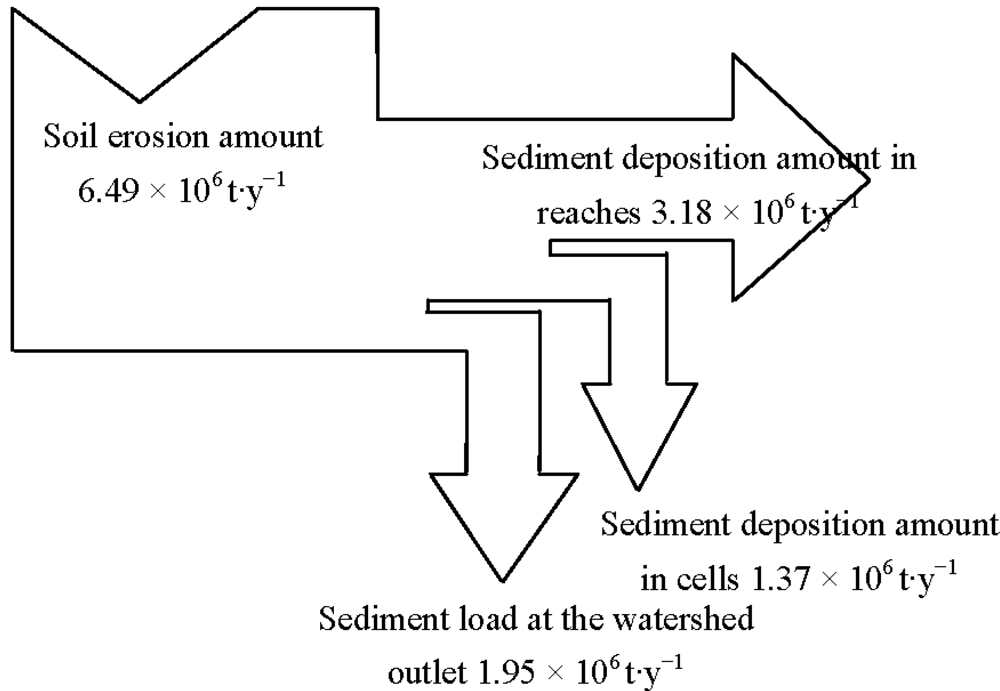
Soil erosion is the first step in the sedimentation processes which consist of erosion, transportation and deposition of sediments. A fraction of the eroded soil passes through the channel system and contributes to sediment yield, while much of soil deposits in landscape and water channels before reaching the outlet. Defining a sediment budget can help to better understand the sources, pathways and sinks (deposits) of sediment within a watershed system. The sediment budget of the watershed (<xref ref-type="fig" rid="ijerph-09-01887-f004">Figure 4</xref>) shows that the average annual erosion amount of the Daning River watershed was 6.49 million tons, 21% deposited in the cells, 49% stored in the stream channels, and the rest was the output of the watershed. To reduce sediment loss at the watershed outlet, it is important to have more soil deposited in the cells. Thus, more conservation practices such as buffers should be adopted at the landscape scale to reduce sediment loss.</p>
		<fig id="ijerph-09-01887-f004" position="anchor">
        <label>Figure 4</label>
        <caption>
          <p>Annual sediment budget for Daning River watershed predicted by AnnAGNPS. Arrow thickness is proportional to the amount of sediment input or output.
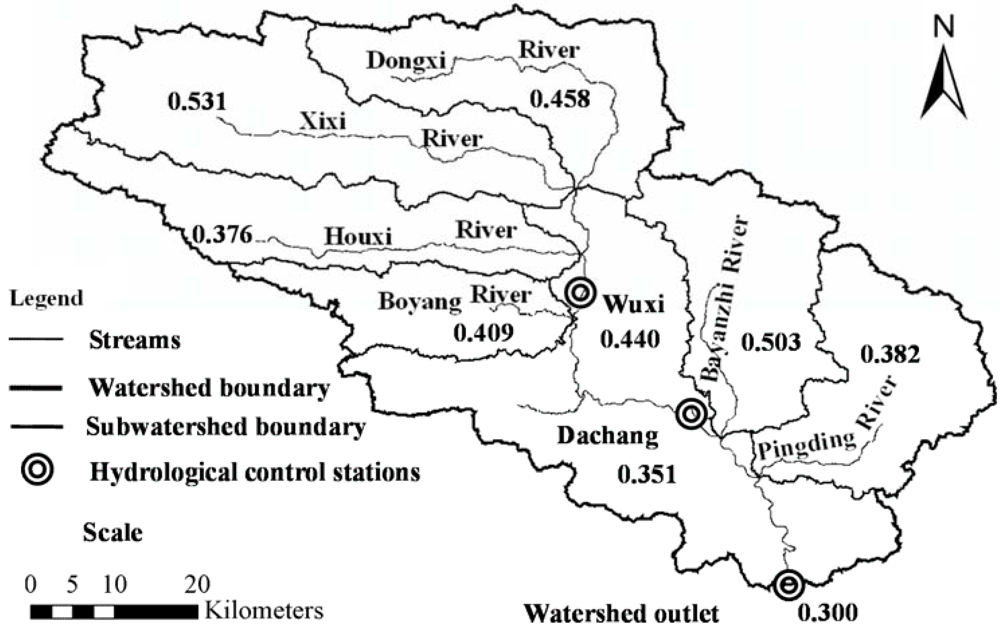
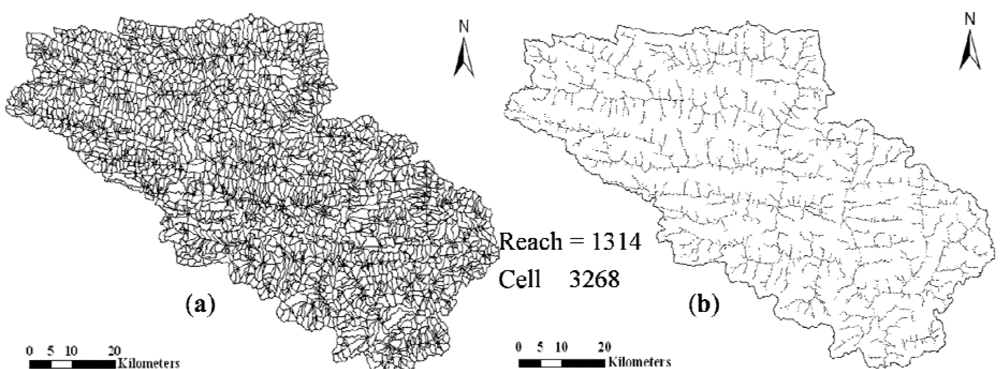
</p>
        </caption>
        <graphic xmlns:xlink="http://www.w3.org/1999/xlink" xlink:href="ijerph-09-01887-g004.tif"/>
      </fig>
        <p><xref ref-type="table" rid="ijerph-09-01887-t004">Table 4</xref> shows annual average runoff and sediment characteristics from the main stem and six important tributaries in the watershed, which were also discretized by AGNPS 2001 data preparation tools using a CSA value of 8,000 ha and an MSCL value of 2,000 m. The contribution areas above Wuxi and Dachang stations are 2,000 and 3,050 km<sup>2</sup>, respectively. </p>
        <p>Among the six tributaries, Dongxi River, Xixi River, Houxi River, Boyang River, Bayanzhi River and Pingding River which altogether are about 73% of the entire watershed, Xixi River and Boyang River are the largest and smallest subwatersheds respectively (<xref ref-type="table" rid="ijerph-09-01887-t004">Table 4</xref>). </p>
        <p>The entire watershed can be classified into upper (above the Wuxing station), middle (between Wuxi and Dachang station) and lower (from Dachang station to the entire watershed outlet) watershed. Average annual sediment yield is 1.25 × 10<sup>6</sup> t·y<sup>−1</sup> at the Wuxing station of the upper watershed, rapidly adds up to 1.81 × 10<sup>6</sup> t·y<sup>−1</sup> at the Dachang station at the middle watershed, whereas it increases slowly in the lower watershed, with only 1.95 × 10<sup>6</sup> t·y<sup>−1</sup> at the watershed outlet. This indicates that the total 1.95 × 10<sup>6</sup> t·y<sup>−1</sup> sediment yield, 64% comes from the upper, 29% from the middle and 7% from the downstream watershed, respectively. Among the six tributaries, the Dongxi River, with the average annual sediment yield of 5.23 × 10<sup>5</sup> t, about 27% of the total sediment yield, had the largest sediment contribution to the entire watershed. Dongxi River watershed, with a large amount of deep sloping lands and lower coverage grassland, will need more conservation measures implemented to reduce sediment loss. In addition, strategies of controlling bank erosion should also be sought to reduce sediment loss from this mechanism. Boyang River with the largest runoff, 565.2 mm·y<sup>−1</sup> in six tributaries, yielded 3.16 × 10<sup>5</sup> tons sediment per year, which was about 16% of the entire watershed. Bayangzhi River watershed had the least soil erosion of 766.6 t·km<sup>−2</sup>·y<sup>−1</sup>, followed by Pingding River watershed (1,054.9 t·km<sup>−2</sup>·y<sup>−1</sup>). The reason that these two subwatersheds had low soil erosion is that most of the watershed area was covered by forestland and shrub forestland. </p>
	 <table-wrap id="ijerph-09-01887-t004" position="anchor">
        <object-id pub-id-type="pii">ijerph-09-01887-t004_Table 4</object-id>
        <label>Table 4</label>
        <caption>
          <p>Annual average runoff and sediment characteristics from main stem and six important tributaries predicted by AnnAGNPS in the Daning River watershed.</p>
        </caption>
         <table>
          <thead>
            <tr align="center">
              <th valign="middle">Name <sup>a</sup></th>
              <th valign="middle">Area (km<sup>2</sup>)</th>
              <th valign="middle">Runoff volume (×10<sup>8</sup> m<sup>3</sup>·y<sup>−1</sup>)</th>
              <th valign="middle">PR <sup>b</sup>(%)</th>
              <th valign="middle">Runoff depth (mm·y<sup>−1</sup>)</th>
              <th valign="middle">Sediment yield (×10<sup>4</sup> t·y<sup>−1</sup>)</th>
              <th valign="middle">PSY <sup>c</sup>(%)</th>
              <th valign="middle">STR <sup>d</sup> (t·km<sup>−2</sup>·y<sup>−1</sup>)</th>
              <th valign="middle">Soil erosion (×10<sup>4</sup> t·y<sup>−1</sup>)</th>
              <th valign="middle">SER <sup>e</sup> (t·km<sup>−2</sup>·y<sup>−1</sup>)</th>
              <th valign="middle">PSE <sup>f</sup>(%)</th>
            </tr>
          </thead>
          <tbody>
            <tr align="center">
              <td valign="middle">Dongxi River</td>
              <td valign="middle">542.0</td>
              <td valign="middle">2.7</td>
              <td valign="middle">14.52</td>
              <td valign="middle">501.8</td>
              <td valign="middle">52.3</td>
              <td valign="middle">26.88</td>
              <td valign="middle">965.8</td>
              <td valign="middle">114.3</td>
              <td valign="middle">2108.0</td>
              <td valign="middle">17.61</td>
            </tr>
            <tr align="center">
              <td valign="middle">Xixi River</td>
              <td valign="middle">750.9</td>
              <td valign="middle">3.9</td>
              <td valign="middle">20.97</td>
              <td valign="middle">524.1</td>
              <td valign="middle">48.8</td>
              <td valign="middle">25.08</td>
              <td valign="middle">650.1</td>
              <td valign="middle">91.9</td>
              <td valign="middle">1223.9</td>
              <td valign="middle">14.17</td>
            </tr>
            <tr align="center">
              <td valign="middle">Houxi River</td>
              <td valign="middle">514.8</td>
              <td valign="middle">2.8</td>
              <td valign="middle">15.05</td>
              <td valign="middle">540.7</td>
              <td valign="middle">24.0</td>
              <td valign="middle">12.33</td>
              <td valign="middle">465.8</td>
              <td valign="middle">63.7</td>
              <td valign="middle">1237.7</td>
              <td valign="middle">9.82</td>
            </tr>
            <tr align="center">
              <td valign="middle">Boyang River</td>
              <td valign="middle">284.3</td>
              <td valign="middle">1.6</td>
              <td valign="middle">8.60</td>
              <td valign="middle">565.2</td>
              <td valign="middle">31.6</td>
              <td valign="middle">16.24</td>
              <td valign="middle">1,111.2</td>
              <td valign="middle">77.2</td>
              <td valign="middle">2715.0</td>
              <td valign="middle">11.90</td>
            </tr>
            <tr align="center">
              <td valign="middle">BayanzhiRiver</td>
              <td valign="middle">463.0</td>
              <td valign="middle">1.4</td>
              <td valign="middle">7.53</td>
              <td valign="middle">299.9</td>
              <td valign="middle">19.0</td>
              <td valign="middle">9.76</td>
              <td valign="middle">410.3</td>
              <td valign="middle">35.5</td>
              <td valign="middle">766.6</td>
              <td valign="middle">5.47</td>
            </tr>
            <tr align="center">
              <td valign="middle">Pingding River</td>
              <td valign="middle">485.1</td>
              <td valign="middle">1.8</td>
              <td valign="middle">9.68</td>
              <td valign="middle">378.1</td>
              <td valign="middle">19.5</td>
              <td valign="middle">10.02</td>
              <td valign="middle">402.8</td>
              <td valign="middle">51.2</td>
              <td valign="middle">1,054.9</td>
              <td valign="middle">7.89</td>
            </tr>
            <tr align="center">
              <td valign="middle">Wuxi station</td>
              <td valign="middle">2,000.0</td>
              <td valign="middle">10.3</td>
              <td valign="middle">55.38</td>
              <td valign="middle">513.4</td>
              <td valign="middle">124.6</td>
              <td valign="middle">64.03</td>
              <td valign="middle">623.1</td>
              <td valign="middle">283.5</td>
              <td valign="middle">1,417.4</td>
              <td valign="middle">43.69</td>
            </tr>
            <tr align="center">
              <td valign="middle">Dachang station</td>
              <td valign="middle">3,050.0</td>
              <td valign="middle">15.3</td>
              <td valign="middle">82.26</td>
              <td valign="middle">500.1</td>
              <td valign="middle">181.2</td>
              <td valign="middle">93.11</td>
              <td valign="middle">594.1</td>
              <td valign="middle">516.0</td>
              <td valign="middle">1,691.7</td>
              <td valign="middle">79.53</td>
            </tr>
            <tr align="center">
              <td valign="middle">Watershed outlet</td>
              <td valign="middle">4,181.0</td>
              <td valign="middle">18.6</td>
              <td valign="middle">100.00</td>
              <td valign="middle">444.9</td>
              <td valign="middle">194.6</td>
              <td valign="middle">100.00</td>
              <td valign="middle">465.3</td>
              <td valign="middle">648.8</td>
              <td valign="middle">1,551.7</td>
              <td valign="middle">100.00</td>
            </tr>
          </tbody>
        </table>
		<table-wrap-foot>
		<fn>
		<p><sup>a</sup> Name of subwatersheds and hydrological control stations; <sup>b</sup> Percent of the total runoff; <sup>c</sup> Percent of the total soil yield; <sup>d</sup> Sediment transport rate; <sup>e</sup> Sediment erosion rate; <sup>f</sup> Percent of the total soil erosion.</p>
		</fn>
		</table-wrap-foot>
      </table-wrap>   
      </sec>
      <sec>
        <title>2.3. Evaluation of Sediment Delivery Ratio of the Watershed</title>
        <p>Sediment yield is a critical factor in identifying non-point source pollution as well as in design and construction of dams and reservoirs. However, sediment yield is usually not available as a direct measurement but estimated by using a sediment delivery ratio (SDR) [<xref ref-type="bibr" rid="B27-ijerph-09-01887">27</xref>]. An accurate prediction of SDR is important in controlling sediments for sustainable natural resources development and environmental protection. </p>
        <p><xref ref-type="fig" rid="ijerph-09-01887-f005">Figure 5</xref> shows the spatial distribution of SDR of the watershed. Estimated SDRs range from 0.376 to 0.531 in six tributaries, which is consistent with the ranges from 0.15 to 0.61 for main watersheds in the Three-Gorge area of the Yangtze River [<xref ref-type="bibr" rid="B28-ijerph-09-01887">28</xref>]. SDR of the whole watershed is approximately 0.30. The maximum SDR is 0.531 in the Xixi River watershed, and the minimum SDR is 0.376 in the Houxi River watershed. The reason for the variation of SDR is that each subwatershed varies greatly not only in the drainage area, but also in slope, relief-length ratio, runoff-rainfall factors, land use/land cover and sediment particle size. This SDR information is useful for future conservation planning of the watershed for effective soil erosion control and sediment loss.</p>
		<fig id="ijerph-09-01887-f005" position="anchor">
        <label>Figure 5</label>
        <caption>
          <p>Spatial distribution of sediment delivery ration (SDR) predicted by AnnAGNPS in the Daning River watershed.</p>
        </caption>
        <graphic xmlns:xlink="http://www.w3.org/1999/xlink" xlink:href="ijerph-09-01887-g005.tif"/>
      </fig>
      </sec>
    </sec>
    <sec sec-type="methods">
      <title>3. Methods and Procedures</title>
      <sec>
        <title>3.1. AnnAGNPS Model Description</title>
        <p>The Annualized Agricultural Nonpoint Source Pollution (AnnAGNPS) model is an advanced technological watershed evaluation tool that has been developed through a partnership between the U.S. Department of Agriculture (USDA)—Agriculture Research Service (ARS) and the USDA—Natural Resources Conservation Service (NRCS) to aid in the evaluation of watershed responses to agricultural management practices [<xref ref-type="bibr" rid="B3-ijerph-09-01887">3</xref>,<xref ref-type="bibr" rid="B5-ijerph-09-01887">5</xref>,<xref ref-type="bibr" rid="B12-ijerph-09-01887">12</xref>,<xref ref-type="bibr" rid="B29-ijerph-09-01887">29</xref>]. AnnAGNPS is a continuous-simulation, daily time-step, pollutant loading model designed to simulate long-term chemical and sediment movement from agricultural watersheds; and it includes significantly more advanced features than AGNPS [<xref ref-type="bibr" rid="B6-ijerph-09-01887">6</xref>]. The spatial variability of soils, land use, and topography within a watershed is accounted for by dividing the watershed into many user-specified, homogeneous, drainage-area-determined cells. Runoff, sediment, and chemicals are routed from each cell through a channel network to the outlet of the watershed. The model has the capability to identify the sources of pollutants at their origin and to track them as they move through the watershed system. The surface runoff from a field is determined using the Soil Conservation Service Curve Number (SCS-CN) technique [<xref ref-type="bibr" rid="B30-ijerph-09-01887">30</xref>] within AnnAGNPS. The peak flow is calculated by the extended TR-55 technique [<xref ref-type="bibr" rid="B31-ijerph-09-01887">31</xref>]. The lateral subsurface flow and tile drainage are also accounted for in the model. Runoff in channels is calculated using Manning’s equation. Soil erosion from each field is predicted by Revised Universal Soil Loss Equation (RUSLE) [<xref ref-type="bibr" rid="B32-ijerph-09-01887">32</xref>]. The sediment yield leaving each field is based upon the Hydro–Geomorphic Universal Soil Loss Equation (HUSLE) [<xref ref-type="bibr" rid="B33-ijerph-09-01887">33</xref>]. The sediment reach routing is based on a modified Einstein deposition equation [<xref ref-type="bibr" rid="B34-ijerph-09-01887">34</xref>] using the Bagnold suspended sediment formula for the transport capacity by particle size class. The model can be used to study the effects of alternative cropping and tillage systems including the effects of fertilizer, pesticide, and irrigation application rates as well as point source yields and feedlot management [<xref ref-type="bibr" rid="B12-ijerph-09-01887">12</xref>].</p>
        <p>Required input parameters for application of the model include climate data, watershed physical information, and management information. Daily climate information, which includes daily precipitation, maximum and minimum temperatures, dew point temperature, cloud cover, and wind speed, is needed to account for temporal variation in the weather. Climate data for simulation can be historically measured, synthetically generated using the climate generator program [<xref ref-type="bibr" rid="B35-ijerph-09-01887">35</xref>], or a combination of the two. GIS data layers of a watershed are extremely helpful in characterizing the watershed physical information. </p>
        <p>Using the GIS digital data layers of digital elevation model, soils, and land-use, a majority of the data input requirements of AnnAGNPS were developed by using a customized ArcView GIS interface. Inputs developed from the ArcView GIS interface include physical information of the watershed and subwatershed (AnnAGNPS cell), such as boundary and size, land slope and slope direction, and channel reach (AnnAGNPS reach) descriptions. The ArcView GIS interface also assigned a soil and land-use type to each cell by using the generated subwatershed and the soil and land-use GIS data layers. Additional steps to provide the model with the necessary inputs included developing the soil layer attributes to supplement the soil spatial layer, establishing the different crop operation and management data, and providing channel hydraulic characteristics. Those inputs can be organized using the AnnAGNPS Input Editor, a graphical user interface designed to aid users in selecting appropriate input parameters. Management information includes various field management operations such as planting, cultivation, fertilization, pesticides and harvesting, much of which can be obtained from RUSLE [<xref ref-type="bibr" rid="B31-ijerph-09-01887">31</xref>] databases or from actual activities implemented. </p>
        <p>Output information produced by the model includes runoff, sediment, nutrient and pesticide loads at a temporal scale ranging from daily to yearly and at any desired location such as specific cells, stream reaches, feedlots, gullies, or point sources. The model also has the capability to provide source accounting information in terms of the fraction of a pollutant load passing through any reach location that originated from an upstream watershed pollutant source area. Further details on the theoretical background of AnnAGNPS can be found in the literature [<xref ref-type="bibr" rid="B3-ijerph-09-01887">3</xref>,<xref ref-type="bibr" rid="B5-ijerph-09-01887">5</xref>,<xref ref-type="bibr" rid="B30-ijerph-09-01887">30</xref>,<xref ref-type="bibr" rid="B36-ijerph-09-01887">36</xref>]. </p>
      </sec>
      <sec>
        <title>3.2. Watershed Description</title>
        <p>The study area is the Daning River watershed (108°44' to 110°11' E, 31°04' to 31°44' N), which is located in the center of the Three-Gorge reservoir area of the Yangtze River, China (<xref ref-type="fig" rid="ijerph-09-01887-f006">Figure 6</xref>). The entire watershed has a contributing drainage area of about 4,181 km<sup>2</sup> and drains into the Yangtze River. The terrain is undulating, ranging from 95 m to 2,793 m above sea-level, and the slope varies from 0 to 138%, which is derived from 1:50,000 DEM. The region has a subtropical humid-warm climate, with annual average temperatures of around 19.8 °C. Annual rainfall ranges from 1,000 mm in the valleys to 1,700 mm in the high mountain areas of the watershed with large variation from year to year. Over 87% of the rainfall occurs between April and October, which markedly affects runoff and soil erosion. The main crops grown in the Daning River watershed are rice, wheat, maize and rape. The soils in the study area vary from sandy loams to loamy sands with most of the soil types in the watershed classified as clay loam. The dominant soil in the watershed is yellow soil and yellow limestone soil, which represents almost 50% of the watershed. Major soil types in the watershed and their basic physical and chemical properties are listed in <xref ref-type="table" rid="ijerph-09-01887-t005">Table 5</xref>. </p>
        <fig id="ijerph-09-01887-f006" position="anchor">
          <label>Figure 6</label>
          <caption>
            <p>Location of the study watershed.</p>
          </caption>
          <graphic xmlns:xlink="http://www.w3.org/1999/xlink" xlink:href="ijerph-09-01887-g006.tif"/>
        </fig>
        <table-wrap id="ijerph-09-01887-t005" position="anchor">
          <object-id pub-id-type="pii">ijerph-09-01887-t005_Table 5</object-id>
          <label>Table 5</label>
          <caption>
            <p>Predominant soils of the Daning River watershed and their basic characteristics (Chinese Soil Taxonomic Classification).</p>
          </caption>
         <table>
            <thead>
              <tr align="left">
                <th rowspan="2" valign="middle">Soil</th>
                <th rowspan="2" valign="middle">Area (%)</th>
                <th rowspan="2" valign="middle">HG <sup>a</sup></th>
                <th rowspan="2" valign="middle">Clay (%)</th>
                <th rowspan="2" valign="middle">Silt (%)</th>
                <th rowspan="2" valign="middle">Sand (%)</th>
                <th rowspan="2" valign="middle">Rock (%)</th>
                <th rowspan="2" valign="middle">pH</th>
                <th rowspan="2" valign="middle">OM<sup> b</sup>(%) </th>
                <th rowspan="2" valign="middle"><italic>K</italic> (t·ha·h·ha<sup>−1</sup>·MJ<sup>−1</sup>·mm<sup>−1</sup>) <sup>c</sup></th>
                <th valign="middle">Field capacity <sup>d</sup></th>
                <th valign="middle">Wilting point <sup>d</sup></th>
                <th rowspan="2" valign="middle">Saturated water conductivity (mm·h<sup>−1</sup>)</th>
              </tr>
              <tr style="border-top:solid thin">
                <th colspan="2" valign="middle">(cm<sup>3</sup>water· cm<sup>−3</sup>soil)</th>
              </tr>
            </thead>
          <tbody>
            <tr align="left">
              <td valign="middle">Yellow soil</td>
              <td valign="middle">34.6</td>
              <td valign="middle">D</td>
              <td valign="middle">26.5</td>
                <td valign="middle">37.7</td>
                <td valign="middle">35. 8</td>
                <td valign="middle">13.7</td>
                <td valign="middle">5.9</td>
                <td valign="middle">2.9</td>
                <td valign="middle">0.033</td>
                <td valign="middle">0.291</td>
                <td valign="middle">0.152</td>
                <td valign="middle">4.9</td>
            </tr>
              <tr align="left">
                <td valign="middle">Skeletal yellow soil</td>
                <td valign="middle">10.0</td>
                <td valign="middle">B</td>
                <td valign="middle">14.0</td>
                <td valign="middle">41.2</td>
                <td valign="middle">44.7</td>
                <td valign="middle">16.3</td>
                <td valign="middle">7.9</td>
                <td valign="middle">1.5</td>
                <td valign="middle">0.040</td>
                <td valign="middle">0.242</td>
                <td valign="middle">0.104</td>
                <td valign="middle">16.5</td>
            </tr>
              <tr align="left">
                <td valign="middle">Yellow-brown soil</td>
                <td valign="middle">18.6</td>
                <td valign="middle">D</td>
                <td valign="middle">30.1</td>
                <td valign="middle">34.1</td>
                <td valign="middle">35.9</td>
                <td valign="middle">26.3</td>
                <td valign="middle">5.8</td>
                <td valign="middle">3.6</td>
                <td valign="middle">0.030</td>
                <td valign="middle">0.305</td>
                <td valign="middle">0.169</td>
                <td valign="middle">3.6</td>
            </tr>
              <tr align="left">
                <td valign="middle">Skeletal yellow-brown soil</td>
                <td valign="middle">6.3</td>
                <td valign="middle">D</td>
                <td valign="middle">29.9</td>
                <td valign="middle">37.6</td>
                <td valign="middle">32.4</td>
                <td valign="middle">13.7</td>
                <td valign="middle">6.1</td>
                <td valign="middle">2.5</td>
                <td valign="middle">0.034</td>
                <td valign="middle">0.310</td>
                <td valign="middle">0.168</td>
                <td valign="middle">3.9</td>
            </tr>
              <tr align="left">
                <td valign="middle">Brown soil</td>
                <td valign="middle">7.3</td>
                <td valign="middle">B</td>
                <td valign="middle">21.6</td>
                <td valign="middle">41.5</td>
                <td valign="middle">36.8</td>
                <td valign="middle">21.4</td>
                <td valign="middle">5.5</td>
                <td valign="middle">7.6</td>
                <td valign="middle">0.033</td>
                <td valign="middle">0.273</td>
                <td valign="middle">0.131</td>
                <td valign="middle">7.7</td>
            </tr>
              <tr align="left">
                <td valign="middle">Yellow limestone soil </td>
                <td valign="middle">14.9</td>
                <td valign="middle">D</td>
                <td valign="middle">28.5</td>
                <td valign="middle">34.6</td>
                <td valign="middle">36.9</td>
                <td valign="middle">42.8</td>
                <td valign="middle">5.5</td>
                <td valign="middle">2.7</td>
                <td valign="middle">0.032</td>
                <td valign="middle">0.297</td>
                <td valign="middle">0.162</td>
                <td valign="middle">4.0</td>
            </tr>
              <tr align="left">
                <td valign="middle">Primary calcareous purple soil</td>
                <td valign="middle">4.2</td>
                <td valign="middle">B</td>
                <td valign="middle">22.6</td>
                <td valign="middle">39.9</td>
                <td valign="middle">37.5</td>
                <td valign="middle">2.2</td>
                <td valign="middle">6.7</td>
                <td valign="middle">3.5</td>
                <td valign="middle">0.032</td>
                <td valign="middle">0.275</td>
                <td valign="middle">0.135</td>
                <td valign="middle">6.9</td>
            </tr>
              <tr align="left">
                <td valign="middle">Mountain meadow soil</td>
                <td valign="middle">1.0</td>
                <td valign="middle">B</td>
                <td valign="middle">20.1</td>
                <td valign="middle">38.1</td>
                <td valign="middle">41. 8</td>
                <td valign="middle">11.8</td>
                <td valign="middle">5.4</td>
                <td valign="middle">10.0</td>
                <td valign="middle">0.031</td>
                <td valign="middle">0.260</td>
                <td valign="middle">0.126</td>
                <td valign="middle">8.4</td>
            </tr>
              <tr align="left">
                <td valign="middle">Other</td>
                <td valign="middle">3.1</td>
                <td valign="middle"> </td>
                <td valign="middle"> </td>
                <td valign="middle"> </td>
                <td valign="middle"> </td>
                <td valign="middle"> </td>
                <td valign="middle"> </td>
                <td valign="middle"> </td>
                <td valign="middle"> </td>
                <td valign="middle"> </td>
                <td valign="middle"> </td>
                <td valign="middle"> </td>
            </tr>
          </tbody>
          </table>
		  <table-wrap-foot>
		  <fn>
		  <p><sup>a</sup> Soil Hydrological group; <sup>b</sup> Organic matter; <sup>c</sup> Soil erodibility factor; <sup>d</sup> Derived from Saxton <italic>et al</italic>.(1986) based on clay and sand ratios.</p>
		  </fn>
		  </table-wrap-foot>
        </table-wrap>
        <p>Detailed records of agricultural operations including tillage, planting, harvesting, and fertilization have been maintained since 1998. The operation management of four main crops related to this study is listed in <xref ref-type="table" rid="ijerph-09-01887-t006">Table 6</xref>.</p>
        <table-wrap id="ijerph-09-01887-t006" position="anchor">
          <object-id pub-id-type="pii">ijerph-09-01887-t006_Table 6</object-id>
          <label>Table 6</label>
          <caption>
            <p>Major crops grown, management schedules and management operations identified in the watershed.</p>
          </caption>
          <table>
            <thead>
              <tr>
                <th align="left" valign="middle">Management schedules</th>
                <th align="left" valign="middle">Event date (day/month)</th>
                <th align="left" valign="middle">Management operations </th>
                <th align="left" valign="middle">Crop</th>
              </tr>
            </thead>
            <tbody>
              <tr>
                <td align="left" valign="middle">Rice-Rape</td>
                <td align="left" valign="middle">10/05</td>
                <td align="left" valign="middle">Tillage/Fertilizer</td>
                <td align="left" valign="middle">Rice</td>
              </tr>
              <tr>
                <td align="left" valign="middle"> </td>
                <td align="left" valign="middle">11/05</td>
                <td align="left" valign="middle">Irrigation</td>
                <td align="left" valign="middle"> </td>
              </tr>
              <tr>
                <td align="left" valign="middle"> </td>
                <td align="left" valign="middle">18/05</td>
                <td align="left" valign="middle">Fertilizer</td>
                <td align="left" valign="middle"> </td>
              </tr>
              <tr>
                <td align="left" valign="middle"> </td>
                <td align="left" valign="middle">3/06</td>
                <td align="left" valign="middle">Fertilizer</td>
                <td align="left" valign="middle"> </td>
              </tr>
              <tr>
                <td align="left" valign="middle"> </td>
                <td align="left" valign="middle">5/07</td>
                <td align="left" valign="middle">Fertilizer</td>
                <td align="left" valign="middle"> </td>
              </tr>
              <tr>
                <td align="left" valign="middle"> </td>
                <td align="left" valign="middle">10/9</td>
                <td align="left" valign="middle">Harvesting</td>
                <td align="left" valign="middle"> </td>
              </tr>
              <tr>
                <td align="left" valign="middle"> </td>
                <td align="left" valign="middle">11/10</td>
                <td align="left" valign="middle">Tillage/Fertilizer</td>
                <td align="left" valign="middle">Rape</td>
              </tr>
              <tr>
                <td align="left" valign="middle"> </td>
                <td align="left" valign="middle">15/10</td>
                <td align="left" valign="middle">Fertilizer</td>
                <td align="left" valign="middle"> </td>
              </tr>
              <tr>
                <td align="left" valign="middle"> </td>
                <td align="left" valign="middle">15/10</td>
                <td align="left" valign="middle">Seeding</td>
                <td align="left" valign="middle"> </td>
              </tr>
              <tr>
                <td align="left" valign="middle"> </td>
                <td align="left" valign="middle">10/11</td>
                <td align="left" valign="middle">Fertilizer</td>
                <td align="left" valign="middle"> </td>
              </tr>
              <tr>
                <td align="left" valign="middle"> </td>
                <td align="left" valign="middle">26/02</td>
                <td align="left" valign="middle">Fertilizer</td>
                <td align="left" valign="middle"> </td>
              </tr>
              <tr>
                <td align="left" valign="middle"> </td>
                <td align="left" valign="middle">5/05</td>
                <td align="left" valign="middle">Harvesting</td>
                <td align="left" valign="middle"> </td>
              </tr>
              <tr style="border-top:solid thin">
                <td align="left" valign="middle">Maize-wheat</td>
                <td align="left" valign="middle">23/05</td>
                <td align="left" valign="middle">Tillage/Fertilizer</td>
                <td align="left" valign="middle">Maize</td>
              </tr>
              <tr>
                <td align="left" valign="middle"> </td>
                <td align="left" valign="middle">26/05</td>
                <td align="left" valign="middle">Fertilizer</td>
                <td align="left" valign="middle"> </td>
              </tr>
              <tr>
                <td align="left" valign="middle"> </td>
                <td align="left" valign="middle">26/05</td>
                <td align="left" valign="middle">Seeding</td>
                <td align="left" valign="middle"> </td>
              </tr>
              <tr>
                <td align="left" valign="middle"> </td>
                <td align="left" valign="middle">6/07</td>
                <td align="left" valign="middle">Fertilizer</td>
                <td align="left" valign="middle"> </td>
              </tr>
              <tr>
                <td align="left" valign="middle"> </td>
                <td align="left" valign="middle">13/09</td>
                <td align="left" valign="middle">Harvesting</td>
                <td align="left" valign="middle"> </td>
              </tr>
              <tr>
                <td align="left" valign="middle"> </td>
                <td align="left" valign="middle">2/11</td>
                <td align="left" valign="middle">Tillage/Fertilizer</td>
                <td align="left" valign="middle">Wheat</td>
              </tr>
              <tr>
                <td align="left" valign="middle"> </td>
                <td align="left" valign="middle">5/11</td>
                <td align="left" valign="middle">Fertilizer</td>
                <td align="left" valign="middle"> </td>
              </tr>
              <tr>
                <td align="left" valign="middle"> </td>
                <td align="left" valign="middle">5/11</td>
                <td align="left" valign="middle">Seeding</td>
                <td align="left" valign="middle"> </td>
              </tr>
              <tr>
                <td align="left" valign="middle"> </td>
                <td align="left" valign="middle">12/02</td>
                <td align="left" valign="middle">Fertilizer</td>
                <td align="left" valign="middle"> </td>
              </tr>
              <tr>
                <td align="left" valign="middle"> </td>
                <td align="left" valign="middle">10/03</td>
                <td align="left" valign="middle">Fertilizer</td>
                <td align="left" valign="middle"> </td>
              </tr>
              <tr>
                <td align="left" valign="middle"> </td>
                <td align="left" valign="middle">15/05</td>
                <td align="left" valign="middle">Harvesting</td>
                <td align="left" valign="middle"> </td>
              </tr>
            </tbody>
          </table>
        </table-wrap>
        <p>Daily runoff data at the Wuxi monitoring station during 1998 and 2005 were obtained from the Ministry of Water Resources of China. Runoff was monitored using a velocity instrument method, <italic>i.e.</italic>, the two point method and the eleven point method. The two point method, employed for the low water level in the station, is that velocities are sampled at two tenths and eight tenths of the water depth, and the results are averaged. The eleven point method, used for the high water level, is the same as the two point method, but velocities are sampled at eleven points of the water depth (top, one tenths, two tenths, three tenths, four tenths, five tenths, six tenths, seven tenths, eight tenths, nine tenths and bottom). Unfortunately, the data between 2000 and 2002 were missing. In addition, detailed sediment data were also unavailable.</p>
      </sec>
      <sec>
        <title>3.3. Input Preparation</title>
        <sec>
          <title>3.3.1. Climate Data</title>
          <p>Required data for the weather file for model application includes daily precipitation, maximum and minimum temperatures, dew point temperature, sky cover and wind speed. There are a total of 11 rain gauges in the Daning River watershed. Due to large spatial and temporal variations of the precipitation in the watershed, multiple weather files were used. The entire watershed was divided into 11 polygons using the Thiessen polygon method [<xref ref-type="bibr" rid="B37-ijerph-09-01887">37</xref>]. Each polygon contains one rainfall station and any AnnAGNPS cells within the same polygon have the same rainfall data. The weather file for each polygon was created using recorded precipitation data from the rain gauges in the polygon for the time period of January 1998 to December 2005 (<xref ref-type="fig" rid="ijerph-09-01887-f007">Figure 7</xref>). Other weather information for the same period was available from Fengjie meteorological station approximately 40 km away from Wuxi station, which is the nearest climate station for the watershed. </p>
          <fig id="ijerph-09-01887-f007" position="anchor">
            <label>Figure 7</label>
            <caption>
              <p>Spatial distribution of raingauges and associated Thiessen polygons in the Daning River watershed.</p>
            </caption>
            <graphic xmlns:xlink="http://www.w3.org/1999/xlink" xlink:href="ijerph-09-01887-g007.tif"/>
          </fig>
        </sec>
        <sec>
          <title>3.3.2. Topographic Data</title>
          <p>Topographic parameterization software, the AGNPS 2001 data preparation tool, was used for digital landscape analysis of 25-m raster Digital Elevation Model (DEM). The size of the cells was determined by a user-defined critical source area (CAS) of 150 ha and a minimum source channel length (MSCL) of 100 m. As a result of processing the DEM data, the study area was discretized into 3,268 drainage areas (amorphous cells) and 1,314 reaches (<xref ref-type="fig" rid="ijerph-09-01887-f008">Figure 8</xref>). The watershed and associated sub-watershed boundaries (<xref ref-type="fig" rid="ijerph-09-01887-f008">Figure 8</xref>a) were delineated and stream network (<xref ref-type="fig" rid="ijerph-09-01887-f008">Figure 8</xref>b) was generated. Terrain-based geomorphic and drainage parameters containing cell area, slope, perimeter, RUSLE LS-factor, channel segment length and slopes, and the topology of the cell network were also calculated.</p>
          <fig id="ijerph-09-01887-f008" position="anchor">
            <label>Figure 8</label>
            <caption>
              <p>Generated subwatersheds and stream network of the study watershed.</p>
            </caption>
            <graphic xmlns:xlink="http://www.w3.org/1999/xlink" xlink:href="ijerph-09-01887-g008.tif"/>
          </fig>
        </sec>
        <sec>
          <title>3.3.3. Land Use</title>
          <p>The land use map was developed from Landsat 5 TM satellite image of October, 2004. Five major types of land use: farmland (paddy field and dry field), forest (forestland, shrub forestland, sparse forestland), grassland (higher, medium and lower coverage grassland), stream and residential areas, were identified in the watershed. The dominant land use was assigned to each AnnAGNPS cell.</p>
        </sec>
        <sec>
          <title>3.3.4. Crops and Cultivation Practices</title>
          <p>Crop management operation information reflecting the effect of human activities on the watershed is important to determine the sediment yield accurately. Therefore, the operation management information should be developed with as much detail as possible; especially for those operations that cause soil disturbance or land cover changes. Crop operation and field management data in the watershed were prepared based on field investigation, RUSLE guidelines and databases. The predominant crops grown were maize, rice, rape and wheat. The major crop rotation patterns are rice-rape in paddy fields and maize-wheat in dry (upland) land (<xref ref-type="table" rid="ijerph-09-01887-t006">Table 6</xref>).</p>
        </sec>
        <sec>
          <title>3.3.5. Soil Data</title>
          <p>In the model, 12 parameters from a total of 28 soil-based parameters were required for runoff and erosion simulation. Required inputs included particle size fraction, bulk density, albedo, saturated hydraulic conductivity, field capacity, and wilting point. The dominant soil type was determined for each AnnAGNPS cell, and associated characteristics for that soil type were organized through the Input Editor. Soil data mainly came from the Soil Survey Office in Sichuan Province of China [<xref ref-type="bibr" rid="B38-ijerph-09-01887">38</xref>]. However, some necessary soil information for AnnAGNPS simulation was not available. Using the “Soil water characteristics” software [<xref ref-type="bibr" rid="B39-ijerph-09-01887">39</xref>], the soil hydraulic parameters such as saturated hydraulic conductivity, field capacity and wilting point ratios were derived. The proportion of very fine sand (VFS) in the soil was estimated as the product of sand and silt divided by 100 [<xref ref-type="bibr" rid="B19-ijerph-09-01887">19</xref>]. The soil erodibility factor was estimated using the equation developed by Sharply <italic>et al</italic>. [<xref ref-type="bibr" rid="B40-ijerph-09-01887">40</xref>].</p>
        </sec>
        <sec>
          <title>3.3.6. SCS Curve Number</title>
          <p>The SCS-CN is a key factor to obtain accurate prediction of runoff and sediment yields. Curve numbers were selected based on the National Engineering Handbook, Section 4 [<xref ref-type="bibr" rid="B41-ijerph-09-01887">41</xref>] with some adjustment to incorporate local conditions. Adjustment was made during the model calibration processes, and was done by trial and error using the graphical comparison as well as the comparison of statistical parameters of observed and predicted runoff. The estimated SCS-CN values for different land uses of the watershed were listed in <xref ref-type="table" rid="ijerph-09-01887-t007">Table 7</xref>. The CN for four crops, <italic>i.e.</italic>, wheat, maize, rice and rape was used when the crops were growing. And the CN for fallow with residue was used when one crop was harvested but another crop had not yet been planted. Further, the CN for other land use types were selected and listed in <xref ref-type="table" rid="ijerph-09-01887-t007">Table 7</xref> too.</p>
        <table-wrap id="ijerph-09-01887-t007" position="anchor">
            <object-id pub-id-type="pii">ijerph-09-01887-t007_Table 7</object-id>
            <label>Table 7</label>
            <caption>
              <p>Estimated SCS curve numbers for the Daning River watershed used in the model simulations.</p>
            </caption>
             <table>
              <thead>
                <tr align="center">
                  <th colspan="5" valign="middle">Curve number Hydrologic soil group</th>
                </tr>
              </thead>
          <tbody>
            <tr align="center">
              <td valign="middle">Land cover class </td>
                  <td valign="middle">A</td>
                  <td valign="middle">B</td>
                  <td valign="middle">C</td>
                  <td valign="middle">D</td>
                </tr>
                <tr align="center">
                  <td valign="middle">Corn straight row (Poor) </td>
                  <td valign="middle">65</td>
                  <td valign="middle">75</td>
                  <td valign="middle">82</td>
                  <td valign="middle">86</td>
                </tr>
                <tr align="center">
                  <td valign="middle">Rice straight row (Poor) </td>
                  <td valign="middle">63</td>
                  <td valign="middle">74</td>
                  <td valign="middle">82</td>
                  <td valign="middle">85</td>
                </tr>
                <tr align="center">
                  <td valign="middle">Wheat straight row (Poor) </td>
                  <td valign="middle">63</td>
                  <td valign="middle">74</td>
                  <td valign="middle">82</td>
                  <td valign="middle">85</td>
                </tr>
                <tr align="center">
                  <td valign="middle">Rape straight row (Poor) </td>
                  <td valign="middle">64</td>
                  <td valign="middle">75</td>
                  <td valign="middle">83</td>
                  <td valign="middle">85</td>
                </tr>
                <tr align="center">
                  <td valign="middle">Lower coverage Grassland</td>
                  <td valign="middle">50</td>
                  <td valign="middle">80</td>
                  <td valign="middle">87</td>
                  <td valign="middle">93</td>
                </tr>
                <tr align="center">
                  <td valign="middle">Medium coverage Grassland</td>
                  <td valign="middle">40</td>
                  <td valign="middle">71</td>
                  <td valign="middle">81</td>
                  <td valign="middle">89</td>
                </tr>
                <tr align="center">
                  <td valign="middle">Higher coverage grassland</td>
                  <td valign="middle">30</td>
                  <td valign="middle">62</td>
                  <td valign="middle">74</td>
                  <td valign="middle">85</td>
                </tr>
                <tr align="center">
                  <td valign="middle">Forestland</td>
                  <td valign="middle">30</td>
                  <td valign="middle">55</td>
                  <td valign="middle">70</td>
                  <td valign="middle">77</td>
                </tr>
                <tr align="center">
                  <td valign="middle">Shrub forestland</td>
                  <td valign="middle">36</td>
                  <td valign="middle">60</td>
                  <td valign="middle">73</td>
                  <td valign="middle">79</td>
                </tr>
                <tr align="center">
                  <td valign="middle">Sparse forestland</td>
                  <td valign="middle">45</td>
                  <td valign="middle">66</td>
                  <td valign="middle">77</td>
                  <td valign="middle">83</td>
                </tr>
                <tr align="center">
                  <td valign="middle">Urban</td>
                  <td valign="middle">89</td>
                  <td valign="middle">92</td>
                  <td valign="middle">94</td>
                  <td valign="middle">95</td>
                </tr>
                <tr align="center">
                  <td valign="middle">Fallow + Crop residue (Poor) </td>
                  <td valign="middle">76</td>
                  <td valign="middle">85</td>
                  <td valign="middle">90</td>
                  <td valign="middle">93</td>
                </tr>
            </tbody>
            </table>
          </table-wrap>
        </sec>
      </sec>
      <sec>
        <title>3.4. Model Evaluation Criterion</title>
        <p>Runoff data from 1998–1999 were used for calibration and data from 2003–2005 were used for validation. The purpose of calibration is to achieve a satisfactory simulation through an iterative procedure of parameter evaluation and refinement, as a result of comparing simulated and observed values of interest. The purpose of the model validation is to determine the quality of the model predictions for other time periods not considered in calibration. The following statistics were used to help evaluate model performance for calibration: the mean and standard deviation of both observed and simulated values, the relative error (<italic>RE</italic>), the gradient k, intercept b, and coefficient of determination (<italic>R</italic><sup>2</sup>) of linear regression, the Nash-Sutcliffe coefficient of efficiency (<italic>NSE</italic>) [<xref ref-type="bibr" rid="B42-ijerph-09-01887">42</xref>], and root mean square error (<italic>RMSE</italic>).</p>
        <p>The RE is the ratio of the total difference between simulated and observed values <italic>versus</italic> the total observed value. It ranges from minus one to ∞ while zero indicates that there is no difference between model simulation and field observation. The smaller the absolute value of a RE, the better performance of the model is. </p>
        <p>The coefficient of determination, <italic>R</italic><sup>2</sup>, gives the proportion of the variance in the observed values explained by the simulated values. For a good agreement the gradient k should be close to one and the intercept b should be close to zero. </p>
        <p>The NSE is a technique often employed to evaluate simulated results in hydrological modeling. It is calculated according to Equation (1):</p>
        <p><inline-graphic xmlns:xlink="http://www.w3.org/1999/xlink" xlink:href="ijerph-09-01887-i001.tif"/></p>
        <p>where <italic>O</italic><sub>i</sub>, <italic>P</italic><sub>i</sub> and <italic>ō</italic> are observed, predicted, and the mean of the observed value respectively; and <italic>n</italic> is the total number of events. The NSE ranges from −∞ to 1 while one indicates that the model is perfect. A value larger than zero indicates that the model is minimally acceptable. Values between zero and one indicate that the model is a better indicator than the mean of the observed values; and negative values indicate that the mean of the observed values is a better indicator than the model [<xref ref-type="bibr" rid="B42-ijerph-09-01887">42</xref>]. </p>
        <p>The RMSE describes the difference between the observed and simulated values in the unit of the variable [<xref ref-type="bibr" rid="B23-ijerph-09-01887">23</xref>,<xref ref-type="bibr" rid="B43-ijerph-09-01887">43</xref>]. The RMSE range from 0 to ∞ while zero indicates there is no difference between model simulation and field observation. The RMSE can be expressed by Equation (2):</p>
        <p><inline-graphic xmlns:xlink="http://www.w3.org/1999/xlink" xlink:href="ijerph-09-01887-i002.tif"/></p>
        <p>AnnAGNPS did not simulate base-flow, hence to compare the model predicted runoff to observed runoff, baseflow was separated from the observed runoff using the baseflow filter method [<xref ref-type="bibr" rid="B44-ijerph-09-01887">44</xref>].</p>
      </sec>
      <sec>
        <title>3.5. Sediment Delivery Ratio (SDR)</title>
        <p>SDR, a sediment transmission coefficient, is calculated as the ratio of sediment yield at the watershed outlet (point of interest) to the gross erosion in the entire watershed. It can be obtained from the following Equation:</p>
        <p><inline-graphic xmlns:xlink="http://www.w3.org/1999/xlink" xlink:href="ijerph-09-01887-i003.tif"/></p>
        <p>where SDR is the sediment delivery ratio. SY is the sediment yield, and E is the gross erosion per unit area above a measuring point. </p>
      </sec>
    </sec>
    <sec sec-type="conclusions">
      <title>4. Conclusions</title>
      <p>AnnAGNPS was used in predicting runoff and sediment yield for a Three-Gorge watershed of the Yangtze River, China. The study demonstrates that AnnAGNPS adequately predicts long-term monthly runoff with <italic>RE</italic> = 0.01, <italic>NSE</italic> = 0.94 and <italic>R</italic><sup>2</sup> = 0.94 (<italic>p</italic> &lt; 0.05) in the calibration period; <italic>RE</italic> = −0.06, <italic>NSE</italic> = 0.93 and <italic>R</italic><sup>2</sup> = 0.93 (<italic>p</italic> &lt; 0.05) in the validation period. The comparison of annual average sediment yield monitored during 2000–2002 and 2003–2004 in the Wuxi station also achieved satisfactory agreement with <italic>RE</italic> of −0.34 and 0.18 respectively. The predicted runoff and sediment yield compared well with the observed data indicating that the model has an acceptable performance in simulation of runoff and sediment yield for the Daning River watershed. Additional model simulation showed that soil erosion from individual cells was highly spatially variable. Approximately 48% of the watershed had 0–500 t·km<sup>−2</sup>·y<sup>−1</sup>. However, 8% of the area had soil erosion in excess of 5,000 t·km<sup>−2</sup>·y<sup>−1</sup>. Sloping lands and lower coverage grassland were the main source of soil loss in the watershed, indicating the key area of soil loss control. The average annual erosion of the Daning River watershed was 6.49 million tons, and of which about 21% was deposited in the cells and 49% was stored in the stream channels, with the rest (30%) delivered to the watershed outlet. This indicates that more erosion control should be sought on the landscape to reduce soil loss. The SDR of the entire watershed is 0.3 and it varies greatly for each subwatershed. The results obtained from applying AnnAGNPS on this Three-Gorge watershed demonstrate that the model has considerable potential as a research and management tool for comparative assessment, long-term monthly and annual estimation of runoff and sediment yields, identification of landscape “hot spots”, and exploration of sediment delivery characteristics. </p>
    </sec>
  </body>
  <back>
    <ack>
      <title>Acknowledgements</title>
      <p>The authors would like to acknowledge the contribution of the Chinese Academy of Sciences (CAS) Action Plan for West Development (KZCX2-XB3-09), Open Fund of Key Laboratory of Urban Environment and Health, Institute of Urban Environment, CAS (KLUEH201003), Education Department of Fujian Province (JA10253), Key Laboratory of Spatial Data Mining &amp; Information Sharing of Ministry of Education (201009), Science Foundation of the Fujian Province (2009J05108), and Xiamen University of Technology (YKJ09011R), China in funding and data collection support. The authors also thank China Meteorological Administration for climatic data, Ministry of Water Resources of China for hydrological data, and Institute of Soil Science, CAS for the soil map. The authors are also grateful for Ann Pitchford and Eric Mbonimpa Gentil who provided many valuable comments to improve the manuscript. Although this work was reviewed by USEPA and approved for publication, it may not necessarily reflect official Agency policy. </p>
    </ack>
	<notes>
      <title>Conflict of Interest</title>
      <p>The authors declare no conflict of interest. </p>
    </notes>
    <ref-list>
      <title>References and Notes</title>
      <ref id="B1-ijerph-09-01887">
        <label>1.</label>
        <citation citation-type="journal">
          <person-group person-group-type="author">
            <name>
              <surname>Angima</surname>
              <given-names>S.D.</given-names>
            </name>
            <name>
              <surname>Stott</surname>
              <given-names>D.E.</given-names>
            </name>
            <name>
              <surname>O’Neill</surname>
              <given-names>M.K.</given-names>
            </name>
            <name>
              <surname>Ong</surname>
              <given-names>C.K.</given-names>
            </name>
            <name>
              <surname>Weesies</surname>
              <given-names>G.A.</given-names>
            </name>
          </person-group>
          <article-title>Soil erosion prediction using RUSLE for central Kenyan highland conditions</article-title>
          <source>Agric. Ecosyst. Environ.</source>
          <year>2003</year>
          <volume>97</volume>
          <fpage>295</fpage>
          <lpage>308</lpage>
          <pub-id pub-id-type="doi">10.1016/S0167-8809(03)00011-2</pub-id>
        </citation>
      </ref>
      <ref id="B2-ijerph-09-01887">
        <label>2.</label>
        <citation citation-type="book">
          <person-group person-group-type="author">
            <name>
              <surname>Baginska</surname>
              <given-names>B.</given-names>
            </name>
            <name>
              <surname>Milne-Home</surname>
              <given-names>W.</given-names>
            </name>
          </person-group>
          <article-title>Parameter Sensitivity in Calibration and Validation of Annualized Agricultural Nonpoint Source Model</article-title>
          <source>Calibration of Watershed Models</source>
          <person-group person-group-type="editor">
            <name>
              <surname>Duan</surname>
              <given-names>Q.</given-names>
            </name>
            <name>
              <surname>Gupta</surname>
              <given-names>H.V.</given-names>
            </name>
            <name>
              <surname>Sorooshian</surname>
              <given-names>S.</given-names>
            </name>
            <name>
              <surname>Rousseau</surname>
              <given-names>A.N.</given-names>
            </name>
            <name>
              <surname>Turcotte</surname>
              <given-names>R.</given-names>
            </name>
          </person-group>
          <publisher-name>American Geophysical Union</publisher-name>
          <publisher-loc>Washington, DC, USA</publisher-loc>
          <year>2008</year>
        </citation>
      </ref>
      <ref id="B3-ijerph-09-01887">
        <label>3.</label>
        <citation citation-type="confproc">
          <person-group person-group-type="author">
            <name>
              <surname>Cronshey</surname>
              <given-names>R.G.</given-names>
            </name>
            <name>
              <surname>Theurer</surname>
              <given-names>F.G.</given-names>
            </name>
          </person-group>
          <article-title>AnnAGNPS Non-Point Pollutant Loading Model</article-title>
          <source>Proceedings of the 1st Federal Interagency Hydrologic Modeling Conference</source>
          <conf-loc>Las Vegas, NV, USA</conf-loc>
          <conf-date>19–23 April 1998</conf-date>
        </citation>
      </ref>
      <ref id="B4-ijerph-09-01887">
        <label>4.</label>
        <citation citation-type="journal">
          <person-group person-group-type="author">
            <name>
              <surname>Arnold</surname>
              <given-names>J.G.</given-names>
            </name>
            <name>
              <surname>Allen</surname>
              <given-names>P.M.</given-names>
            </name>
          </person-group>
          <article-title>Automated methods for estimating baseflow and ground water recharge from streamflow records</article-title>
          <source>J. Am. Water Resour. Assoc.</source>
          <year>1999</year>
          <volume>35</volume>
          <fpage>411</fpage>
          <lpage>424</lpage>
          <pub-id pub-id-type="doi">10.1111/j.1752-1688.1999.tb03599.x</pub-id>
        </citation>
      </ref>
      <ref id="B5-ijerph-09-01887">
        <label>5.</label>
        <citation citation-type="web">
          <person-group person-group-type="author">
            <name>
              <surname>Bingner</surname>
              <given-names>R.L.</given-names>
            </name>
            <name>
              <surname>Theurer</surname>
              <given-names>F.D.</given-names>
            </name>
            <name>
              <surname>Yuan</surname>
              <given-names>Y.</given-names>
            </name>
          </person-group>
          <article-title>AnnAGNPS Technical Processes 2003</article-title>
          <access-date>(accessed on 10 March 2010)</access-date>
          <comment>Available online:<ext-link xmlns:xlink="http://www.w3.org/1999/xlink" xlink:href="http://www.ars.usda.gov/Research/docs.htm?docid=5199" ext-link-type="uri">http://www.ars.usda.gov/Research/docs.htm?docid=5199</ext-link></comment>
        </citation>
      </ref>
      <ref id="B6-ijerph-09-01887">
        <label>6.</label>
        <citation citation-type="journal">
          <person-group person-group-type="author">
            <name>
              <surname>Young</surname>
              <given-names>R.A.</given-names>
            </name>
            <name>
              <surname>Onstad</surname>
              <given-names>C.A.</given-names>
            </name>
            <name>
              <surname>Bosch</surname>
              <given-names>D.D.</given-names>
            </name>
            <name>
              <surname>Anderson</surname>
              <given-names>W.P.</given-names>
            </name>
          </person-group>
          <article-title>AGNPS—A nonpoint-source pollution model for evaluating agricultural watersheds</article-title>
          <source>J. Soil Water Conserv.</source>
          <year>1989</year>
          <volume>44</volume>
          <fpage>168</fpage>
          <lpage>173</lpage>
        </citation>
      </ref>
      <ref id="B7-ijerph-09-01887">
        <label>7.</label>
        <citation citation-type="book">
          <person-group person-group-type="author">
            <name>
              <surname>Bingner</surname>
              <given-names>R.L.</given-names>
            </name>
            <name>
              <surname>Darden</surname>
              <given-names>R.W.</given-names>
            </name>
            <name>
              <surname>Theurer</surname>
              <given-names>F.D.</given-names>
            </name>
            <name>
              <surname>Garbrecht</surname>
              <given-names>J.</given-names>
            </name>
          </person-group>
          <source>GIS-Based Generation of AGNPS Watershed Routing and Channel Parameters</source>
          <publisher-name>American Society for Aerospace Education</publisher-name>
          <publisher-loc>St. Joseph, MI, USA</publisher-loc>
          <year>1997</year>
          <fpage>29</fpage>
          <lpage>32</lpage>
          <comment>ASAE paper No. 97–2008</comment>
        </citation>
      </ref>
      <ref id="B8-ijerph-09-01887">
        <label>8.</label>
        <citation citation-type="journal">
          <person-group person-group-type="author">
            <name>
              <surname>Choi</surname>
              <given-names>K.S.</given-names>
            </name>
            <name>
              <surname>Blood</surname>
              <given-names>E.</given-names>
            </name>
          </person-group>
          <article-title>Modeling developed coastal watersheds with the agricultural non-point source model</article-title>
          <source>J. Am. Water Resour. Assoc.</source>
          <year>1999</year>
          <volume>35</volume>
          <fpage>233</fpage>
          <lpage>244</lpage>
          <pub-id pub-id-type="doi">10.1111/j.1752-1688.1999.tb03585.x</pub-id>
        </citation>
      </ref>
      <ref id="B9-ijerph-09-01887">
        <label>9.</label>
        <citation citation-type="journal">
          <person-group person-group-type="author">
            <name>
              <surname>Perrone</surname>
              <given-names>J.</given-names>
            </name>
            <name>
              <surname>Madramootoo</surname>
              <given-names>C.A.</given-names>
            </name>
          </person-group>
          <article-title>Use of AGNPS for watershed modeling in Quebec</article-title>
          <source>Trans. Am. Soc. Agric. Eng.</source>
          <year>1997</year>
          <volume>40</volume>
          <fpage>1349</fpage>
          <lpage>1354</lpage>
        </citation>
      </ref>
      <ref id="B10-ijerph-09-01887">
        <label>10.</label>
        <citation citation-type="journal">
          <person-group person-group-type="author">
            <name>
              <surname>Lenzi</surname>
              <given-names>M.A.</given-names>
            </name>
            <name>
              <surname>Di-Luzio</surname>
              <given-names>M.</given-names>
            </name>
          </person-group>
          <article-title>Surface runoff, soil erosion, and water quality modeling in the Alpone watershed using AGNPS integrated with a geographic information system</article-title>
          <source>Eur. J. Agron.</source>
          <year>1997</year>
          <volume>6</volume>
          <fpage>1</fpage>
          <lpage>14</lpage>
          <pub-id pub-id-type="doi">10.1016/S1161-0301(96)02001-1</pub-id>
        </citation>
      </ref>
      <ref id="B11-ijerph-09-01887">
        <label>11.</label>
        <citation citation-type="journal">
          <person-group person-group-type="author">
            <name>
              <surname>Grunwald</surname>
              <given-names>S.</given-names>
            </name>
            <name>
              <surname>Norton</surname>
              <given-names>L.D.</given-names>
            </name>
          </person-group>
          <article-title>An AGNPS-based runoff and sediment yield model for two small watersheds in Germany</article-title>
          <source>Trans. Am. Soc. Agric. Eng.</source>
          <year>1999</year>
          <volume>42</volume>
          <fpage>1723</fpage>
          <lpage>1731</lpage>
        </citation>
      </ref>
      <ref id="B12-ijerph-09-01887">
        <label>12.</label>
        <citation citation-type="journal">
          <person-group person-group-type="author">
            <name>
              <surname>Yuan</surname>
              <given-names>Y.P.</given-names>
            </name>
            <name>
              <surname>Bingner</surname>
              <given-names>R.L.</given-names>
            </name>
            <name>
              <surname>Rebich</surname>
              <given-names>R.A.</given-names>
            </name>
          </person-group>
          <article-title>Evaluation of AnnaGNPS on Mississippi Delta MSEA watersheds</article-title>
          <source>Trans. ASAE</source>
          <year>2001</year>
          <volume>44</volume>
          <fpage>1183</fpage>
          <lpage>1190</lpage>
        </citation>
      </ref>
      <ref id="B13-ijerph-09-01887">
        <label>13.</label>
        <citation citation-type="journal">
          <person-group person-group-type="author">
            <name>
              <surname>Yuan</surname>
              <given-names>Y.P.</given-names>
            </name>
            <name>
              <surname>Bingner</surname>
              <given-names>R.L.</given-names>
            </name>
            <name>
              <surname>Rebich</surname>
              <given-names>R.A.</given-names>
            </name>
          </person-group>
          <article-title>Evaluation of AnnAGNPS nitrogen loading in an agricultural watershed</article-title>
          <source>J. Am. Water Resour. Assoc.</source>
          <year>2003</year>
          <volume>39</volume>
          <fpage>457</fpage>
          <lpage>466</lpage>
          <pub-id pub-id-type="doi">10.1111/j.1752-1688.2003.tb04398.x</pub-id>
        </citation>
      </ref>
      <ref id="B14-ijerph-09-01887">
        <label>14.</label>
        <citation citation-type="journal">
          <person-group person-group-type="author">
            <name>
              <surname>Yuan</surname>
              <given-names>Y.</given-names>
            </name>
            <name>
              <surname>Locke</surname>
              <given-names>M.A.</given-names>
            </name>
            <name>
              <surname>Bingner</surname>
              <given-names>R.L.</given-names>
            </name>
          </person-group>
          <article-title>Annualized Agricultural Non-Point Source model application for Mississippi Delta Beasley Lake watershed conservation practices assessment</article-title>
          <source>J. Soil Water Conserv.</source>
          <year>2008</year>
          <volume>63</volume>
          <fpage>542</fpage>
          <lpage>551</lpage>
          <pub-id pub-id-type="doi">10.2489/jswc.63.6.542</pub-id>
        </citation>
      </ref>
      <ref id="B15-ijerph-09-01887">
        <label>15.</label>
        <citation citation-type="journal">
          <person-group person-group-type="author">
            <name>
              <surname>Yuan</surname>
              <given-names>Y.</given-names>
            </name>
            <name>
              <surname>Mehaffey</surname>
              <given-names>M.H.</given-names>
            </name>
            <name>
              <surname>Lopez</surname>
              <given-names>R.D.</given-names>
            </name>
            <name>
              <surname>Bingner</surname>
              <given-names>R.L.</given-names>
            </name>
            <name>
              <surname>Bruins</surname>
              <given-names>R.</given-names>
            </name>
            <name>
              <surname>Erickson</surname>
              <given-names>C.</given-names>
            </name>
            <name>
              <surname>Jackson</surname>
              <given-names>M.A.</given-names>
            </name>
          </person-group>
          <article-title>AnnAGNPS model application for nitrogen loading assessment for the future midwest landscape study</article-title>
          <source>Water</source>
          <year>2011</year>
          <volume>3</volume>
          <fpage>196</fpage>
          <lpage>216</lpage>
          <pub-id pub-id-type="doi">10.3390/w3010196</pub-id>
        </citation>
      </ref>
      <ref id="B16-ijerph-09-01887">
        <label>16.</label>
        <citation citation-type="journal">
          <person-group person-group-type="author">
            <name>
              <surname>Polyakov</surname>
              <given-names>V.</given-names>
            </name>
            <name>
              <surname>Fares</surname>
              <given-names>A.</given-names>
            </name>
            <name>
              <surname>Kubo</surname>
              <given-names>D.</given-names>
            </name>
            <name>
              <surname>Jacobi</surname>
              <given-names>J.</given-names>
            </name>
            <name>
              <surname>Smith</surname>
              <given-names>C.</given-names>
            </name>
          </person-group>
          <article-title>Evaluation of a non-point source pollution model, AnnAGNPS, in a tropical watershe</article-title>
          <source>Environ. Model. Software</source>
          <year>2007</year>
          <volume>22</volume>
          <fpage>1617</fpage>
          <lpage>1627</lpage>
          <pub-id pub-id-type="doi">10.1016/j.envsoft.2006.12.001</pub-id>
        </citation>
      </ref>
      <ref id="B17-ijerph-09-01887">
        <label>17.</label>
        <citation citation-type="journal">
          <person-group person-group-type="author">
            <name>
              <surname>Pease</surname>
              <given-names>L.M.</given-names>
            </name>
            <name>
              <surname>Oduor</surname>
              <given-names>P.</given-names>
            </name>
            <name>
              <surname>Padmanabhan</surname>
              <given-names>G.</given-names>
            </name>
          </person-group>
          <article-title>Estimating sediment, nitrogen, and phosphorous loads from the Pipestem Creek watershed, North Dakota, using AnnAGNPS</article-title>
          <source>Comput. Geosci.</source>
          <year>2010</year>
          <volume>36</volume>
          <fpage>282</fpage>
          <lpage>291</lpage>
          <pub-id pub-id-type="doi">10.1016/j.cageo.2009.07.004</pub-id>
        </citation>
      </ref>
      <ref id="B18-ijerph-09-01887">
        <label>18.</label>
        <citation citation-type="journal">
          <person-group person-group-type="author">
            <name>
              <surname>Kliment</surname>
              <given-names>Z.</given-names>
            </name>
            <name>
              <surname>Kadlec</surname>
              <given-names>J.</given-names>
            </name>
            <name>
              <surname>Langhammer</surname>
              <given-names>J.</given-names>
            </name>
          </person-group>
          <article-title>Evaluation of suspended load changes using AnnAGNPS and SWAT semi-empirical erosion models</article-title>
          <source>Catena</source>
          <year>2008</year>
          <volume>73</volume>
          <fpage>286</fpage>
          <lpage>299</lpage>
          <pub-id pub-id-type="doi">10.1016/j.catena.2007.11.005</pub-id>
        </citation>
      </ref>
      <ref id="B19-ijerph-09-01887">
        <label>19.</label>
        <citation citation-type="journal">
          <person-group person-group-type="author">
            <name>
              <surname>Shrestha</surname>
              <given-names>S.</given-names>
            </name>
            <name>
              <surname>Babel</surname>
              <given-names>M.S.</given-names>
            </name>
            <name>
              <surname>Das Gupta</surname>
              <given-names>A.</given-names>
            </name>
            <name>
              <surname>Kazama</surname>
              <given-names>F.</given-names>
            </name>
          </person-group>
          <article-title>Evaluation of annualized agricultural nonpoint source model for a watershed in the Siwalik Hills of Nepal</article-title>
          <source>Environ. Model. Software</source>
          <year>2006</year>
          <volume>21</volume>
          <fpage>961</fpage>
          <lpage>975</lpage>
          <pub-id pub-id-type="doi">10.1016/j.envsoft.2005.04.007</pub-id>
        </citation>
      </ref>
      <ref id="B20-ijerph-09-01887">
        <label>20.</label>
        <citation citation-type="journal">
          <person-group person-group-type="author">
            <name>
              <surname>Shamshad</surname>
              <given-names>A.</given-names>
            </name>
            <name>
              <surname>Leow</surname>
              <given-names>C.S.</given-names>
            </name>
            <name>
              <surname>Ramlah</surname>
              <given-names>A.</given-names>
            </name>
            <name>
              <surname>Hussin</surname>
              <given-names>W.</given-names>
            </name>
            <name>
              <surname>Sanusi</surname>
              <given-names>S.A.M.</given-names>
            </name>
          </person-group>
          <article-title>Applications of AnnAGNPS model for soil loss estimation and nutrient loading for Malaysian conditions</article-title>
          <source>Int. J. Appl. Earth Obs. Geoinf.</source>
          <year>2007</year>
          <volume>10</volume>
          <fpage>239</fpage>
          <lpage>252</lpage>
        </citation>
      </ref>
      <ref id="B21-ijerph-09-01887">
        <label>21.</label>
        <citation citation-type="journal">
          <person-group person-group-type="author">
            <name>
              <surname>Sarangi</surname>
              <given-names>A.</given-names>
            </name>
            <name>
              <surname>Cox</surname>
              <given-names>C.A.</given-names>
            </name>
            <name>
              <surname>Madramootoo</surname>
              <given-names>C.A.</given-names>
            </name>
          </person-group>
          <article-title>Evaluation of the AnnAGNPS model for prediction of runoff and sediment yields in St Lucia watersheds</article-title>
          <source>Biosystems Eng.</source>
          <year>2007</year>
          <volume>97</volume>
          <fpage>241</fpage>
          <lpage>256</lpage>
          <pub-id pub-id-type="doi">10.1016/j.biosystemseng.2007.02.015</pub-id>
        </citation>
      </ref>
      <ref id="B22-ijerph-09-01887">
        <label>22.</label>
        <citation citation-type="journal">
          <person-group person-group-type="author">
            <name>
              <surname>Licciardello</surname>
              <given-names>F.</given-names>
            </name>
            <name>
              <surname>Zema</surname>
              <given-names>D.A.</given-names>
            </name>
            <name>
              <surname>Zimbone</surname>
              <given-names>S.A.</given-names>
            </name>
            <name>
              <surname>Bingner</surname>
              <given-names>R.L.</given-names>
            </name>
          </person-group>
          <article-title>Runoff and soil erosion evaluation by the AnnAGNPS model in a small Mediterranean watershed</article-title>
          <source>Trans. Am. Soc. Agric. Biol. Eng.</source>
          <year>2007</year>
          <volume>50</volume>
          <fpage>1585</fpage>
          <lpage>1593</lpage>
        </citation>
      </ref>
      <ref id="B23-ijerph-09-01887">
        <label>23.</label>
        <citation citation-type="journal">
          <person-group person-group-type="author">
            <name>
              <surname>Zema</surname>
              <given-names>D.A.</given-names>
            </name>
            <name>
              <surname>Bingner</surname>
              <given-names>R.L.</given-names>
            </name>
            <name>
              <surname>Govers</surname>
              <given-names>G.</given-names>
            </name>
            <name>
              <surname>Licciardello</surname>
              <given-names>F.</given-names>
            </name>
            <name>
              <surname>Denisi</surname>
              <given-names>P.</given-names>
            </name>
            <name>
              <surname>Zimbone</surname>
              <given-names>S.M.</given-names>
            </name>
          </person-group>
          <article-title>Evaluation of runoff, peak flow and sediment yield for events simulated by the AnnAGNPS model in a Belgian agricultural watershed</article-title>
          <source>Land Degrad. Dev.</source>
          <year>2010</year>
          <pub-id pub-id-type="doi">10.1002/ldr.1068</pub-id>
        </citation>
      </ref>
      <ref id="B24-ijerph-09-01887">
        <label>24.</label>
        <citation citation-type="journal">
          <person-group person-group-type="author">
            <name>
              <surname>Baginska</surname>
              <given-names>B.</given-names>
            </name>
            <name>
              <surname>Milne-Home</surname>
              <given-names>W.</given-names>
            </name>
            <name>
              <surname>Cornish</surname>
              <given-names>P.S.</given-names>
            </name>
          </person-group>
          <article-title>Modelling nutrient transport in Currency Creek, NSW with AnnAGNPS and PEST</article-title>
          <source>Environ. Model. Software</source>
          <year>2003</year>
          <volume>18</volume>
          <fpage>801</fpage>
          <lpage>808</lpage>
          <pub-id pub-id-type="doi">10.1016/S1364-8152(03)00079-3</pub-id>
        </citation>
      </ref>
      <ref id="B25-ijerph-09-01887">
        <label>25.</label>
        <citation citation-type="journal">
          <person-group person-group-type="author">
            <name>
              <surname>Moriasi</surname>
              <given-names>D.N.</given-names>
            </name>
            <name>
              <surname>Arnold</surname>
              <given-names>J.G.</given-names>
            </name>
            <name>
              <surname>van Liew</surname>
              <given-names>M.W.</given-names>
            </name>
            <name>
              <surname>Bingner</surname>
              <given-names>R.L.</given-names>
            </name>
            <name>
              <surname>Harmel</surname>
              <given-names>R.D.</given-names>
            </name>
            <name>
              <surname>Veith</surname>
              <given-names>T.L.</given-names>
            </name>
          </person-group>
          <article-title>Model evaluation guidelines for systematic quantification of accuracy in watershed simulations</article-title>
          <source>Trans. Am. Soc. Agric. Biol. Eng.</source>
          <year>2007</year>
          <volume>50</volume>
          <fpage>885</fpage>
          <lpage>900</lpage>
        </citation>
      </ref>
      <ref id="B26-ijerph-09-01887">
        <label>26.</label>
        <citation citation-type="journal">
          <person-group person-group-type="author">
            <name>
              <surname>Fan</surname>
              <given-names>L.L.</given-names>
            </name>
            <name>
              <surname>Shen</surname>
              <given-names>Z.Y.</given-names>
            </name>
            <name>
              <surname>Liu</surname>
              <given-names>R.M.</given-names>
            </name>
            <name>
              <surname>Gong</surname>
              <given-names>Y.W.</given-names>
            </name>
          </person-group>
          <article-title>Spatial distribution of non-point source pollution in daninghe watershed based on SWAT Model</article-title>
          <source>Bull. Soil Water Conserv.</source>
          <year>2008</year>
          <volume>4</volume>
          <fpage>133</fpage>
          <lpage>137</lpage>
        </citation>
      </ref>
      <ref id="B27-ijerph-09-01887">
        <label>27.</label>
        <citation citation-type="confproc">
          <person-group person-group-type="author">
            <name>
              <surname>Ouyang</surname>
              <given-names>D.</given-names>
            </name>
            <name>
              <surname>Bartholic</surname>
              <given-names>J.</given-names>
            </name>
          </person-group>
          <article-title>Predicting Sediment Delivery Ratio in Saginaw Bay Watershed</article-title>
          <source>Proceedings of the 22nd National Association of Environmental Professionals Conference</source>
          <conf-loc>Orlando, FL, USA</conf-loc>
          <conf-date>19–23 May 1997</conf-date>
        </citation>
      </ref>
      <ref id="B28-ijerph-09-01887">
        <label>28.</label>
        <citation citation-type="journal">
          <person-group person-group-type="author">
            <name>
              <surname>Ji</surname>
              <given-names>K.</given-names>
            </name>
          </person-group>
          <article-title>Sediment delivery ratio in the Upper Yangtze River</article-title>
          <source>J. Sediment. Res.</source>
          <year>2002</year>
          <volume>1</volume>
          <fpage>53</fpage>
          <lpage>59</lpage>
        </citation>
      </ref>
      <ref id="B29-ijerph-09-01887">
        <label>29.</label>
        <citation citation-type="confproc">
          <person-group person-group-type="author">
            <name>
              <surname>Bingner</surname>
              <given-names>R.L.</given-names>
            </name>
            <name>
              <surname>Theurer</surname>
              <given-names>F.D.</given-names>
            </name>
          </person-group>
          <article-title>AnnAGNPS: Estimating Sediment Yield by Particle Size for Sheet and Rill Erosion</article-title>
          <source>Proceedings of the 7th Interagency Sedimentation Conference</source>
          <conf-loc>Reno, NV, USA</conf-loc>
          <conf-date>25–29 March 2001</conf-date>
        </citation>
      </ref>
      <ref id="B30-ijerph-09-01887">
        <label>30.</label>
        <citation citation-type="gov">
          <collab>USDA Soil Conservation Service (SCS)</collab>
          <source>National Engineering Handbook. Section 4: Hydrology</source>
          <publisher-name>USDA Soil Conservation Service</publisher-name>
          <publisher-loc>Washington, DC, USA</publisher-loc>
          <year>1972</year>
        </citation>
      </ref>
      <ref id="B31-ijerph-09-01887">
        <label>31.</label>
        <citation citation-type="confproc">
          <person-group person-group-type="author">
            <name>
              <surname>Theurer</surname>
              <given-names>F.G.</given-names>
            </name>
            <name>
              <surname>Cronshey</surname>
              <given-names>R.G.</given-names>
            </name>
          </person-group>
          <article-title>AnnAGNPS—Reach Routing Processes</article-title>
          <source>Proceedings of 1st Federal Interagency Hydrologic Modeling Conference</source>
          <conf-loc>Las Vegas, NV, USA</conf-loc>
          <conf-date>19–23 April 1998</conf-date>
        </citation>
      </ref>
      <ref id="B32-ijerph-09-01887">
        <label>32.</label>
        <citation citation-type="gov">
          <person-group person-group-type="author">
            <name>
              <surname>Renard</surname>
              <given-names>K.G.</given-names>
            </name>
            <name>
              <surname>Foster</surname>
              <given-names>G.R.</given-names>
            </name>
            <name>
              <surname>Weesies</surname>
              <given-names>G.A.</given-names>
            </name>
            <name>
              <surname>McCool</surname>
              <given-names>D.K.</given-names>
            </name>
            <name>
              <surname>Yoder</surname>
              <given-names>D.C.</given-names>
            </name>
          </person-group>
          <source>Predicting Soil Erosion by Water: A Guide to Conservation Planning with the Revised Universal Soil Loss Equation (RUSLE)</source>
          <publisher-name>US Department of Agriculture</publisher-name>
          <publisher-loc>Washington, DC, USA</publisher-loc>
          <year>1997</year>
          <comment>USDA Griculture Handbook No. 703</comment>
        </citation>
      </ref>
      <ref id="B33-ijerph-09-01887">
        <label>33.</label>
        <citation citation-type="confproc">
          <person-group person-group-type="author">
            <name>
              <surname>Theurer</surname>
              <given-names>F.G.</given-names>
            </name>
            <name>
              <surname>Clarke</surname>
              <given-names>C.D.</given-names>
            </name>
          </person-group>
          <article-title>Wash Load Component for Sediment Yield Modeling</article-title>
          <source>Proceedings of 5th Federal Interagency Sedimentation Conference</source>
          <conf-loc>Las Vegas, NV, USA</conf-loc>
          <conf-date>18–21 March 1991</conf-date>
        </citation>
      </ref>
      <ref id="B34-ijerph-09-01887">
        <label>34.</label>
        <citation citation-type="book">
          <person-group person-group-type="author">
            <name>
              <surname>Einstein</surname>
              <given-names>H.A.</given-names>
            </name>
            <name>
              <surname>Chien</surname>
              <given-names>N.</given-names>
            </name>
          </person-group>
          <source>Second Approximation to the Solution of the Suspended Load Theory</source>
          <publisher-name>University of California</publisher-name>
          <publisher-loc>Berkeley, CA, USA</publisher-loc>
          <year>1954</year>
        </citation>
      </ref>
      <ref id="B35-ijerph-09-01887">
        <label>35.</label>
        <citation citation-type="journal">
          <person-group person-group-type="author">
            <name>
              <surname>Johnson</surname>
              <given-names>G.L.</given-names>
            </name>
            <name>
              <surname>Daly</surname>
              <given-names>C.</given-names>
            </name>
            <name>
              <surname>Taylor</surname>
              <given-names>G.H.</given-names>
            </name>
            <name>
              <surname>Hanson</surname>
              <given-names>C.L.</given-names>
            </name>
          </person-group>
          <article-title>Spatial variability and interpolation of stochastic weather simulation model parameters</article-title>
          <source>J. Appl.Meteorol.</source>
          <year>2000</year>
          <volume>39</volume>
          <fpage>778</fpage>
          <lpage>796</lpage>
          <pub-id pub-id-type="doi">10.1175/1520-0450(2000)039&lt;0778:SVAIOS&gt;2.0.CO;2</pub-id>
        </citation>
      </ref>
      <ref id="B36-ijerph-09-01887">
        <label>36.</label>
        <citation citation-type="confproc">
          <person-group person-group-type="author">
            <name>
              <surname>Geter</surname>
              <given-names>W.F.</given-names>
            </name>
            <name>
              <surname>Theurer</surname>
              <given-names>F.D.</given-names>
            </name>
          </person-group>
          <article-title>AnnAGNPS-RUSLE Sheet and Rill Erosion</article-title>
          <source>Proceedings of the1st Federal Interagency Hydrologic Modeling Conference</source>
          <conf-loc>Las Vegas, NV, USA</conf-loc>
          <conf-date>19–23 April 1998</conf-date>
        </citation>
      </ref>
      <ref id="B37-ijerph-09-01887">
        <label>37.</label>
        <citation citation-type="journal">
          <person-group person-group-type="author">
            <name>
              <surname>Thiessen</surname>
              <given-names>A.H.</given-names>
            </name>
          </person-group>
          <article-title>Precipitation averages for large areas</article-title>
          <source>Mon. Weather Rev.</source>
          <year>1911</year>
          <volume>39</volume>
          <fpage>1082</fpage>
          <lpage>1084</lpage>
        </citation>
      </ref>
      <ref id="B38-ijerph-09-01887">
        <label>38.</label>
        <citation citation-type="gov">
          <collab>Soil Survey Office in Sichuan Province of China</collab>
          <source>Soil in Sichuan</source>
          <publisher-name>Sichuan Science and Technology Press</publisher-name>
          <publisher-loc>Chengdu, China</publisher-loc>
          <year>1995</year>
        </citation>
      </ref>
      <ref id="B39-ijerph-09-01887">
        <label>39.</label>
        <citation citation-type="journal">
          <person-group person-group-type="author">
            <name>
              <surname>Saxton</surname>
              <given-names>K.E.</given-names>
            </name>
            <name>
              <surname>Rawls</surname>
              <given-names>W.J.</given-names>
            </name>
            <name>
              <surname>Romberger</surname>
              <given-names>J.S.</given-names>
            </name>
            <name>
              <surname>Papendick</surname>
              <given-names>R.I.</given-names>
            </name>
          </person-group>
          <article-title>Estimating generatlized soil-water characteristics from texture</article-title>
          <source>Soil Sci. Soc. Am. J.</source>
          <year>1986</year>
          <volume>50</volume>
          <fpage>1031</fpage>
          <lpage>1036</lpage>
          <pub-id pub-id-type="doi">10.2136/sssaj1986.03615995005000040039x</pub-id>
        </citation>
      </ref>
      <ref id="B40-ijerph-09-01887">
        <label>40.</label>
        <citation citation-type="gov">
          <person-group person-group-type="author">
            <name>
              <surname>Sharply</surname>
              <given-names>A.N.</given-names>
            </name>
            <name>
              <surname>Williams</surname>
              <given-names>J.R.</given-names>
            </name>
          </person-group>
          <source>EPIC-Erosion Productivity Impact Culator: I. Model Documentation</source>
          <publisher-name>USDA</publisher-name>
          <publisher-loc>Washington, DC, USA</publisher-loc>
          <year>1990</year>
          <comment>USDA Technical Bulletin No. 1768</comment>
        </citation>
      </ref>
      <ref id="B41-ijerph-09-01887">
        <label>41.</label>
        <citation citation-type="gov">
          <collab>USDA Soil Conservation Service (SCS)</collab>
          <source>National Engineering Handbook. Section 4: Hydrology</source>
          <publisher-name>USDA Soil Conservation Service</publisher-name>
          <publisher-loc>Washington, DC, USA</publisher-loc>
          <year>1985</year>
        </citation>
      </ref>
      <ref id="B42-ijerph-09-01887">
        <label>42.</label>
        <citation citation-type="journal">
          <person-group person-group-type="author">
            <name>
              <surname>Nash</surname>
              <given-names>J.E.</given-names>
            </name>
            <name>
              <surname>Sutcliffe</surname>
              <given-names>J.V.</given-names>
            </name>
          </person-group>
          <article-title>River flow forecasting through conceptual models: Part I A discussion of principles</article-title>
          <source>J. Hydrol.</source>
          <year>1970</year>
          <volume>10</volume>
          <fpage>282</fpage>
          <lpage>290</lpage>
          <pub-id pub-id-type="doi">10.1016/0022-1694(70)90255-6</pub-id>
        </citation>
      </ref>
      <ref id="B43-ijerph-09-01887">
        <label>43.</label>
        <citation citation-type="journal">
          <person-group person-group-type="author">
            <name>
              <surname>Loague</surname>
              <given-names>K.</given-names>
            </name>
            <name>
              <surname>Green</surname>
              <given-names>R.E.</given-names>
            </name>
          </person-group>
          <article-title>Statistical and graphical methods for evaluating solute transport models: Overview and application</article-title>
          <source>J. Contam. Hydrol.</source>
          <year>1991</year>
          <volume>7</volume>
          <fpage>51</fpage>
          <lpage>73</lpage>
          <pub-id pub-id-type="doi">10.1016/0169-7722(91)90038-3</pub-id>
        </citation>
      </ref>
      <ref id="B44-ijerph-09-01887">
        <label>44.</label>
        <citation citation-type="journal">
          <person-group person-group-type="author">
            <name>
              <surname>Arnold</surname>
              <given-names>J.G.</given-names>
            </name>
            <name>
              <surname>Allen</surname>
              <given-names>P.M.</given-names>
            </name>
            <name>
              <surname>Muttiah</surname>
              <given-names>R.</given-names>
            </name>
            <name>
              <surname>Bernhardt</surname>
              <given-names>G.</given-names>
            </name>
          </person-group>
          <article-title>Automated base-flow separation and recession analysis techniques</article-title>
          <source>Ground Water</source>
          <year>1995</year>
          <volume>33</volume>
          <fpage>1010</fpage>
          <lpage>1018</lpage>
          <pub-id pub-id-type="doi">10.1111/j.1745-6584.1995.tb00046.x</pub-id>
        </citation>
      </ref>
    </ref-list>
  </back>
</article>
