<?xml version="1.0" encoding="UTF-8"?>
<!DOCTYPE article PUBLIC "-//NLM//DTD Journal Publishing DTD v2.3 20070202//EN" "journalpublishing.dtd">
<article xmlns:mml="http://www.w3.org/1998/Math/MathML" xmlns:xlink="http://www.w3.org/1999/xlink" xml:lang="en" article-type="research-article">
  <front>
    <journal-meta>
      <journal-id journal-id-type="publisher-id">ijerph</journal-id>
      <journal-title>International Journal of Environmental Research and Public Health</journal-title>
      <abbrev-journal-title abbrev-type="publisher">Int. J. Environ. Res. Public Health</abbrev-journal-title>
      <abbrev-journal-title abbrev-type="pubmed">International journal of environmental research and public health</abbrev-journal-title>
      <issn pub-type="epub">1660-4601</issn>
      <publisher>
        <publisher-name>MDPI</publisher-name>
      </publisher>
    </journal-meta>
    <article-meta>
      <article-id pub-id-type="doi">10.3390/ijerph9113934</article-id>
      <article-id pub-id-type="publisher-id">ijerph-09-03934</article-id>
      <article-categories>
        <subj-group>
          <subject>Article</subject>
        </subj-group>
      </article-categories>
      <title-group>
        <article-title>Increased Incidence and Altered Risk Demographics of Childhood Lead Poisoning: Predicting the Impacts of the CDC’s 5 µg/dL Reference Value in Massachusetts (USA)</article-title>
      </title-group>
      
      <contrib-group>
        <contrib contrib-type="author">
          <name>
            <surname>Handler</surname>
            <given-names>Phoebe</given-names>
          </name>
          <xref rid="af1-ijerph-09-03934" ref-type="aff">1</xref>
          <xref rid="c1-ijerph-09-03934" ref-type="corresp">*</xref>
        </contrib>
        <contrib contrib-type="author">
          <name>
            <surname>Brabander</surname>
            <given-names>Daniel</given-names>
          </name>
          <xref rid="af2-ijerph-09-03934" ref-type="aff">2</xref>
          <xref rid="af3-ijerph-09-03934" ref-type="aff">3</xref>
        </contrib>
      </contrib-group>
   <aff id="af1-ijerph-09-03934"><label>1 </label>Wellesley College, Department of Environmental Studies, 21 Wellesley College Road, c/o Daniel Brabander, Wellesley, MA 02481, USA</aff>
      <aff id="af2-ijerph-09-03934"><label>2 </label>Geosciences Department, Wellesley College, 21 Wellesley College Road, Wellesley, MA 02481, USA; Email: <email>dbraband@wellesley.edu</email></aff>
      <aff id="af3-ijerph-09-03934"><label>3 </label>Exposure, Epidemiology and Risk Program, Harvard School of Public Health Landmark Center, Room 404 West, 401 Park Drive, Boston, MA 02215, USA</aff>
      <author-notes>
        <corresp id="c1-ijerph-09-03934"><label>*</label> Author  to whom correspondence should be addressed; Email: <email>phandler@wellesley.edu</email>; Tel.: +1-412-849-4573.</corresp>
      </author-notes>
      <pub-date pub-type="epub">
        <day>30</day>
        <month>10</month>
        <year>2012</year>
      </pub-date>
      <pub-date pub-type="ppub"><month>11</month>
        <year>2012</year>
      </pub-date>
      <volume>9</volume>
      <issue>11</issue>
      <fpage>3934</fpage>
      <lpage>3942</lpage>
      <history>
        <date date-type="received">
          <day>17</day>
          <month>09</month>
          <year>2012</year>
        </date>
        <date date-type="rev-recd">
          <day>13</day>
          <month>10</month>
          <year>2012</year>
        </date>
        <date date-type="accepted">
          <day>16</day>
          <month>10</month>
          <year>2012</year>
        </date>
      </history>
      <permissions>
        <copyright-statement>©  2012 by the authors; licensee MDPI, Basel, Switzerland.</copyright-statement>
        <copyright-year>2012</copyright-year>
        <license xmlns:xlink="http://www.w3.org/1999/xlink" license-type="open-access" xlink:href="http://creativecommons.org/licenses/by/3.0/">
          <p>This article is an open-access article distributed under the terms and conditions of the Creative Commons Attribution license (http://creativecommons.org/licenses/by/3.0/).</p>
        </license>
      </permissions>
      <abstract>
        <p>In May 2012, the CDC adopted a new sliding scale reference value for childhood lead poisoning, reducing the former 10 µg/dL benchmark by half. Using Massachusetts (MA) as a model state, we estimated the change in the population of 9–47 month-olds at risk for lead poisoning. We then examined the impact of the 5 µg/dL reference value on the demographic characteristics of lead risk in MA communities. We find that the new CDC benchmark will lead to a 1470% increase in childhood lead poisoning cases among 9–47 month-olds in MA, with nearly 50% of the examined communities experiencing an increased prevalence of lead poisoning. Further, the top 10 MA communities with BLLs ≥5 µg/dL have significantly fewer foreign-born residents and significantly larger white populations than the highest risk communities formerly identified by the MA Childhood Lead Poisoning Prevention Program. The CDC’s new 5 µg/dL lead poisoning benchmark will drastically increase the number of children with elevated BLLs and alter the distribution and demographics high-risk communities in MA.</p>
      </abstract>
      <kwd-group>
        <kwd>lead poisoning</kwd>
        <kwd>community health</kwd>
        <kwd>risk</kwd>
        <kwd>demographics</kwd>
        <kwd>public health</kwd>
        <kwd>Massachusetts</kwd>
        <kwd>CDC</kwd>
      </kwd-group>
    </article-meta>
  </front>
  <body>
    <sec sec-type="intro">
      <title>1. Introduction</title>
      <p>At the beginning of 2012, childhood lead poisoning was not considered a major public health issue in the United States; in fact, the reduction in lead poisoning incidence was extolled by the Centers for Disease Control (CDC) as one of the “Great Public Health Achievements” of the United States from 2001–2010 [<xref ref-type="bibr" rid="B1-ijerph-09-03934">1</xref>]. With a blood lead level (BLL) benchmark of 10 µg/dL, less than 1% of our nation’s 1 to 5 year old children were considered to have lead poisoning.</p>
      <p>In May 2012, the CDC adopted a new protocol for establishing elevated BLLs. The 97.5th percentile BLL of U.S. children aged 1 to 5 years will now be used as a sliding reference value for lead poisoning in the United States. The CDC will update this number every four years using the most current childhood BLL distribution reported by the National Health and Nutrition Examination Survey [<xref ref-type="bibr" rid="B2-ijerph-09-03934">2</xref>]. Currently, the U.S. lead poisoning reference value is 5 µg/dL, half of the former 10 µg/dL benchmark.</p>
      <p>This new reference value is a timely response to a growing scientific consensus that permanent damage from lead exposure occurs at BLLs below 10 µg/dL [<xref ref-type="bibr" rid="B2-ijerph-09-03934">2</xref>,<xref ref-type="bibr" rid="B3-ijerph-09-03934">3</xref>,<xref ref-type="bibr" rid="B4-ijerph-09-03934">4</xref>,<xref ref-type="bibr" rid="B5-ijerph-09-03934">5</xref>,<xref ref-type="bibr" rid="B6-ijerph-09-03934">6</xref>,<xref ref-type="bibr" rid="B7-ijerph-09-03934">7</xref>,<xref ref-type="bibr" rid="B8-ijerph-09-03934">8</xref>,<xref ref-type="bibr" rid="B9-ijerph-09-03934">9</xref>,<xref ref-type="bibr" rid="B10-ijerph-09-03934">10</xref>]. In fact, the CDC has officially changed the language it uses to talk about lead poisoning to acknowledge that there is no safe level of lead exposure [<xref ref-type="bibr" rid="B2-ijerph-09-03934">2</xref>].</p>
      <p>The CDC’s benchmark reduction will surely increase the number of children in the U.S. who are considered to have lead poisoning. This study aims to quantify the demographics of the expanded cohort of at-risk children for lead poisoning using the state of Massachusetts as a model.</p>
      <p>Further, an expansion in the pool of children at risk for lead poisoning may alter the traditional demographic risk factors associated with the ailment. The body of literature exploring and defining the population risk demographics of childhood lead poisoning in the United States is well established [<xref ref-type="bibr" rid="B5-ijerph-09-03934">5</xref>,<xref ref-type="bibr" rid="B11-ijerph-09-03934">11</xref>,<xref ref-type="bibr" rid="B12-ijerph-09-03934">12</xref>,<xref ref-type="bibr" rid="B13-ijerph-09-03934">13</xref>,<xref ref-type="bibr" rid="B14-ijerph-09-03934">14</xref>]. A second aim of this study is to examine how the reduced lead poisoning benchmark will alter the demographic correlates of lead poisoning in Massachusetts.</p>
      <p>Proposed estimates of the total number of children newly considered to have lead poisoning [<xref ref-type="bibr" rid="B15-ijerph-09-03934">15</xref>] do not take into account the inequitable distribution of at-risk children across the nation [<xref ref-type="bibr" rid="B16-ijerph-09-03934">16</xref>,<xref ref-type="bibr" rid="B17-ijerph-09-03934">17</xref>]. Therefore, localized models of lead poisoning risk offer an important tool for identifying community-scale risk patterns that are not discernable from models with larger geographic scopes. In order to create a state-scale model for a population-based lead risk assessment, Massachusetts was selected for its heterogeneous population and accessible state-reported BLL measures.</p>
      <p>The new lead poisoning reference value will place pressure on public health departments and organizations across the nation. In order to address the growing cohort of high-risk children, there is a need for inexpensive and effective methods of identifying high-risk populations who merit focused primary prevention efforts. By exploring BLL patterns and demographic risk profiles for lead exposure in MA, this study identifies high-risk communities that particularly merit lead poisoning prevention interventions. We estimate the increase in lead-poisoned children in MA under the new CDC reference value and evaluate the impact of this expanded risk cohort on the demographic predictors of childhood lead poisoning in MA communities.</p>
    </sec>
    <sec>
      <title>2. Experimental Section</title>
      <p>The frequencies of BLLs for children aged 9 to 47 months, the age group used for childhood lead poisoning analysis by the MA Department of Public Health, in MA towns and cities (n = 349) were gathered from a publicly available online database provided by the Massachusetts Department of Public Health’s Bureau of Environmental Health [<xref ref-type="bibr" rid="B18-ijerph-09-03934">18</xref>]. BLLs, in the intervals of 0–9 µg/dL, 10–14 µg/dL, 15–24 µg/dL and <italic>≥</italic>25 µg/dL, were collected on the community scale for children aged 9–47 months from the year 2007. MA cities with incomplete or withheld BLL data were removed from the list.</p>
      <p>Though it was not available online, the MA Department of Public Health issued the 0–10 µg/dL BLL distributions for children aged 9–47 months in 2007 by request at no cost [<xref ref-type="bibr" rid="B19-ijerph-09-03934">19</xref>]. These data were binned for 0 µg/dL, 1–4 µg/dL and 5–10 µg/dL as percentages of the sampled population with BLLs from 0–10 µg/dL.</p>
      <p>Demographic variables relevant to lead poisoning risk, including median household income, poverty rate, homeownership rate, percent foreign-born, and educational attainment, were collected from the U.S. Census for Massachusetts from data collected over the period of 2006–2010 [<xref ref-type="bibr" rid="B20-ijerph-09-03934">20</xref>]. U.S. Census data from the 2010 Census Interactive Population Map was then used to gather race/ethnicity and demographic information for each MA community [<xref ref-type="bibr" rid="B21-ijerph-09-03934">21</xref>]. Communities with incomplete census profiles were removed from the list of eligible locations.</p>
      <p>Correlation analyses were completed using Microsoft Excel (Microsoft Corporation, Redmond, WA, USA, 2004). Pearson correlation and two-tailed significance values were calculated using SPSS predictive analytic software version 19 (IBM, Armonk, NY, USA).</p>
    </sec>
    <sec sec-type="results">
      <title>3. Results and Discussion
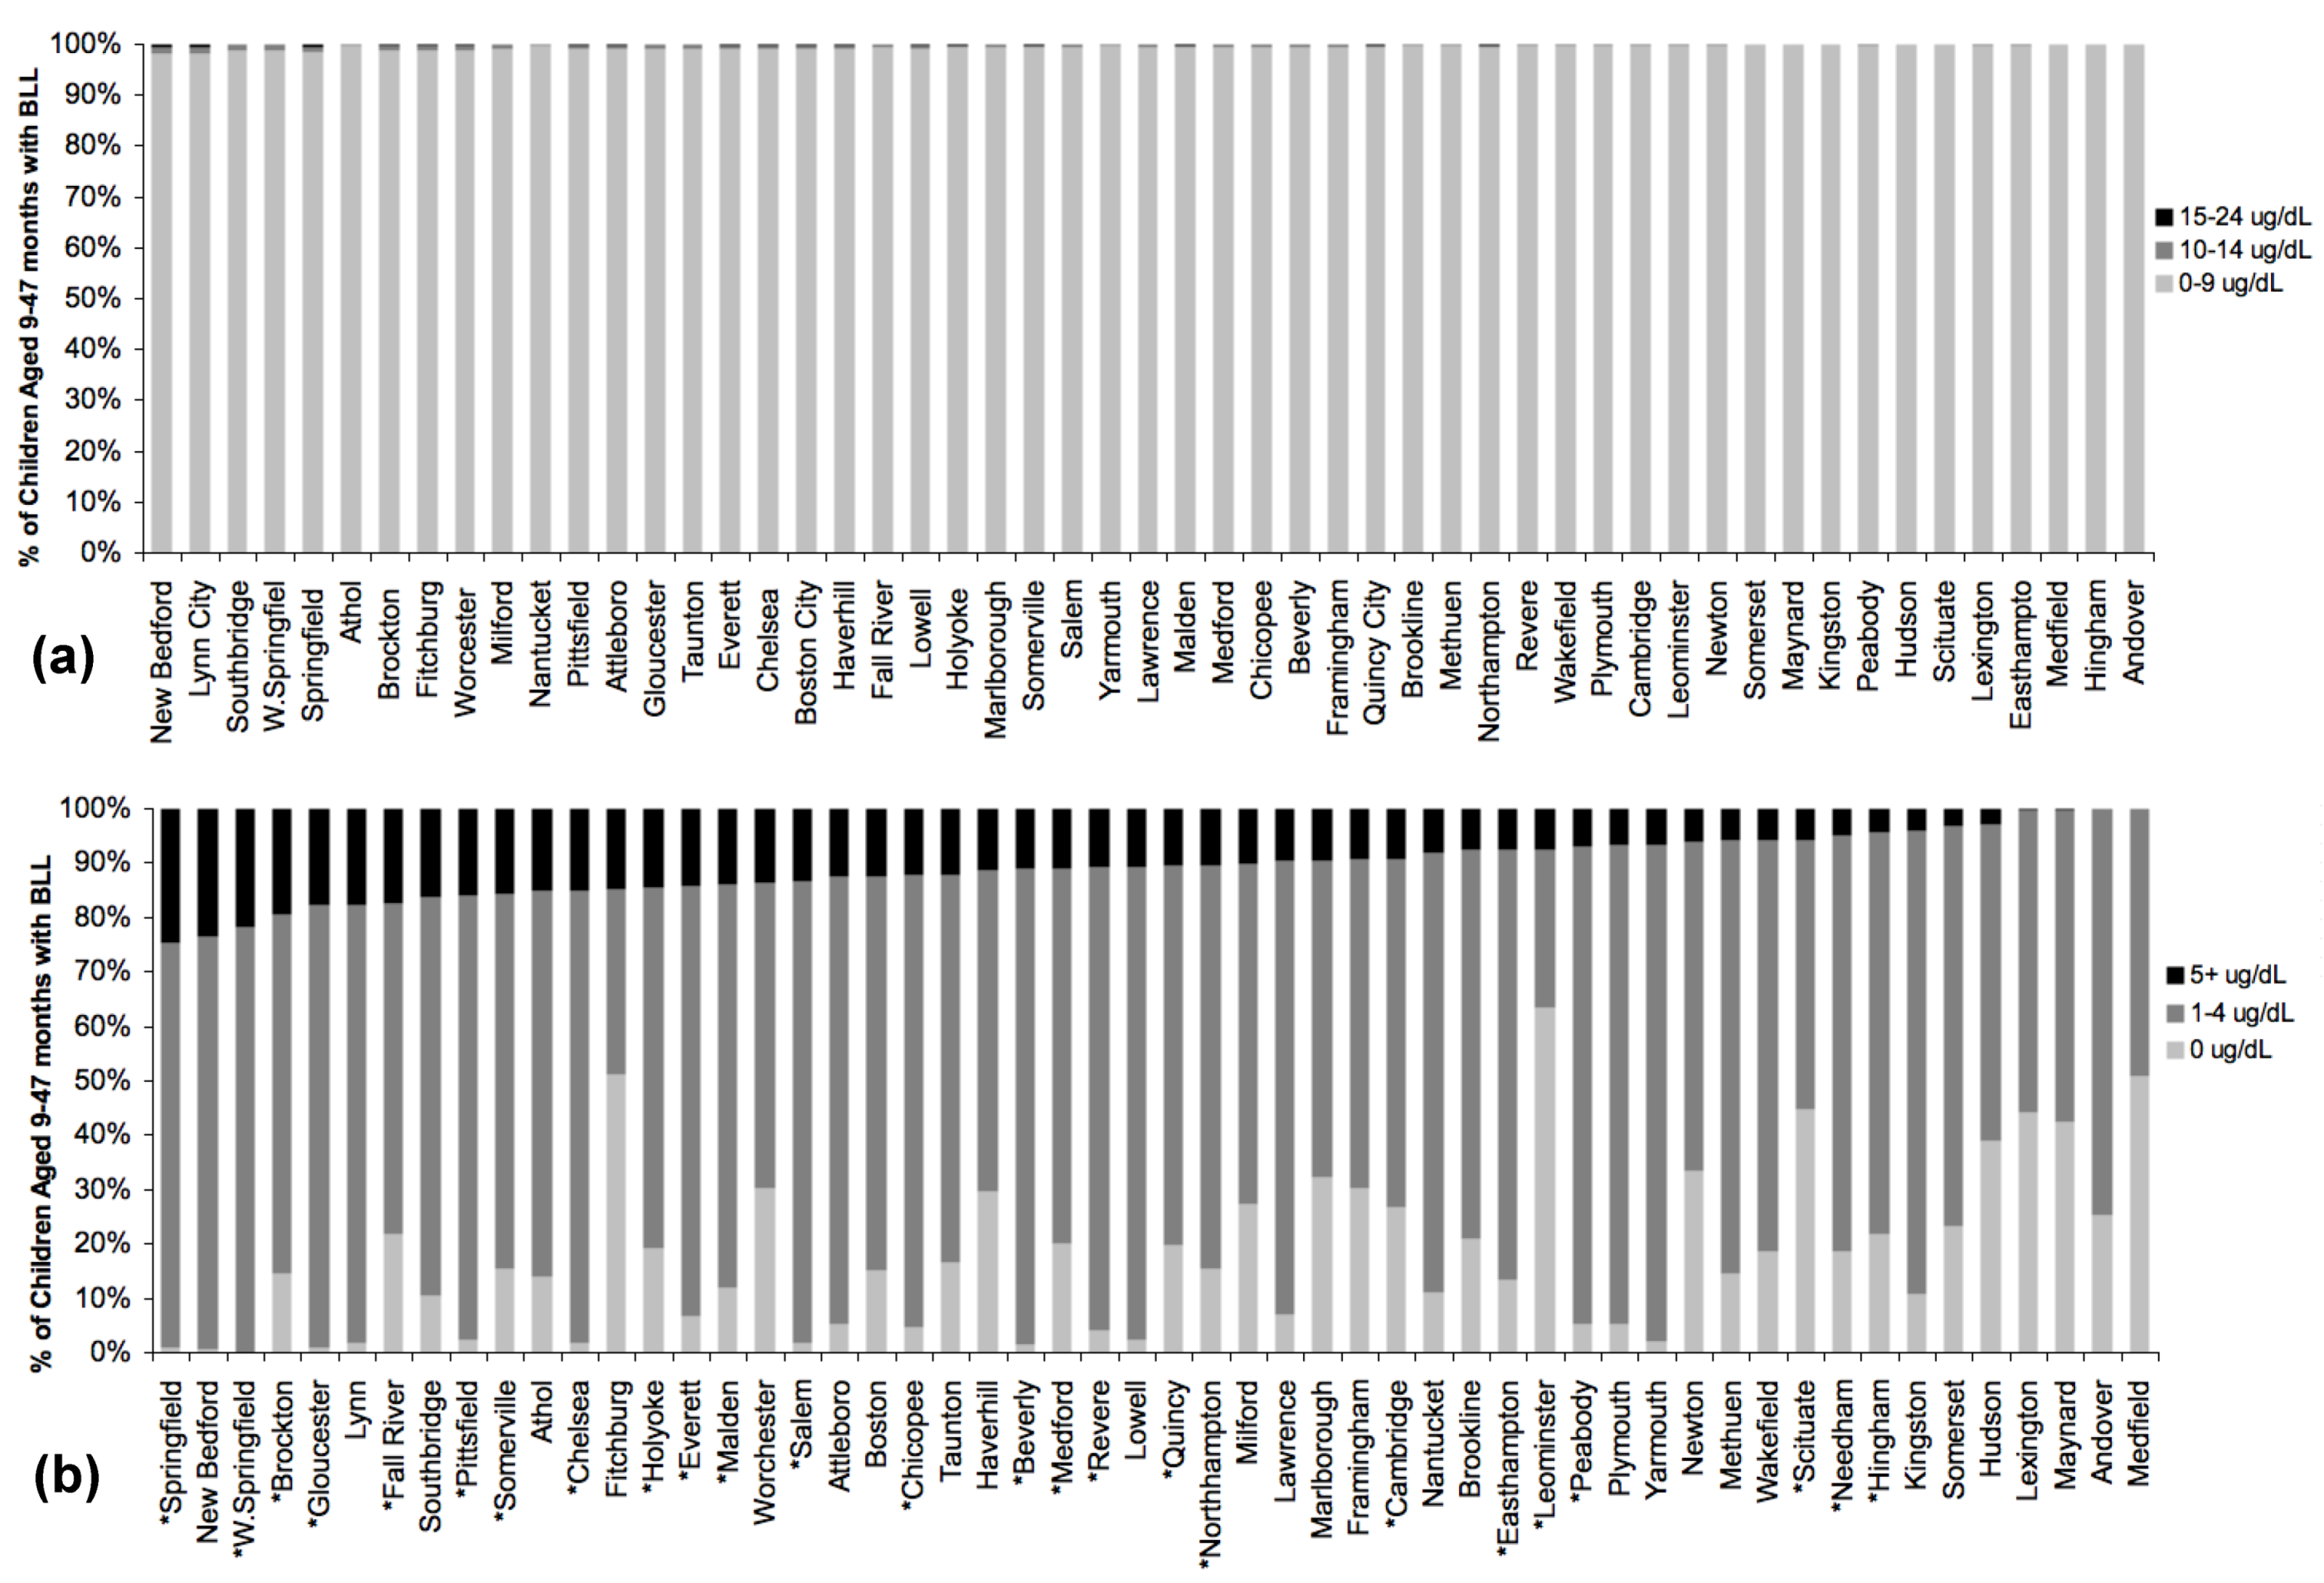
</title>
      <sec>
        <title>3.1. MA Communities</title>
        <p>Fifty-four communities had complete BLL, race/ethnicity, and demographic profiles. The total population of these communities accounts for approximately 50% of the state population (3,139,064 persons). In the 54 MA communities, 79.7% of the population is white, 12.4% is Hispanic, 5.5% is black, 4.9% is Asian, and 16.2% is foreign-born. The average median household income is $61,976, 11.7% of the population falls below the federal poverty level, and homeownership rate is 59.1%.Of those aged 25 and above, 86.5% graduated from high school and 35.2% have a Bachelor’s or advanced degree.</p>
      </sec>
      <sec>
        <title>3.2. Estimating the Expanded Pool of at-Risk Children</title>
        <p>In order to assess changes in childhood lead poisoning risk under the CDC’s new 5 µg/dL reference value, we ranked the 54 communities in a series of binning schemes. First, to represent lead risk under the former 10 µg/dL benchmark, the BLLs of MA children were divided into bins of 0–9 µg/dL, 10–14 µg/dL, and 15–24 µg/dL, as displayed in <xref ref-type="fig" rid="ijerph-09-03934-f001">Figure 1</xref>(a). Only 0.7% of 1 to 5 year old children in MA had BLLs of 10 µg/dL or higher in 2007, a very small minority. To identify children formerly masked by the 10 µg/dL reference value, the 9–47 month-old MA population with BLLs from 0–10 µg/dL in 2007 was divided into bins of 0 µg/dL, 1–4 µg/dL and 5–10 µg/dL. Of the 99.3% of children with BLLs from 0–10 µg/dL, 10.5% of children had BLLs in the 5–10 µg/dL range. The distribution of lead poisoning risk under the CDC’s new 5 µg/dL reference value is shown in <xref ref-type="fig" rid="ijerph-09-03934-f001">Figure 1</xref>(b), which presents the BLLs of 9–47 month-olds in bins of 0 µg/dL, 1–4 µg/dL, and ≥5 µg/dL.</p>
        <fig id="ijerph-09-03934-f001" position="anchor">
          <label>Figure 1</label>
          <caption>
            <p>Distribution of BLLs by MA community for children aged 9–47 months in 2007.<bold> (a)</bold> Distribution of BLLs binned according to the old CDC lead reference level of 10 µg/dL. <bold>(</bold><bold>b)</bold> Distribution of BLLs binned according to the new 5 µg/dL CDC reference value. Locations marked with an asterisk (<bold>*</bold>) have increased risk ranking under the new reference value.</p>
          </caption>
          <graphic xmlns:xlink="http://www.w3.org/1999/xlink" xlink:href="ijerph-09-03934-g001.tif"/>
        </fig>
        <p>In Massachusetts, the new 5 µg/dL reference value will increase the number of children considered to have lead poisoning by 1470%. Nearly half of the examined communities will experience increased lead poisoning prevalence under the new reference value.</p>
        <p>The ten MA communities with the highest proportion of children aged 9–47 months with BLLs ≥5 µg/dL are displayed in <xref ref-type="table" rid="ijerph-09-03934-t001">Table 1</xref>. Of the top ten MA communities for BLLs from ≥5 µg/dL, 40% were not included in the Massachusetts Childhood Lead Poisoning Prevention Program’s “High Risk Communities for Childhood Lead Poisoning” list, which singled out the cities in MA where lead poisoning was a large threat from 2002 to 2007 [<xref ref-type="bibr" rid="B22-ijerph-09-03934">22</xref>] (<xref ref-type="table" rid="ijerph-09-03934-t001">Table 1</xref>). Further, all of the top risk communities for BLLs ≥5 µg/dL changed in their ranking when compared to the distribution communities under the 10 µg/dL benchmark displayed in <xref ref-type="fig" rid="ijerph-09-03934-f001">Figure 1</xref>(a) (see <xref ref-type="table" rid="ijerph-09-03934-t001">Table 1</xref>).</p>
        <table-wrap id="ijerph-09-03934-t001" position="float">
          <object-id pub-id-type="pii">ijerph-09-03934-t001_Table 1</object-id>
          <label>Table 1</label>
          <caption>
            <p>Ten MA communities with the highest proportion of children aged 9–47 months with BLLs from ≥5 µg/dL in 2007, ranked by percent of population with BLLs ≥5 µg/dL, including the cities’ rankings under the 10 µg/dL benchmark and inclusion on the MA CLPPP high-risk list.</p>
          </caption>
          <table>
            <thead>
              <tr>
                <th align="center" valign="middle">BLL ≥5 µg/dL ranking</th>
                <th align="center" valign="middle">City</th>
                <th align="center" valign="middle">% of sampled population with BLL ≥5 µg/dL</th>
                <th align="center" valign="middle">BLL ≥10 µg/dL ranking</th>
                <th align="center" valign="middle">Inclusion on MA CLPPP High Risk List (2002-2007)</th>
              </tr>
            </thead>
            <tbody>
              <tr>
                <td align="center" valign="middle">1</td>
                <td align="center" valign="middle">Springfield</td>
                <td align="center" valign="middle">25.0%</td>
                <td align="center" valign="middle">5</td>
                <td align="center" valign="middle">√</td>
              </tr>
              <tr>
                <td align="center" valign="middle">2</td>
                <td align="center" valign="middle">New Bedford</td>
                <td align="center" valign="middle">23.7%</td>
                <td align="center" valign="middle">1</td>
                <td align="center" valign="middle">√</td>
              </tr>
              <tr>
                <td align="center" valign="middle">3</td>
                <td align="center" valign="middle">West Springfield</td>
                <td align="center" valign="middle">22.2%</td>
                <td align="center" valign="middle">4</td>
                <td align="center" valign="middle">×</td>
              </tr>
              <tr>
                <td align="center" valign="middle">4</td>
                <td align="center" valign="middle">Brockton</td>
                <td align="center" valign="middle">19.7%</td>
                <td align="center" valign="middle">7</td>
                <td align="center" valign="middle">√</td>
              </tr>
              <tr>
                <td align="center" valign="middle">5</td>
                <td align="center" valign="middle">Gloucester</td>
                <td align="center" valign="middle">18.0%</td>
                <td align="center" valign="middle">14</td>
                <td align="center" valign="middle">×</td>
              </tr>
              <tr>
                <td align="center" valign="middle">6</td>
                <td align="center" valign="middle">Lynn</td>
                <td align="center" valign="middle">18.0%</td>
                <td align="center" valign="middle">2</td>
                <td align="center" valign="middle">√</td>
              </tr>
              <tr>
                <td align="center" valign="middle">7</td>
                <td align="center" valign="middle">Fall River</td>
                <td align="center" valign="middle">17.4%</td>
                <td align="center" valign="middle">20</td>
                <td align="center" valign="middle">√</td>
              </tr>
              <tr>
                <td align="center" valign="middle">8</td>
                <td align="center" valign="middle">Southbridge</td>
                <td align="center" valign="middle">16.4%</td>
                <td align="center" valign="middle">3</td>
                <td align="center" valign="middle">×</td>
              </tr>
              <tr>
                <td align="center" valign="middle">9</td>
                <td align="center" valign="middle">Pittsfield</td>
                <td align="center" valign="middle">16.1%</td>
                <td align="center" valign="middle">12</td>
                <td align="center" valign="middle">×</td>
              </tr>
              <tr>
                <td align="center" valign="middle">10</td>
                <td align="center" valign="middle">Somerville</td>
                <td align="center" valign="middle">16.0%</td>
                <td align="center" valign="middle">24</td>
                <td align="center" valign="middle">√</td>
              </tr>
            </tbody>
          </table>
        </table-wrap>
        <p>For the top ten highest risk communities under the new CDC reference value, the proportion of young children with BLLs ≥5 µg/dL ranges from 16% to 25%. These communities’ risk rankings are strikingly different than they were under the 10 µg/dL binning scheme, with changes in rank ranging from 1 to 14. The MA CLPPP’s High Risk Communities List has become an outdated measure of lead poisoning risk.</p>
      </sec>
      <sec>
        <title>3.3. Evolving Lead Poisoning Risk Demographics</title>
        <p>For the new top ten MA communities at risk for childhood lead poisoning, 74.3% of the population is white, 15.9% is Hispanic, 9.5% is black, 3.2% is Asian, and 16.5% is foreign-born. The average median household income is $46,216, 16.8% of the population falls below the federal poverty level, and the homeownership rate is 50.7%. Of the population above age 25, 80.5% graduated from high school and 23.3% have a Bachelor’s or advanced degree.</p>
        <p>Correlation analysis was completed for all 54 MA communities between community BLLs ≥5 µg/dL and the primary demographic risk factors for lead poisoning risk, including median home income, poverty rate, educational attainment, homeownership rate, and race/ethnicity. The results of the correlation analyses are offered in <xref ref-type="table" rid="ijerph-09-03934-t002">Table 2</xref>.</p>
        <p>The demographic factors traditionally associated with lead poisoning risk in the United States were strongly correlated with BLLs ≥5 µg/dL in 9–47 month-old MA children. Our analysis demonstrated that income level and poverty rate have the strongest correlations with BLLs in MA (<italic>p</italic> &lt; 0.001, r<sup>2</sup> = 0.4). Socio-economic standing, therefore, is the strongest demographic correlate to lead poisoning rates in Massachusetts.</p>
        <table-wrap id="ijerph-09-03934-t002" position="float">
          <object-id pub-id-type="pii">ijerph-09-03934-t002_Table 2</object-id>
          <label>Table 2</label>
          <caption>
            <p>Demographic variables and BLL correlation measures for correlation of BLLs ≥5 µg/dL with demographic variables for all MA towns.</p>
          </caption>
          <table>
            <thead>
              <tr>
                <th align="center" valign="middle">Variable</th>
                <th align="center" valign="middle">R<sup>2</sup> value</th>
                <th align="center" valign="middle"><italic>p</italic> value</th>
              </tr>
            </thead>
            <tbody>
              <tr>
                <td align="center" valign="middle">Median Household Income</td>
                <td align="center" valign="middle">0.4</td>
                <td align="center" valign="middle">&lt;0.001</td>
              </tr>
              <tr>
                <td align="center" valign="middle">Poverty Rate</td>
                <td align="center" valign="middle">0.4</td>
                <td align="center" valign="middle">&lt;0.001</td>
              </tr>
              <tr>
                <td align="center" valign="middle">Educational Attainment</td>
                <td align="center" valign="middle">0.3</td>
                <td align="center" valign="middle">&lt;0.001</td>
              </tr>
              <tr>
                <td align="center" valign="middle">African American Population</td>
                <td align="center" valign="middle">0.3</td>
                <td align="center" valign="middle">&lt;0.001</td>
              </tr>
              <tr>
                <td align="center" valign="middle">Homeownership Rate</td>
                <td align="center" valign="middle">0.3</td>
                <td align="center" valign="middle">&lt;0.001</td>
              </tr>
              <tr>
                <td align="center" valign="middle">Hispanic Population</td>
                <td align="center" valign="middle">0.3</td>
                <td align="center" valign="middle">0.01</td>
              </tr>
              <tr>
                <td align="center" valign="middle">White Population</td>
                <td align="center" valign="middle">0.2</td>
                <td align="center" valign="middle">&lt;0.005</td>
              </tr>
            </tbody>
          </table>
        </table-wrap>
        
        <p>To assess the impacts of the expanded risk population for childhood lead poisoning on the demographic profiles traditionally associated with the ailment, we compared the average demographic risk factor values for the top 10 communities for BLLS ≥5 µg/dL with the communities on the MA CLPPP’s high-risk list for the years 2002 to 2007 [<xref ref-type="bibr" rid="B22-ijerph-09-03934">22</xref>] (see <xref ref-type="table" rid="ijerph-09-03934-t003">Table 3</xref>).</p>
        <table-wrap id="ijerph-09-03934-t003" position="float">
          <object-id pub-id-type="pii">ijerph-09-03934-t003_Table 3</object-id>
          <label>Table 3</label>
          <caption>
            <p>Comparison of 2007 average lead poisoning risk demographic measures from the top 10 MA communities with BLLs ≥5 µg/dL and the MA CLPPP’s highest risk communities.</p>
          </caption>
          <table>
            <thead>
              <tr>
                <th align="center" valign="middle">Variables</th>
                <th align="center" valign="middle">Top 10 MA Communities with BLLs ≥5 µg/dL in 2007</th>
                <th align="center" valign="middle">MA CLPPP High Risk Communities List 2002-2007</th>
                <th align="center" valign="middle"><italic>p</italic> value</th>
              </tr>
            </thead>
            <tbody>
              <tr>
                <td align="center" valign="middle">% Foreign-Born</td>
                <td align="center" valign="middle">16.5</td>
                <td align="center" valign="middle">25.3</td>
                <td align="center" valign="middle">0.03 *</td>
              </tr>
              <tr>
                <td align="center" valign="middle">% White</td>
                <td align="center" valign="middle">74.3</td>
                <td align="center" valign="middle">60.5</td>
                <td align="center" valign="middle">0.05 *</td>
              </tr>
              <tr>
                <td align="center" valign="middle">Homeownership Rate</td>
                <td align="center" valign="middle">50.7</td>
                <td align="center" valign="middle">42.9</td>
                <td align="center" valign="middle">0.08</td>
              </tr>
              <tr>
                <td align="center" valign="middle">% Below Poverty Level</td>
                <td align="center" valign="middle">16.8</td>
                <td align="center" valign="middle">20.6</td>
                <td align="center" valign="middle">0.10</td>
              </tr>
              <tr>
                <td align="center" valign="middle">% Hispanic</td>
                <td align="center" valign="middle">15.9</td>
                <td align="center" valign="middle">27.9</td>
                <td align="center" valign="middle">0.15</td>
              </tr>
              <tr>
                <td align="center" valign="middle">% High School Graduates</td>
                <td align="center" valign="middle">80.5</td>
                <td align="center" valign="middle">75.9</td>
                <td align="center" valign="middle">0.19</td>
              </tr>
              <tr>
                <td align="center" valign="middle">Median Household Income</td>
                <td align="center" valign="middle">$46,216</td>
                <td align="center" valign="middle">$43,446</td>
                <td align="center" valign="middle">0.51</td>
              </tr>
              <tr>
                <td align="center" valign="middle">% African American</td>
                <td align="center" valign="middle">9.5</td>
                <td align="center" valign="middle">12.9</td>
                <td align="center" valign="middle">0.42</td>
              </tr>
              <tr>
                <td align="center" valign="middle">% with Bachelor’s Degree</td>
                <td align="center" valign="middle">23.3</td>
                <td align="center" valign="middle">23.0</td>
                <td align="center" valign="middle">0.86</td>
              </tr>
            </tbody>
          </table>
          <table-wrap-foot>
          <fn>
           <p><bold>* </bold>Significant to the <italic>p</italic> ≤ 0.05 level</p>
          </fn>
          </table-wrap-foot>
        </table-wrap>
       
        <p>For the foreign-born (<italic>p</italic> = 0.03) and white population (<italic>p</italic> = 0.05) proportions, there was a significant difference between the old CLPPP top risk communities and the new top ten risk communities under the 5 µg/dL reference value. The percent of 9–47 month-old children with BLLs ≥5 µg/dL was about 19.2%, marking a 22.3% increase over that same population proportion for the MA CLPPP’s highest risk communities (15.7%). The expanded pool of children with BLLs above the national benchmark will alter the extent of risk demographics for lead poisoning in MA. The high-risk communities newly identified by the 5 µg/dL benchmark have distinctly different social, economic, and demographic profiles than those with the highest risk under the old lead poisoning benchmark.</p>
      </sec>
    </sec>
    <sec sec-type="conclusions">
      <title>4. Conclusions</title>
      <p>This study finds that the MA lead poisoning rate is 15.7 times greater under the 5 µg/dL reference value than it was under the former 10 µg/dL reference value. Further, the new reference value will distinctly alter the landscape of lead risk in MA, with nearly 50% of the examined communities experiencing an increased risk for lead poisoning.</p>
      <p>The demographic characteristics associated with lead poisoning risk have shifted under the new benchmark. Many of the risk conditions traditionally related to lead poisoning are significantly different in the new high-risk MA communities, compared with the high-risk communities previously identified by the MA CLPPP. Specifically, the top ten MA communities with BLLs ≥5 µg/dL have significantly fewer foreign-born residents and significantly larger white populations than the former highest risk communities.</p>
      <p>The expanded pool of lead poisoned children and the shifting community demographics of lead poisoning suggest a need for increased and expanded medical and public health attention to local communities in MA. Not only are there more children who merit primary prevention outreach, many of the affected communities are not the “usual subjects” of lead poisoning interventions.</p>
      <p>In understanding the impacts of the new CDC reference value on lead poisoning risk in MA communities, prevention efforts must address the changing landscape of lead risk. To more accurately and efficiently identify this expanded risk cohort, practitioners will need to assess risk on the local level rather than relying on national data. The low-cost and accessible methods used in this analysis may be used as a model for local and regional public health organizations that wish to efficiently and effectively identify communities with high-risk populations for lead poisoning.</p>
      <p>Lead poisoning remains a developmental threat to children in the United States. As the CDC’s policy catches up to the scientific consensus that there is no safe level of lead exposure, we must now acknowledge that childhood lead poisoning is not yet the “Great Public Health Achievement” [<xref ref-type="bibr" rid="B1-ijerph-09-03934">1</xref>] it was so recently thought to be. Now more than ever, lead poisoning prevention efforts should focus on those most at risk for exposure.</p>
      <p>The CDC’s new reference value will increase the number of children considered to have lead poisoning by 1470% and will markedly change the community-scale demographics of lead poisoning risk in Massachusetts. The impacts of the new 5 µg/dL benchmark should be examined on localized scales across the nation to more accurately identify and address regional lead poisoning prevalence.</p>
    </sec>
    
  </body>
  <back>
  <ack>
      <title>Acknowledgments</title>
      <p>The authors are grateful to the members of the Brabander research group at Wellesley College for their peer-review and support. We would like to thank the Massachusetts Childhood Lead Poisoning Prevention Program for their provision of data. Thank you, also, to David Bellinger for his review and encouragement of this publication.</p>
    </ack>
    <notes>
      <title>Conflict of Interest</title>
      <p>The authors declare no conflict of interest.</p>
    </notes>
    <ref-list>
      <title>References</title>
      <ref id="B1-ijerph-09-03934">
        <label>1.</label>
        <citation citation-type="web">
          <article-title>Ten Great Public Health Achievements—United States, 2001–2010</article-title>
          <source>Centers for Disease Control</source>
          <access-date>(accessed on 20 August 2012)</access-date>
          <comment>Available online:<ext-link xmlns:xlink="http://www.w3.org/1999/xlink" xlink:href="http://www.cdc.gov/mmwr/preview/mmwrhtml/mm6019a5.htm" ext-link-type="uri">http://www.cdc.gov/mmwr/preview/mmwrhtml/mm6019a5.htm</ext-link></comment>
        </citation>
      </ref>
      <ref id="B2-ijerph-09-03934">
        <label>2.</label>
        <citation citation-type="web">
          <article-title>CDC Response to Advisory Committee on Childhood Lead Poisoning Prevention Recommendations in “Low Level Lead Exposure Harms Children: A Renewed Call of Primary Prevention”, 2012</article-title>
          <source>Centers for Disease Control and Prevention</source>
          <access-date>(accessed on 11 July 2012)</access-date>
          <comment>Available online:<ext-link xmlns:xlink="http://www.w3.org/1999/xlink" xlink:href="http://www.cdc.gov/nceh/lead/acclpp/CDC_Response_Lead_Exposure_Recs.pdf" ext-link-type="uri">http://www.cdc.gov/nceh/lead/acclpp/CDC_Response_Lead_Exposure_Recs.pdf</ext-link></comment>
        </citation>
      </ref>
      <ref id="B3-ijerph-09-03934">
        <label>3.</label>
        <citation citation-type="journal">
          <person-group person-group-type="author">
            <name>
              <surname>Bellinger</surname>
              <given-names>D.</given-names>
            </name>
            <name>
              <surname>Leviton</surname>
              <given-names>A.</given-names>
            </name>
            <name>
              <surname>Sloman</surname>
              <given-names>J.</given-names>
            </name>
            <name>
              <surname>Rabinowitz</surname>
              <given-names>M.</given-names>
            </name>
            <name>
              <surname>Needleman</surname>
              <given-names>H.L.</given-names>
            </name>
            <name>
              <surname>Waternaux</surname>
              <given-names>C.</given-names>
            </name>
          </person-group>
          <article-title>Low-level lead exposure and children’s cognitive function in the preschool years</article-title>
          <source>Pediatrics</source>
          <year>1991</year>
          <volume>87</volume>
          <fpage>219</fpage>
          <lpage>227</lpage>
        <pub-id pub-id-type="pmid">1987535</pub-id></citation>
      </ref>
      <ref id="B4-ijerph-09-03934">
        <label>4.</label>
        <citation citation-type="journal">
          <person-group person-group-type="author">
            <name>
              <surname>Bellinger</surname>
              <given-names>D.C.</given-names>
            </name>
            <name>
              <surname>Stiles</surname>
              <given-names>K.M.N.H.</given-names>
            </name>
          </person-group>
          <article-title>Low-level lead exposure, intelligence and academic achievement: A long term-follow-up study</article-title>
          <source>Pediatrics</source>
          <year>1992</year>
          <volume>90</volume>
          <fpage>855</fpage>
          <lpage>861</lpage>
        <pub-id pub-id-type="pmid">1437425</pub-id></citation>
      </ref>
      <ref id="B5-ijerph-09-03934">
        <label>5.</label>
        <citation citation-type="journal">
          <person-group person-group-type="author">
            <name>
              <surname>Lanphear</surname>
              <given-names>B.</given-names>
            </name>
            <name>
              <surname>Dietrich</surname>
              <given-names>K.</given-names>
            </name>
            <name>
              <surname>Auinger</surname>
              <given-names>P.</given-names>
            </name>
            <name>
              <surname>Cox</surname>
              <given-names>C.</given-names>
            </name>
          </person-group>
          <article-title>Cognitive deficits associated with blood lead concentrations &lt;10 µg/dL in US children and adolescents</article-title>
          <source>Public Health Rep.</source>
          <year>2000</year>
          <volume>115</volume>
          <fpage>521</fpage>
          <lpage>529</lpage>
          <pub-id pub-id-type="doi">10.1093/phr/115.6.521</pub-id>
        </citation>
      </ref>
      <ref id="B6-ijerph-09-03934">
        <label>6.</label>
        <citation citation-type="journal">
          <person-group person-group-type="author">
            <name>
              <surname>Bernard</surname>
              <given-names>S.</given-names>
            </name>
            <name>
              <surname>McGeehin</surname>
              <given-names>M.</given-names>
            </name>
          </person-group>
          <article-title>Prevalence of blood lead levels ≥5 µg/dL among US children 1 to 5 years of age and socioeconomic and demographic factors associated with blood of lead levels 5 to 10 µg/dL, Third National Health and Nutrition Examination Survey, 1988–1994</article-title>
          <source>Pediatrics</source>
          <year>2003</year>
          <volume>112</volume>
          <fpage>1308</fpage>
          <lpage>1313</lpage>
          <pub-id pub-id-type="doi">10.1542/peds.112.6.1308</pub-id>
        </citation>
      </ref>
      <ref id="B7-ijerph-09-03934">
        <label>7.</label>
        <citation citation-type="journal">
          <person-group person-group-type="author">
            <name>
              <surname>Lanphear</surname>
              <given-names>B.P.</given-names>
            </name>
            <name>
              <surname>Hornung</surname>
              <given-names>R.</given-names>
            </name>
            <name>
              <surname>Khoury</surname>
              <given-names>J.</given-names>
            </name>
            <name>
              <surname>Yolton</surname>
              <given-names>K.</given-names>
            </name>
            <name>
              <surname>Baghurst</surname>
              <given-names>P.</given-names>
            </name>
            <name>
              <surname>Bellinger</surname>
              <given-names>D.C.</given-names>
            </name>
            <name>
              <surname>Canfield</surname>
              <given-names>R.L.</given-names>
            </name>
            <name>
              <surname>Dietrich</surname>
              <given-names>K.N.</given-names>
            </name>
            <name>
              <surname>Bornschein</surname>
              <given-names>R.</given-names>
            </name>
            <name>
              <surname>Greene</surname>
              <given-names>T.</given-names>
            </name>
            <name>
              <surname>Rothensberg</surname>
              <given-names>S.J.</given-names>
            </name>
            <name>
              <surname>Needleman</surname>
              <given-names>H.L.</given-names>
            </name>
            <name>
              <surname>Schnass</surname>
              <given-names>L.</given-names>
            </name>
            <name>
              <surname>Wasserman</surname>
              <given-names>G.</given-names>
            </name>
            <name>
              <surname>Graziano</surname>
              <given-names>J.</given-names>
            </name>
            <name>
              <surname>Roberts</surname>
              <given-names>R.</given-names>
            </name>
          </person-group>
          <article-title>Low-level environmental lead exposure and children’s intellectual function: An international pooled analysis</article-title>
          <source>Environ. Health Perspect.</source>
          <year>2005</year>
          <volume>113</volume>
          <fpage>894</fpage>
          <lpage>899</lpage>
        <pub-id pub-id-type="doi">10.1289/ehp.7688</pub-id><pub-id pub-id-type="pmid">16002379</pub-id></citation>
      </ref>
      <ref id="B8-ijerph-09-03934">
        <label>8.</label>
        <citation citation-type="journal">
          <person-group person-group-type="author">
            <name>
              <surname>Braun</surname>
              <given-names>J.M.</given-names>
            </name>
            <name>
              <surname>Kahn</surname>
              <given-names>R.S.</given-names>
            </name>
            <name>
              <surname>Froehlich</surname>
              <given-names>T.</given-names>
            </name>
            <name>
              <surname>Auinger</surname>
              <given-names>P.</given-names>
            </name>
            <name>
              <surname>Lanphear</surname>
              <given-names>B.</given-names>
            </name>
          </person-group>
          <article-title>Exposures to environmental toxicants and attention deficit hyperactivity disorder in U.S. children</article-title>
          <source>Environ. Health Perspect.</source>
          <year>2006</year>
          <volume>114</volume>
          <fpage>1904</fpage>
          <lpage>1909</lpage>
        <pub-id pub-id-type="pmid">17185283</pub-id></citation>
      </ref>
      <ref id="B9-ijerph-09-03934">
        <label>9.</label>
        <citation citation-type="journal">
          <person-group person-group-type="author">
            <name>
              <surname>Schnass</surname>
              <given-names>L.</given-names>
            </name>
            <name>
              <surname>Rothenberg</surname>
              <given-names>S.J.</given-names>
            </name>
            <name>
              <surname>Flores</surname>
              <given-names>M.F.</given-names>
            </name>
            <name>
              <surname>Martinez</surname>
              <given-names>S.</given-names>
            </name>
            <name>
              <surname>Hernandez</surname>
              <given-names>C.</given-names>
            </name>
            <name>
              <surname>Osorio</surname>
              <given-names>E.</given-names>
            </name>
            <name>
              <surname>Velasco</surname>
              <given-names>S.R.</given-names>
            </name>
            <name>
              <surname>Perroni</surname>
              <given-names>E.S.</given-names>
            </name>
          </person-group>
          <article-title>Reduced intellectual development in children with prenatal lead exposure</article-title>
          <source>Environ. Health Perspect.</source>
          <year>2006</year>
          <volume>114</volume>
          <fpage>791</fpage>
          <lpage>797</lpage>
        <pub-id pub-id-type="pmid">16675439</pub-id></citation>
      </ref>
      <ref id="B10-ijerph-09-03934">
        <label>10.</label>
        <citation citation-type="journal">
          <person-group person-group-type="author">
            <name>
              <surname>Nigg</surname>
              <given-names>J.T.</given-names>
            </name>
            <name>
              <surname>Knottnerus</surname>
              <given-names>G.M.</given-names>
            </name>
            <name>
              <surname>Martel</surname>
              <given-names>M.M.</given-names>
            </name>
            <name>
              <surname>Nikolas</surname>
              <given-names>M.</given-names>
            </name>
            <name>
              <surname>Cavanagh</surname>
              <given-names>K.</given-names>
            </name>
            <name>
              <surname>Karmaus</surname>
              <given-names>W.</given-names>
            </name>
            <name>
              <surname>Rappley</surname>
              <given-names>M.D.</given-names>
            </name>
          </person-group>
          <article-title>Low blood lead levels associated with clinically diagnosed attention-deficit/hyperactivity disorder and mediated by weak cognitive control</article-title>
          <source>Biol. Psychiat.</source>
          <year>2008</year>
          <volume>63</volume>
          <fpage>325</fpage>
          <lpage>331</lpage>
          <pub-id pub-id-type="doi">10.1016/j.biopsych.2007.07.013</pub-id>
        </citation>
      </ref>
      <ref id="B11-ijerph-09-03934">
        <label>11.</label>
        <citation citation-type="journal">
          <person-group person-group-type="author">
            <name>
              <surname>Roy</surname>
              <given-names>A.</given-names>
            </name>
            <name>
              <surname>Bellinger</surname>
              <given-names>D.</given-names>
            </name>
            <name>
              <surname>Hu</surname>
              <given-names>H.</given-names>
            </name>
            <name>
              <surname>Schwartz</surname>
              <given-names>J.</given-names>
            </name>
            <name>
              <surname>Ettinger</surname>
              <given-names>A.S.</given-names>
            </name>
            <name>
              <surname>Wright</surname>
              <given-names>R.O.</given-names>
            </name>
            <name>
              <surname>Bouchard</surname>
              <given-names>M.</given-names>
            </name>
            <name>
              <surname>Palaniappan</surname>
              <given-names>K.</given-names>
            </name>
            <name>
              <surname>Balakrishnan</surname>
              <given-names>K.</given-names>
            </name>
          </person-group>
          <article-title>Lead exposure and behavior among young children in Chennai, India</article-title>
          <source>Environ. Health Perspect.</source>
          <year>2009</year>
          <volume>117</volume>
          <fpage>1607</fpage>
          <lpage>1611</lpage>
        <pub-id pub-id-type="pmid">20019913</pub-id></citation>
      </ref>
      <ref id="B12-ijerph-09-03934">
        <label>12.</label>
        <citation citation-type="journal">
          <person-group person-group-type="author">
            <name>
              <surname>Canfield</surname>
              <given-names>R.L.</given-names>
            </name>
            <name>
              <surname>Henderson</surname>
              <given-names>C.R.</given-names>
            </name>
            <name>
              <surname>Cory-Slechta</surname>
              <given-names>D.A.</given-names>
            </name>
            <name>
              <surname>Cox</surname>
              <given-names>C.</given-names>
            </name>
            <name>
              <surname>Jusko</surname>
              <given-names>T.A.</given-names>
            </name>
            <name>
              <surname>Lanphear</surname>
              <given-names>B.P.</given-names>
            </name>
          </person-group>
          <article-title>Intellectual impairment in children with blood lead concentrations below 10 µg per decilitre</article-title>
          <source>N. Engl. J. Med.</source>
          <year>2003</year>
          <volume>348</volume>
          <fpage>1517</fpage>
          <lpage>1526</lpage>
          <pub-id pub-id-type="doi">10.1056/NEJMoa022848</pub-id>
        </citation>
      </ref>
      <ref id="B13-ijerph-09-03934">
        <label>13.</label>
        <citation citation-type="journal">
          <person-group person-group-type="author">
            <name>
              <surname>Jones</surname>
              <given-names>R.L.</given-names>
            </name>
            <name>
              <surname>Homa</surname>
              <given-names>D.M.</given-names>
            </name>
            <name>
              <surname>Meyer</surname>
              <given-names>P.A.</given-names>
            </name>
            <name>
              <surname>Brody</surname>
              <given-names>D.J.</given-names>
            </name>
            <name>
              <surname>Caldwell</surname>
              <given-names>K.L.</given-names>
            </name>
            <name>
              <surname>Pirkle</surname>
              <given-names>J.L.</given-names>
            </name>
            <name>
              <surname>Brown</surname>
              <given-names>M.J.</given-names>
            </name>
          </person-group>
          <article-title>Trends in blood lead levels and blood lead testing among US children aged 1 to 5 years, 1988–2004</article-title>
          <source>Pediatrics</source>
          <year>2009</year>
          <volume>23</volume>
          <fpage>e376</fpage>
          <lpage>e385</lpage>
        </citation>
      </ref>
      <ref id="B14-ijerph-09-03934">
        <label>14.</label>
        <citation citation-type="journal">
          <person-group person-group-type="author">
            <name>
              <surname>Pirkle</surname>
              <given-names>J.L.</given-names>
            </name>
            <name>
              <surname>Kaufmann</surname>
              <given-names>R.B.</given-names>
            </name>
            <name>
              <surname>Brody</surname>
              <given-names>D.J.</given-names>
            </name>
            <name>
              <surname>Hickman</surname>
              <given-names>T.</given-names>
            </name>
            <name>
              <surname>Gunter</surname>
              <given-names>E.W.</given-names>
            </name>
            <name>
              <surname>Paschal</surname>
              <given-names>D.C. </given-names>
            </name>
          </person-group>
          <article-title>Exposure of the U.S. population to lead, 1991–1994</article-title>
          <source>Environ. Health Perspect.</source>
          <year>1998</year>
          <volume>106</volume>
          <fpage>745</fpage>
          <lpage>750</lpage>
          <pub-id pub-id-type="doi">10.1289/ehp.98106745</pub-id>
        </citation>
      </ref>
      <ref id="B15-ijerph-09-03934">
        <label>15.</label>
        <citation citation-type="journal">
          <person-group person-group-type="author">
            <name>
              <surname>Hartocollis</surname>
              <given-names>A.C.D.C.</given-names>
            </name>
          </person-group>
          <article-title>Lowers Recommended Lead-Level Limits In Children</article-title>
          <source>The New York Times</source>
          <year>2012</year>
		  <month>May</month>
          <day>16</day>
        </citation>
      </ref>
      <ref id="B16-ijerph-09-03934">
        <label>16.</label>
        <citation citation-type="web">
          <article-title>Children Tested and Confirmed EBLLs by State, Year, and BLL Group, Children &lt;72 Months Old, 1997–2010</article-title>
          <access-date>(accessed on 24 August 2011)</access-date>
          <comment>Available online:<ext-link xmlns:xlink="http://www.w3.org/1999/xlink" xlink:href="http://www.cdc.gov/nceh/lead/data/StateConfirmedByYear1997-2010.htm" ext-link-type="uri">http://www.cdc.gov/nceh/lead/data/StateConfirmedByYear1997-2010.htm</ext-link></comment>
        </citation>
      </ref>
      <ref id="B17-ijerph-09-03934">
        <label>17.</label>
        <citation citation-type="web">
          <article-title>Lead Risk Index</article-title>
          <access-date>(accessed on 24 August 2011)</access-date>
          <comment>Available online:<ext-link xmlns:xlink="http://www.w3.org/1999/xlink" xlink:href="http://www.leadriskindex.com/" ext-link-type="uri">http://www.leadriskindex.com/</ext-link></comment>
        </citation>
      </ref>
      <ref id="B18-ijerph-09-03934">
        <label>18.</label>
        <citation citation-type="web">
          <article-title>Childhood Lead Poisoning-Tables/Charts/Maps, 2009</article-title>
          <source>Bureau of Environmental Health, MA Department of Public Health</source>
          <access-date>(accessed on 4 February 2012)</access-date>
          <comment>Available online:<ext-link xmlns:xlink="http://www.w3.org/1999/xlink" xlink:href="http://matracking.ehs.state.ma.us/Health_Data/Childhood_Blood_Lead_Levels.html" ext-link-type="uri">http://matracking.ehs.state.ma.us/Health_Data/Childhood_Blood_Lead_Levels.html</ext-link></comment>
        </citation>
      </ref>
      <ref id="B19-ijerph-09-03934">
        <label>19.</label>
        <citation citation-type="book">
          <source>“Blood Lead Level Counts for Children Ages 9–47 Months in Massachusetts, CY 2007”, Childhood Lead Poisoning Prevention Program (CLPPP) Database</source>
          <publisher-name>Environmental Epidemiology Program, Bureau of Environmental Health</publisher-name>
          <publisher-loc>Boston, MA, USA</publisher-loc>
          <year>2012</year>
        </citation>
      </ref>
      <ref id="B20-ijerph-09-03934">
        <label>20.</label>
        <citation citation-type="web">
          <article-title>State &amp; County QuickFacts: Massachusetts, 2010 U.S. Census Bureau</article-title>
          <access-date>(accessed on 5 February 2012)</access-date>
          <comment>Available online:<ext-link xmlns:xlink="http://www.w3.org/1999/xlink" xlink:href="http://quickfacts.census.gov/qfd/states/25000.html" ext-link-type="uri">http://quickfacts.census.gov/qfd/states/25000.html</ext-link></comment>
        </citation>
      </ref>
      <ref id="B21-ijerph-09-03934">
        <label>21.</label>
        <citation citation-type="web">
          <article-title>Interactive Population Map, 2010 U.S. Census</article-title>
          <access-date>(accessed on 5 February 2012)</access-date>
          <comment>Available online:<ext-link xmlns:xlink="http://www.w3.org/1999/xlink" xlink:href="http://2010.census.gov/2010census/popmap/" ext-link-type="uri">http://2010.census.gov/2010census/popmap/</ext-link></comment>
        </citation>
      </ref>
      <ref id="B22-ijerph-09-03934">
        <label>22.</label>
        <citation citation-type="web">
          <source>High Risk Communities for Childhood Lead Poisoning, 2002–2007</source>
          <publisher-name>Childhood Lead Poisoning Prevention Program, Massachusetts Department of Public Health</publisher-name>
          <publisher-loc>Boston, MA, USA</publisher-loc>
          <year>2010</year>
          <access-date>www.mass.gov/eohhs/researcher/community-health/environment-health/lead/childhood-lead-poisoning-screening-and-statistics.html</access-date>
          <comment>Available online:<ext-link xmlns:xlink="http://www.w3.org/1999/xlink" xlink:href="www.mass.gov/eohhs/researcher/community-health/environment-health/lead/childhood-lead-poisoning-screening-and-statistics.html" ext-link-type="uri">www.mass.gov/eohhs/researcher/community-health/environment-health/lead/childhood-lead-poisoning-screening-and-statistics.html</ext-link></comment>
        </citation>
      </ref>
    </ref-list>
  </back>
</article>
