Comparison of Laboratory and Field Remote Sensing Methods to Measure Forage Quality

Abstract
:1. Introduction
2. Materials and Methods
2.1. Study Sites
2.2. Data Collection
2.3. Spectral Data Processing
2.4. Data Analysis
3. Results and Discussion
3.1. Result
3.1.1. Vegetation chemical and nutrient contents
3.1.2. Comparison of reflectance measured in the field and laboratory on detecting grass chemicals
3.1.3. Protein prediction model development and validation
3.1.4. Variation under different management practices
3.2. Discussion
Acknowledgments
References
- Gregorini, P; Gunter, SA; Masino, CA; Beck, PA. Effects of ruminal fill on short-term herbage intake rate and grazing dynamics of beef heifers. Grass Forage Sci 2007, 62, 346–354. [Google Scholar]
- Hobbs, NT; Swift, DM. Estimates of habitat carrying capacity incorporating explicit nutritional constraints. J. Wildl. Manag 1985, 49, 814–822. [Google Scholar]
- Milchunas, DG; Mosier, AR; Morgan, JA; LeCain, DR; King, JY; Nelson, JA. Elevated CO2 and defoliation effects on a shortgrass steppe: Forage quality versus quantity for ruminants. Agr. Ecosyst. Environ 2005, 111, 166–184. [Google Scholar]
- Wilmshurst, JF; Fryxell, JM; Colucci, PE. What constrains daily intake in Thomson’s gazelles? Ecology 1999, 80, 2338–2347. [Google Scholar]
- Wilmshurst, JF; Fryxell, JM; Hudson, RJ. Forage quality and patch choice by wapiti (Cervus elaphus). Behav. Ecol 1995, 6, 209–217. [Google Scholar]
- WallisDeVries, MF; Laca, EA; Demment, MW. The importance of scale of patchiness for selectivity in grazing herbivores. Oecologia 1999, 121, 355–363. [Google Scholar]
- Van Langevelde, F; Drescher, M; Heitkönig, IMA; Prins, HHT. Instantaneous intake rate of herbivores as function of forage quality and mass: Effects on facilitative and competitive interactions. Ecol. Model 2008, 213, 273–284. [Google Scholar]
- Van der Wal, R; Madan, N; van Lieshout, S; Dormann, C; Langvatn, R; Albon, SD. Trading forage quality for quantity? Plant phenology and patch choice by Svalbard reindeer. Oecologia 2000, 123, 108–115. [Google Scholar]
- Festa-Bianchet, M. Seasonal range selection in bighorn sheep: Conflicts between forage quality, forage quantity and predator avoidance. Oecologia 1988, 75, 580–586. [Google Scholar]
- Edouard, N; Fleurance, G; Martin-Rosset, W; Duncan, P; Dulphy, JP; Grange, S; Baumont, R; Dubroeucq, H; Perez-Barberıa, FJ; Gordon, IJ. Voluntary intake and digestibility in horses: Effect of forage quality with emphasis on individual variability. Animal 2008, 2, 1526–1533. [Google Scholar]
- Woolley, LA; Millspaugh, JJ; Woods, RJ; van Rensburg, SJ; Page, BR; Slotow, R. Intraspecific Strategic Responses of African elephants to temporal variation in forage quality. J. Wildlife Manage 2009, 73, 827–835. [Google Scholar]
- Mbatha, KR; Ward, D. The effects of grazing, fire, nitrogen and water availability on nutritional quality of grass in semi-arid savanna, South Africa. J. Arid Environ 2010, 74, 1284–1301. [Google Scholar]
- Norton, BW. Differences between Species in Forage Quality. Nutritional Limits to Animal Production from Pastures; Hacher, JB, Ed.; Commonwealth Agricultural Bureau, Farnham Royal: Slough, UK, 1982; pp. 89–110. [Google Scholar]
- Meissner, HH. Nutrient supplementation of the grazing animal. In Veld Management in South Africa; Tainton, NM, Ed.; University of Natal Press: Pietermaritzburg, South Africa, 1999. [Google Scholar]
- Foley, B; Mcllwee, A; Lawler, I; Agragones, L; Woolnough, AP; Berding, N. Ecological applications of near infrared reflectance spectroscopy—A tool for rapid, cost effective prediction of the composition of plant and animal tissues and aspects of animal performance. Oecologia 1998, 116, 293–305. [Google Scholar]
- Mutanga, O; Skidmore, AK; Prins, HHT. Predicting in situ pasture quality in the Kruger National Park, South Africa, using continuum-removed absorption features. Remote Sens. Environ 2004, 89, 393–408. [Google Scholar]
- Curran, PJ; Kupiec, JA. Imaging spectrometry: A new tool for ecology. In Advances in Environmental Remote Sensing; Danson, FM, Plummer, SE, Eds.; John Wiley & Sons: Chichester, UK, 1995; pp. 71–88. [Google Scholar]
- Wessman, CA. Remote sensing and the estimation of ecosystem parameters and functions. In Imaging Spectrometry–A Tool for Environmental Observations; Kluwer Academic Publisher: Dordrecht, The Netherlands, 1994; pp. 39–56. [Google Scholar]
- Card, DH; Peterson, DL; Matson, PA; Aber, JD. Prediction of leaf chemistry by the use of visible and near infrared reflectance spectroscopy. Remote Sens. Environ 1988, 26, 123–147. [Google Scholar]
- Brooks, J; Anderson, M; Urness, PJ. Infrared reflectance analysis of forage quality for elk. J. Wildl. Manag 1984, 48, 254–258. [Google Scholar]
- Marten, GC; Shenk, JS; Barton, FE. Near Infrared Reflectance Spectroscopy (NIRS): Analysis of Forage Quality; US Department of Agriculture: Washington, DC, USA, 1989. [Google Scholar]
- Norris, KH; Barnes, RF; Moore, JE; Shenk, JS. Predicting forage quality by infrared reflectance spectroscopy. J. Anim. Sci 1976, 43, 889–897. [Google Scholar]
- Curran, PJ; Dungan, JL; Peterson, DL. Estimating the foliar biochemical concentration of leaves with reflectance spectrometry. Testing the Kokaly and Clark methodologies. Remote Sens. Environ 2001, 76, 349–359. [Google Scholar]
- Kumar, L; Schmidt, KS; Dury, S; Skidmore, AK. Imaging spectrometry and vegetation science. In Imaging Spectrometry; van der Meer, F, de Jong, SM, Eds.; Kluwer Academic Publisher: Dordrecht, The Netherlands, 2001. [Google Scholar]
- Clevers, JGPW. The use of imaging spectrometry for agricultural applications. ISPRS J. Photogramm. Remote Sens 1999, 54, 299–304. [Google Scholar]
- Kokaly, R; Clark, RN. Determination of leaf chemical concentration using band-depth analysis of absorption features and stepwise linear regression. Remote Sens. Environ 1999, 90, 104–115. [Google Scholar]
- Serrano, L; Penuelas, J; Ustin, SL. Remote sensing of nitrogen and lignin in Mediterranean vegetation from AVIRIS data: Decomposing biochemical from structural signals. Remote Sens. Environ 2002, 81, 355–364. [Google Scholar]
- Mutanga, O; Skidmore, AK. Integrating imaging spectroscopy and neural networks to map grass quality in the Kruger National Park, South Africa. Remote Sens. Environ 2004, 90, 104–115. [Google Scholar]
- Starks, PJ; Coleman, SW; Phillips, WA. Determination of forage chemical composition using remote sensing. Rangel. Ecol. Manag 2004, 57, 635–640. [Google Scholar]
- Mutanga, O; Skidmore, AK. Narrow band vegetation indices overcome the saturation problem in biomass estimation. Int. J. Remote Sens 2004, 25, 3999–4014. [Google Scholar]
- Mutanga, O; Skidmore, AK; Kumar, L; Ferwerda, J. Estimating tropical pasture quality at canopy level using band depth analysis with continuum removal in the visible domain. Int. J. Remote Sens 2005, 26, 1093–1108. [Google Scholar]
- Mutanga, O; Skidmore, AK. Red edge shift and biochemical content in grass canopies. ISPRS J. Photogramm. Remote Sens 2007, 62, 31–42. [Google Scholar]
- Kawamura, K; Watanabe, N; Sakanoue, S; Inoue, Y. Estimating forage biomass and quality in a mixed sown pasture based on partial least squares regression with waveband selection. Grassland Sci 2008, 54, 131–145. [Google Scholar]
- Perbandt, D; Fricke, T; Wachendorf, M. Effects of changing simulated sky cover on hyperspectral reflectance measurements for dry matter yield and forage quality prediction. Comput. Electron. Agric 2010, 73, 230–239. [Google Scholar]
- Asner, GP; Wessman, CA; Bateson, CA; Privette, JL. Impact of tissue, canopy and landscape factors on the hyperspectral reflectance variability of arid zone ecosystems. Remote Sens. Environ 2000, 74, 69–84. [Google Scholar]
- Guo, X. Discrimination of Saskatchewan prairie ecoregions using multitemporal 10-day composite NDVI data. Prairie Per 2002, 5, 174–186. [Google Scholar]
- Asner, GP; Wessman, CA; Schimel, DS; Archer, S. Variability in leaf and litter optical properties: Implications for canopy BRDF model inversions using AVHRR, MODIS, and MISR. Remote Sens. Environ 1998, 63, 200–215. [Google Scholar]
- White, TA; Barker, DJ; Moore, KJ. Vegetation diversity, growth, quality and decomposition in managed grasslands. Agric. Ecosys. Environ 2004, 80, 213–226. [Google Scholar]
- Marriott, CA; Bolton, GR; Fisher, JM; Hood, K. Short-term changes in soil nutrients and vegetation biomass and nutrient content following the introduction of extensive management in upland sown swards in Scotland, UK. Agric. Ecosys. Environ 2005, 106, 331–344. [Google Scholar]
- Pavlu, V; Hejcman, M; Pavlu, L; Gaisler, J; Nezerkova, P. Effect of continuous grazing on forage quality, quantity and animal performance. Agric. Ecosys. Environ 2005, 113, 349–355. [Google Scholar]
- Heitschmidt, RK; Dowhower, SL; Walker, JW. Some effects of a rotational grazing treatment on quantity and quality of available forage and amount of ground litter. J. Range Manage 1987, 40, 318–321. [Google Scholar]
- Coupland, RT. Ecology of mixed prairie in Canada. Ecol. Monogr 1950, 20, 271–315. [Google Scholar]
- Environment Canada Canadian Climate Normals or Averages 1971–2000. Available online: http://www.climate.weatheroffice.ec.gc.ca/climate_normals/index_e.html (accessed on 7 July 2010).
- Tucker, CJ. A critical review of remote sensing and other methods for non-destructive estimation of standing crop biomass. Grass Forage Sci 1980, 35, 177–182. [Google Scholar]
- Dawson, TP; Curran, PJ. Technical note A new technique for interpolating the reflectance red edge position. Int. J. Remote Sens 1998, 19, 2133–2139. [Google Scholar]
- Kokaly, RF; Clark, RN. Spectroscopic determination of leaf biochemistry using band-depth analysis of absorption features and stepwise multiple linear regression. Remote Sens. Environ 1999, 67, 267–287. [Google Scholar]
- Curran, PJ; Dungan, JL; Peterson, DL. Estimating the foliar biochemical concentration of leaves with reflectance spectrometry: Testing Kokaly and Clark methodologies. Remote Sens. Environ 2001, 76, 349–359. [Google Scholar]
- Price, KP; Guo, X; Stiles, JM. Optimal Landsat TM band combinations and vegetation indices for discrimination of six grassland types in eastern Kansas. Int. J. Remote Sens 2002, 23, 5031–5042. [Google Scholar]
- Spedding, CRW. Grassland Ecology; Oxford University Press: Oxford, UK, 1971. [Google Scholar]
- Starks, PJ; Zhao, D; Phillips, WA; Coleman, SW. Development of canopy reflectance algorithms for real-time prediction of Bermudagrass pasture biomass and nutritive values. Crop Sci 2006, 46, 927–934. [Google Scholar]
- Tucker, CJ. Spectral estimation of grass canopy variables. Remote Sens. Environ 1977, 6, 11–26. [Google Scholar]
- Horler, HND; Dockray, M; Barber, J. The red edge of plant leaf reflectance. Int J. Remote Sens 1983, 4, 273–288. [Google Scholar]
- Lamb, WD; Steyn-Ross, M; Schaare, P; Hanna, MM; Silvester, W; Steyn-Ross, A. Estimating leaf nitrogen concentration in ryegrass (Lolium spp.) pasture using the chlorophyll red-edge: Theoretical modelling and experimental observations. Int. J. Remote Sens 2002, 23, 3619–3648. [Google Scholar]
- Buxton, DR. Quality-related characteristics of forages as influenced by plant environment and agronomic factors. Anim. Feed Sci. Tech 1996, 59, 37–49. [Google Scholar]
- Mowat, DN; Fulkerson, RS; Tossell, WE; Winch, JE. The in vitro digestibility and protein content of leaf and stem portions of forages. Can. J. Plant Sci 1965, 45, 321–331. [Google Scholar]
- Halim, RA; Buxton, DR; Hattendorf, MJ; Carlson, RE. Water-stress effects on alfalfa forage quality after adjustment for maturity differences. Agron. J 1989, 81, 189–194. [Google Scholar]
- Wilson, JR. Effects of water stress on in vitro dry matter digestibility and chemical composition of herbage of tropical pasture species. Aust. J. Agric. Res 1983, 34, 377–390. [Google Scholar]
- Elvidge, CD. Visible and near infrared reflectance characteristics of dry plant materials. Int. J. Remote Sens 1990, 11, 1775–1795. [Google Scholar]
- Milchunas, DG; Varnamkhasti, AS; Lauenroth, WK; Goetz, H. Forage quality in relation to long-term grazing history, current-year defoliation, and water resource. Oecologia 1995, 101, 366–374. [Google Scholar]
- Ónodi, G; Kertész, M; Botta-Dukát, Z. Effects of simulated grazing on open perennial sand grassland. Community Ecol 2006, 7, 133–141. [Google Scholar]
- Poorter, H. Interspecific variation in the growth response of plants to an elevated ambient CO2 concentration. Plant Ecol 1993, 104–105, 77–97. [Google Scholar]
- Coupland, RT. The effects of fluctuations in weather upon the grasslands of the Great Plains. Bot. Rev 1958, 24, 273–317. [Google Scholar]
- Ehleringer, JR; Sage, RF; Flanagan, LB; Pearcy, RW. Climate change and the evolution of C4 photosynthesis. Trend. Ecol. Evol 1991, 6, 95–99. [Google Scholar]
- Pearcy, RW; Ehleringer, J. Comparative ecophysiology of C3 and C4 plants. Plant Cell Environ 1984, 7, 1–13. [Google Scholar]
- Carter, DR; Peterson, KM. Effects of a CO2-enriched atmosphere on the growth and competitive interaction of a C3 and a C4 grass. Oecologia 1983, 58, 188–193. [Google Scholar]
- Hunt, HW; Trlica, MJ; Redente, EF; Moore, JC; Detling, JK; Kittel, TGF; Walter, DE; Fowler, MC; Klein, DA; Elliott, ET. Simulation model for the effects of climate change on temperate grassland ecosystems. Ecol. Model 1991, 53, 205–246. [Google Scholar]
- Knapp, AK; Fay, PA; Blair, JM; Collins, SL; Smith, MD; Carlisle, JD; Harper, CW; Danner, BT; Lett, MS; McCarron, JK. Rainfall variability, carbon cycling, and plant species diversity in a mesic grassland. Science 2002, 298, 2202–2205. [Google Scholar]
- Coppock, DL; Detling, JK; Ellis, JE; Dyer, MI. Plant-herbvivore interactions in a North American mixed-grass prairie I. Effects of black-tailed prarie dogs on intraseasonal aboveground plant biomass and nutritional dynamics and plant species diversity. Oecologia 1983, 56, 1–9. [Google Scholar]
- Van Soest, PJ; Mertens, DR; Deinum, B. Preharvest factors influencing quality of conserved forage. J. Anim. Sci 1978, 47, 712–720. [Google Scholar]


| Chemicals | Abbr. | Unit | N | Mean | Std | Min | Max | CV |
|---|---|---|---|---|---|---|---|---|
| Lignin | Ln | % | 20 | 4.03 | 0.33 | 3.47 | 4.54 | 0.082 |
| Protein | Pt | % | 90 | 8.41 | 1.02 | 6.2 | 12 | 0.121 |
| Ash | Ash | % | 90 | 6.35 | 1.06 | 4.3 | 11 | 0.167 |
| Moisture at 135 °C | Mt | % | 90 | 6.13 | 0.23 | 5.7 | 6.8 | 0.038 |
| Neutral Detergent Fiber | NDF | % | 90 | 65.47 | 2.11 | 57 | 70.7 | 0.032 |
| Acid Detergent Fiber | ADF | % | 90 | 35.49 | 1.5 | 30.1 | 39.4 | 0.042 |
| Total Digestible Nutrients | TDN | % | 90 | 54.67 | 1.58 | 50.69 | 59.83 | 0.029 |
| Digestible Energy | DE | Mcal/kg | 90 | 2.39 | 0.07 | 2.2 | 2.63 | 0.029 |
| Net Energy for Lactation | NEI | Mcal/kg | 90 | 1.23 | 0.04 | 1.13 | 1.36 | 0.033 |
| Net Energy for Maintenance | NEm | Mcal/kg | 90 | 1.16 | 0.05 | 1.01 | 0.49 | 0.043 |
| Net Energy for Gain | NEg | Mcal/kg | 90 | 0.63 | 0.05 | 0.49 | 0.8 | 0.079 |
| Variables | Methods | Width ranges (nm) | |||||
|---|---|---|---|---|---|---|---|
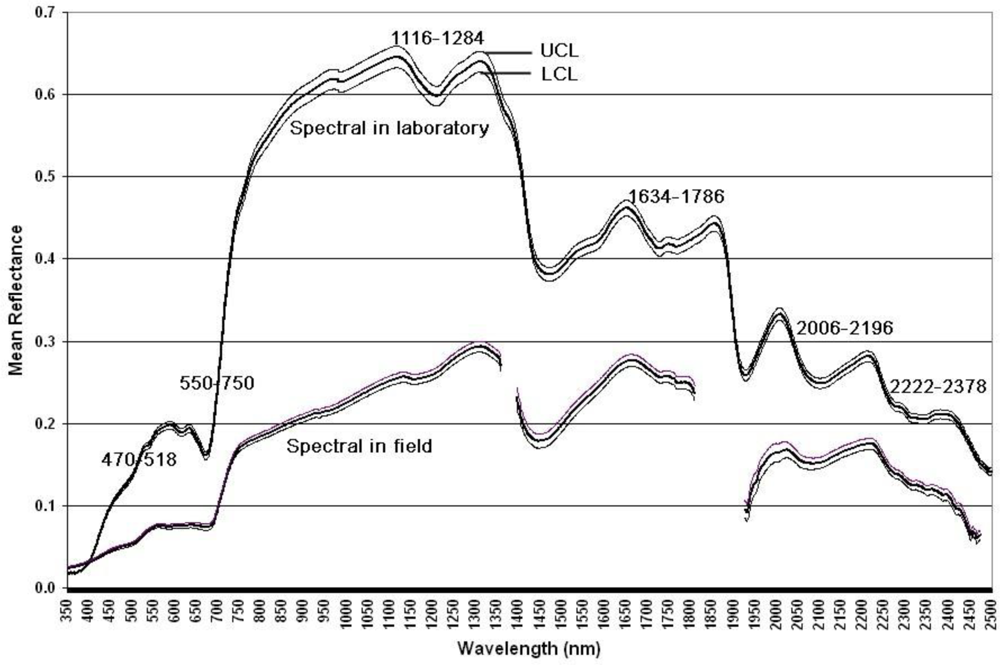
| 470–518 | 550–750 | 1,116–1,284 | 1,634–1,786 | 2,006–2,196 | 2,222–2,378 | ||
| Protein | Lab | \ | .328** | \ | .213* | \ | \ |
| Field | .641** | .695** | .645** | −.508** | −.812** | −.567** | |
| Ash | Lab | \ | −.267* | \ | \ | \ | |
| Field | .425* | .484** | .388* | \ | −.483** | \ | |
| Moisture | Lab | \ | −.231* | \ | \ | \ | |
| Field | .489** | .547** | .503** | \ | −.445* | \ | |
| ADF | Lab | −.429** | −.250* | −.258* | −.237* | \ | \ |
| NDF | Lab | −.218* | \ | \ | \ | \ | \ |
| TDN | Lab | .465** | .278** | .297** | .254* | \ | \ |
| DE | Lab | .463** | .280** | .291** | .256* | \ | \ |
| NEL | Lab | .461** | .263* | .300** | .246* | \ | \ |
| NEm | Lab | .455** | .279** | .288** | .253* | \ | \ |
| NEg | Lab | .456** | .273** | .282** | .241* | \ | \ |
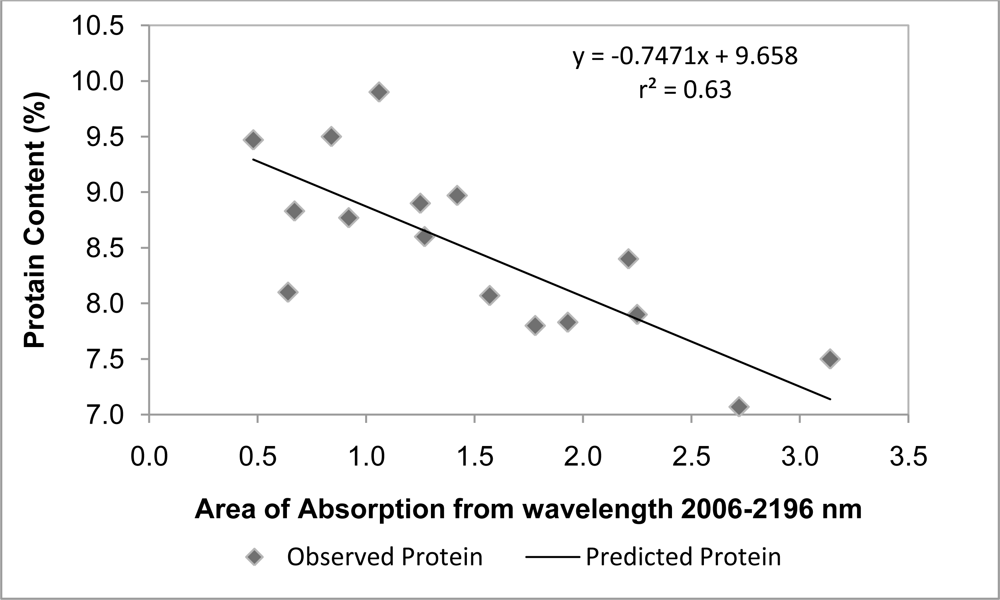
| Absorption area | Observed Protein | Predicted Protein | RMSE | ARE |
|---|---|---|---|---|
| 0.5 | 10 | 9.28 | 0.63 | 0.08 |
| 0.79 | 8.7 | 9.07 | ||
| 1.31 | 8.97 | 8.68 | ||
| 1.98 | 7.53 | 8.18 | ||
| 2.65 | 7 | 7.68 | ||
| 2.09 | 7.2 | 8.10 |
| Category | Statistics | Chemical variables | Protein | Wavelength regions | |||||||||
|---|---|---|---|---|---|---|---|---|---|---|---|---|---|
| ADF | Ash | Mt | NDF | Ln | 470–518 | 550–750 | 1,116–1,284 | 1,634–1,786 | 2,006–2,196 | 2,222–2,378 | |||
| N | 45 | 45 | 45 | 45 | 10 | 45 | 15 | 15 | 15 | 15 | 15 | 15 | |
| Mean | 35.2 | 6.6 | 6.2 | 64.7 | 3.9 | 8.3 | 0.06 | 0.10 | 0.28 | 0.27 | 0.17 | 0.14 | |
| Std. | 1.51 | 1.29 | 0.25 | 2.14 | 0.38 | 0.92 | 0.01 | 0.01 | 0.01 | 0.02 | 0.02 | 0.01 | |
| Grazed | Min | 30.1 | 4.3 | 5.7 | 57 | 3.47 | 6.2 | 0.05 | 0.08 | 0.25 | 0.24 | 0.14 | 0.11 |
| Max | 37.5 | 11 | 6.8 | 68.4 | 4.54 | 10.2 | 0.06 | 0.11 | 0.30 | 0.29 | 0.19 | 0.16 | |
| Range | 7.4 | 6.7 | 1.1 | 11.4 | 1.07 | 4 | 0.02 | 0.02 | 0.05 | 0.06 | 0.06 | 0.05 | |
| CV | 0.04 | 0.2 | 0.04 | 0.03 | 0.1 | 0.11 | 0.09 | 0.07 | 0.05 | 0.06 | 0.10 | 0.09 | |
| N | 45 | 45 | 45 | 45 | 10 | 45 | 15 | 15 | 15 | 15 | 15 | 15 | |
| Mean | 35.8 | 6.1 | 6 | 66.3 | 4.1 | 8.5 | 0.05 | 0.09 | 0.25 | 0.25 | 0.15 | 0.13 | |
| Std. | 1.43 | 0.73 | 0.15 | 1.77 | 0.24 | 1.12 | 0.01 | 0.01 | 0.01 | 0.02 | 0.02 | 0.01 | |
| ungrazed | Min | 32.4 | 4.3 | 5.7 | 61.8 | 3.8 | 6.8 | 0.04 | 0.08 | 0.24 | 0.23 | 0.13 | 0.11 |
| Max | 39.4 | 7.7 | 6.4 | 70.7 | 4.54 | 12 | 0.06 | 0.10 | 0.28 | 0.28 | 0.18 | 0.15 | |
| Range | 7 | 3.4 | 0.7 | 8.9 | 0.74 | 5.2 | 0.02 | 0.02 | 0.05 | 0.05 | 0.06 | 0.04 | |
| CV | 0.04 | 0.12 | 0.03 | 0.03 | 0.06 | 0.13 | 0.12 | 0.07 | 0.04 | 0.06 | 0.12 | 0.11 | |
| Sig. | 0.03 | 0.05 | 0.00 | 0.00 | 0.13 | 0.36 | 0.01 | 0.00 | 0.00 | 0.00 | 0.01 | 0.00 | |
© 2010 by the authors; licensee Molecular Diversity Preservation International, Basel, Switzerland. This article is an open-access article distributed under the terms and conditions of the Creative Commons Attribution license (http://creativecommons.org/licenses/by/3.0/).
Share and Cite
Guo, X.; Wilmshurst, J.F.; Li, Z. Comparison of Laboratory and Field Remote Sensing Methods to Measure Forage Quality. Int. J. Environ. Res. Public Health 2010, 7, 3513-3530. https://doi.org/10.3390/ijerph7093513
Guo X, Wilmshurst JF, Li Z. Comparison of Laboratory and Field Remote Sensing Methods to Measure Forage Quality. International Journal of Environmental Research and Public Health. 2010; 7(9):3513-3530. https://doi.org/10.3390/ijerph7093513
Chicago/Turabian StyleGuo, Xulin, John F. Wilmshurst, and Zhaoqin Li. 2010. "Comparison of Laboratory and Field Remote Sensing Methods to Measure Forage Quality" International Journal of Environmental Research and Public Health 7, no. 9: 3513-3530. https://doi.org/10.3390/ijerph7093513