Article

Analysis of Exertion-Related Injuries and Fatalities in Laborers in the United States

by
Margaret C. Morrissey
1,*,
Zachary Yukio Kerr
2,
Gabrielle J. Brewer
1,
Faton Tishukaj
3,
Douglas J. Casa
1 and
Rebecca L. Stearns
1
1
Korey Stringer Institute, Department of Kinesiology, University of Connecticut, Storrs, CT 06269, USA
2
Department of Exercise and Sport Science, University of North Carolina at Chapel Hill, Chapel Hill, NC 27599, USA
3
Department of Physical Education and Sport, University of Prishtina, 10000 Prishtina, Kosovo
*
Author to whom correspondence should be addressed.
Int. J. Environ. Res. Public Health 2023, 20(3), 2683; https://doi.org/10.3390/ijerph20032683
Submission received: 6 December 2022 / Revised: 27 January 2023 / Accepted: 28 January 2023 / Published: 2 February 2023

Abstract

:
Laborers are particularly vulnerable to exertional injuries and illnesses, as they often engage in heavy physical work for prolonged hours, yet no studies have examined the top causes of catastrophic exertional injuries and fatalities among this population. The purpose of the investigation was to characterize the top causes of exertional injury and fatality within open access, Occupational Safety and Health Administration (OSHA) reportable data. A secondary analysis of OSHA reported injury and fatality data was performed through open access records from OSHA Severe Injury Reports (2015–2022) and OSHA fatality inspection data (2017–2020), respectively. The research team characterized each reported injury and fatality as “exertion-related” or “non-exertion-related. Injury and fatality rates were reported per 100,000 equivalent full-time worker years and included 95% confidence intervals (95% CI). Of 58,648 cases in the OSHA Severe Injury Report database from 2015–2020, 1682 cases (2.9%) were characterized as exertional (0.20 injuries per 100,000 full-time worker years, 95% CI: 0.19, 0.22). Heat-related injuries encompassed 91.9% of the exertional injuries (n = 1546). From the 2017–2022 OSHA fatality inspection database, 89 (1.9%) of 4598 fatalities were characterized as exertion-related (fatality rate: 0.0160 per 100,000 full-time equivalent workers, 95% CI: 0.009, 0.0134). The exertion-related fatalities primarily consisted of heat-related cases (87.6%). Exertion-related injuries and fatalities were most reported in Southeast states, in the construction and excavation industry, and among nonunionized workers. As heat stress continues to be recognized as an occupational health and safety hazard, this analysis further highlights the need for targeted interventions or further evaluation of the impact of heat stress on construction and excavation workers, nonunionized workers, and workers in Southeastern states.

1. Introduction

Nearly 340 million occupational accidents and 160 million occupational illnesses are reported globally each year, costing the global economy over 1.25 trillion dollars [1]. Consequently, occupational safety and health is a public health priority in the United States. Much research has examined the nature, cause, and characteristics of injuries and fatalities to create effective prevention and risk management strategies [2,3,4,5,6]. However, research initiatives have focused primarily on accident-related data. In contrast, exertion-related injuries and fatalities have received little attention. Exertion-related injuries and fatalities are important to consider, as laborers, workers who engage in physical activity during their job such as farmers, construction workers, and assembly line workers, engaging in heavy physical work for prolonged hours and often in environmental extremes [7]. Exertion-related injuries and fatalities result from bodily dysfunction or disruption of normal physiological processes. Examples include heat-related, cold-related, and cardiac events. Top causes of exertion-related injuries and fatalities have been extensively examined in US high school athletics and the military [8,9,10,11,12,13], which encompass 8 million and 1.3 million people, respectively [14,15]. However, no studies have examined the top causes of catastrophic exertional injuries and death within the much larger population of workers who perform physical exertion in their jobs (approximately 134.5 million in the US) [16].
To evaluate occupational injuries and illnesses, US employers with more than 10 employees in most public sector companies (and some of the public sector dependent on state jurisdictions) are required to keep record and report serious injuries and deaths to the Occupational Safety and Health Administration (OSHA) [17]. The OSHA was created as part of the Occupational Safety and Health Act (1970) to ensure safety of workers by enforcing safety standards, providing training, outreach, education and documenting the frequency, characteristics, and cause of occupation-related injuries and illnesses [17]. Occupational injuries, illnesses, and deaths have dramatically reduced since the Act’s creation, from 38 worker deaths per day in 1970 to 15 worker deaths per day in 2020 [2,16,18]. Still, many worksites remain unsafe and fatalities continue to occur [18]. For example, in 2020, the incidence of total recordable nonfatal injuries in the private industry was 2.7 cases per 100 full-time workers [18] and fatal work injuries 3.4 fatalities per 100,000 full-time workers [18]. These data on injury and fatality rates are reported in OSHA public databases, which are made public to allow researchers to systematically examine the frequency and characteristics of injuries and fatalities. This critical analysis will assist the OSHA, employers, and other safety stakeholders create effective interventions that target vulnerable working populations and worksites.
Therefore, the purpose of this study was to characterize the top causes of exertion-related injury and fatality within the OSHA data. It was hypothesized that heat-related injuries and fatalities would be among the top three causes of injury and death. As a secondary objective, injury and fatality accident data were examined to evaluate whether there were seasonal differences (i.e., differences in summer compared to non-summer) in accident occurrence. It was hypothesized that the summer months (June, July, August, September) would have significantly higher accident-related injuries and fatalities than other months of the year.

2. Methods

Institutional Review Board approval was not required as this study was a secondary analysis of deidentified data that examined exertion- and accident-related injuries and fatalities previously aggregated by OSHA. The cause of each reported injury or fatality was classified by the OSHA and the research team, then characterized as either “exertional” or “non-exertional.” “Exertional” was defined as an injury or fatality resulting from bodily dysfunction or disruption of normal physiological processes. Occupational Injury and Illness Classification System codes were reviewed to determine which sections were characterized as exertion-related (Table S1). All other data were characterized as non-exertional and divided further into two categories: (1) accident-related and (2) non-accident-related. Accident data were defined as injuries or fatalities that did not represent an “intent to harm” (i.e., gunshot, violence). All “intent to harm” cases were characterized as “non-exertional, non-accident related.” Members of the research team (M.M., G.B.) used these inclusion criteria to select cases that were to be considered for analysis.

2.1. Data Sources and Extraction for Exertion-Related Injuries and Fatalities

Severe injury data were identified through open-access records from OSHA Severe Injury Reports (www.osha.gov/severeinjury accessed on 15 November 2021) [19]. The Severe Injury Reports is a database that consists of in-patient hospitalization data. The Occupational Injury and Illness Classification System and corresponding codes were utilized to obtain exertion-related severe injury data [20]. Injury data from 2015–2020 were utilized to summarize current leading causes of exertional injuries. The following columns were extracted from the Severe Injury Reports database: employer, event date, city, state, zip code, nature title, case narrative, and event title.
Fatality data were identified through open access records from OSHA fatality inspection data (www.osha.gov/fatalities accessed on 15 November 2021) [21]. Keywords describing exertion-related injuries within the severe injury database were selected a priori (Table S2) and entered individually in the fatality inspection database for fatality record retrieval. Data from 2017–2020 for fatality data were utilized. The 2017–2020 time frame was chosen as all other OSHA fatality data were archived and did not include descriptive information on each corresponding fatality. We extracted the following information for each OSHA fatality report: employer, event date, city, state, zip code, brief description of event, event title, union status, and occupation. All fatality reports were extracted individually and combined into a new dataset.
Once fatality and severe injury data were extracted from the databases, each record was screened independently by two coders and allocated to groups (“exertional” and “non-exertional”) based on the cause using the case narrative, event title, and Occupational Injury and Illness Classification System code. All disagreements between coders were resolved through discussion, and a third individual was consulted as a “tiebreaker.” The occupation of each injury and fatality report was characterized by the Labor of Bureau Statistics criteria. For example, postal workers were characterized as “Personal Service.” Business size data were reported only for heat-related injuries and fatalities and were collected through accessing publicly available websites related to employer information (i.e., employer websites).

2.2. Data Sources and Extraction for Accident Fatalities

A subset of fatality and severe injury data [19,21] that were identified as non-exertional and accident-related were examined in relation to time of year. Time of year was characterized based on month of the year that the event (injury or fatality) occurred and extracted from event date data.

2.3. Statistical Analysis

Data were extracted, managed, and analyzed using Microsoft Excel (Microsoft, Redmond, WA, USA). Data are presented as counts with corresponding rate calculations. Injury and fatality data were utilized as the numerator to assess injury and fatality rates. The injury and fatality data used number of hours worked and corresponding equivalent full-time workers reported from the Bureau of Labor Statistics [22] as the denominator for the estimates. In the most recent available data, there were 134,950,000 estimated full-time workers (269,900,000 total hours worked) within working populations that perform physical labor as part of their occupation. All data are reported per 100,000 equivalent full-time worker years and as a yearly average using 2019 data reported from OSHA [22]. Injury and fatality rates are reported with 95% confidence intervals (95% CIs calculated from the reported average margin of errors within the dataset [22]. The rates were calculated using the following equation:
Rate   ( per   100,000   FTE ) = N 134,950,000 × 1 number   of   years × 100,000
Equation (1): Injury or Fatality Rate Calculation.
FTE = full-time equivalent workers; N = the number of fatalities or injuries; 134,950,000 = total equivalent workers in the US performing physical exertion (working 40 h per week, at least 50 weeks per year).
Rates were calculated only for overall exertion-related injuries and illnesses, as other parameters (i.e., region, industry) lacked the depth to accurately quantify these values.
Accident data were evaluated based on seasonal trends to examine whether there were seasonal differences in accident-related injuries and fatalities. Data were divided into two seasons: summer (June–September) and non-summer (October–May). For injuries, that would include 18 summer months and 54 non-summer months and fatalities included 12 summer months and 36 non-summer months. A Mann–Whitney U-test was performed to assess differences in distribution across accident-related injury and fatality data between summer and non-summer seasons. Accident data are reported as medians (MEDs) and interquartile ranges (IQRs). Alpha level was set at p = 0.05.

3. Results

3.1. Exertion-Related Injuries

Of 58,648 cases in the OSHA Severe Injury Report database from 2015 to 2020, 1682 (2.9%) were characterized as exertional (Table 1). Heat-related injuries encompassed 91.9% of the exertional injuries (n = 1546). The remaining exertional injuries consisted of: cardiac events (6%, n = 101), pulmonary embolism events (0.06%, n = 1), anemia events (0.06%, n = 1), anaphylactic shock events (1.07%, n = 18), and cold-related injuries (0.89%, n = 15; Table 2). Exertion-related injury rates and summary statistics are presented in Table 2. The overall exertion-related injury rate was 0.20 injuries per 100,000 full-time equivalent workers (95% CI = 0.19, 0.22).
The most common injuries were heat-related (injury rate: 0.19 injuries per 100,000 full-time equivalent worker years, 95% CI = 0.18, 0.20), in the Southeast region (n = 638), and in the construction and excavation industry (n = 334). Within the heat-related injuries, 50.8% (n = 855) were within businesses that had over 500 employees, 15.1% (n = 254) were businesses with 100–500 employees, 24.4% (n = 410) were businesses with fewer than 100 employees, and 9.7% (n = 163) were unknown.

3.2. Exertion-Related Fatalities

In 2017–2020, there were 4598 fatalities reported in the OSHA fatality inspection database. Of the 4598 fatalities reported, 89 (1.9%) were characterized as exertion-related (fatality rate: 0.0160 per 100,000 full-time equivalent workers, 95% CI 0.009, 0.0134; Table 3). The exertion-related fatalities consisted of heat-related (87.6%, n = 78), cardiac events (8.9%, n = 8), cold-related (2.4%, n = 2), and asthmatic events (1.1%, n = 1; Table 4, Figure 1A). Fatalities occurred most in the Southeast (n = 28), in the construction industry (n = 24, Figure 1B), and among workers who were nonunionized (80.8%). Within the exertion-related heat fatalities, 6.4% (n = 5) were within businesses that had over 500 employees, 15.4% (n = 12) with 100–500 employees, 69.2% (n = 54) fewer than 100 employees, and 8.9% (n = 7) were unknown.

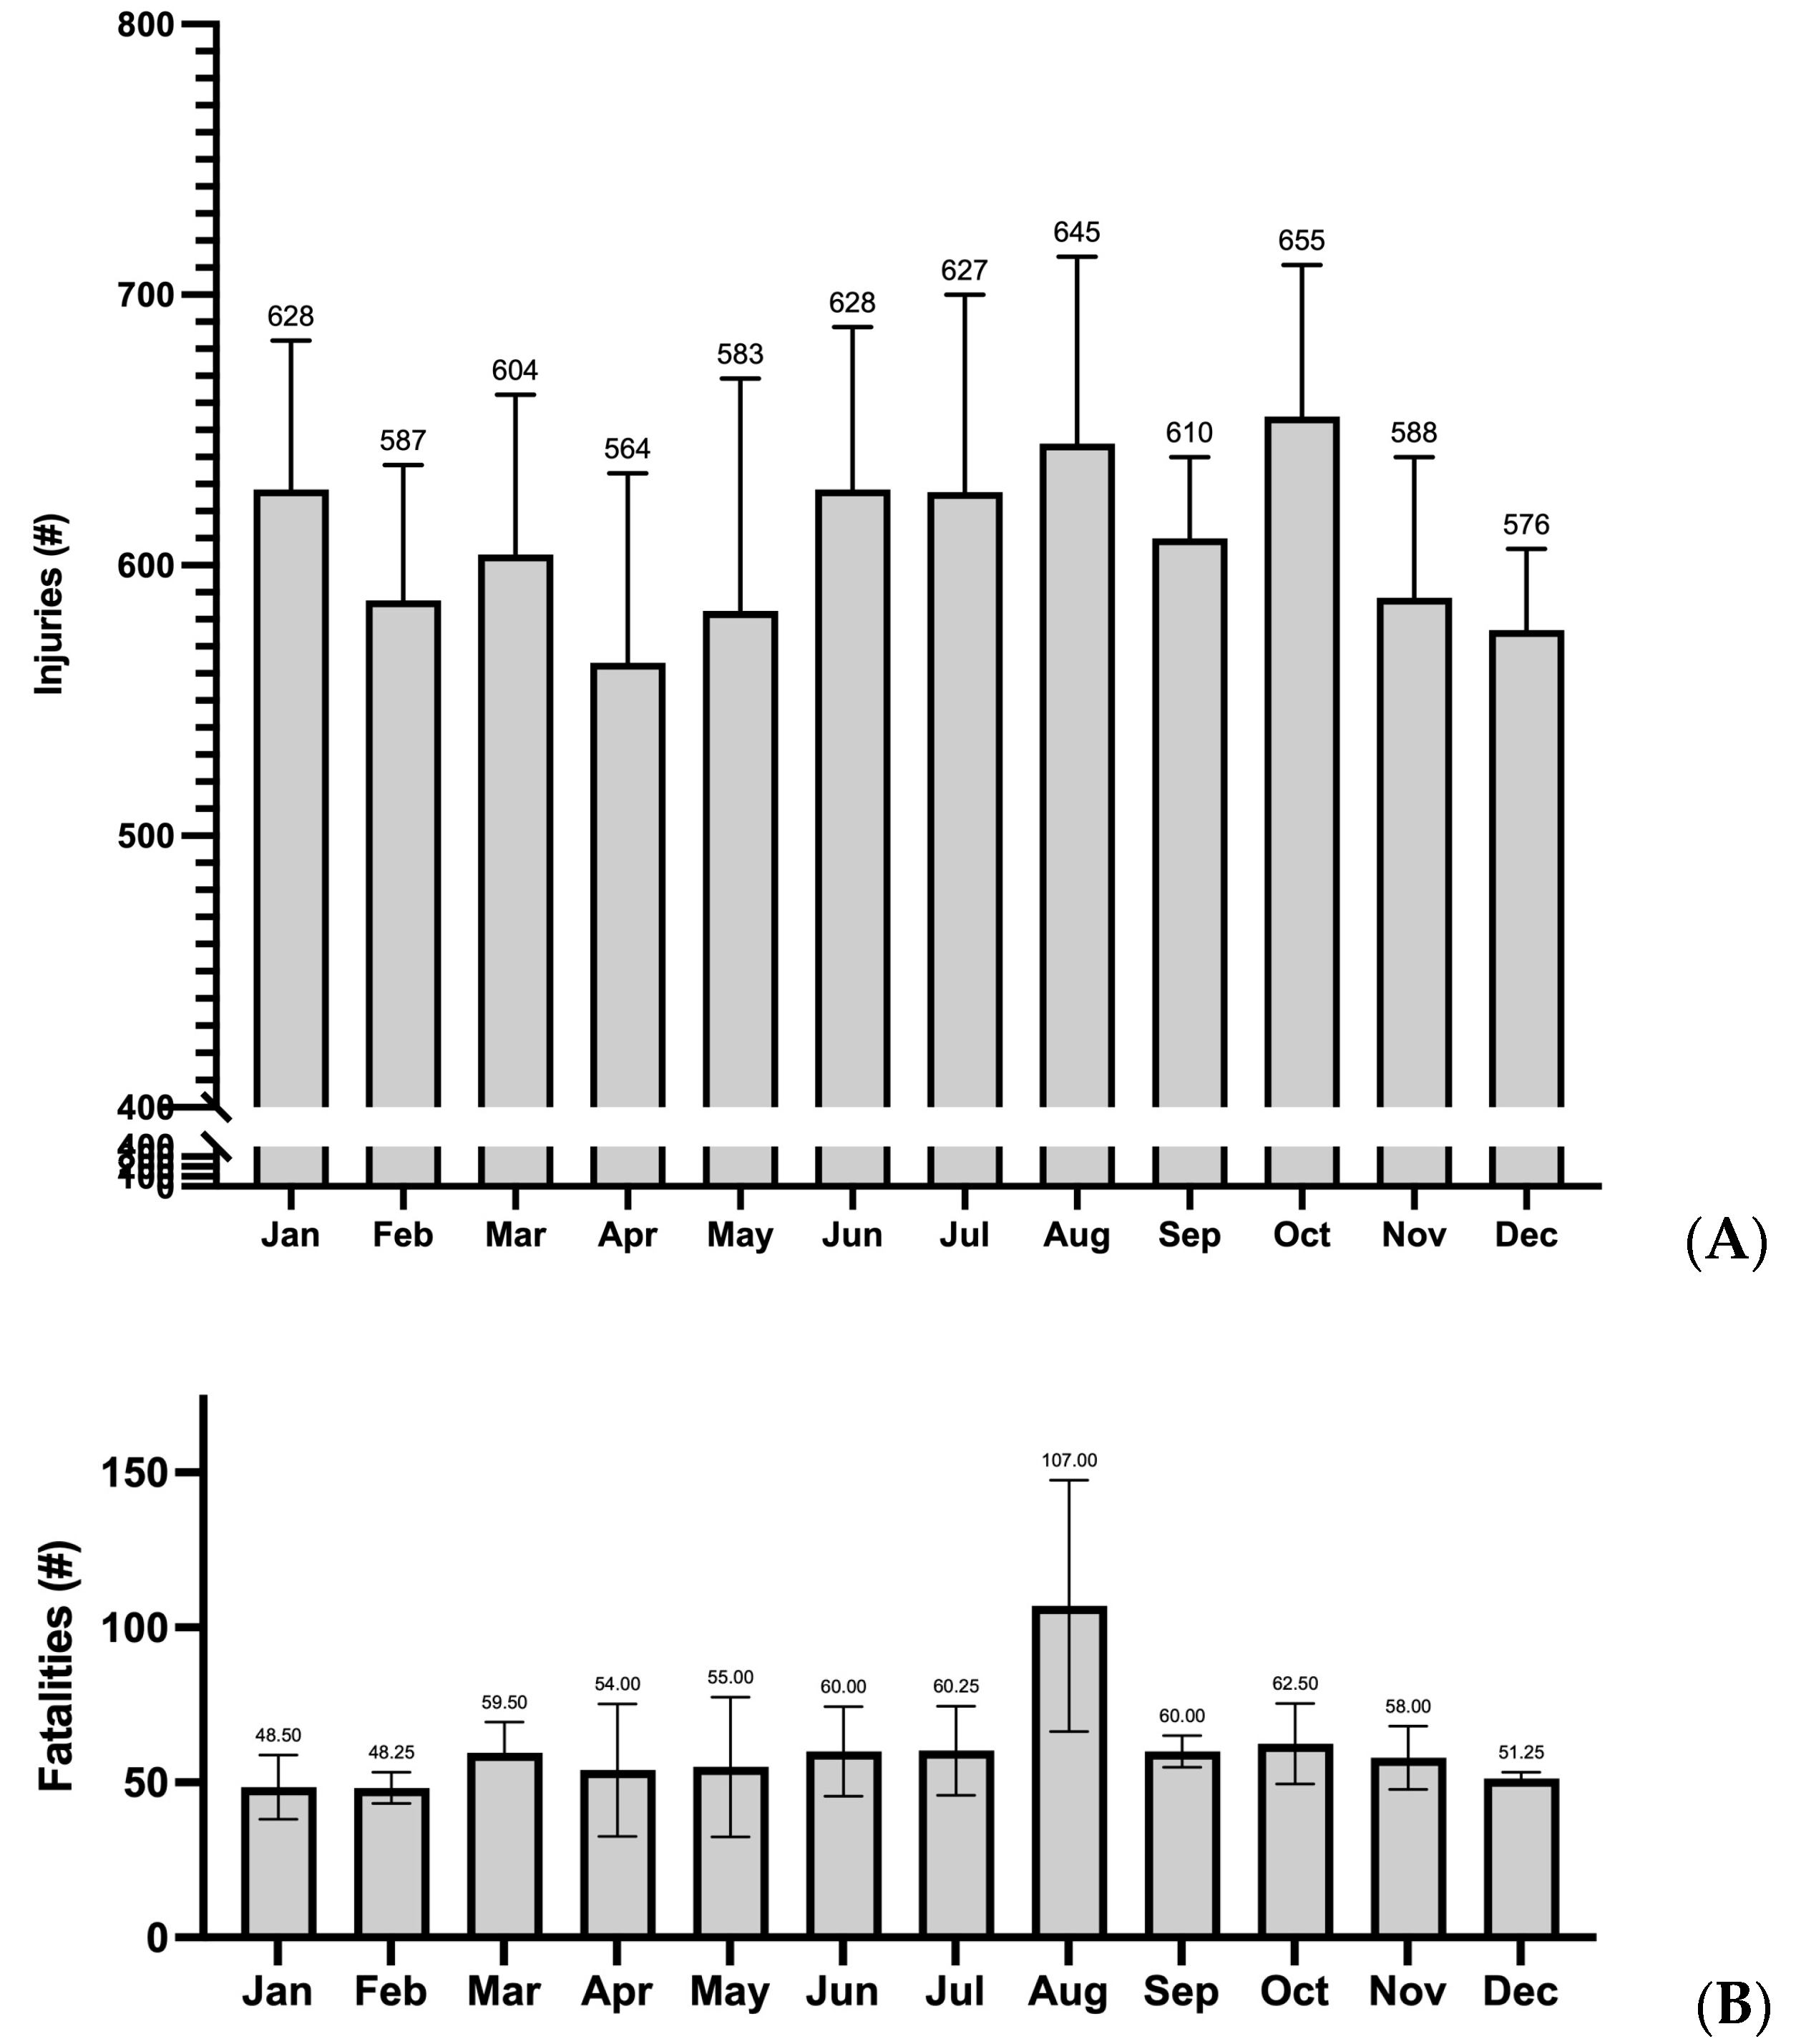
3.3. Accident-Related Injuries and Fatalities

The average annual number of accident-related injuries in 2015–2020 was highest in October and lowest in April (Figure 1A, Table 5). The distributions of accident-related injuries for summer (MED: 628; IQR: 614 to 641) and non-summer (MED: 588; IQR: 577 to 622) did not significantly differ (p = 0.154). For accident-related fatalities in 2017–2020, the average annual number was highest in August and lowest in February (Figure 2B, Table 5). Accident-related fatalities in summer (MED: 60; IQR: 60 to 95) were higher than those not in summer (MED: 56; IQR: 50 to 59; p = 0.048). Table 5 presents the number accidents resulting in an injury or fatality per month every year.

4. Discussion

This secondary analysis examined the top causes of exertion-related injuries and fatalities within OSHA-reported databases. To our knowledge, this is the first investigation to extract data with the intent to quantify and characterize worker injuries and fatalities resulting from bodily dysfunction (i.e., exertion-related). The top cause of exertion-related injury and fatality was heat-related, accounting for 87.6% and 91.9% of the data, respectively. The most common injuries and fatalities were in the Southeast region, construction and excavation industry, and among nonunionized workers (fatalities only). Interestingly, most exertion-related injuries occurred within businesses with more than 500 employees and fatalities most often occurred in businesses with fewer than 100 employees. Within our secondary objective, we examined seasonal trends (summer vs. non-summer) in accident data. Accident-related fatalities that occurred in summer were higher than in non-summer.
Our findings contribute to the existing literature that heat illness is considered a top cause of injury and fatality within the physically active, which includes military [8,10], athletics [12], and now laborers. Although the injury and fatality rates remain small (0.20 and 0.0160 per 100,000 full-time equivalent worker years), the OSHA characterized heat as one of its top priorities by announcing the start of the rule making progress to implement a mandated federal heat stress standard [23]. Considering this announcement, other key safety stakeholder groups (e.g., American Industrial Hygienist Association, American College of Governmental Industrial Hygienists, National Safety Council, and American Society of Safety Professionals) have recognized the dangers of heat stress and created task forces, working groups, and committees to create educational materials, voluntary standards, and more to help spread awareness. Our findings further support these initiatives to take action to identify heat hazards and implement heat stress management strategies.
Heat-related injuries and fatalities in the current investigation appeared to be reported disproportionally across the US, with most data from the Southeast region. The Southeast is considered a rapidly growing region as the population has increased by 61% since 1980, whereas the rest of the US has grown by only 36% [24]. Although the resident population is rising in the Southeast, which may account for increases in reported injuries and fatalities, there may be a geographical variation in reported heat-related injuries and fatalities suggesting Southeast and Southwest regions are more susceptible than the Midwest, West, and Northeast regions. This contradicts the paradigm that seasonal acclimatization, where workers are exposed to heat stress more frequently, experienced by workers in southern states would reduce heat-related mortality (i.e., greater risk in northern US) [25]. Increased heat-related cases in the Southeast may extend beyond physiologic susceptibility and may be attributed to socioeconomic status [26,27,28,29,30]. Low socioeconomic workers are overwhelmingly exposed to occupational heat stress, with the lowest-paid 20% of workers suffering five times as many heat-related injuries as the highest-paid 20% [31,32]. Families in the South are more likely to earn low incomes compared to other regions in the US, and Jung et al. (2021) reported that in a case-crossover study and spatial analysis evaluating heat vulnerability in Florida that counties with higher average income per person had lower risk of heat-related health outcomes [30,33]. For every $1000 decrease in average income per person, there was a 0.006% increase in heat-related illness emergency room visits [30].
Many counties in the US, such as in Southern states, that are classified as having high levels of social vulnerability are those with a high number of crop workers [34]. Within known and reported cases, it is well established that US crop workers are 35 times more likely to die from heat-related injuries than the general US population [2]. These workers are often immigrants, live in extreme poverty, are required to perform consecutive long days of work in the heat, and are paid by the amount of work they perform [31,32,34,35,36]. Although they are characterized as one of the most vulnerable populations to heat-related injury and fatality, data within our current investigation do not reflect this. In the current study, exertion-related injuries and fatalities were most reported in the construction and excavation industry. Like the agriculture industry (i.e., crop workers), construction workers are required to spend prolonged hours in the heat and perform heavy physical exertion [37,38,39]. Construction workers comprise 6% of the total workforce, and yet they account for 36% of all occupational heat-related deaths from 1992–2016 in the US [37]. Gubernot et al. (2014) reviewed 359 heat-related deaths in 2000–2010 and reported that construction workers were five times as likely to die from heat-related events as all workers [3]. Although it is tempting to characterize construction workers are the most vulnerable based on our study’s findings, it is important to note that these data are focused on reported injuries and fatalities. Many workers may avoid reporting injuries to their employers for fear of losing their job, and therefore it is difficult to highlight the top industries at risk due to this consideration. To adequately highlight specific industries at risk for exertion-related injuries and fatalities, new research or secondary analyses or aggregated databases are warranted to further understand characteristics that place specific industries or workers at risk.
The exertion-related fatality data in the current study reported that 80.8% of all fatalities were among nonunionized workers. Labor unions act as an intermediary between their members and the business that employs them [36]. The purpose of organized labor unions is to fight for better wages, benefit standards, access to health care, limits on working hours, and safe working conditions for their members [36,40,41]. Hagedorn et al. (2016) examined 16 binding contracts with employers in the Pacific Northwest and reported that the union contract language advances many of the social determinants of health, which has been shown to promote the health and well-being of workers [36]. Moreover, Tsao et al. (2016) created an ecological model using area-based measures of income in New York City and premature mortality to examine the reduction in premature mortality that could be achieved had the minimum wage been $15 from 2008 to 2012 [42]. The study revealed that a $15 minimum wage could have averted 2800 to 5500 premature deaths [42]. This is important to consider, as union membership focuses on providing far wages, above or at minimum wage, to workers. Despite the protective nature of a labor union, membership has declined dramatically to 11.3% [43]. Therefore, there may be more nonunionized workers, which accounts for greater reported fatalities.
Contrary to the current study and others, Altassan et al. (2018) reported that among 26,462 workers, union workers had a 51% higher risk of reportable injury [40]. The authors speculated that increased reportable injury in union workers may be due to workers in dangerous jobs more likely joining a union and differential reporting of injuries between union and nonunion companies. There may be a greater willingness for union members to report injuries and illnesses than nonunion members, as union members act under the protection of their union and experience no repercussions for reporting [40]. Union status data were not available for exertion injuries in the current study, but these studies suggest a need to examine the influence of unions on injury and health outcomes.
Lastly, our secondary objective examined whether accidents occurred more frequently during the summer months compared to non-summer months. This analysis was performed to identify whether seasonal trends may exist in reported injuries, as the summer months are often associated with high environmental heat, which has been shown to increase the risk of accidents, time off tasks, and productivity [44,45,46,47]. Although our data reflect a higher number of fatalities during the summer months, it is difficult to determine whether this increase is the result of heat stress or other factors, such as increased work demands (i.e., more workers in summer months). Our finding highlights the need to explore what factors are influencing the higher number of reported fatalities and why we only see this trend in accident-related fatality data.

4.1. Limitations

Although this study has many strengths, there are limitations that must be addressed. In the United States, there are few sources of occupational health data that can be easily accessed and analyzed. The major sources of occupational health data, which include the Bureau of Labor Statistics (BLS, used in the current dataset), annual survey of occupational injuries and illnesses, and workers’ compensation records have divergent reporting guidelines and requirements [22,48,49,50]. The reported OSHA injury data included in the current investigation were employer-reported and consisted of in-patient hospitalizations. Therefore, emergency room visits that did not result in admission were not captured, and are not considered reportable according to OSHA standards. This reporting methodology may be limited, as Schramm et al. (2021) examined data from emergency department visits during a Northwestern heat wave (Oregon, Washington, Alaska, Idaho) in May and June 2021, and found that 3504 (MED = 7 per day) heat-related emergency room visits occurred [50]. These data were identified by researchers from text on their reason for visit [50]. The initial consultation to evaluate the reason for a patient to seek emergency department services is performed by a medical provider, who likely have background in characterization of exertion-related injuries such as heat illnesses.
However, the OSHA Severe Injury database relies on employer classification of the incident in which the employer is expected to relay any medical diagnoses by categories provide through the OSHA reporting form and self-reported outcomes from the patient to the employer. The injuries are then submitted to the state and regional OSHA office, which are classified at this level by OSHA employees according to the OSHA classification system [19]. It is unknown if a medical provider is responsible for accurately characterizing each of the injuries. Lastly, the OSHA reporting criteria do not require employers to report injuries that are treated by first aid. OSHA includes “using cold therapy” and “drinking fluids for relief from heat stress” within the definition of first aid. Therefore, injuries such as heat exhaustion that occur on site and are treated using body cooling and/or hydration will not be accounted for. These factors are critically important to consider when attempting to quantify heat-related injuries and illnesses that occur due to work or the working environment.
The nature of the included databases and the criteria for OSHA reporting are responsible for these missed opportunities. Moreover, workers who are immigrants or nonunionized may not report injuries for fear of retaliation. Although there are aspects of the reporting system that can be improved, it should be noted that this federal database is comprised of reported data supported by a mandate. There are very few reporting systems that require reporting to elucidate trends in injuries and fatalities. Lastly, the study included categories (exertion-related, non-exertion-related, accident, non-accident) that were created and coded by the study team. To limit bias associated with the creation of these categories, all keywords and category decisions were determined a priori.

4.2. Practical Implications and Future Directions

As the current study identifies heat-related cases as the top exertion-related fatalities and injuries, it is imperative to consider that the rise in extreme heat events will exacerbate these incidents. The frequency of heat-related injuries and fatalities continues to rise, as climate change increases the duration and intensity of heat waves [51,52,53]. It is projected that between 2030 and 2052, the mean global temperature will increase by 1.5 °C [54]. By 2100, three-quarters of the world’s population could face deadly heatwaves [55,56]. In addition to OSHA-reported data, Park al. (2021) reported that in California alone, based on workers’ compensation injury data, there were approximately 20,000 heat-related injuries and illnesses per year that were not accounted for [51]. This number extrapolated to all US workers would be approximately 170,000 heat-related injuries and illnesses per year. These estimates and the current data highlight the significant of the problem of heat as a cause of injury and fatality and call for more interventions to reduce risk [32]. Nonunionized workers in construction and excavation who reside in the Southeast should be studied to determine what intrinsic and extrinsic risk factors increase fatality and injury in this population. These results also support the need for developing heat-related prevention measures in this population and to continue to identify other populations at risk.

5. Conclusions

Reported exertion-related injuries and fatalities in OSHA databases primarily consisted of heat-related cases (>85%). These cases were primarily located in Southeastern states, the construction and excavation industry, and in nonunionized workers. There were also seasonal trends in number of reported accident-related fatalities, where more fatalities were reported in the summer months than the non-summer months. More research is warranted to explore factors that influence the immense number of exertion-related injuries and fatalities characterized as “heat-related,” and specific interventions must be examined to identify mechanisms to reduce the increased frequency.

Supplementary Materials

The following supporting information can be downloaded at: https://www.mdpi.com/article/10.3390/ijerph20032683/s1, Table S1: Occupational Injury and Illness Classification System Codes; Table S2: Example Keywords Used to Classify Exertion-related Injuries.

Author Contributions

Conceptualization, M.C.M., D.J.C. and R.L.S.; formal analysis, Z.Y.K.; investigation, G.J.B.; methodology, M.C.M., G.J.B., F.T. and R.L.S.; project administration, M.C.M.; supervision, D.J.C. and R.L.S.; visualization, M.C.M.; writing—original draft, M.C.M. and R.L.S.; writing—review and editing, M.C.M., Z.Y.K., F.T., D.J.C. and R.L.S. All authors have read and agreed to the published version of the manuscript.

Funding

This research received no external funding.

Institutional Review Board Statement

Ethical review and approval were waived for this study due to the nature of the data (i.e., publicly accessible).

Informed Consent Statement

Participant consent was waived as the data were publicly accessible.

Data Availability Statement

The data that support the findings of this study are available in the Occupational Safety and Health Administration Fatality Inspection Database and the Occupational Safety and Health Administration Severe Injury Report Database at www.osha.gov/fatalities accessed 15 November 2021 and www.osha.gov/severeinjury accessed 15 November 2021, respectively [19,21].

Acknowledgments

The authors would like to thank the Korey Stringer Institute independent study students for their assistance organizing this dataset.

Conflicts of Interest

The authors declare no conflict of interest.

References

  1. International Labour Organization. ILO: Work Hazards Kill Millions, Cost Billions. 2003. Available online: http://www.ilo.org/global/about-the-ilo/mission-and-objectives/features/WCMS_075615/lang--en/index.htm (accessed on 20 September 2022).
  2. Gubernot, D.M.; Anderson, G.B.; Hunting, K.L. Characterizing occupational heat-related mortality in the United States, 2000–2010: An analysis using the Census of Fatal Occupational Injuries database. Am. J. Ind. Med. 2015, 58, 203–211. [Google Scholar] [CrossRef] [PubMed]
  3. Gubernot, D.M.; Anderson, G.B.; Hunting, K.L. The epidemiology of occupational heat exposure in the United States: A review of the literature and assessment of research needs in a changing climate. Int. J. Biometeorol. 2014, 58, 1779–1788. [Google Scholar] [CrossRef] [PubMed]
  4. Tustin, A.W.; Lamson, G.E.; Jacklitsch, B.L.; Thomas, R.; Arbury, S.; Cannon, D.; Gonzales, R.; Hodgson, M. Evaluation of Occupational Exposure Limits for Heat Stress in Outdoor Workers—United States, 2011–2016. MMWR Morb. Mortal. Wkly. Rep. 2018, 67, 733–737. [Google Scholar] [CrossRef] [PubMed]
  5. Spector, J.T.; Krenz, J.; Calkins, M.; Ryan, D.; Carmona, J.; Pan, M.; Zemke, A.; Sampson, P.D. Associations between heat exposure, vigilance, and balance performance in summer tree fruit harvesters. Appl. Ergon. 2018, 67, 1–8. [Google Scholar] [CrossRef]
  6. Spector, J.T.; Bonauto, D.K.; Sheppard, L.; Busch-Isaksen, T.; Calkins, M.; Adams, D.; Lieblich, M.; Fenske, R.A. A Case-Crossover Study of Heat Exposure and Injury Risk in Outdoor Agricultural Workers. PLoS ONE 2016, 11, e0164498. [Google Scholar] [CrossRef]
  7. Flouris, A.D.; Dinas, P.C.; Ioannou, L.G.; Nybo, L.; Havenith, G.; Kenny, G.P.; Kjellstrom, T. Workers’ health and productivity under occupational heat strain: A systematic review and meta-analysis. Lancet Planet Health 2018, 2, e521–e531. [Google Scholar] [CrossRef]
  8. Medical Surveillance of Injuries in the U.S. Military Descriptive Epidemiology and Recommendations for Improvement—PubMed. Available online: https://pubmed-ncbi-nlm-nih-gov.ezproxy.lib.uconn.edu/20117600/ (accessed on 17 August 2022).
  9. Descriptive Epidemiology of Collegiate Men’s Baseball Injuries: National Collegiate Athletic Association Injury Surveillance System, 1988–1989 Through 2003–2004—PMC. Available online: https://www-ncbi-nlm-nih-gov.ezproxy.lib.uconn.edu/pmc/articles/PMC1941283/ (accessed on 17 August 2022).
  10. Descriptive Epidemiology of 153 Diving Injuries With Rebreathers Among French Military Divers From 1979 to 2009|Military Medicine|Oxford Academic. Available online: https://academic-oup-com.ezproxy.lib.uconn.edu/milmed/article/176/4/446/4345389 (accessed on 17 August 2022).
  11. Speakman, R.O. Descriptive Epidemiology of Air Transportation Fatalities from the United States Air Force Mortality Registry. Available online: https://corescholar.libraries.wright.edu/mph/203/ (accessed on 17 August 2022).
  12. Boden, B.P.; Breit, I.; Beachler, J.A.; Williams, A.; Mueller, F.O. Fatalities in High School and College Football Players. Am. J. Sports Med. 2013, 41, 1108–1116. [Google Scholar] [CrossRef]
  13. Boden, B.P.; Fine, K.M.; Breit, I.; Lentz, W.; Anderson, S.A. Nontraumatic Exertional Fatalities in Football Players, Part 1: Epidemiology and Effectiveness of National Collegiate Athletic Association Bylaws. 2020. Available online: https://journals-sagepub-com.ezproxy.lib.uconn.edu/doi/full/10.1177/2325967120942490 (accessed on 17 August 2022).
  14. Probability of Competing Beyond High School—NCAA.org. Available online: https://www.ncaa.org/sports/2013/12/17/probability-of-competing-beyond-high-school.aspx (accessed on 17 August 2022).
  15. Military Active-Duty Personnel, Civilians by State. Governing. 2013. Available online: https://www.governing.com/archive/military-civilian-active-duty-employee-workforce-numbers-by-state.html (accessed on 17 August 2022).
  16. Census of Fatal Occupational Injuries Summary, 2020—2020 A01 Results. Available online: https://www.bls.gov/news.release/cfoi.nr0.htm (accessed on 16 August 2022).
  17. Occupational Safety and Health Administration. OSH Act of 1970. Available online: https://www.osha.gov/laws-regs/oshact/completeoshact (accessed on 19 March 2021).
  18. Survey of Occupational Injuries and Illnesses Data. Available online: https://www.bls.gov/iif/soii-data.htm (accessed on 19 November 2020).
  19. Occupational Safety and Health Administration. Severe Injury Reports. Available online: https://www.osha.gov/severeinjury/ (accessed on 17 August 2022).
  20. OIICS Table of Contents. Available online: https://www.bls.gov/iif/oshoiics.htm (accessed on 17 August 2022).
  21. Occupational Safety and Health Administration. Fatality Inspection Data. Available online: https://www.osha.gov/fatalities (accessed on 17 August 2022).
  22. U.S. Department of Labor. Data and Statistics. Available online: https://www.dol.gov/agencies/wb/data (accessed on 10 November 2020).
  23. Occupational Safety and Health Administration. Heat Injury and Illness Prevention in Outdoor and Indoor Work Settings Rulemaking. Available online: https://www.osha.gov/heat-exposure/rulemaking (accessed on 15 October 2022).
  24. Diem, J.E.; Stauber, C.E.; Rothenberg, R. Heat in the southeastern United States: Characteristics, trends, and potential health impact. PLoS ONE 2017, 12, e0177937. [Google Scholar] [CrossRef]
  25. Basu, R.; Samet, J.M. Relation between elevated ambient temperature and mortality: A review of the epidemiologic evidence. Epidemiol. Rev. 2002, 24, 190–202. [Google Scholar] [CrossRef]
  26. Culp, K.; Tonelli, S. Heat-Related Illness in Midwestern Hispanic Farmworkers: A Descriptive Analysis of Hydration Status and Reported Symptoms. Workplace Health Saf. 2019, 67, 168–178. [Google Scholar] [CrossRef]
  27. Bethel, J.W.; Harger, R. Heat-Related Illness among Oregon Farmworkers. Int. J. Environ. Res. Public Health 2014, 11, 9273–9285. [Google Scholar] [CrossRef]
  28. Hansen, A.; Saniotis, A.; Nitschke, M. Vulnerability to Extreme Heat and Climate Change: Is Ethnicity a Factor? Glob. Health Action 2013, 6, 21364. [Google Scholar] [CrossRef]
  29. Santha, S.D.; Jaswal, S.; Sasidevan, D.; Datta, K.; Khan, A.; Kuruvilla, A. Climate Change, Livelihoods and Health Inequities: The Vulnerability of Migrant Workers in Indian Cities. Available online: https://pubs.iied.org/10728iied (accessed on 21 December 2021).
  30. Jung, J.; Uejio, C.K.; Kintziger, K.W.; Duclos, C.; Reid, K.; Jordan, M.; Spector, J.T. Heat illness data strengthens vulnerability maps. BMC Public Health 2021, 21, 1999. [Google Scholar] [CrossRef]
  31. Equitable Growth. Temperature, Workplace Safety, and Labor Market Inequality. Available online: https://equitablegrowth.org/working-papers/temperature-workplace-safety-and-labor-market-inequality/ (accessed on 29 October 2021).
  32. Boiling Point—Public Citizen. Available online: https://www.citizen.org/article/boiling-point/ (accessed on 18 October 2022).
  33. Berube, A.; Tiffany, T. The “State” of Low-Wage Workers: How the EITC Benefits Urban and Rural Communities in the 50 States; EITC Series; The Brookings Institution: Washington, DC, USA, 2004. [Google Scholar]
  34. Tigchelaar, M.; Battisti, D.S.; Spector, J.T. Work adaptations insufficient to address growing heat risk for U.S. agricultural workers. Environ. Res. Lett. 2020, 15, 094035. [Google Scholar] [CrossRef]
  35. Jackson, L.L.; Rosenberg, H.R. Preventing heat-related illness among agricultural workers. J. Agromed. 2010, 15, 200–215. [Google Scholar] [CrossRef]
  36. Hagedorn, J.; Paras, C.A.; Greenwich, H.; Hagopian, A. The Role of Labor Unions in Creating Working Conditions That Promote Public Health. Am. J. Public Health 2016, 106, 989–995. [Google Scholar] [CrossRef]
  37. Dong, X.S.; West, G.H.; Holloway-Beth, A.; Wang, X.; Sokas, R.K. Heat-related deaths among construction workers in the United States. Am. J. Ind. Med. 2019, 62, 1047–1057. [Google Scholar] [CrossRef]
  38. Dutta, P.; Rajiva, A.; Andhare, D.; Azhar, G.S.; Tiwari, A.; Sheffield, P.; Ahmedabad Heat and Climate Study Group. Perceived heat stress and health effects on construction workers. Indian J. Occup. Environ. Med. 2015, 19, 151–158. [Google Scholar] [CrossRef]
  39. El-Shafei, D.A.; Bolbol, S.A.; Awad Allah, M.B.; Abdelsalam, A.E. Exertional heat illness: Knowledge and behavior among construction workers. Environ. Sci. Pollut. Res. 2018, 25, 32269–32276. [Google Scholar] [CrossRef]
  40. Altassan, K.A.; Sakr, C.J.; Galusha, D.; Slade, M.D.; Tessier-Sherman, B.; Cantley, L.F. Risk of Injury by Unionization: Survival Analysis of a Large Industrial Cohort. J. Occup. Environ. Med. 2018, 60, 827–831. [Google Scholar] [CrossRef]
  41. Unionized Workers Are More Likely to Assert Their Right to a Safe and Healthy Workplace. Available online: https://theconversation.com/unionized-workers-are-more-likely-to-assert-their-right-to-a-safe-and-healthy-workplace-144718 (accessed on 21 December 2021).
  42. Tsao, T.-Y.; Konty, K.J.; Van Wye, G.; Barbot, O.; Hadler, J.L.; Linos, N.; Bassett, M.T. Estimating Potential Reductions in Premature Mortality in New York City From Raising the Minimum Wage to $15. Am. J. Public Health 2016, 106, 1036–1041. [Google Scholar] [CrossRef] [PubMed]
  43. Wright, M.J. The Decline of American Unions Is a Threat to Public Health. Am. J. Public Health 2016, 106, 968–969. [Google Scholar] [CrossRef]
  44. Morrissey, M.C.; Brewer, G.J.; Williams, W.J.; Quinn, T.; Casa, D.J. Impact of occupational heat stress on worker productivity and economic cost. Am. J. Ind. Med. 2021, 64, 981–988. [Google Scholar] [CrossRef] [PubMed]
  45. Axelson, O. Influence of heat exposure on productivity. Work Environ. Health 1974, 11, 94–99. [Google Scholar] [PubMed]
  46. Mitchell, R.J.; Bates, P. Measuring Health-Related Productivity Loss. Popul. Health Manag. 2011, 14, 93–98. [Google Scholar] [CrossRef]
  47. Ioannou, L.G.; Mantzios, K.; Tsoutsoubi, L.; Panagiotaki, Z.; Kapnia, A.; Ciuha, U.; Nybo, L.; Flouris, A.; Mekjavic, I. Effect of a Simulated Heat Wave on Physiological Strain and Labour Productivity. Int. J. Environ. Res. Public Health 2021, 18, 3011. [Google Scholar] [CrossRef]
  48. Injuries, Illnesses, and Fatalities. Available online: https://www.bls.gov/iif/home.htm (accessed on 16 October 2022).
  49. NIOSH; CDC. Data and Statistics—Traumatic Occupational Injuries. Available online: https://www.cdc.gov/niosh/injury/data.html (accessed on 16 October 2022).
  50. Schramm, P.J.; Vaidyanathan, A.; Radhakrishnan, L.; Gates, A.; Hartnett, K.; Breysse, P. Heat-Related Emergency Department Visits During the Northwestern Heat Wave—United States, June 2021. MMWR Morb. Mortal. Wkly. Rep. 2021, 70, 1020–1021. [Google Scholar] [CrossRef]
  51. Heal, G.; Park, J. Reflections—Temperature Stress and the Direct Impact of Climate Change: A Review of an Emerging Literature. Rev. Environ. Econ. Policy 2016, 10, 347–362. [Google Scholar] [CrossRef]
  52. Chen, X.; Li, N.; Liu, J.; Zhang, Z.; Liu, Y.; Huang, C. Changes in Global and Regional Characteristics of Heat Stress Waves in the 21st Century. Earths Future 2020, 8, e2020EF001636. [Google Scholar] [CrossRef]
  53. Perkins, S.E. A review on the scientific understanding of heatwaves—Their measurement, driving mechanisms, and changes at the global scale. Atmos. Res. 2015, 164–165, 242–267. [Google Scholar] [CrossRef]
  54. Djalante, R. Key assessments from the IPCC special report on global warming of 1.5 °C and the implications for the Sendai framework for disaster risk reduction. Prog. Disaster Sci. 2019, 1, 100001. [Google Scholar] [CrossRef]
  55. Mora, C.; Spirandelli, D.; Franklin, E.C.; Lynham, J.; Kantar, M.B.; Miles, W.; Smith, C.Z.; Freel, K.; Moy, J.; Louis, L.V.; et al. Broad threat to humanity from cumulative climate hazards intensified by greenhouse gas emissions. Nat. Clim. Chang. 2018, 8, 1062–1071. [Google Scholar] [CrossRef]
  56. Levin, K. Half a Degree and a World Apart: The Difference in Climate Impacts Between 1.5 °C and 2 °C of Warming. 2018. Available online: http://www.wri.org/insights/half-degree-and-world-apart-difference-climate-impacts-between-15c-and-2c-warming (accessed on 15 October 2022).
Figure 1. Top causes of exertion-related fatalities across multiple industries. (A) Types of causes of exertion-related fatalities; (B) industries most affected by ex-ertion-related fatalities.
Ijerph 20 02683 g001
Figure 2. Average number of accident-related severe injury per month (2015–2020). (A) Average number of accident-related fatalities per month (2017–2020). (B). Note: number above each bar = average number of injuries/fatalities each month.
Ijerph 20 02683 g002
Table 1. Nature of OSHA reported exertion-related and non-exertion-related injuries in OSHA Severe Injury Report (2015–2020).
InjuriesNPercent of OverallPercent of Exertion Injuries
Overall58,648100%-
Non-Exertion56,96697.1%-
Accidents *41,36870.5%-
Non-Accidents **15,69626.8%-
Exertion ***16822.9%100%
Heat-related Injury15462.6%91.9%
Cardiac1010.2%6.0%
Anaphylactic Shock180.03%1.07%
Cold-related Injury150.03%0.9%
Pulmonary Embolism10.002%0.06%
Anemia10.002%0.1%
Note: N = number incidents; * accident data were defined as injuries that were not classified as exertion related or non-accidents; ** non-accidents were defined as injuries that included intent to harm (i.e., violence); *** exertion injury categories created by Severe Injury Report database and classified as “exertion injuries” by research team.
Table 2. Exertion-related injury rates and summary statistics in OSHA Severe Injury Report database (2015–2020).
AnemiaCold-Related InjuryCardiacPulmonary EmbolismAnaphylactic ShockHeat-Related InjuryTotal *
Total11510111815461682
Average Yearly Injury Rate **
[95% CI]
0.0001
[0.001, 0.005]
0.002
[0.001, 0.003]
0.012
[0.001, 0.003]
0.0001
[0.001, 0.005]
0.002
[0.001, 0.003]
0.19
[0.18, 0.2]
0.20
[0.19, 0.22]
US Region
Southeast041504615638
Southwest121502474494
Midwest042515241276
Northeast053605168214
West0010024860
Occupation
Construction and Extraction031000321334
Personal Care and Service12801275287
Production01701256265
Other032200250275
Installation, Maintenance, Repair001100155166
Transportation and Material Moving016109098
Buildings and Grounds009037688
Food Preparation and Serving034013745
Farming, Fishing, Forestry000004141
Healthcare01150111138
Protective Service006012027
Tourism012001013
Military0010045
Note: * Exertion injury categories created by the Severe Injury Report database and classified as “exertion injuries” by research team. ** Reported per 100,000 full-time equivalent workers [(number of injuries/134,950,000) full-time equivalent workers)/6 years].
Table 3. Nature of OSHA-reported exertion-related and non-exertion-related fatalities in OSHA Fatality Inspection Database (2017–2020).
FatalitiesNPercentagePercentage of Exertion Fatalities
Overall4598100%-
Non-Exertion450998.1%-
Accidents *278160.5%-
Non-Accidents **172837.5%-
Exertion ***891.9%100%
Heat781.7%87.6%
Cardiac80.2%8.9%
Cold20.04%2.4%
Asthma10.02%1.1%
Note: N = number of incidents; 95% CI, 95% confidence interval. * Accident data were defined as injuries that were not classified as exertion related or non-accidents; ** non-accidents were defined as injuries that included intent to harm (i.e., violence); *** exertion fatality categories created by fatality inspection database and classified as “exertion fatalities” by research team.
Table 4. Exertion-related fatality rates and summary statistics in OSHA Fatality Inspection Database (2017–2020).
HeatCardiacColdAsthmaTotal *
Total7882189
Yearly Average Fatality Rate [95% CI] **0.0144
[0.0077, 0.011]
0.0014
[0.0004, 0.0019]
0.0003
[0.00005, 0.0009]
0.0001
[0.001, 0.005]
0.0160
[0.008, 0.0134]
US Region
Southeast2620028
Southwest2310024
Midwest1301115
West1131015
Northeast52007
Occupation
Construction and Excavation2400024
Farming, Fishing, Forestry1520017
Personal Services910010
Production810110
Building and Grounds80008
Installation, Maintenance, Repair61007
Transportation and Material Moving41005
Other21003
Protective Services10102
Tourism10102
Health Care01001
Union Status
Non-Unionized6362172
Unionized1520017
* Exertion fatality categories created by fatality inspection database and classified as “exertion fatalities” by research team; 95% CI, 95% confidence interval; ** reported per 100,000 full-time equivalent workers [(number of fatalities 134,950,000) full-time equivalent workers)/4 years].
Table 5. Number of accident-related injuries and fatalities reported per month per year.
JanuaryFebruaryMarchAprilMayJuneJulyAugustSeptemberOctoberNovemberDecember
Reported Accident-Related Injuries
2015610509583565523579588589591578526529
2016558571529533515628585701607613572564
2017594592637578609655662663590680573600
2018651629644636720737705732599712668598
2019721652681632634594701645663692601590
2020639574550445499579522544----
Mean629588604565583629627646610655588576
Reported Accident-Related Fatalities
2017624952566963447062785754
2018374572567060667460664451
20194644637859767713865596749
20204955512622415414653476451
Mean4948605455606010760635851
Disclaimer/Publisher’s Note: The statements, opinions and data contained in all publications are solely those of the individual author(s) and contributor(s) and not of MDPI and/or the editor(s). MDPI and/or the editor(s) disclaim responsibility for any injury to people or property resulting from any ideas, methods, instructions or products referred to in the content.

