
Analysis and Prediction of COVID-19 Multivariate Data Using Deep Ensemble Learning Methods


Abstract
:1. Introduction
1.1. Increased Prevalence of Dementia in COVID-19-Infected Individuals
1.2. Threat by Different Variants
1.3. Technological Advancements
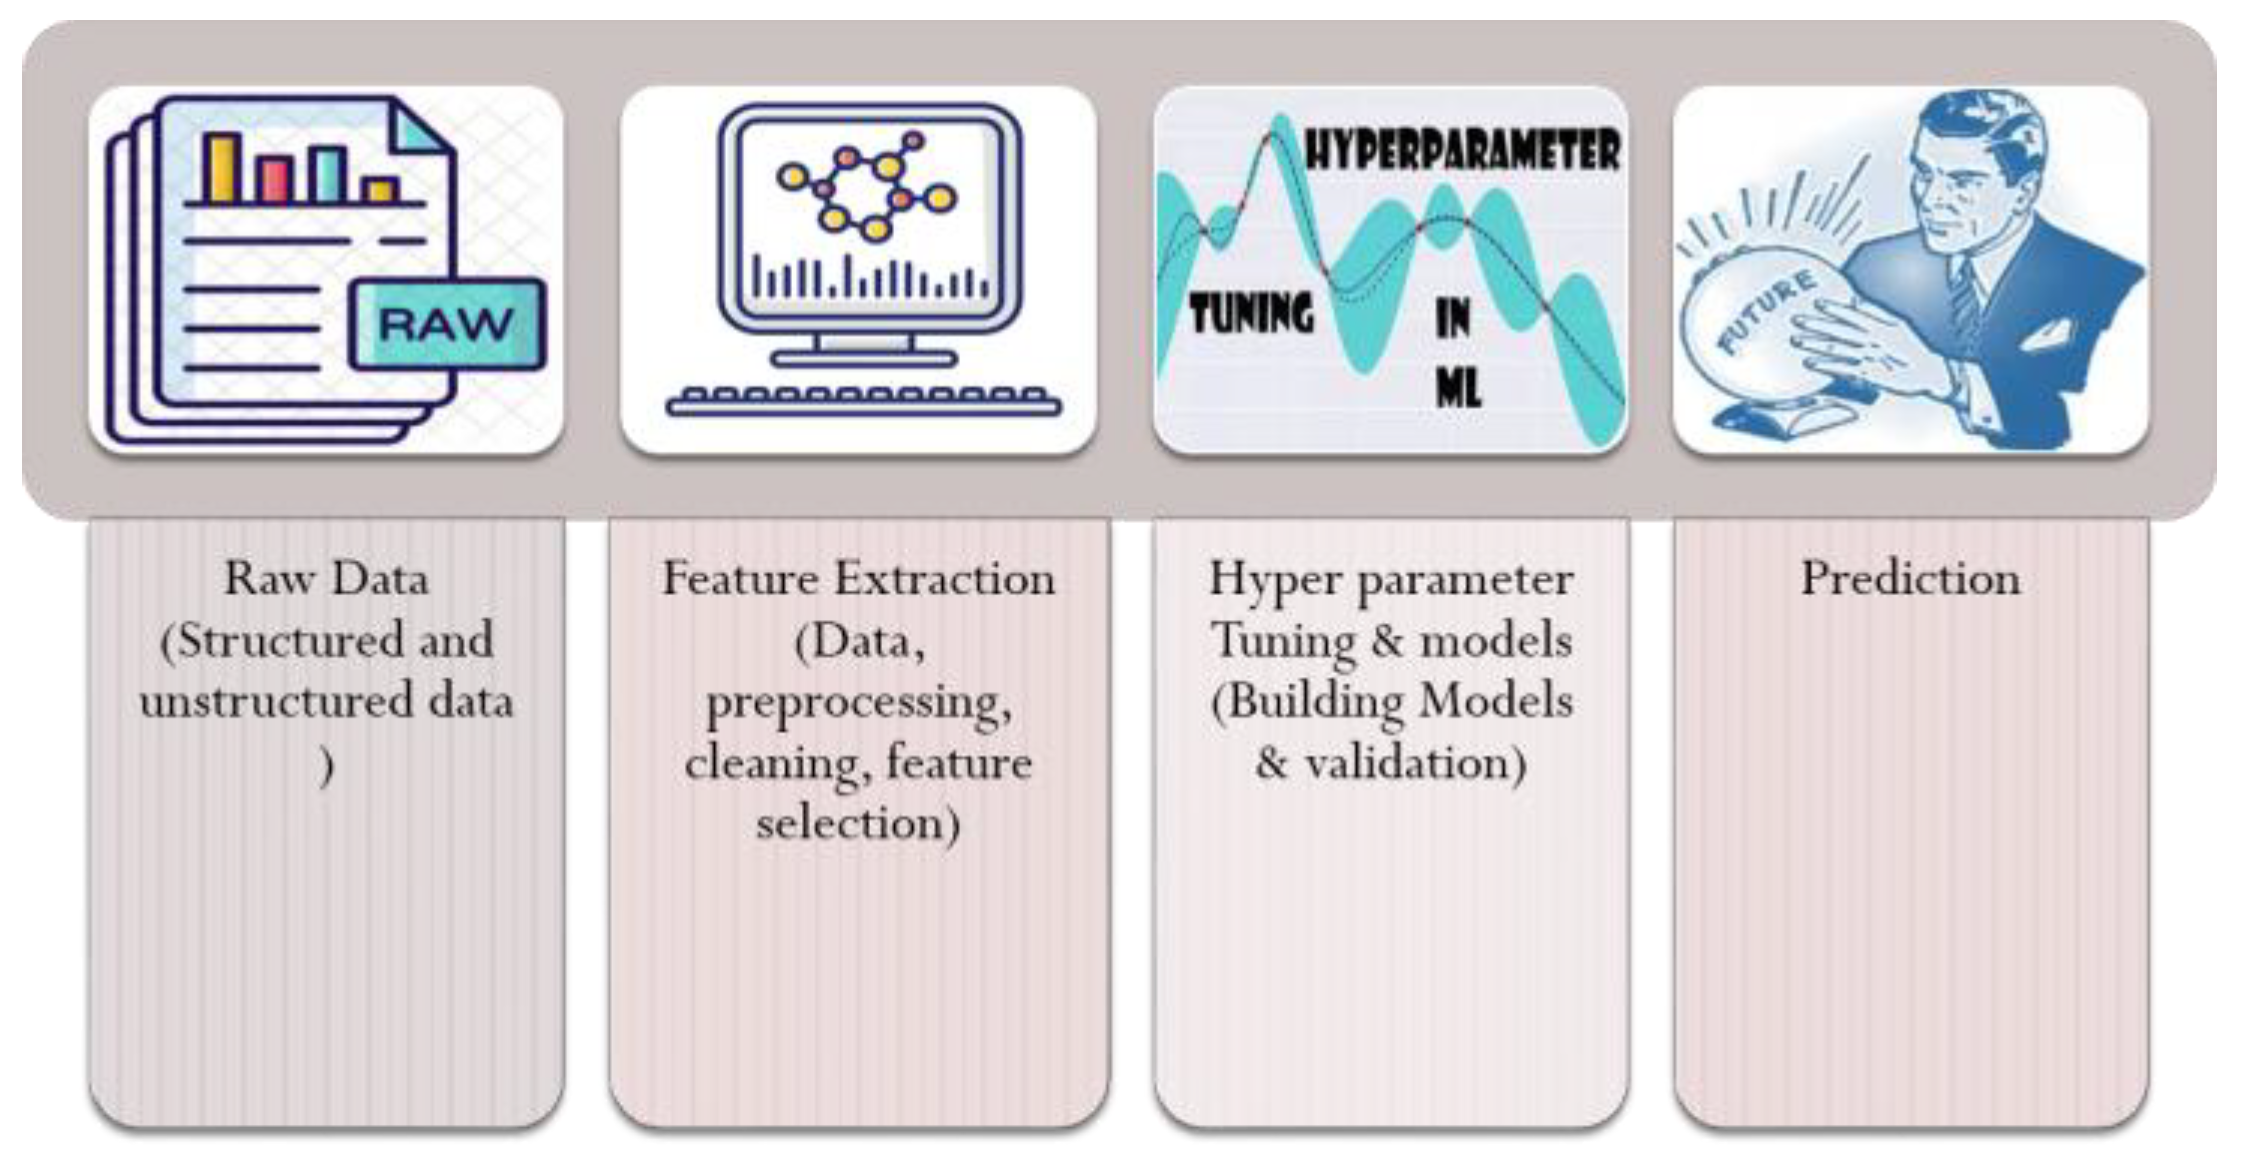
- Research and analysis of COVID-19 multivariate data;
- To come up with a general method for predicting the COVID-19 outbreak that is based on data and machine learning;
- To compare and evaluate how well different prediction methods, such as LASSO, Ada-Boost, Light Gradient Boosting, KNN, RNN, LSTM, and Adaptive Gradient LSTM, can predict the number of deaths, the number of positive cases, and the number of recovered cases;
- To benefit from a potent activation function that helps obtain the best performance;
- To profit from the established advantages of deep learning techniques in processes that assist in epidemic disease outbreaks and health decision-making.
2. Literature Review
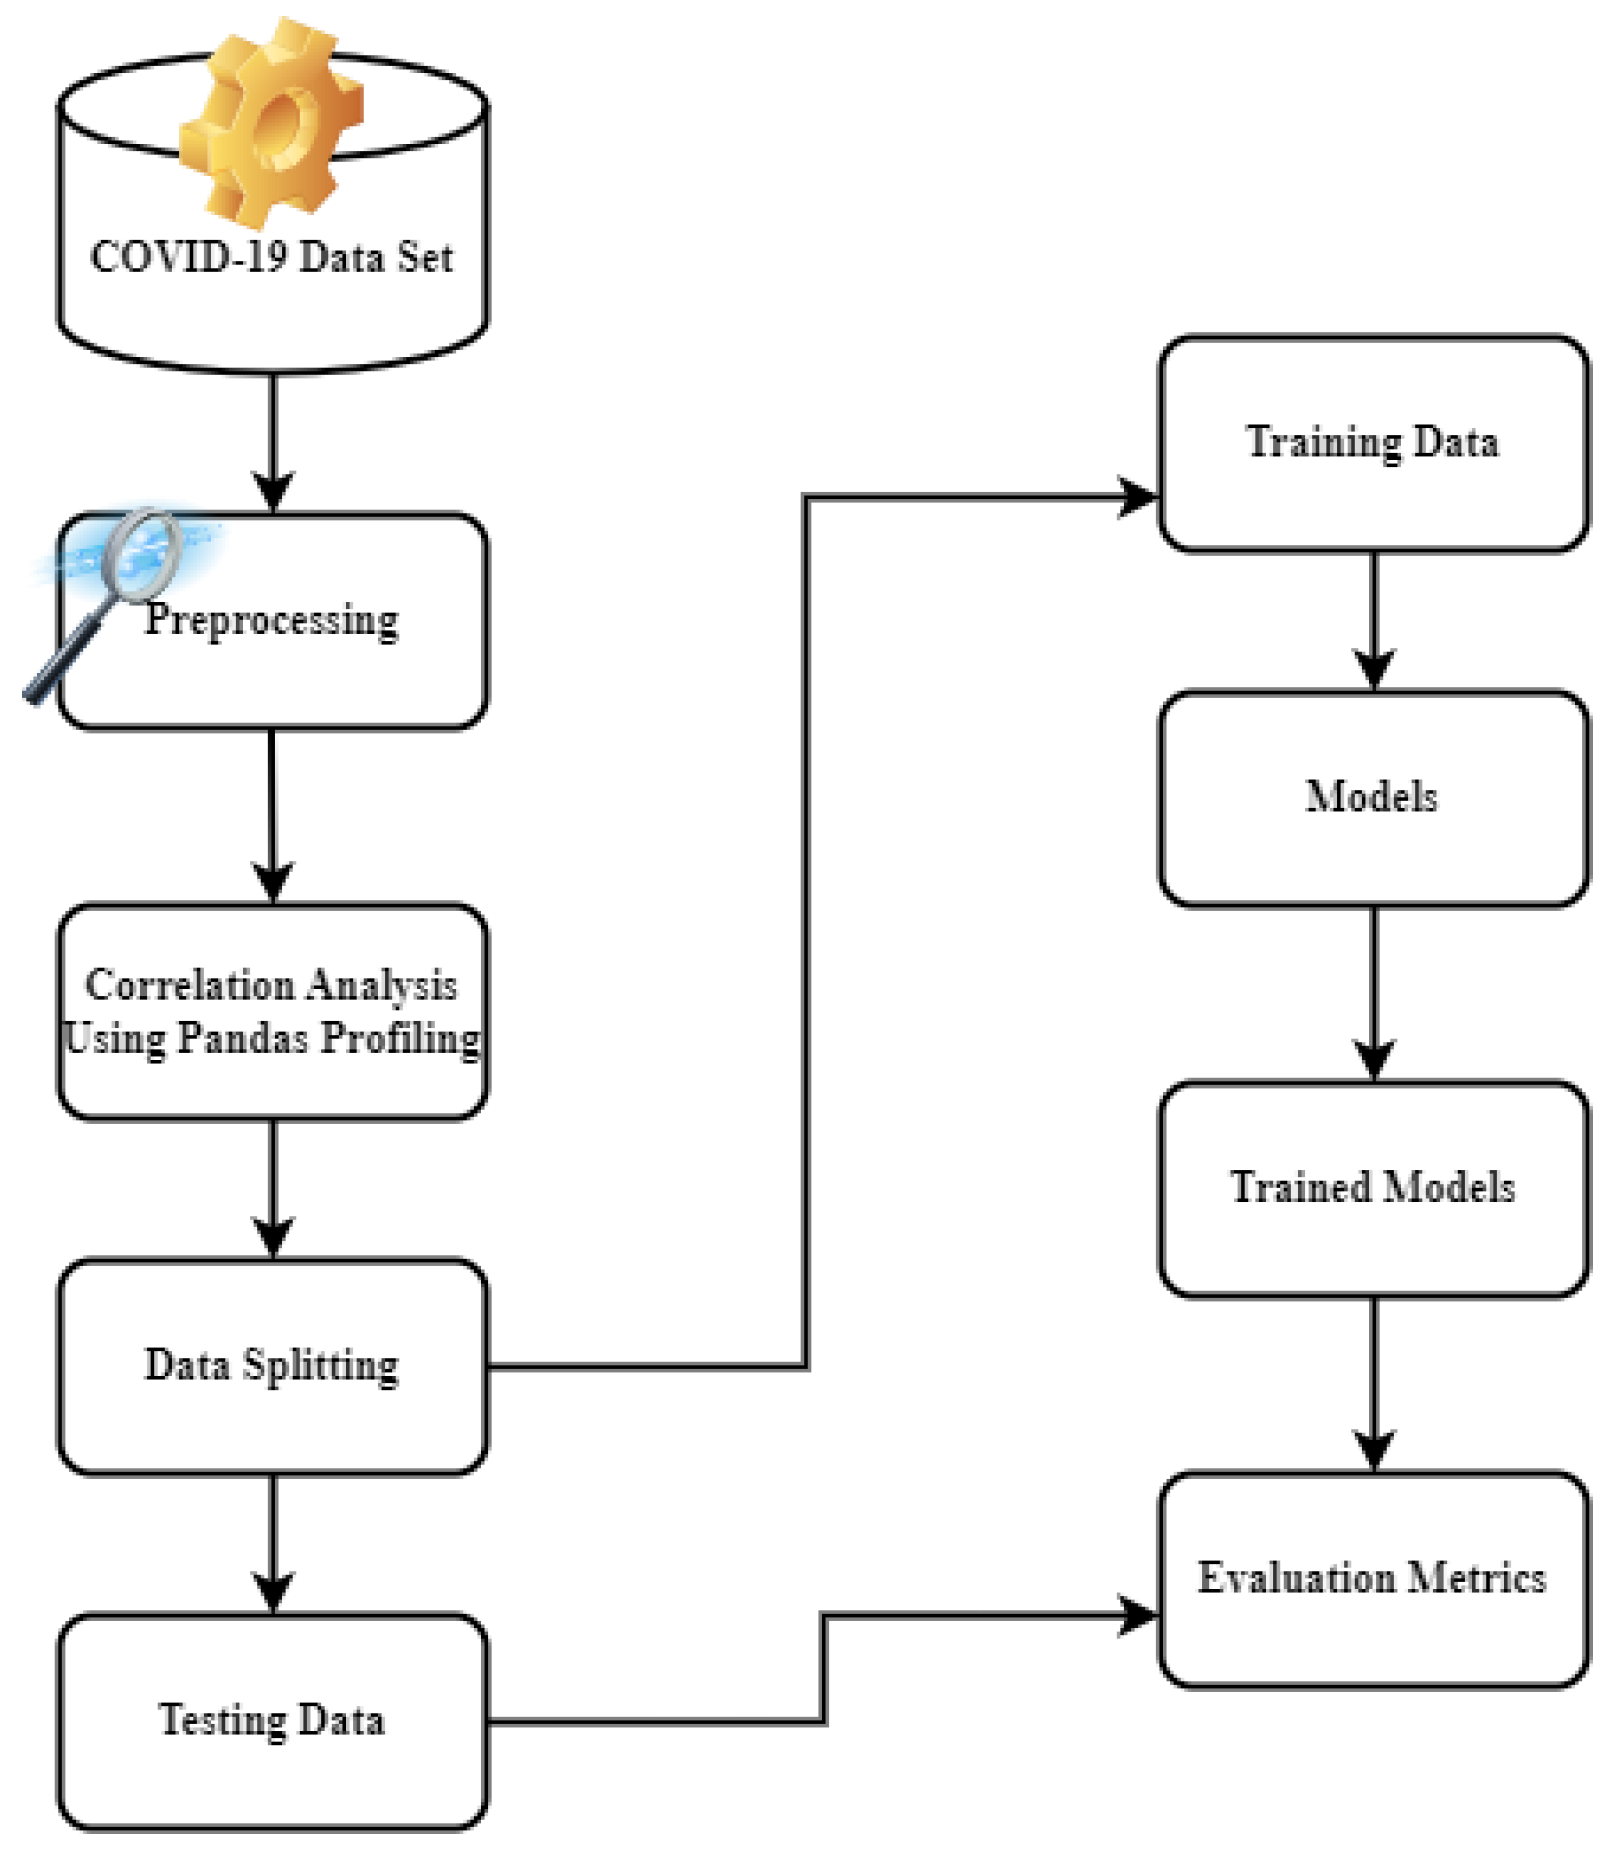
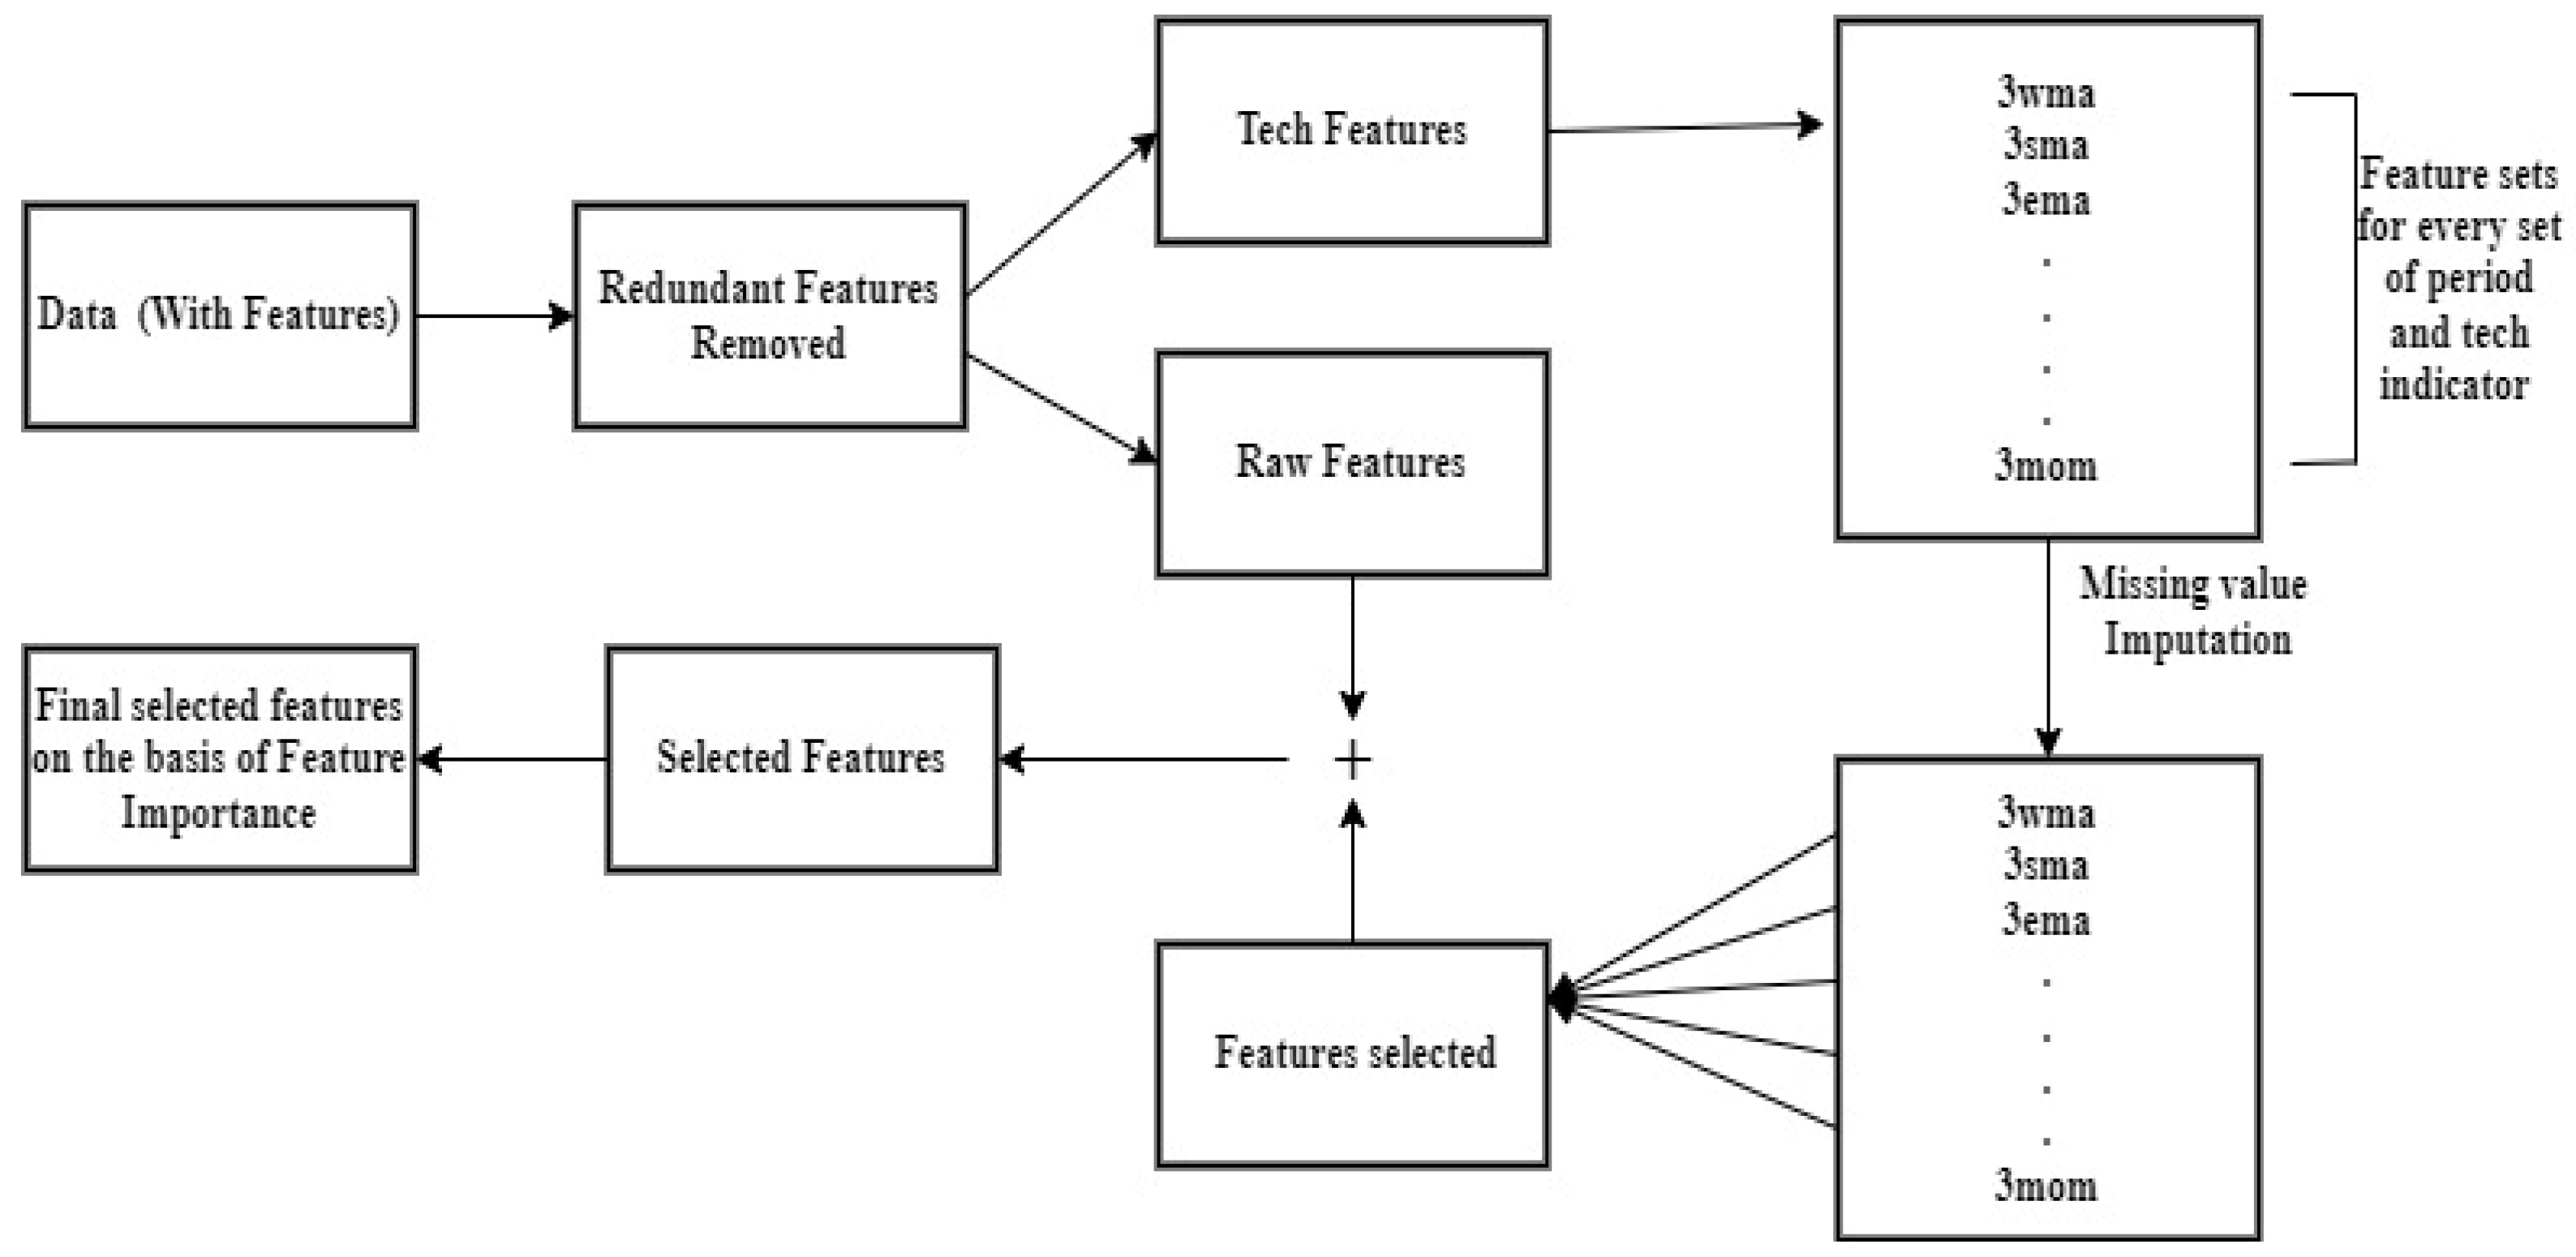
3. Materials and Methods
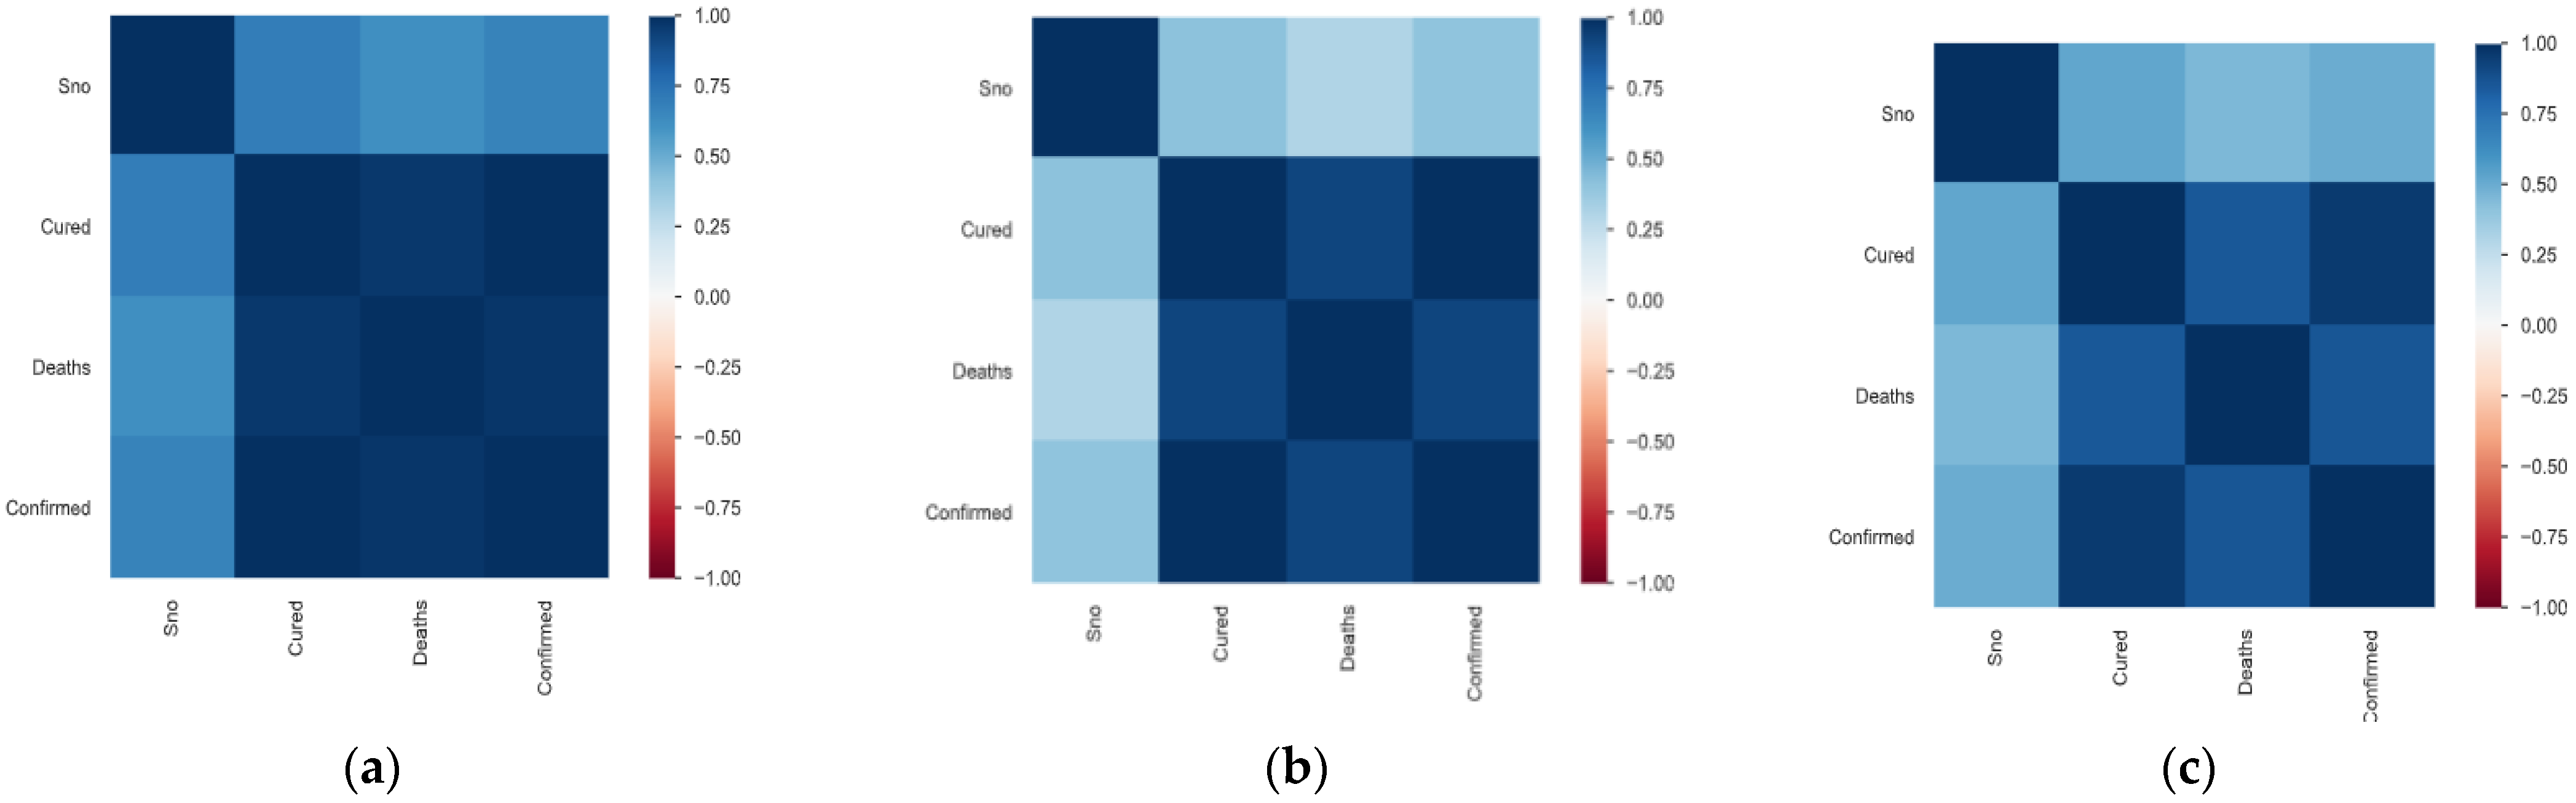
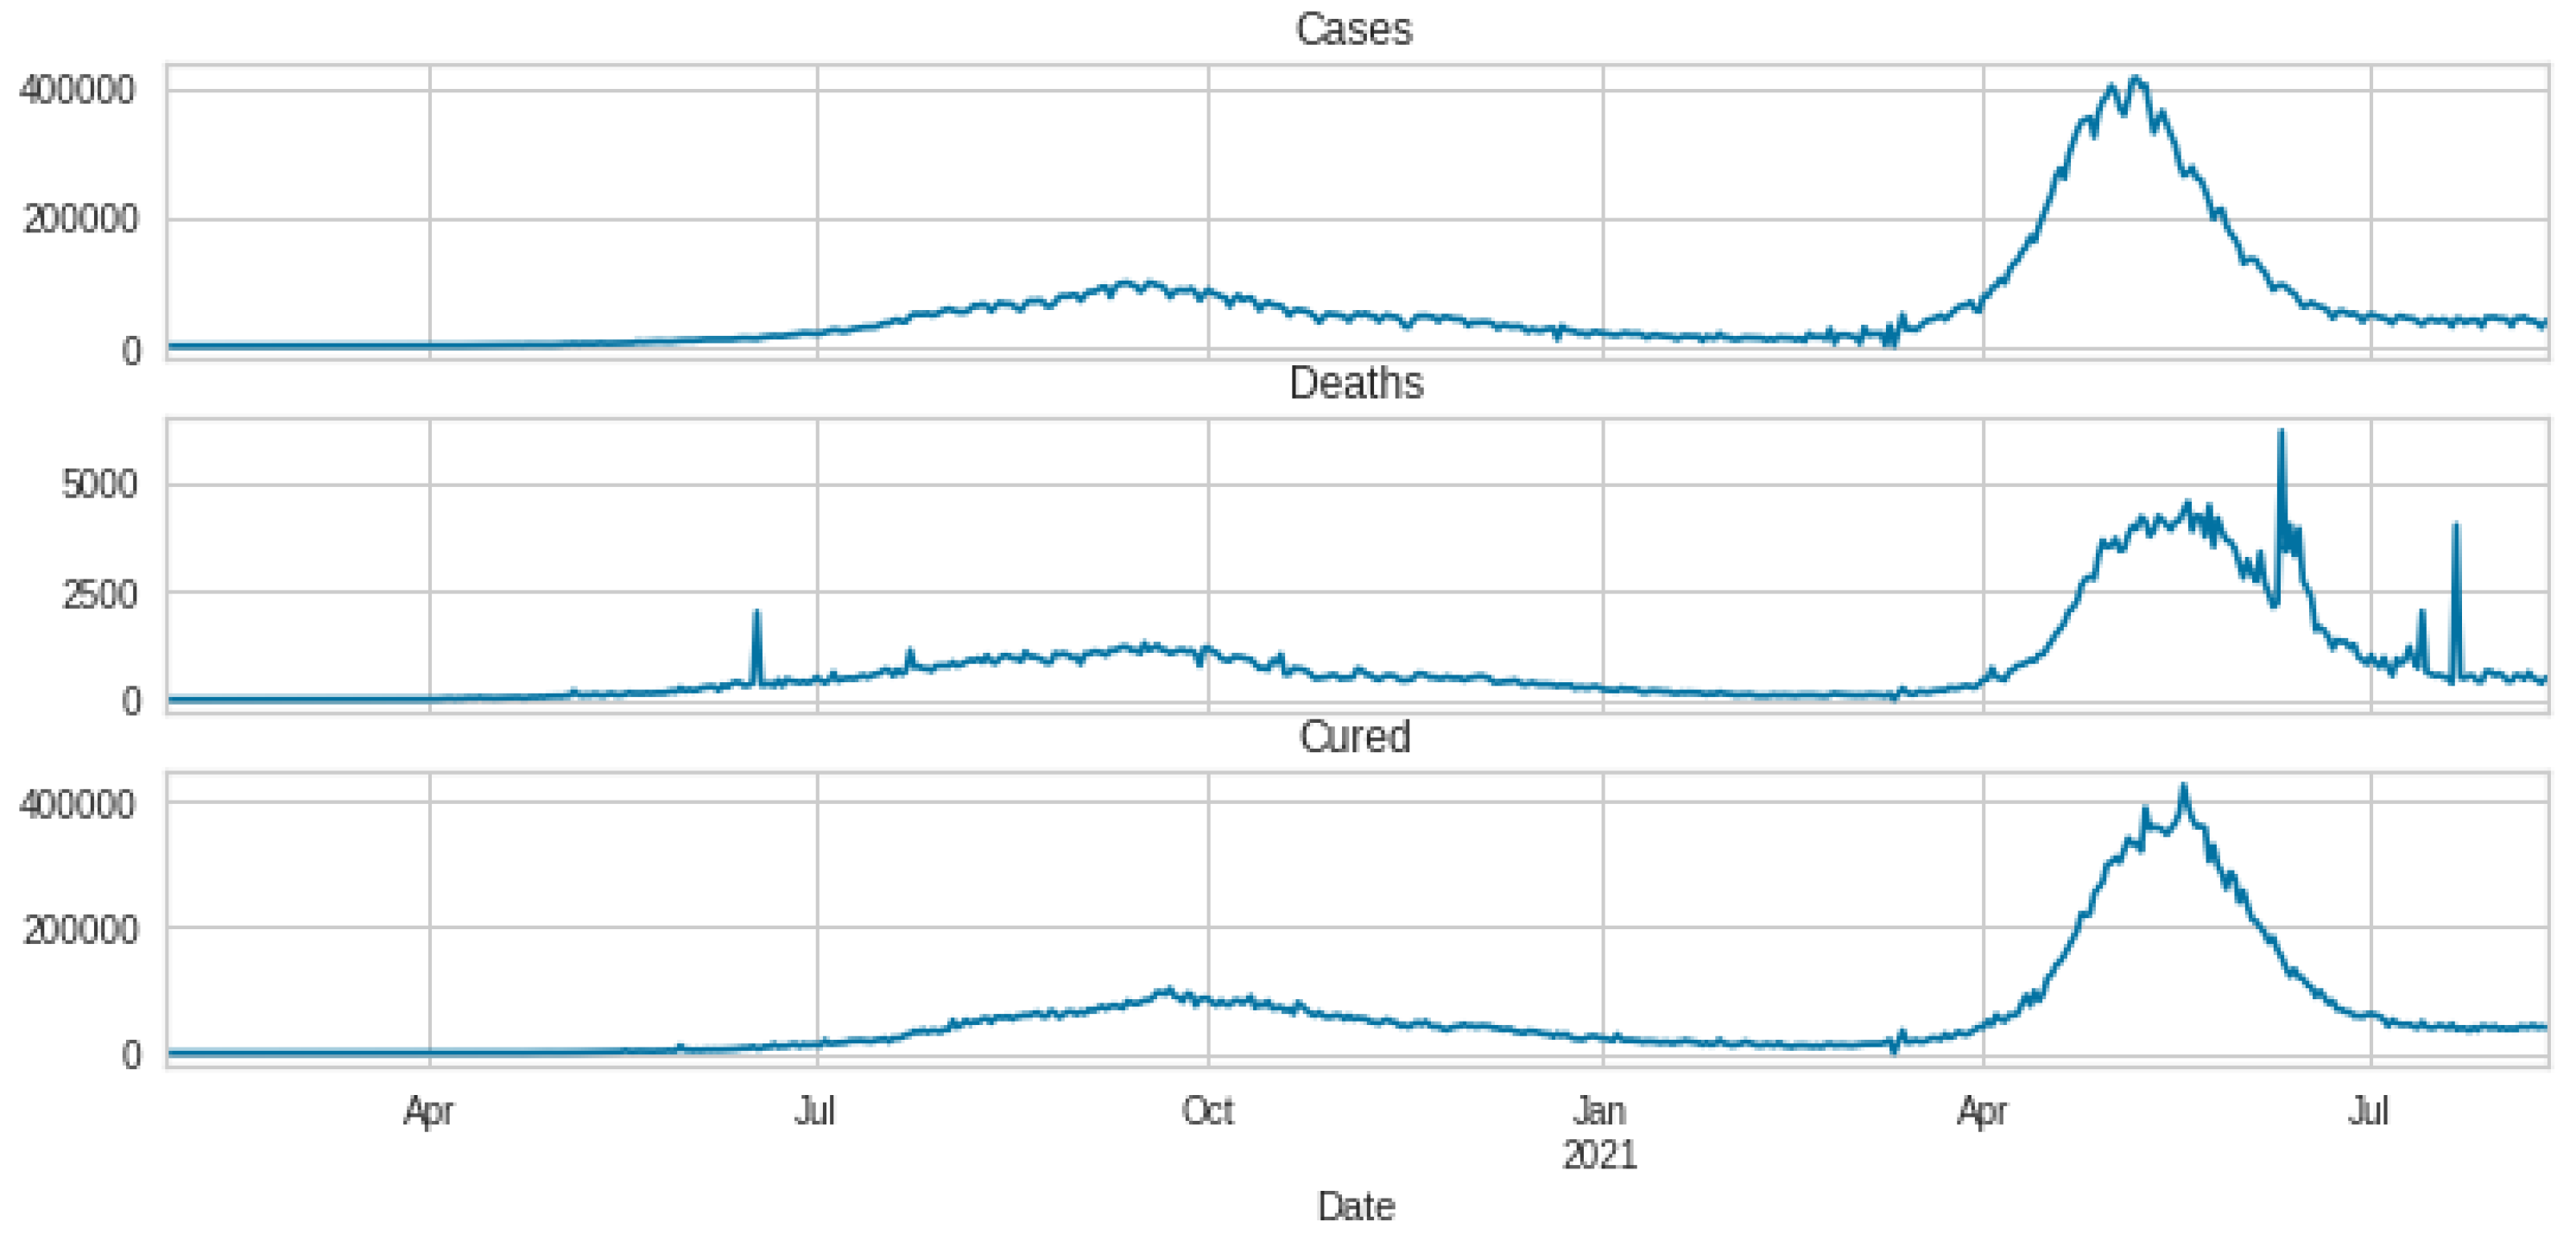
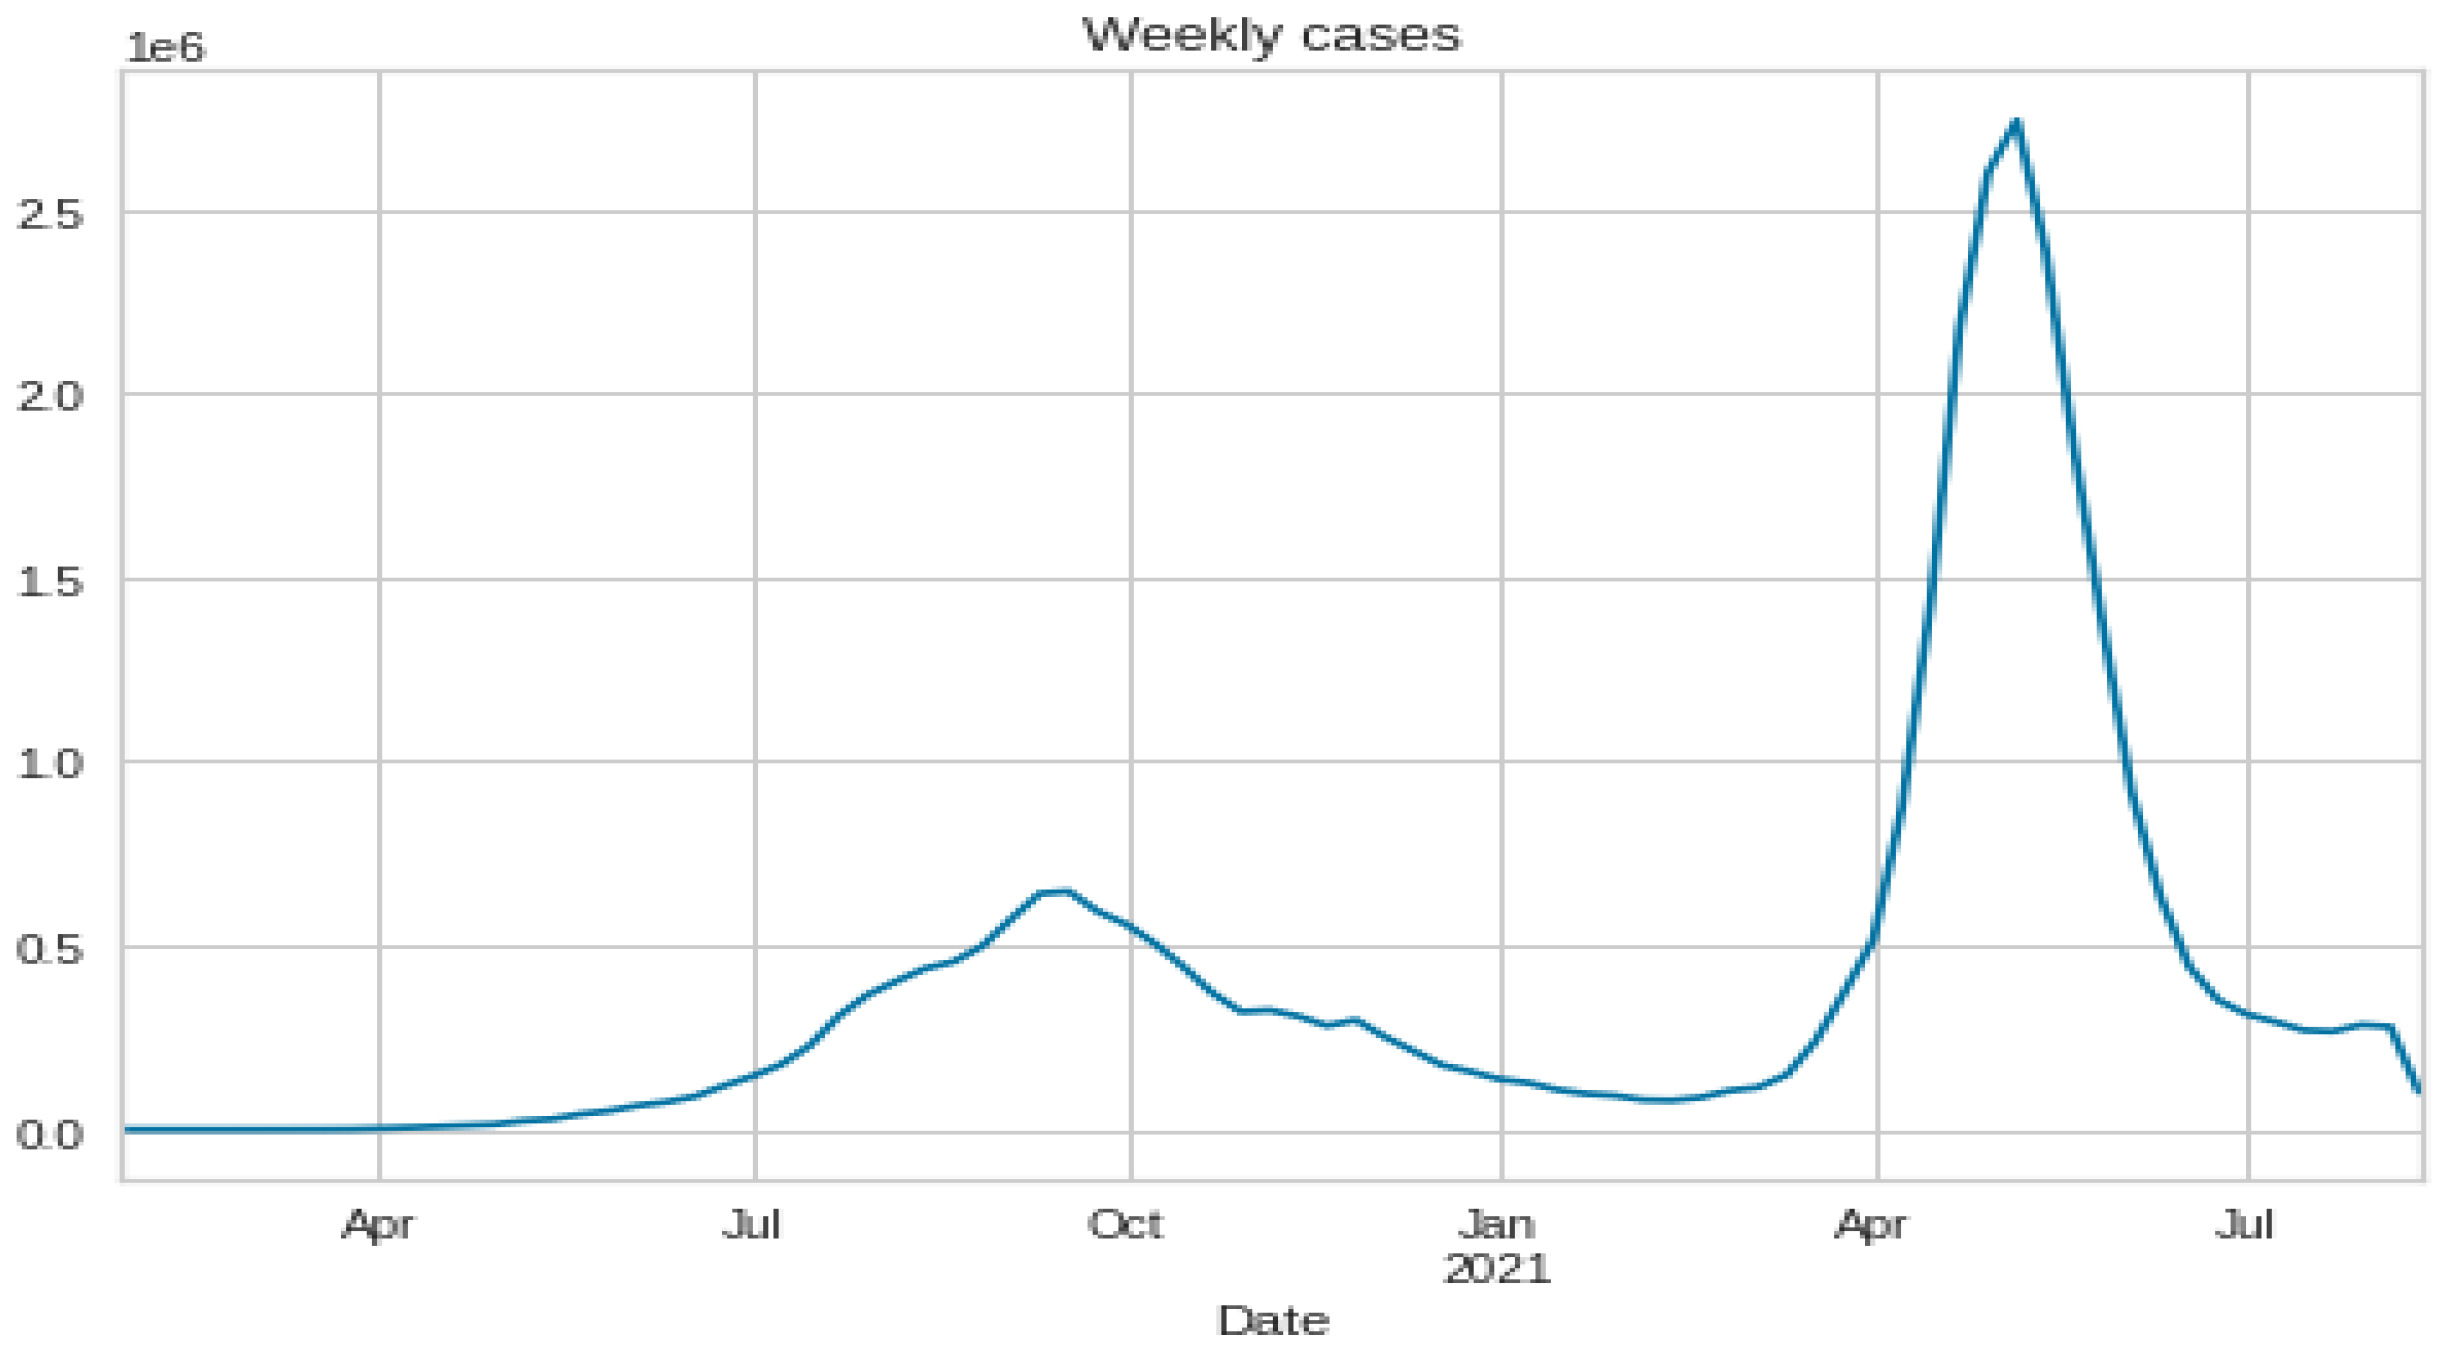
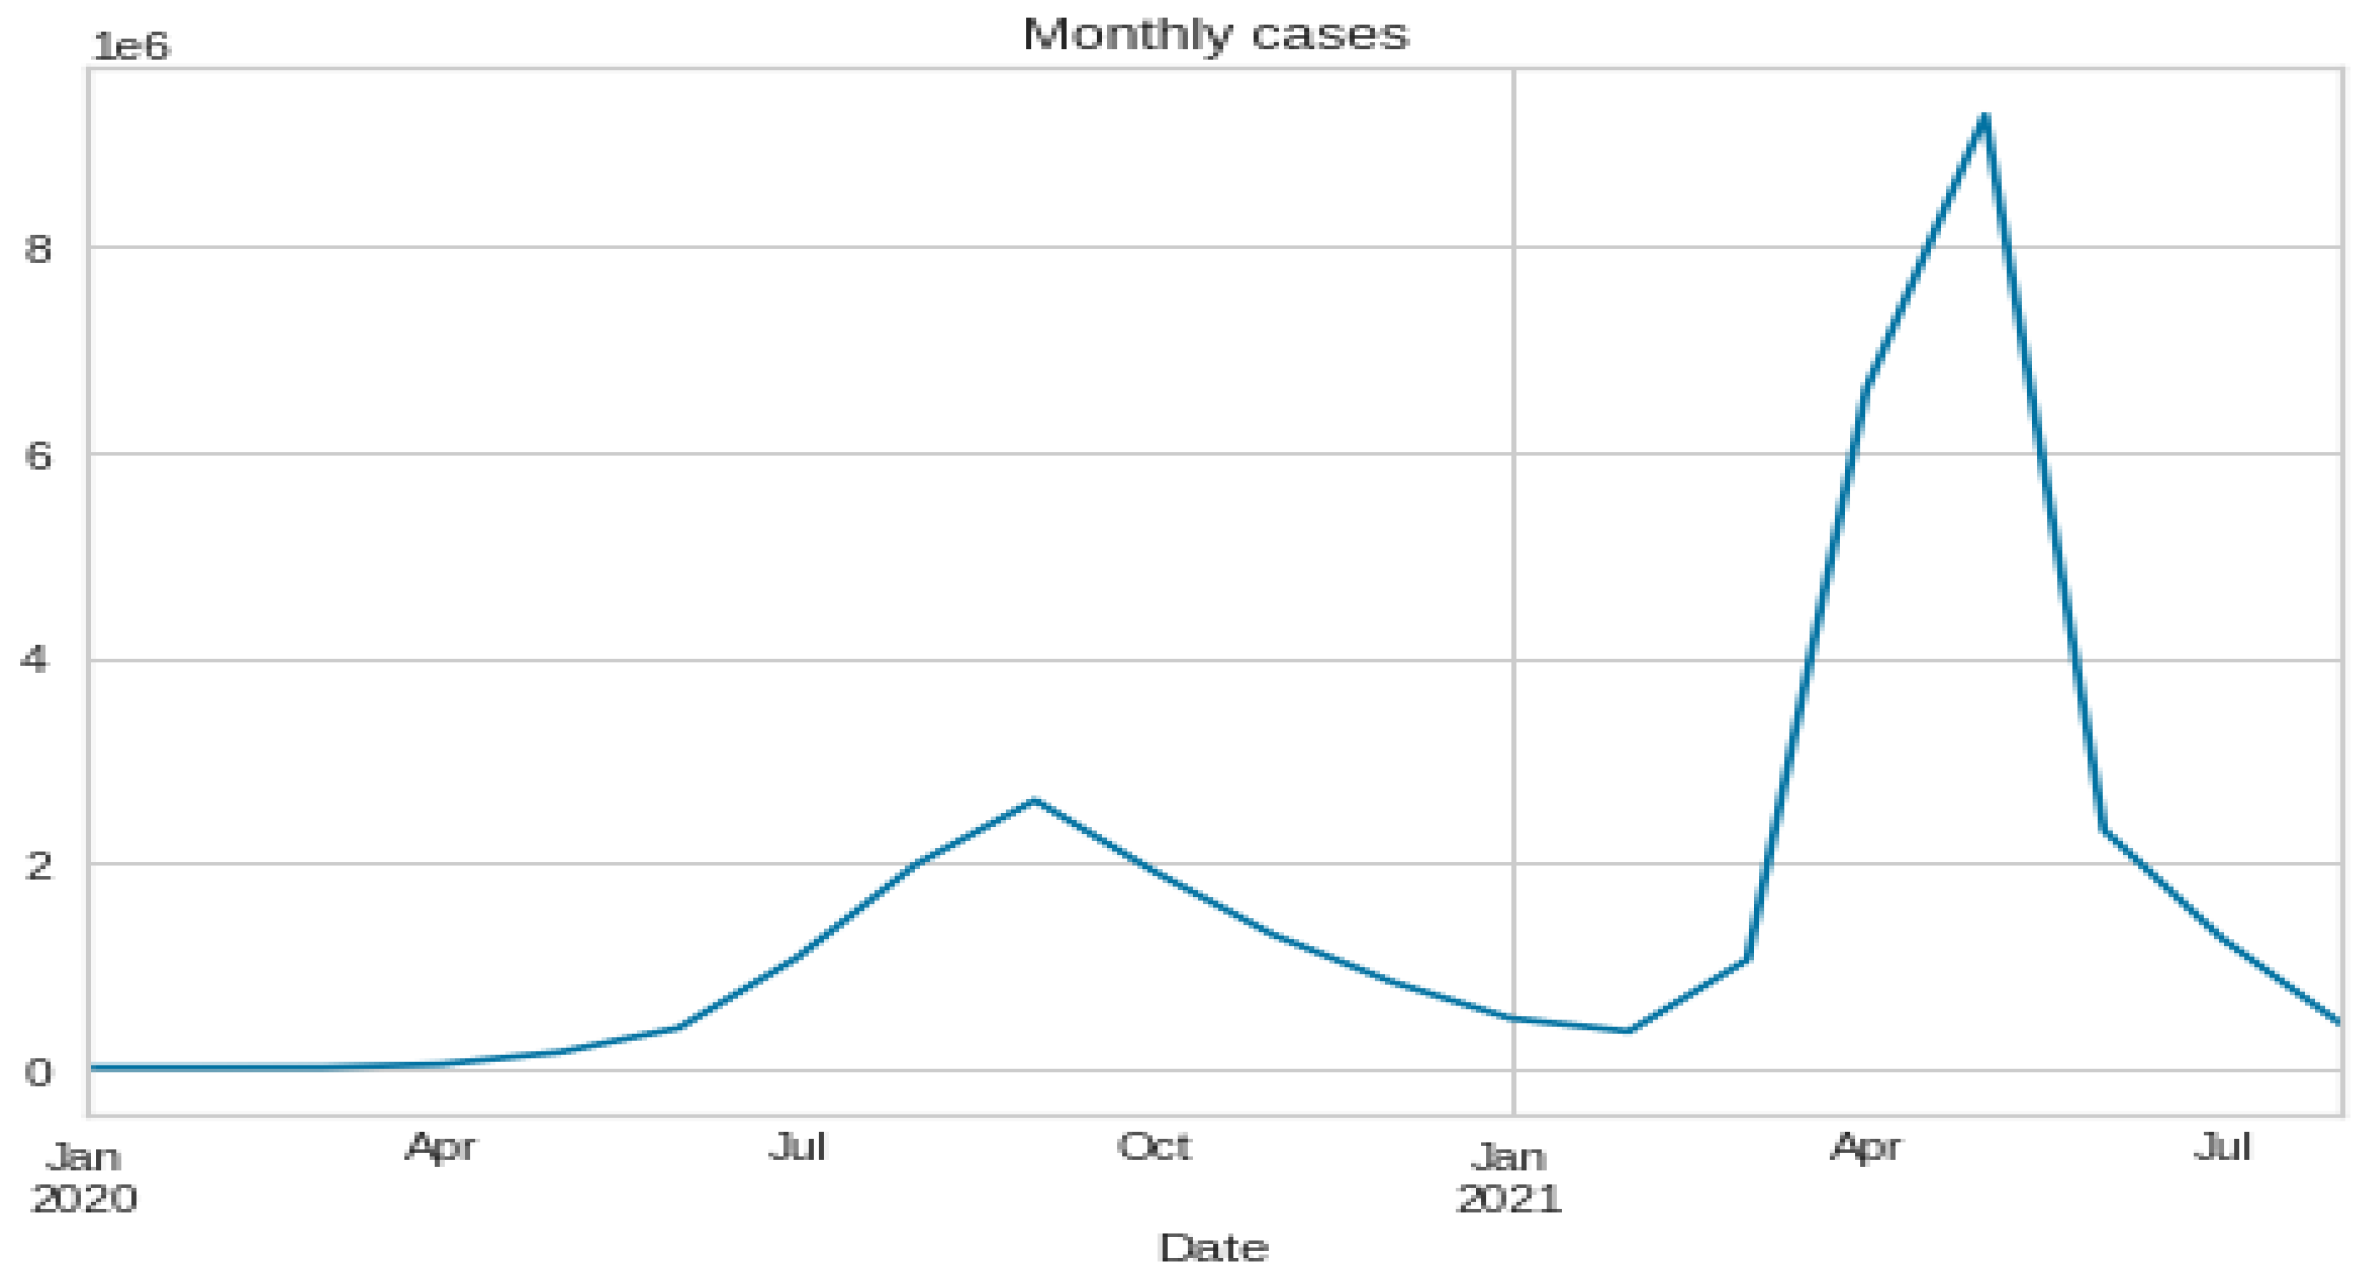
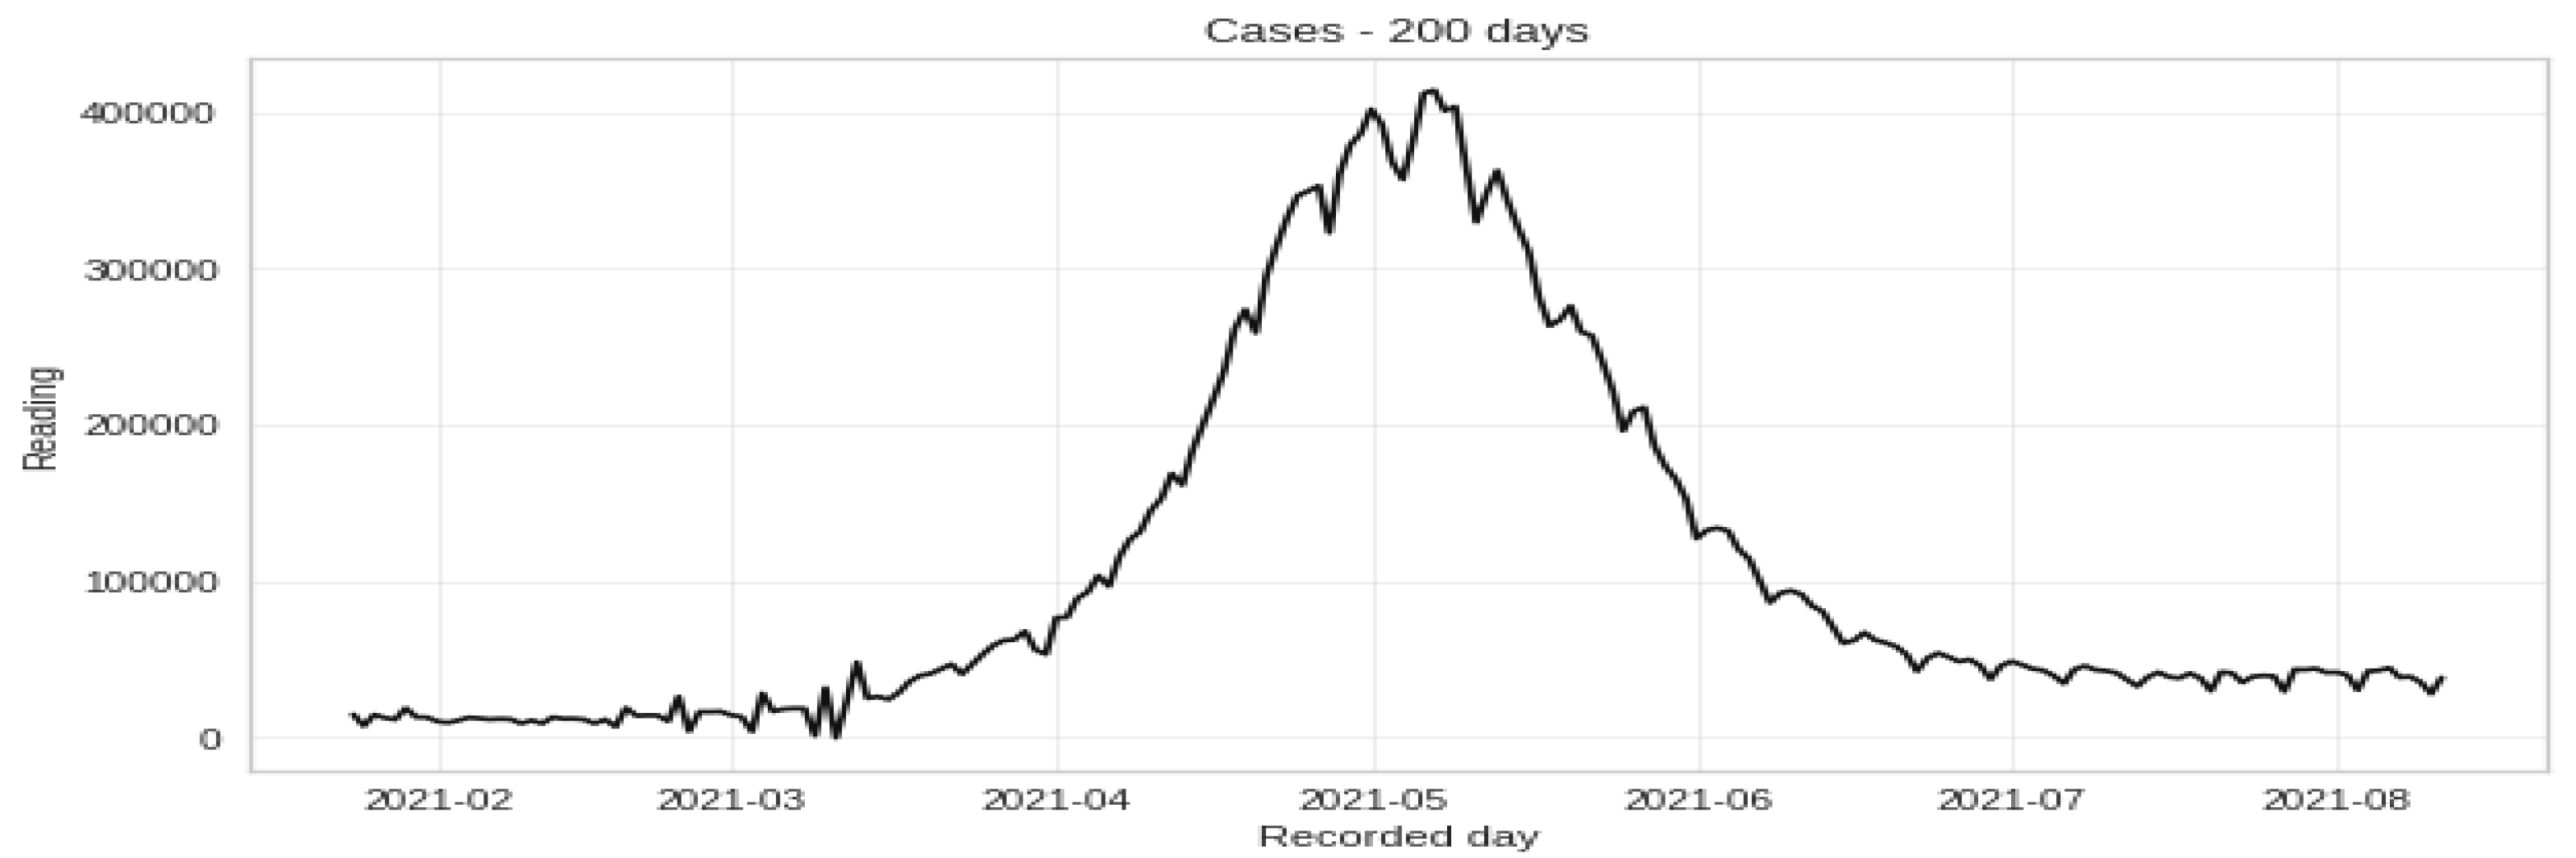
3.1. Data Set Description and Data Preparation
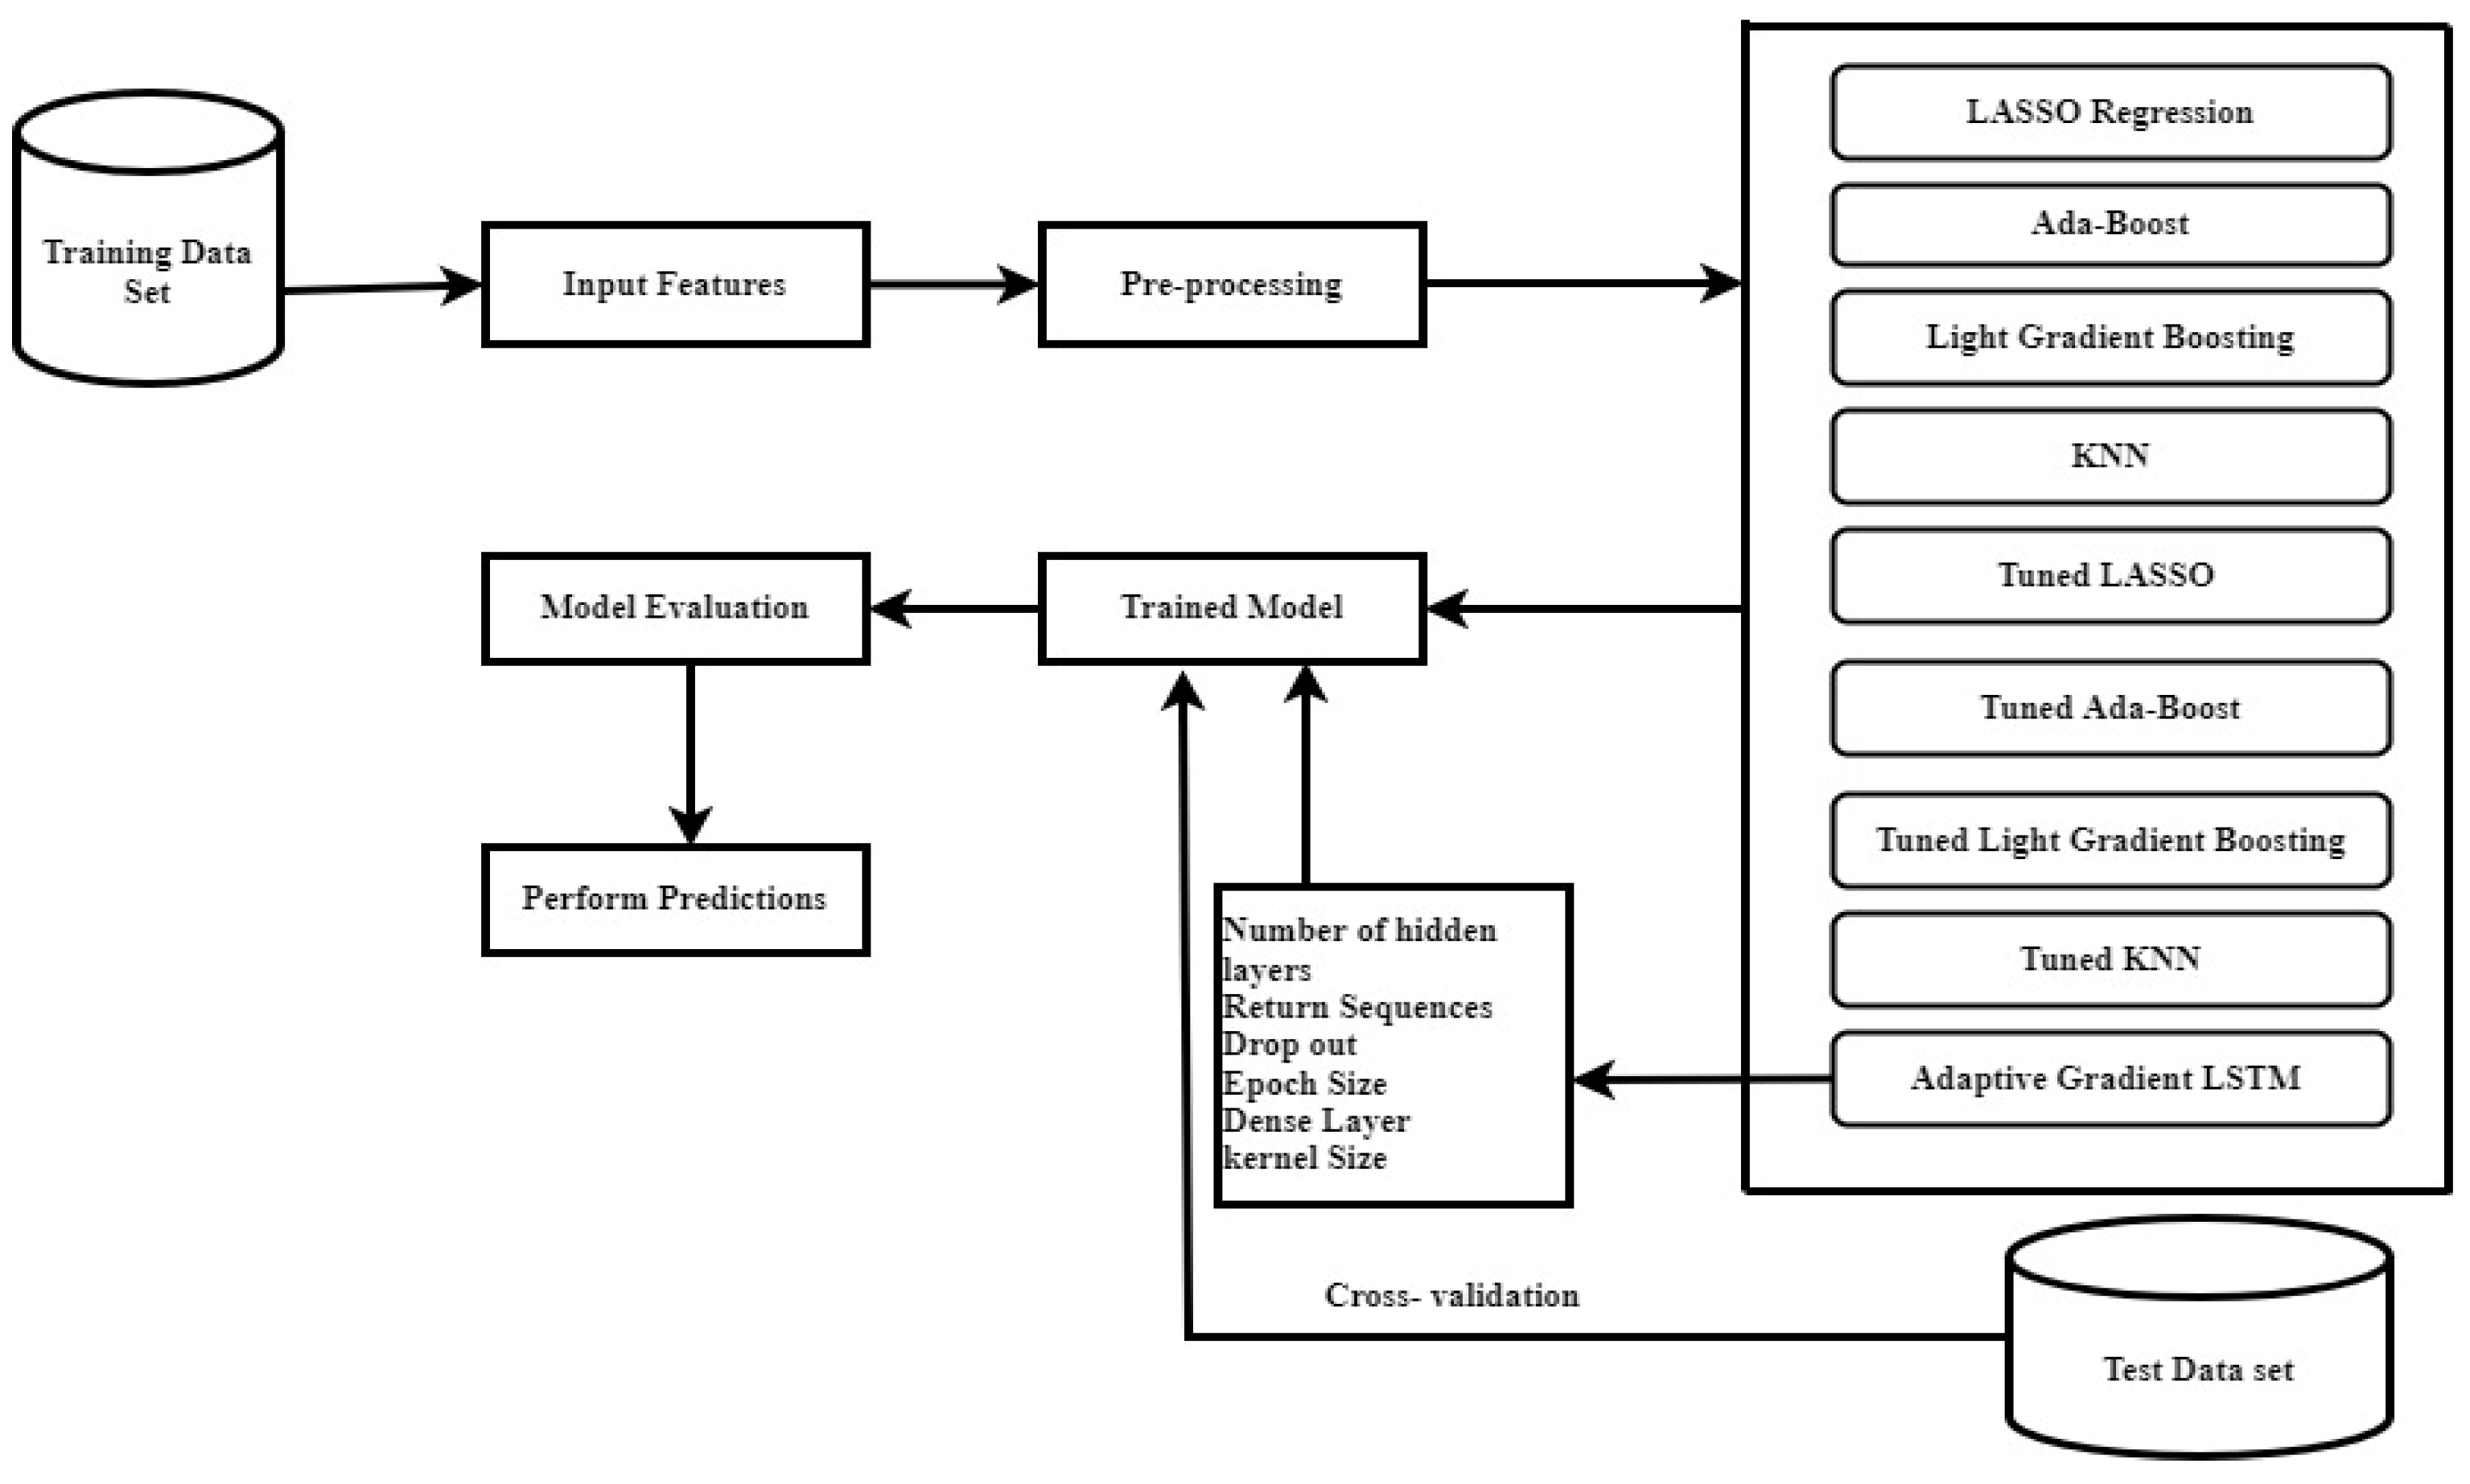
3.2. Machine Learning Models
3.2.1. Lasso Regression
3.2.2. K-Nearest Neighbor
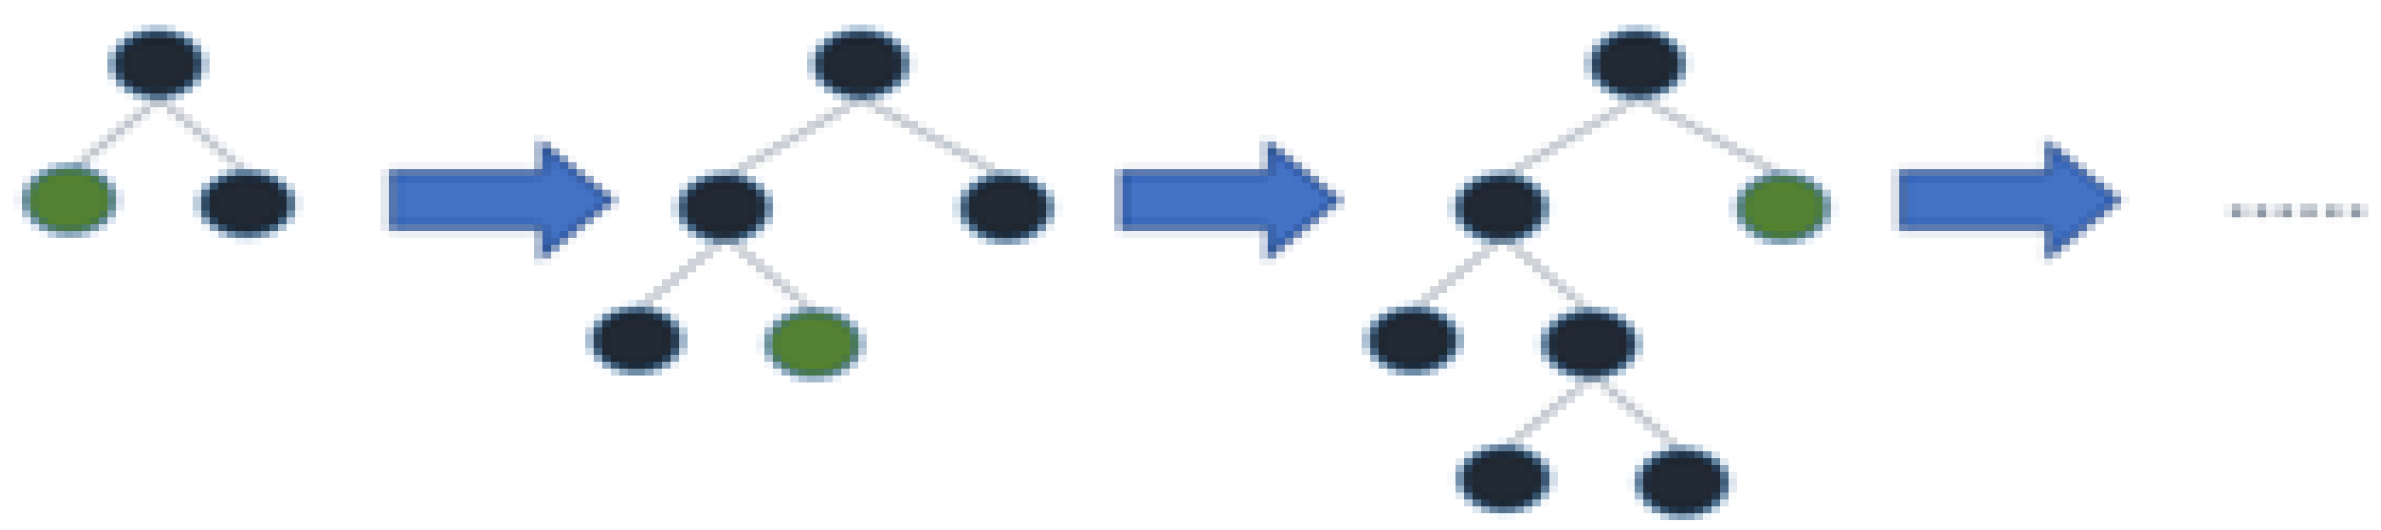
3.2.3. Ada Boost
3.2.4. Light Gradient Boosting Machine
3.2.5. Recurrent Neural Network
3.2.6. Long Short-Term Memory (LSTM)
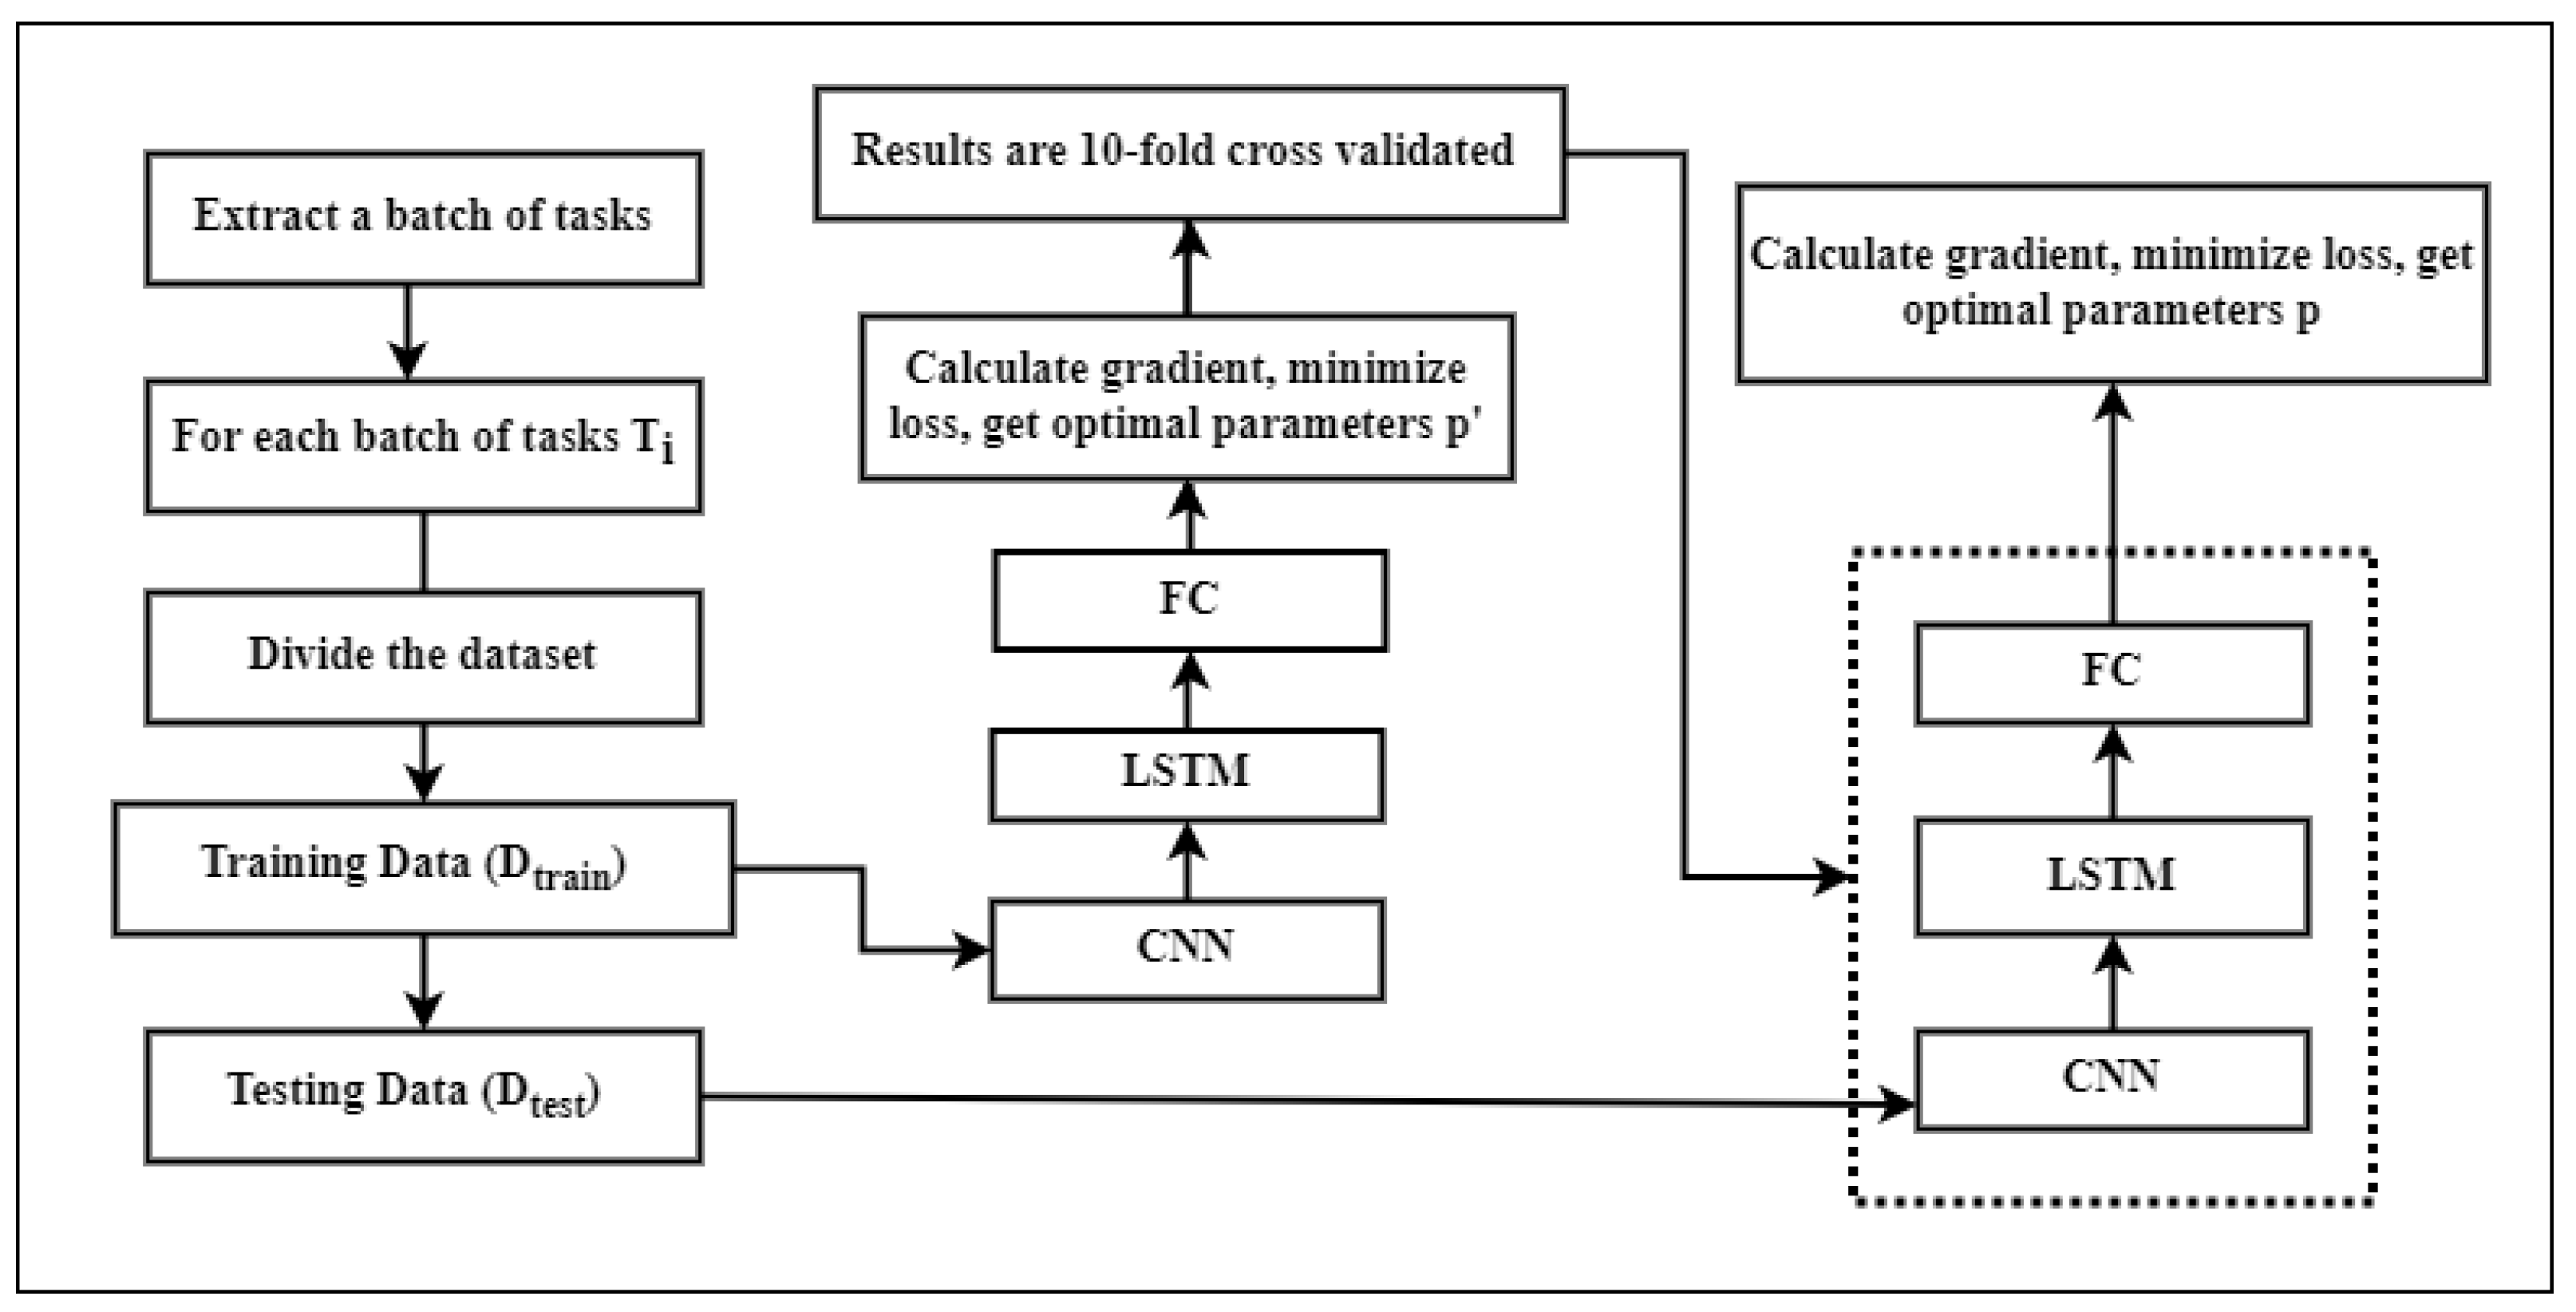
3.2.7. Adaptive Gradient LSTM
Model Structure
3.3. Performance Metrics
3.4. Experimental Setup
- Epochs: the number of epochs is a parameter that specifies how many times the learning technique will run over the entire training dataset. The number of epochs refers to the number of full passes over the training dataset;
- Size of the batch: the batch size is a parameter that specifies the number of samples to work with before updating the internal model’s variables. The batch size relates to how many samples are processed before the model is updated;
- Number of neurons: the number of neurons in a network affects its learning capacity. In general, the more neurons there are, the faster the issue structure is learned at the expense of a longer learning period. With increased learning capability comes the risk of over-fitting the data utilized for training [32].
| Algorithm 1: Base Algorithm |
| Input: Load dataset for pre-processing |
| Output: Positive COVID-19 cases and deaths over n days |
| Normalize the dataset into values from 0 to 1 |
| Initialize the sequential network |
| Set the no. of RNN blocks and input the activation function |
| Select the training window size |
| for n epochs and batch size, do |
| Train the network |
| end for |
| Run predictions |
| Calculate the loss function, accuracy |
| Algorithm 2: Ada_Gradient_LSTM |
| Input: Initialize sequential model with dataset passed through CNN |
| Output: Positive COVID-19 cases and deaths over n days |
| Adding the first LSTM layer and some Dropout regularization Set LSTM units = 45, return_sequences = True, input_shape = (X_train.shape [1],1) Select Dropouts as 0.2 Adding the second LSTM layer and some Dropout regularization Set LSTM units = 65, return_sequences = True Select Dropouts as 0.2 Adding the third LSTM layer and some Dropout regularization Set LSTM units = 85, return_sequences = True Select Dropouts as 0.2 Adding the fourth LSTM layer and some Dropout regularization Set LSTM units = 128 Select Dropouts as 0.2 Adding the output layer Set Dense units = 1 Calculate the loss function/optimization strategy and fit Select optimizer as adam Fit the desired number of passes over the data (epochs) Set train and test epochs, Batch_size = 64 and verbose = 1 Return results |
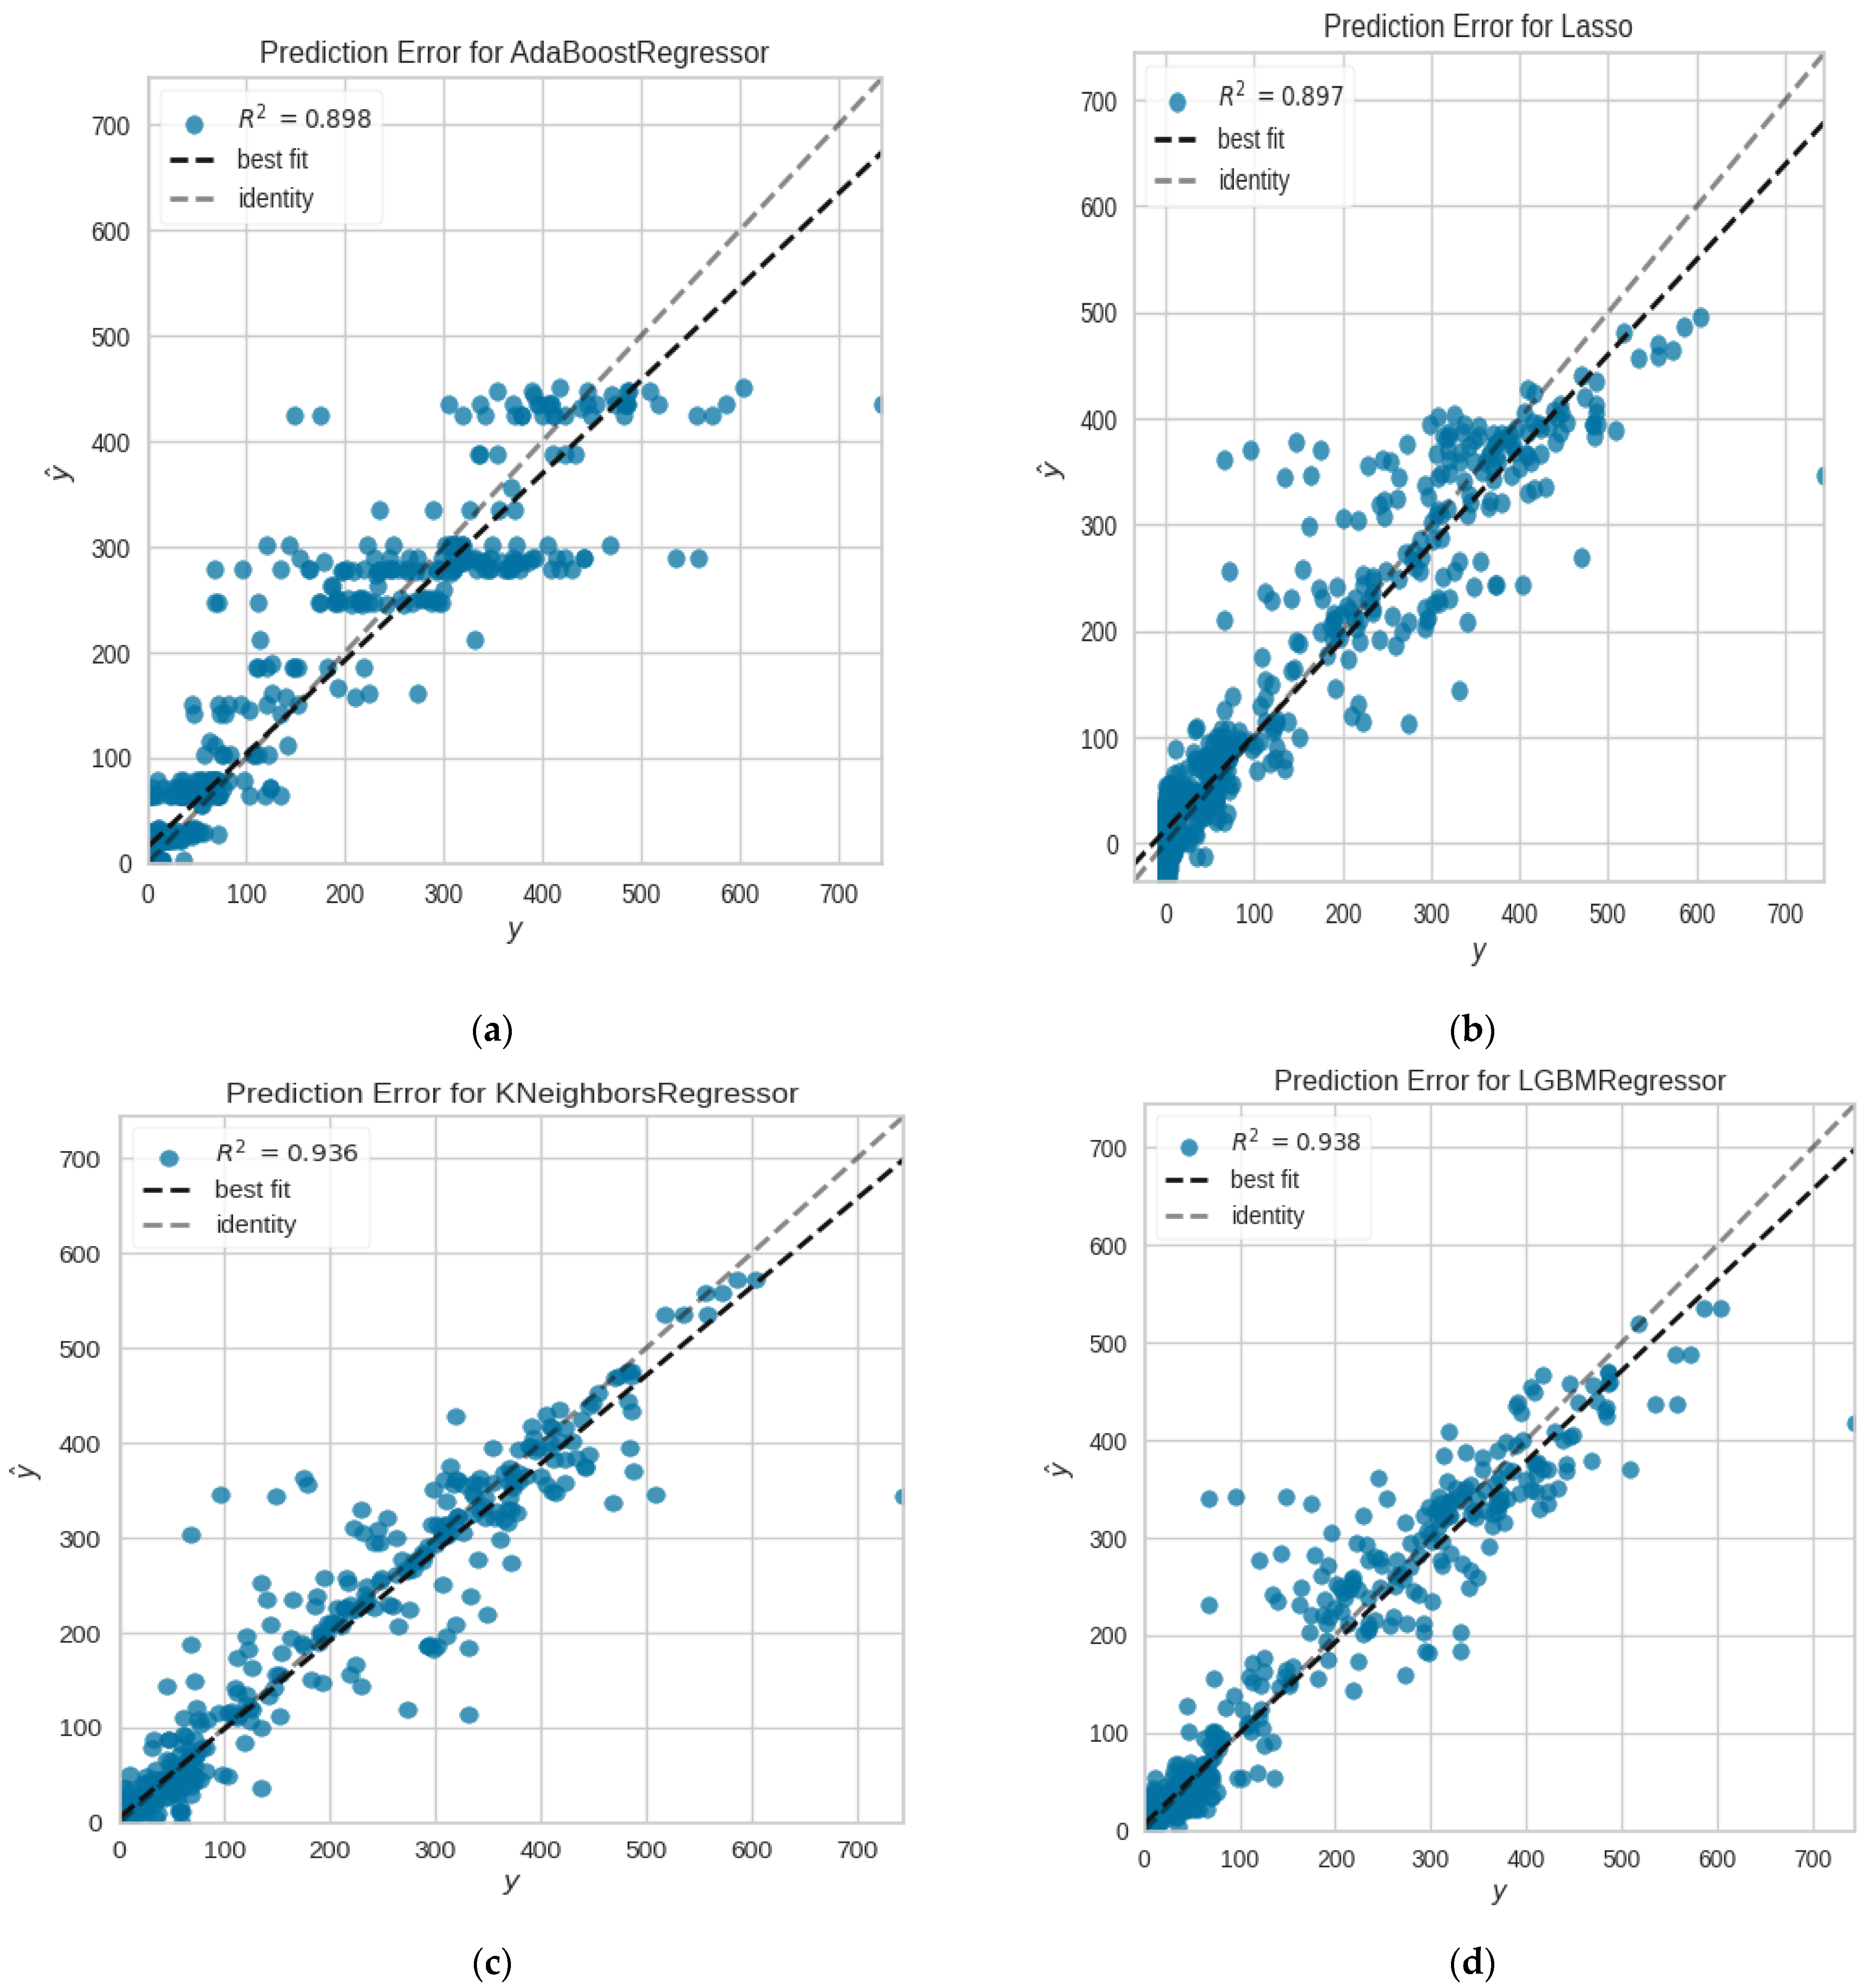
4. Results
5. Discussion
6. Conclusions
7. Limitations
Author Contributions
Funding
Institutional Review Board Statement
Informed Consent Statement
Data Availability Statement
Conflicts of Interest
References
- Jamshidi, M.B.; Lalbakhsh, A.; Talla, J.; Peroutka, Z.; Hadjilooei, F.; Lalbakhsh, P.; Jamshidi, M.; La Spada, L.; Mirmozafari, M.; Dehghani, M.; et al. Artificial Intelligence and COVID-19: Deep Learning Approaches for Diagnosis and Treatment. IEEE Access 2020, 8, 109581–109595. [Google Scholar] [CrossRef] [PubMed]
- Nour, M.; Cömert, Z.; Polat, K. A Novel Medical Diagnosis model for COVID-19 infection detection based on Deep Features and Bayesian Optimization. Appl. Soft Comput. 2020, 97, 106580. [Google Scholar] [CrossRef] [PubMed]
- Kumaravel, S.K.; Subramani, R.K.; Sivakumar, T.K.J.; Elavarasan, R.M.; Vetrichelvan, A.M.; Annam, A.; Subramaniam, U. Investigation on the impacts of COVID-19 quarantine on society and environment: Preventive measures and supportive technologies. 3 Biotech 2020, 10, 1–24. [Google Scholar] [CrossRef] [PubMed]
- Dritsas, E.; Trigka, M. Supervised Machine Learning Models to Identify Early-Stage Symptoms of SARS-CoV-2. Sensors 2022, 23, 40. [Google Scholar] [CrossRef] [PubMed]
- Kucharski, A.J.; Russell, T.W.; Diamond, C.; Liu, Y.; Edmunds, J.; Funk, S.; Eggo, R.M.; Sun, F.; Jit, M.; Munday, J.D.; et al. Early dynamics of transmission and control of COVID-19: A mathematical modelling study. Lancet Infect. Dis. 2020, 20, 553–558. [Google Scholar] [CrossRef]
- Ramírez-Gallego, S.; Krawczyk, B.; García, S.; Woźniak, M.; Herrera, F. A survey on data preprocessing for data stream mining: Current status and future directions. Neurocomputing 2017, 239, 39–57. [Google Scholar] [CrossRef]
- Yang, L.; Ban, X.; Chen, Z.; Guo, H. A New Data Preprocessing Technique Based on Feature Extraction and Clustering for Complex Discrete Temperature Data. Procedia Comput. Sci. 2018, 129, 78–80. [Google Scholar] [CrossRef]
- Czarnowski, I.; Jȩdrzejowicz, P. Data reduction algorithm for machine learning and data mining. In International Conference on Industrial, Engineering and Other Applications of Applied Intelligent Systems; Springer: Berlin/Heidelberg, Germany, 2008; pp. 276–285. [Google Scholar]
- Kim, M. Prediction of COVID-19 Confirmed Cases after Vaccination: Based on Statistical and Deep Learning Models. SciMed. J. 2021, 3, 153–165. [Google Scholar] [CrossRef]
- Tai, Y.; Gao, B.; Li, Q.; Yu, Z.; Zhu, C.; Chang, V. Trustworthy and intelligent COVID-19 diagnostic iomt through xr and deep-learning-based clinic data access. IEEE Internet Things J. 2021, 8, 15965–15976. [Google Scholar] [CrossRef]
- Samui, P.; Mondal, J.; Khajanchi, S. A mathematical model for COVID-19 transmission dynamics with a case study of India. Chaos Solitons Fractals 2020, 140, 110173. [Google Scholar] [CrossRef]
- Arora, P.; Kumar, H.; Panigrahi, B.K. Prediction and analysis of COVID-19 positive cases using deep learning models: A descriptive case study of India. Chaos Solitons Fractals 2020, 139, 110017. [Google Scholar] [CrossRef] [PubMed]
- Meng, T.; Jing, X.; Yan, Z.; Pedrycz, W. A survey on machine learning for data fusion. Inf. Fusion 2020, 57, 115–129. [Google Scholar] [CrossRef]
- Li, M.; Zhang, Z.; Jiang, S.; Liu, Q.; Chen, C.; Zhang, Y.; Wang, X. Predicting the epidemic trend of COVID-19 in China and across the world using the machine learning approach. medRxiv 2020. [Google Scholar] [CrossRef]
- Ardabili, S.F.; Mosavi, A.; Ghamisi, P.; Ferdinand, F.; Varkonyi-Koczy, A.R.; Reuter, U.; Rabczuk, T.; Atkinson, P.M. COVID-19 Outbreak Prediction with Machine Learning. Algorithms 2020, 13, 249. [Google Scholar] [CrossRef]
- Dutta, S.; Bandyopadhyay, S.K. Machine learning approach for confirmation of COVID-19 cases: Positive, negative, death and release. medRxiv 2020. [Google Scholar] [CrossRef]
- Huang, C.J.; Chen, Y.H.; Ma, Y.; Kuo, P.H. Multiple-input deep convolutional neural network model for COVID-19 forecasting in china. medRxiv 2020. [Google Scholar] [CrossRef]
- Kumari, R.; Kumar, S.; Poonia, R.C.; Singh, V.; Raja, L.; Bhatnagar, V.; Agarwal, P. Analysis and predictions of spread, recovery, and death caused by COVID-19 in India. Big Data Min. Anal. 2021, 4, 65–75. [Google Scholar] [CrossRef]
- Zeroual, A.; Harrou, F.; Dairi, A.; Sun, Y. Deep learning methods for forecasting COVID-19 time-Series data: A Comparative study. Chaos Solitons Fractals 2020, 140, 110121. [Google Scholar] [CrossRef]
- Hernandez-Matamoros, A.; Fujita, H.; Hayashi, T.; Perez-Meana, H. Forecasting of COVID19 per regions using ARIMA models and polynomial functions. Appl. Soft Comput. 2020, 96, 106610. [Google Scholar] [CrossRef]
- Chae, S.; Kwon, S.; Lee, D. Predicting infectious disease using deep learning and big data. Int. J. Environ. Res. Public Health 2018, 15, 1596. [Google Scholar] [CrossRef]
- Kırbaş, I.; Sözen, A.; Tuncer, A.D.; Kazancıoğlu, F. Comparative analysis and forecasting of COVID-19 cases in various European countries with ARIMA, NARNN and LSTM approaches. Chaos Solitons Fractals 2020, 138, 110015. [Google Scholar] [CrossRef] [PubMed]
- Abbasimehr, H.; Paki, R. Prediction of COVID-19 confirmed cases combining deep learning methods and Bayesian optimization. Chaos Solitons Fractals 2021, 142, 110511. [Google Scholar] [CrossRef] [PubMed]
- Chimmula, V.K.R.; Zhang, L. Time series forecasting of COVID-19 transmission in Canada using LSTM networks. Chaos Solitons Fractals 2020, 135, 109864. [Google Scholar] [CrossRef] [PubMed]
- Shahid, F.; Zameer, A.; Muneeb, M. Predictions for COVID-19 with deep learning models of LSTM, GRU and Bi-LSTM. Chaos Solitons Fractals 2020, 140, 110212. [Google Scholar] [CrossRef]
- Tomar, A.; Gupta, N. Prediction for the spread of COVID-19 in India and effectiveness of preventive measures. Sci. Total Environ. 2020, 728, 138762. [Google Scholar] [CrossRef]
- Shastri, S.; Singh, K.; Kumar, S.; Kour, P.; Mansotra, V. Time series forecasting of COVID-19 using deep learning models: India-USA comparative case study. Chaos Solitons Fractals 2020, 140, 110227. [Google Scholar] [CrossRef]
- Papastefanopoulos, V.; Linardatos, P.; Kotsiantis, S. COVID-19: A Comparison of Time Series Methods to Forecast Percentage of Active Cases per Population. Appl. Sci. 2020, 10, 3880. [Google Scholar] [CrossRef]
- Devaraj, J.; Elavarasan, R.M.; Pugazhendhi, R.; Shafiullah, G.; Ganesan, S.; Jeysree, A.K.; Khan, I.A.; Hossain, E. Forecasting of COVID-19 cases using deep learning models: Is it reliable and practically significant? Results Phys. 2021, 21, 103817. [Google Scholar] [CrossRef]
- Ben Yahia, N.; Kandara, M.D.; BenSaoud, N.B. Integrating Models and Fusing Data in a Deep Ensemble Learning Method for Predicting Epidemic Diseases Outbreak. Big Data Res. 2022, 27, 100286. [Google Scholar] [CrossRef]
- Ayris, D.; Imtiaz, M.; Horbury, K.; Williams, B.; Blackney, M.; See, C.S.H.; Shah, S.A.A. Novel deep learning approach to model and predict the spread of COVID-19. Intell. Syst. Appl. 2022, 14, 200068. [Google Scholar] [CrossRef]
- Alassafi, M.O.; Jarrah, M.; Alotaibi, R. Time series predicting of COVID-19 based on deep learning. Neurocomputing 2022, 468, 335–344. [Google Scholar] [CrossRef] [PubMed]
- Hawas, M. Generated time-series prediction data of COVID-19′s daily infections in Brazil by using recurrent neural networks. Data Brief 2020, 32, 106175. [Google Scholar] [CrossRef] [PubMed]
- Karim, F.; Majumdar, S.; Darabi, H.; Chen, S. LSTM fully convolutional networks for time series classification. IEEE Access 2017, 6, 1662–1669. [Google Scholar] [CrossRef]
- Lu, H.; Liu, Y.; Fei, Z.; Guan, C. An outlier detection algorithm based on cross-correlation analysis for time series dataset. IEEE Access 2018, 6, 53593–53610. [Google Scholar] [CrossRef]
- Rajaraman, S.; Siegelman, J.; Alderson, P.O.; Folio, L.S.; Folio, L.R.; Antani, S.K. Iteratively pruned deep learning ensembles for COVID-19 detection in chest X-rays. IEEE Access 2020, 8, 115041–115050. [Google Scholar] [CrossRef] [PubMed]
- Vantuch, T.; Snasel, V.; Zelinka, I. Dimensionality reduction method’s comparison based on statistical dependencies. Procedia Comput. Sci. 2016, 83, 1025–1031. [Google Scholar] [CrossRef]
- Datta, R.K.; Sajid, S.W.; Moon, M.H.; Abedin, M.Z. Foreign currency exchange rate prediction using bidirectional long short term memory. In The Big Data-Driven Digital Economy: Artificial and Computational Intelligence; Springer International Publishing: Cham, Switzerland, 2021; pp. 213–227. [Google Scholar]
- Paroli, M.; Sirinian, M.I. Predicting SARS-CoV-2 infection trend using technical analysis indicators. Disaster Med. Public Health Prep. 2021, 15, e10–e14. [Google Scholar] [CrossRef]
- Roth, V. The generalized LASSO. IEEE Trans. Neural Netw. 2004, 15, 16–28. [Google Scholar] [CrossRef]
- Song, Y.; Liang, J.; Lu, J.; Zhao, X. An efficient instance selection algorithm for k nearest neighbor regression. Neurocomputing 2017, 251, 26–34. [Google Scholar] [CrossRef]
- Ying, C.; Qi-Guang, M.; Jia-Chen, L.; Lin, G. Advance and prospects of AdaBoost algorithm. Acta Autom. Sin. 2013, 39, 745–758. [Google Scholar]
- Schapire, R.E. Explaining Adaboost. Empirical Inference: Festschrift in Honor of Vladimir N. Vapnik; Springer: Berlin/Heidelberg, Germany, 2013; pp. 37–52. [Google Scholar]
- Taha, A.A.; Malebary, S.J. An Intelligent Approach to Credit Card Fraud Detection Using an Optimized Light Gradient Boosting Machine. IEEE Access 2020, 8, 25579–25587. [Google Scholar] [CrossRef]
- Bryant, A.; Cios, K. RNN-DBSCAN: A Density-Based Clustering Algorithm Using Reverse Nearest Neighbor Density Estimates. IEEE Trans. Knowl. Data Eng. 2017, 30, 1109–1121. [Google Scholar] [CrossRef]
- Yu, W.; Kim, I.Y.; Mechefske, C. An improved similarity-based prognostic algorithm for RUL estimation using an RNN autoencoder scheme. Reliab. Eng. Syst. Saf. 2020, 199, 106926. [Google Scholar] [CrossRef]
- Monner, D.; Reggia, J.A. A generalized LSTM-like training algorithm for second-order recurrent neural networks. Neural Netw. 2012, 25, 70–83. [Google Scholar] [CrossRef] [PubMed]


| Ref | Methodology Adopted | Data Type | Data Source | Results | Purpose of Research |
|---|---|---|---|---|---|
| Kırbas et al. [22] | ARIMA, Nonlinear Autoregression Neural Network (NARNN) and Long-Short Term Memory (LSTM) | Cumulative confirmed cases data of 8 different European countries and the dataset is considered till 3 May 2020 | European Center for Disease Prevention and Control | MAPE values of the LSTM model are better than the other models | To model and predict the cumulative confirmed cases and total increase rate of the countries was analyzed and compared. LSTM outperforms other models. |
| Arora et al. [23] | Deep LSTM/Stacked LSTM, Convolutional LSTM and Bidirectional LSTM | Confirmed cases in India. 14 March 2020 to 14 May 2020 | Ministry of Health and Family Welfare | Bi-directional LSTM provides better results than the other models with less error | Daily and weekly predictions of all states are done to explore the increase in positive cases |
| Chimmula and Zhang [24] | LSTM | confirmed cases in Canada and Italy until 31 March 2020 | Johns Hopkins University and Canadian Health Authority | Achieved 92% accuracy | To predict the number of confirmed cases in Canada and Italy and to compare the growth |
| Shahid et al. [25] | ARIMA, support vector regression (SVR), long short-term memory (LSTM), Bi-LSTM | 22 January 2020 to 27 June 2020. 158 samples of the number of confirmed cases, deaths and recovered cases | Dataset is taken from the Harvard University | Bi-LSTM outperforms other models with lower R2 score values | To predict the number of confirmed deaths and recovered cases in 10 countries for better planning and management |
| Tomar and Gupta [26] | LSTM | Cumulative and daily dataset of COVID-19 cases in India | Center for Systems Science and Engineering (CSSE) at Johns Hopkins University | LSTM achieved 90% accuracy in predicting COVID cases | To predict the number of confirmed and recovered cases using a data-driven estimation method |
| Shastri et al. [27] | LSTM, Stacked LSTM, Bi-directional LSTM and Convolutional LSTM | India and USA-Confirmed cases data from 7 February to 7 July 2020 Death cases data from 12 March to 7 July 2020. | Datasets of India and USA are taken from the Ministry of Health and Family Welfare, Government of India and Centers for Disease Control and Prevention, U.S Department of Health and Human Services | ConvLSTM outperforms stacked and bi-directional LSTM in confirmed cases and deaths | To predict the number of COVID-19 confirmed and death cases 1 month ahead and to compare the accuracy of deep learning models |
| Papastefanopoulos et al. [28] | Six different forecasting methods are presented. ARIMA, the Holt-Winters additive model (HWAAS), TBAT, Facebook’s Prophet, Deep AR | January 2020 to April 2020 and the population of countries | Novel Corona Virus 2019 Dataset and population-by-country dataset from kaggle.com | ARIMA and TBAT outperformed other models in forecasting the pandemic | To predict the number of future COVID-19 confirmed death and recovered cases by considering the country’s population |
| Devaraj, J. et al. [29] | ARIMA, LSTM, Stacked LSTM | 22 January 2020 to 8 May 2020. Simulated dataset for seven cities for the months of May, June, July and August 2020. All countries’ data from January 2020 to September 2020 | Datasets were collected from John Hopkins University, World Weather Page and Wikipedia page | SLSTM outperformed other models. In statistical analysis, ARIMA outperformed the LSTM model. Overall, the SLSTM model is better than other models. | Global, country-specific, and city-specific cumulative COVID case prediction is done. Feature correlation is done, and the best model prediction is identified through statistical hypothesis testing. Multivariate analysis and prediction of Indian COVID cases are done. |
| Yahia, N. B. at al. [30] | LSTM, DNN, CNN, Stacked DNN, Stacked LSTM and Stacked CNN | 22 January 2020 until 9 November 2020 | Datasets were collected from John Hopkins University | Stacked DNN outperformed other models | For the two case studies, China and Tunisia, the stacked-DNN whose inputs are predicted values of LSTM, DNN, and CNN perform better than the stacked LSTM and the stacked CNN |
| Ayris, D. et al. [31] | The Deep Sequential prediction model (DSPM) and non-parametric regression model (NRM) | 22 January to 6 June 2020 | Datasets were collected from John Hopkins University | The proposed NRM performed better than the proposed DSPM; however, the difference in performance is not large | |
| Alassafi, M. O. [32] | RNN and LSTM | Up to 3 December 2020 | European Centre for Disease Prevention and Control | The LSTM models | RNN and LSTM |
| Hawas [33] | Recurrent Neural Network (RNN) | Daily confirmed cases in Brazil 54 to 84 days 7 April to 29 June 2020 | Center for Systems Science and Engineering (CSSE) at Johns Hopkins University | Achieved 60.17% accuracy | To predict, 1 month ahead, the confirmed cases and take preventive measures |
| Cured | Deaths | Cases | |
|---|---|---|---|
| Count | 1.811000 × 10⁴ | 18,110.000000 | 1.811000 × 10⁴ |
| Mean | 2.786375 × 10⁵ | 4052.402264 | 3.010314 × 10⁵ |
| Std | 6.148909 × 10⁵ | 10,919.076411 | 6.561489 × 10⁵ |
| Min | 0.000000 | 0.000000 | 0.000000 |
| 25% | 3.360250 × 10³ | 32.000000 | 4.376750 × 10³ |
| 50% | 3.336400 × 10⁴ | 588.000000 | 3.977350× 10⁴ |
| 75% | 2.788698 × 10⁵ | 3643.750000 | 3.001498 × 10⁵ |
| Max | 6.159676 × 10⁶ | 134,201.000000 | 6.363442 × 10⁶ |
| S. No. | Hyper-Parameters | Search Space | Type |
|---|---|---|---|
| 1 | Hidden Layers | [2,10] | Continuous |
| 2 | Neurons | [1,100] | Continuous |
| 3 | Activation Function | [Tanh and ReLU] | Discrete with step = 1 |
| 4 | Loss Function | MSE, MAE | Discrete with step = 1 |
| 5 | Optimizer | Adam, RMS prop | Discrete with step = 1 |
| 6 | Batch Size | [32,64] | Discrete with step = 1 |
| 7 | Epochs | [5,200] | Continuous |
| Methods | MAE | MSE | RMSE | R2 | MAPE | TT (s) |
|---|---|---|---|---|---|---|
| Ada-Boost | 32.2941 | 2543.9772 | 50.1802 | 0.8889 | 11,588.1993 | 20.23 |
| KNN | 22.5399 | 2205.7787 | 46.6148 | 0.9035 | 14.6692 | 9.11 |
| Light GBM | 22.3603 | 1987.0647 | 44.2956 | 0.9135 | 106.8839 | 15.26 |
| LASSO | 30.9013 | 2367.2686 | 48.2781 | 0.8969 | 8707.4533 | 12.17 |
| Methods | MAE | MSE | RMSE | R2 | MAPE | TT (s) |
|---|---|---|---|---|---|---|
| Ada-Boost-_tuned | 22.9311 | 1983.8546 | 33.4521 | 0.8999 | 10,288.1924 | 17.29 |
| KNN_tuned | 19.5649 | 2014.4652 | 27.5847 | 0.9321 | 145.6382 | 11.77 |
| LightGBM_tuned | 15.5103 | 1658.2546 | 37.8796 | 0.9354 | 109.8219 | 14. 70 |
| LASSO_tuned | 18.9883 | 1774.8547 | 29.7772 | 0.9215 | 8103.4151 | 12.09 |
| Model | Accuracy | F-Measure | Sensitivity | Specificity | AUC | TT (s) |
|---|---|---|---|---|---|---|
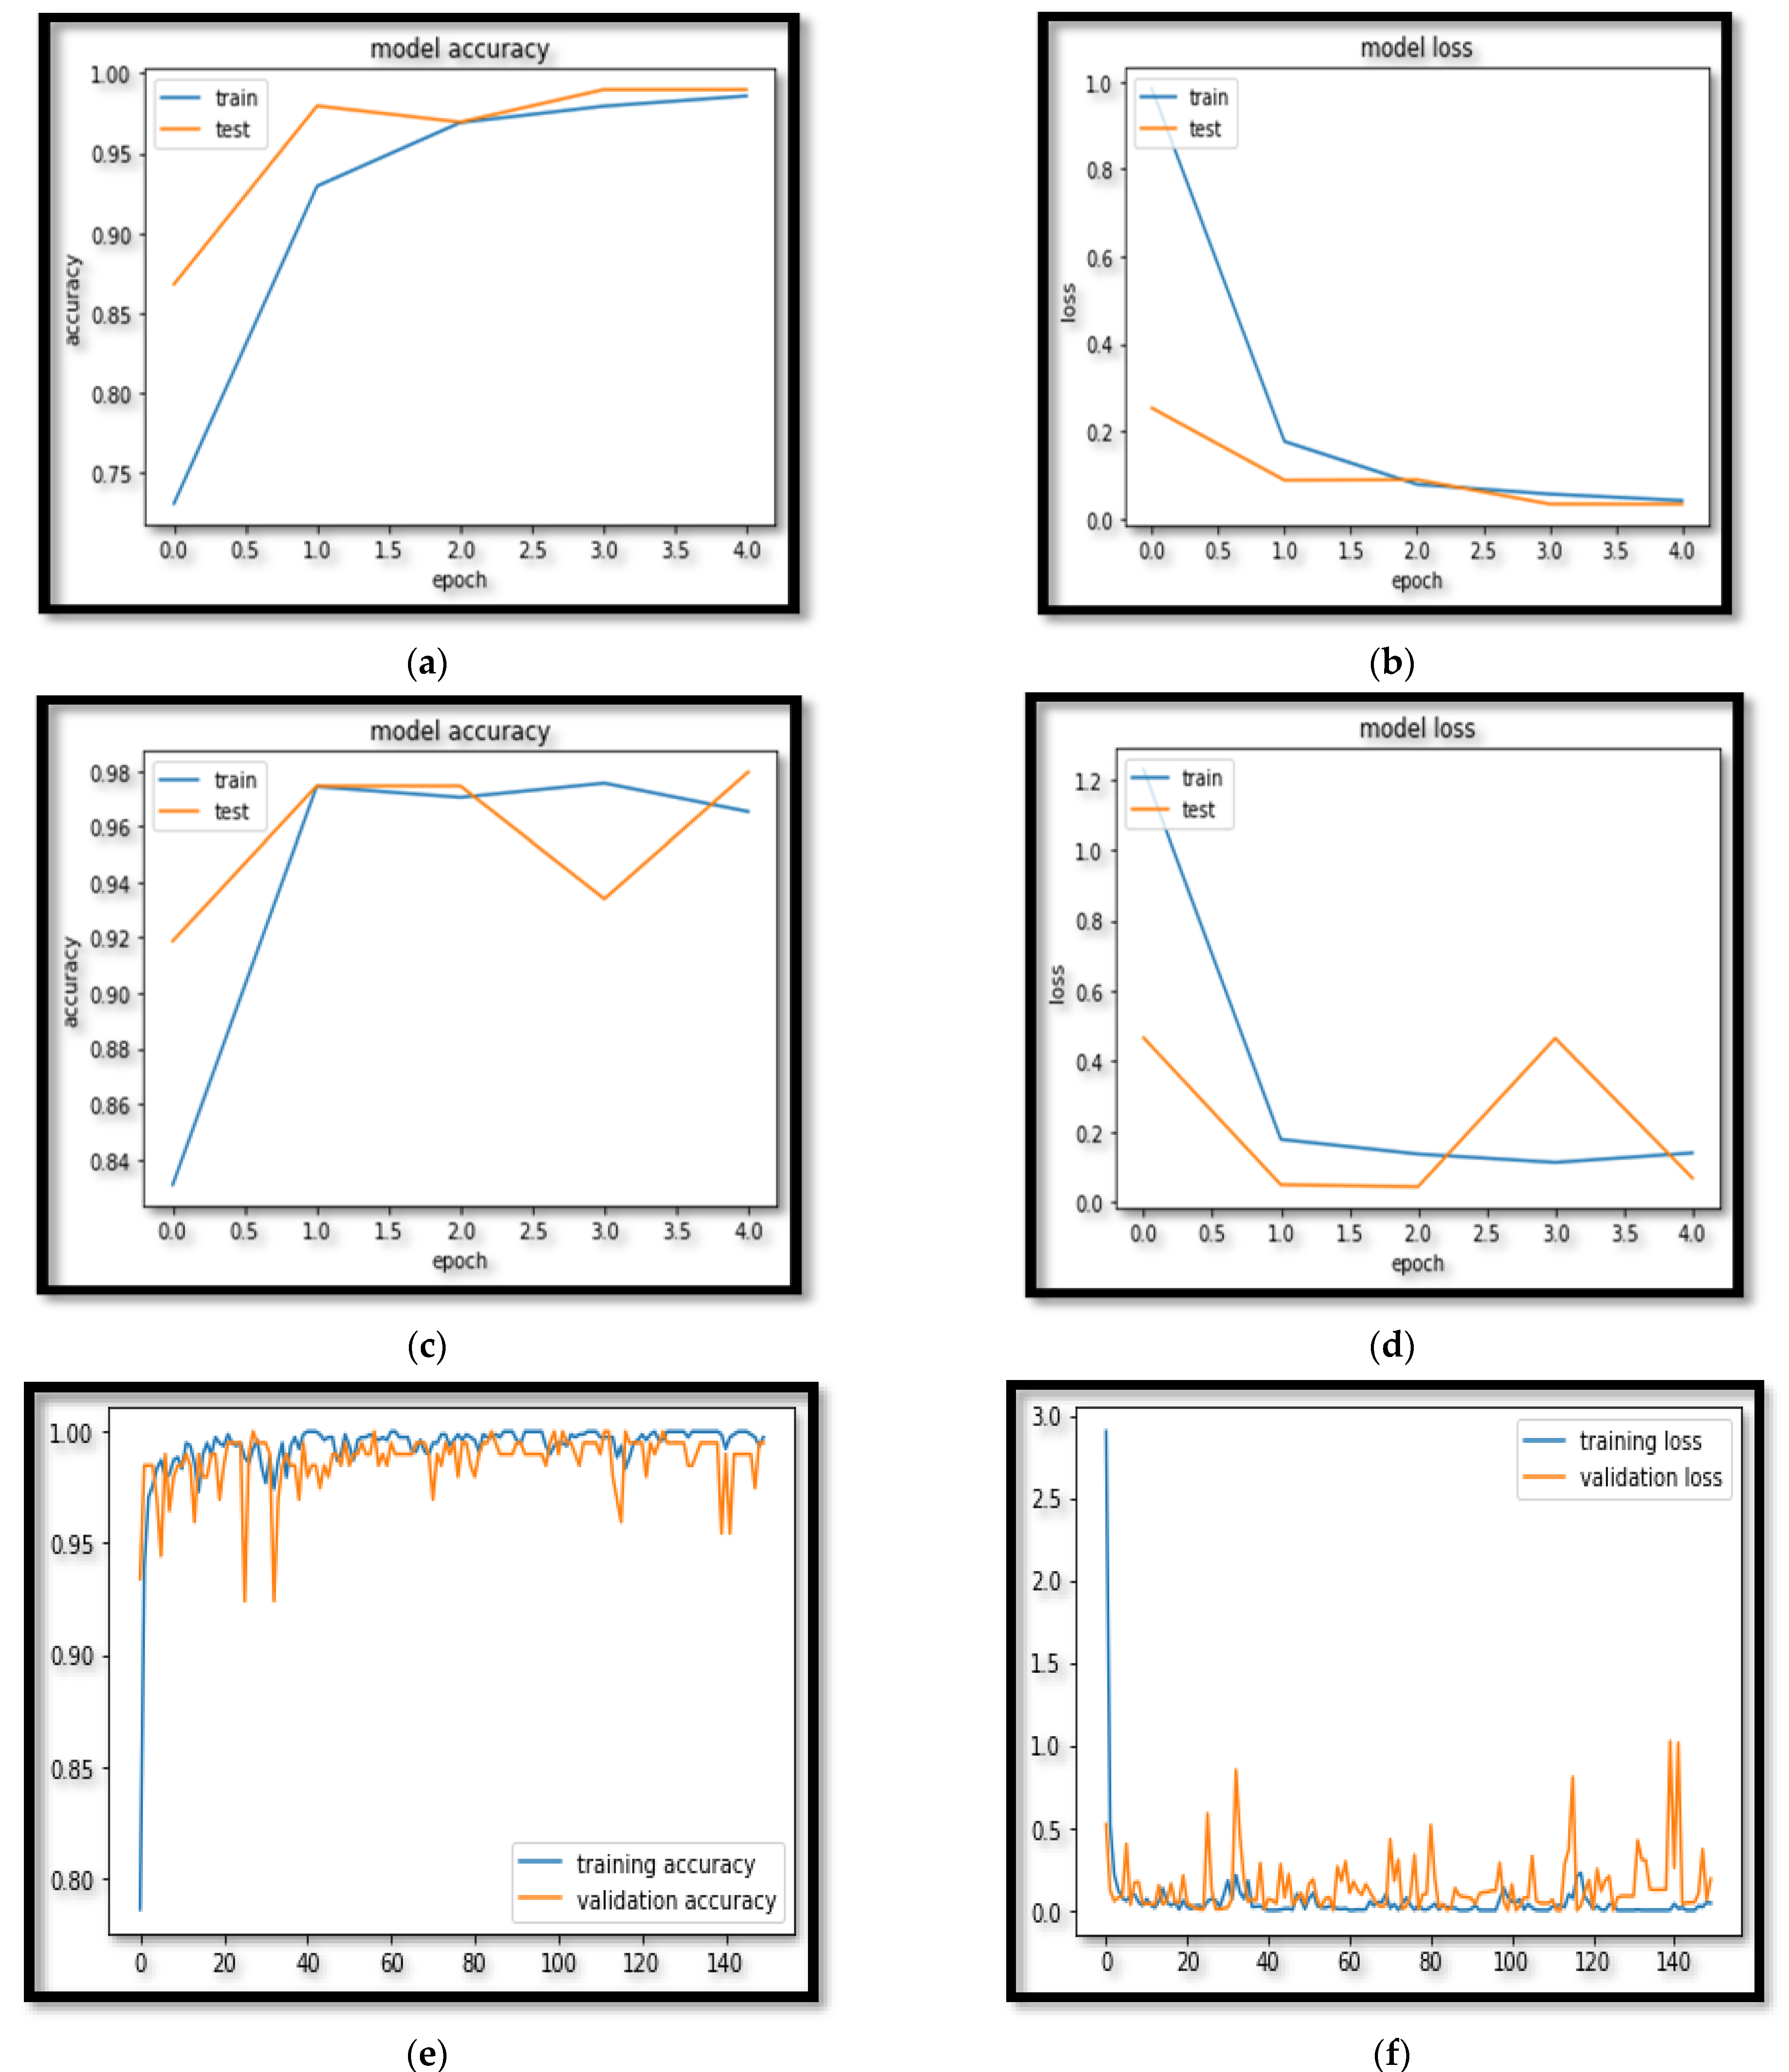
| AGLSTM | 99.81 ± 0.21 | 98 ± 1.04 | 99 ± 0.85 | 99 ± 0.72 | 98 ± 1.02 | 6.09 |
| LSTM | 97.97 ± 1.02 | 96.87 ± 1.82 | 97.47 ± 1.05 | 97.97 ± 1.02 | 96.97 ± 1.02 | 11.87 |
| RNN | 96.95 ± 1.75 | 96.95 ± 1.55 | 95.95 ± 1.75 | 96.95 ± 1.25 | 95.95 ± 1.84 | 18.11 |
Disclaimer/Publisher’s Note: The statements, opinions and data contained in all publications are solely those of the individual author(s) and contributor(s) and not of MDPI and/or the editor(s). MDPI and/or the editor(s) disclaim responsibility for any injury to people or property resulting from any ideas, methods, instructions or products referred to in the content. |
© 2023 by the authors. Licensee MDPI, Basel, Switzerland. This article is an open access article distributed under the terms and conditions of the Creative Commons Attribution (CC BY) license (https://creativecommons.org/licenses/by/4.0/).
Share and Cite
Sharma, S.; Gupta, Y.K.; Mishra, A.K. Analysis and Prediction of COVID-19 Multivariate Data Using Deep Ensemble Learning Methods. Int. J. Environ. Res. Public Health 2023, 20, 5943. https://doi.org/10.3390/ijerph20115943
Sharma S, Gupta YK, Mishra AK. Analysis and Prediction of COVID-19 Multivariate Data Using Deep Ensemble Learning Methods. International Journal of Environmental Research and Public Health. 2023; 20(11):5943. https://doi.org/10.3390/ijerph20115943
Chicago/Turabian StyleSharma, Shruti, Yogesh Kumar Gupta, and Abhinava K. Mishra. 2023. "Analysis and Prediction of COVID-19 Multivariate Data Using Deep Ensemble Learning Methods" International Journal of Environmental Research and Public Health 20, no. 11: 5943. https://doi.org/10.3390/ijerph20115943