Introduction
Sediments are generally recognized to play a prominent role in ecosystem cycling, as the top layer is intimately linked to surface waters through physical, chemical and biological processes. The continuous discharge of industrial wastes into the water bodies is increasing the risk of their contamination [
1]. Sediments are globally considered the ultimate sinks for the particulate accumulation of organics and their environmental transformation in sediments has been well documented [
2,
3]. Organic contaminants in sediment systems are mixtures of hundreds of aliphatic, chlorinated aromatic and other organic compounds, the relative proportions of which vary greatly between sources [
4]. Inorganic contaminants also have very complex interactions with both anthropogenic and natural components in marine sediments.
The persistence of organo xenobiotics in the environment is a matter of significant public, scientific and regulatory concern because of the potential toxicity, mutagenicity, carcinogenicity and ability to bioconcentrate up the trophic ladder. These concerns continue to drive the need for the development and application of remediation techniques [
5]. It is now widely recognized that contaminated land is a potential threat to human health, and its continual discovery over recent years has led international efforts to remediate many of these sites, either as a response to the risk of adverse health or environmental effects caused by contamination or to enable the site to be redeveloped for use [
6]. A key factor in both the degradability and bioavailabiity of the most recalcitrant fractions of anthropogenic contaminants is the long-term sorption that can occur between organic molecules and clays or other minerals in soils and sediments [
7].
Hyderabad, the capital city of Andhra Pradesh, South India has almost 80 lakes in and around the city. With the growing industrial activities over the years about 8 large industrial estates have been developed and these industries are unscrupulously dumping their effluents into the nearby lakes thereby depleting the natural flora, fauna and the ecological balance. The pollutants in these lakes tend to bioconcentrate up the trophic ladder and reach humans. So, rejuvenation of these lakes is a task of utmost importance and employing physico-chemical processes only transform the pollutants from one form to another but biological processes transform them into innocuous end products. These concerns continue to drive the need for the development and application of viable and low cost remediation techniques [
8]. Bioremediation is one such technology that offers the possibility to destroy or render harmless various contaminants using natural biological activity. Micro organisms have a unique ability to interact both chemically and physically with a huge range of both man-made and naturally occurring compounds leading to a structural change to, or the complete degradation of the target molecule [
9].
Composting is one of the bioremediation strategies which when carried out under controlled conditions in the presence of oxygen results in the biological decomposition and stabilization of the biodegradable components. The process of composting includes four main phases, which are the initial phase, the thermophilic phase, the mesophilic phase and the maturation phase after which the compost can be used as an organic amendment. For the compost to be used as an organic amendment it has to be assessed for certain parameters like nitrification index, cation exchange capacity, germination index, humification index, water soluble carbon, compost mineralization index, and sorption capacity index etc.
Stabilization or maturation also implies the formation of some humic – like substances the degree of organic matter humification is generally accepted as a criterion of maturity [
10]. The humification process produces functional groups and so increased oxidation of the organic matter leads to rise in cation exchange capacity. So compost with high cation exchange capacity is regarded as an index of maturity [
11]. The degree of maturity can also be revealed by biological methods involving seed germination and root length [
12]. Since immature composts may contain phytotoxic substances such as phenolic acids and volatile fatty acids [
13].
The aim of the present work is to monitor the process of composting for the contaminated lake sediments and observe the changes occurring in the two piles set up by taking sediment from different strata and discusses few of the maturity indices and thus validates their use as matured composts resulting from the biological stabilization.
Materials and Methods
Initially a 100 × 100 m plot on the lakebed was chosen and the top layer was dredged and sent to a treatment storage and disposal facility located near the outskirts of city for land filling thereby getting rid of the uppermost-polluted layer on the lakebed. The next 0.25 m of the lakebed was removed and a portion of the sediment was set up as Pile 1. A further 0.25 m was dredged whose part was set up as Pile 2. The two piles were set up by taking the sediments from two different strata of the lakebed in a view to assess the leaching potential of pollutants into the different strata of the lake sediments and their amenability to composting. The soil type on the lakebed has the following characteristics Clay – 352 gm/Kg; Silt (20–50μm) – 81 gm/Kg; Sand (50–200μm) – 61gm/Kg; Sand (200 – 2000μm) – 32 gm/Kg.
Lime Stabilization
The polluted sediments from the two different strata were initially mixed with lime at 1% (w/w, dry weight basis), which raised the pH to 9.2. Liming helped in the stabilization of heavy metals by precipitation as metal hydroxides at higher pH [
14]. The organics and heavy metal concentration in the sediments before and after composting are presented in
Table 1. The sediments were kept as such for five days and then mixed with organic amendments like manure (Poultry manure and cow dung) and sawdust, which brought down the pH to 6.8. Lab scale experiments for composting were set up by taking sediment, manure and sawdust in the ratio of 2:1:2 making a total of 120kgs on dry weight basis. The lab scale set up for the aerobic composting pile is shown in
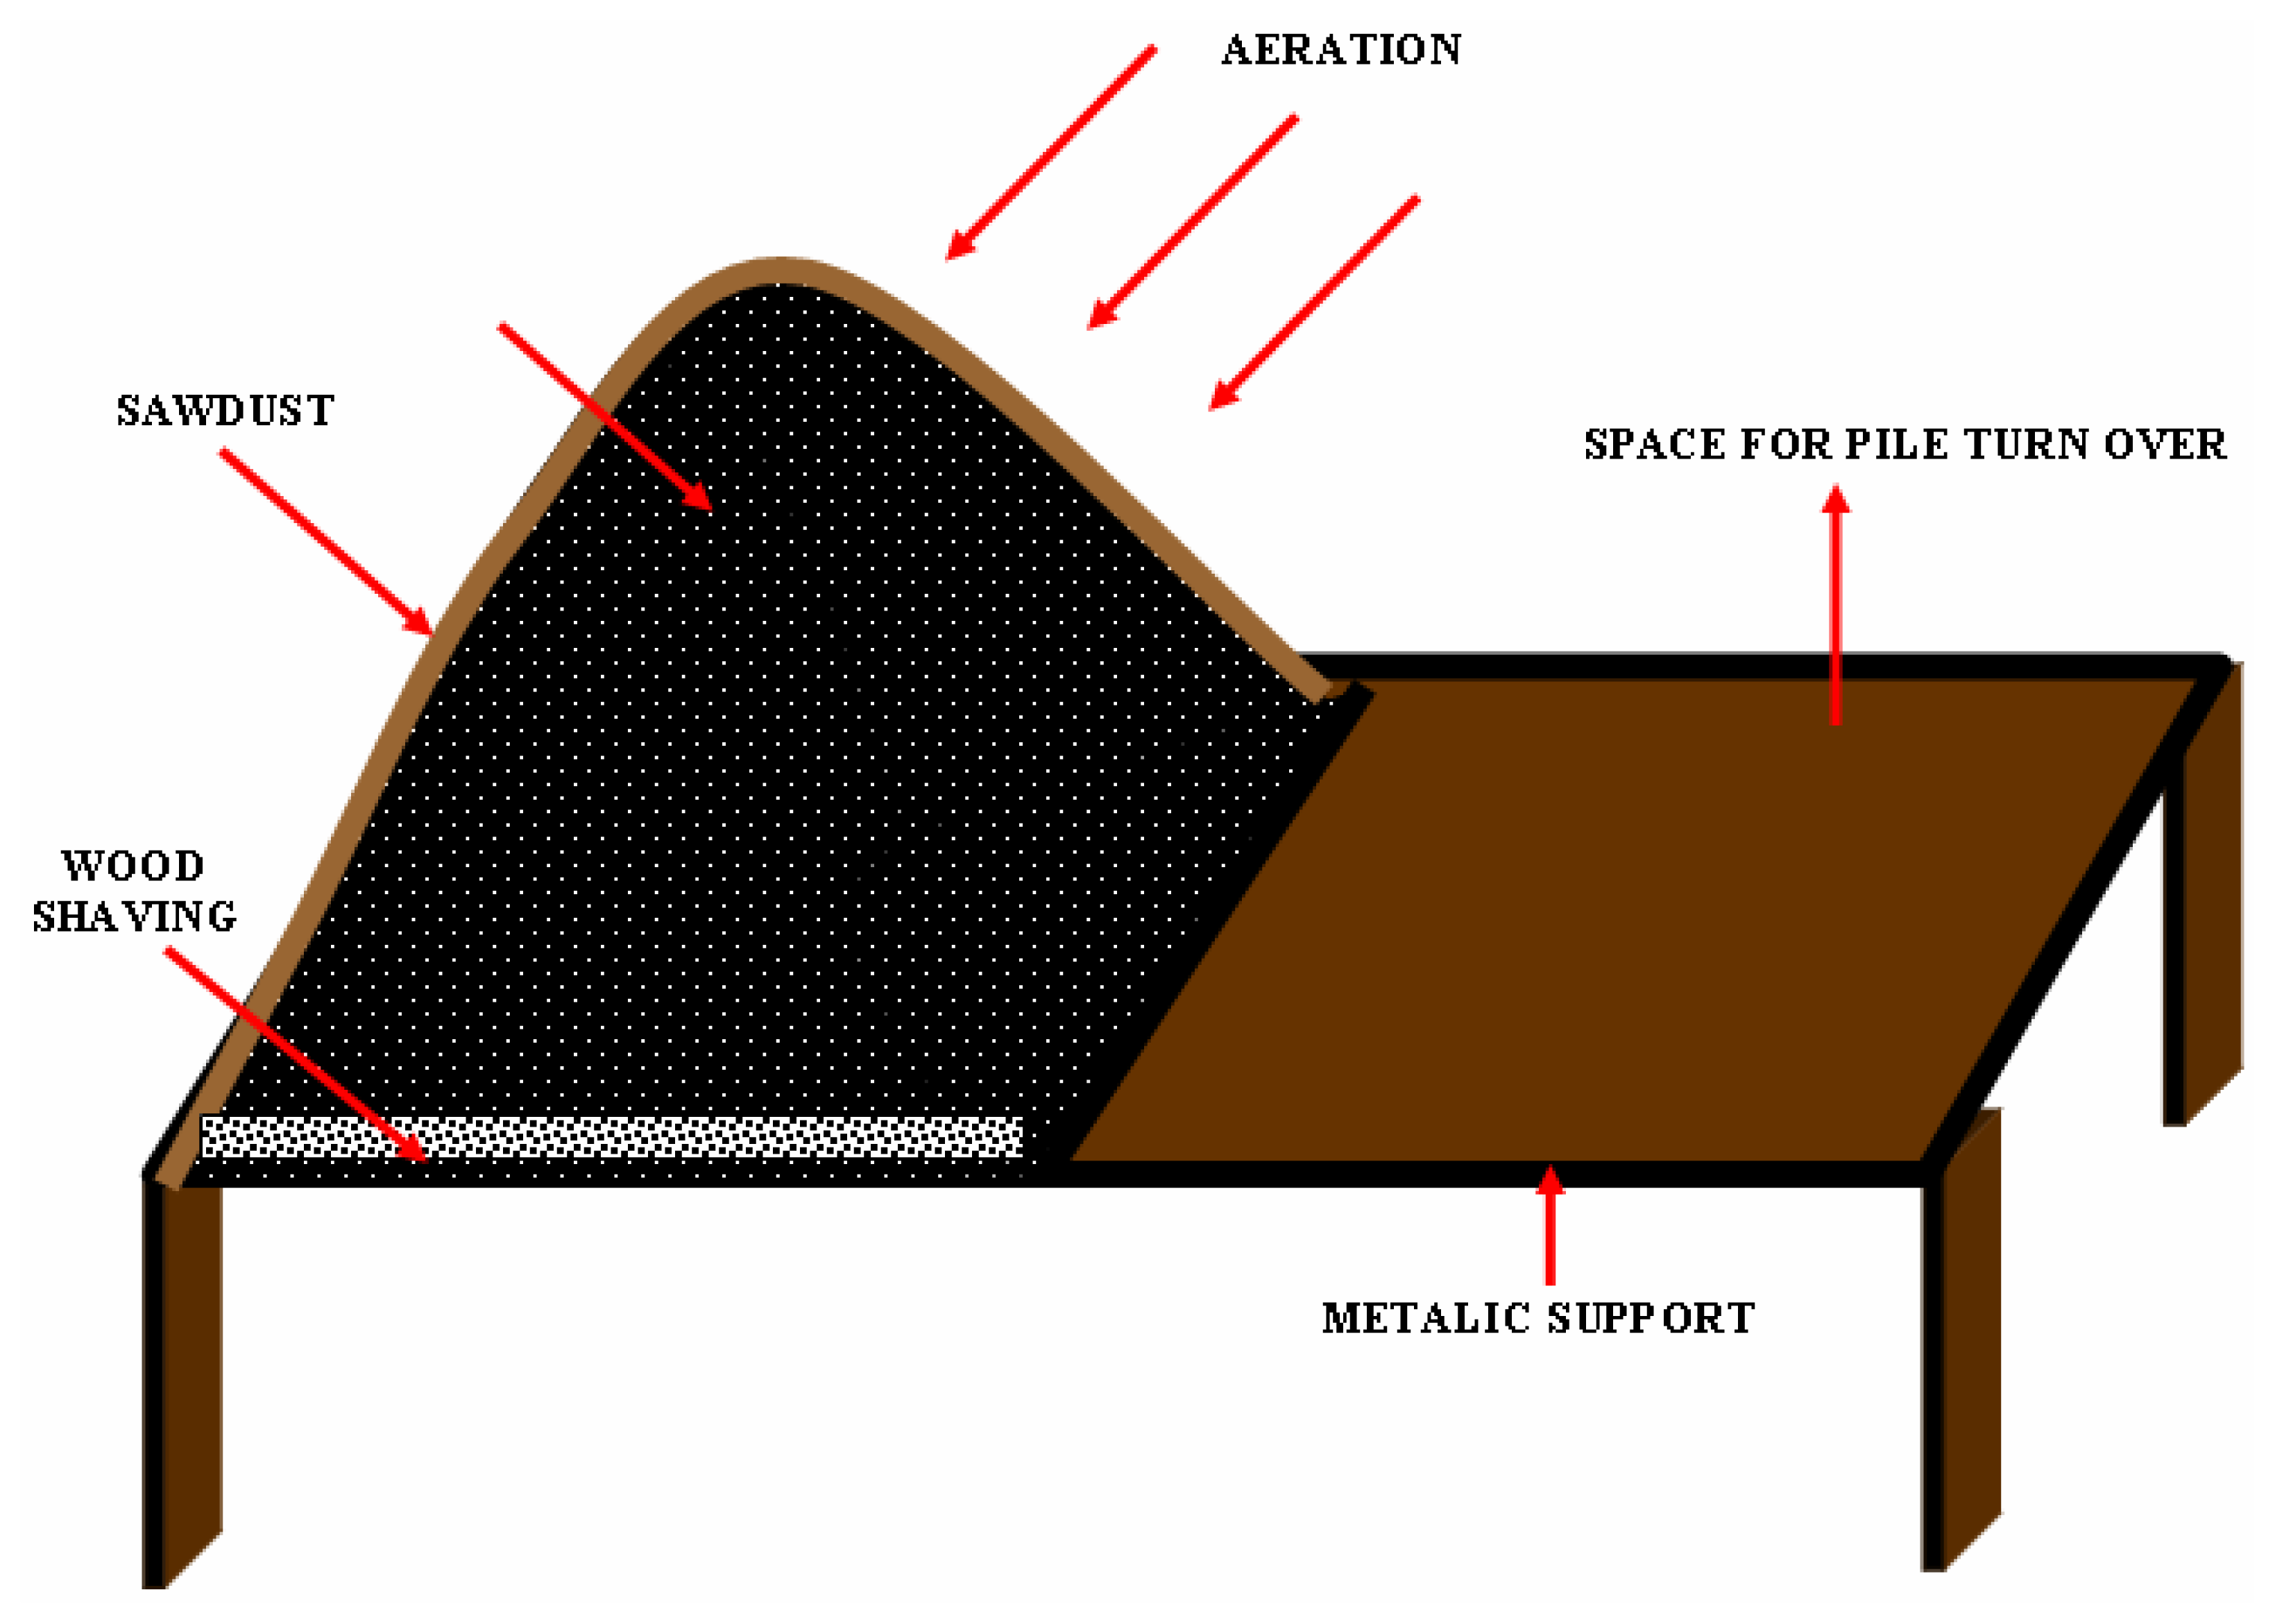
Fig. 1. The organic manure is high in nitrogen and is used for the adjustment of carbon/nitrogen ratio. Urea and superphosphate were also added to maintain the initial C/N ratio in setting up of the pile. Saw dust is used as a bulking agent to increase the porosity of the mixture. The sediment was mixed with the organic amendment to maintain the total solids content between 35 – 45% and then homogenized. The aeration was given through natural ventilation and by turning over the piles at an interval of 7 days. The piles were protected with a layer of sawdust and straw on the surface to avoid odors and influence from wind.
Composting
The composting process lasted for a period of 14 weeks, including four stages such as the initial phase, the thermophilic phase, end of thermophilic phase and the mesophilic phase. The sludge – conditioner mixture was placed on a bed of wire mesh, at an altitude of 30 cm. The material was spread on a layer of wood shavings, which was covered with a layer of sawdust and straw. The moisture content was initially adjusted to 55% and later there was no addition of water. Once the pile was set up, the decomposition of the organic matter by thermophillic microorganisms started, which elevated the temperature to 58° C, causing the destruction of the pathogens. The aerobic conditions were assured by aeration through turning. Thermophillic phase remained for a period of 50 days in the pile. Within a period of 14 weeks, complete stability of the compost and the removal of odors were assured. The mixtures were then kept for another 6 weeks for maturation. All the parameters were assessed for this matured compost. Sifting was done to matured compost to separate the conditioning material and to obtain a homogenous product. Samples from composting mixtures were analyzed once every 7 days. A representative sample was taken by picking up material from different points of the two piles.
Analytical Methods
All the parameters such as moisture content, electrical conductivity, pH, organic matter, and nitrate nitrogen were estimated using standard APHA methods [
15]. Total Kjeldahl nitrogen and ammonical nitrogen were analysed using Kjeldahl assembly (Kjel Plus DISTILL M KPS 020, India), the oxidizable carbon (Co) was determined by oxidimetric method the ash content by gravimetric method after burning off the dry mass at 550° C [
16]. In the water extracts (compost/water ratio of 1:10) the water soluble forms of carbon (Cw) and nitrogen (Nw) were determined. Total phosphorous (ascorbic acid method) and cation exchange capacity (CEC) was determined according to the method described by Gupta [
17].
Humic Substances
Humic acids, Fulvic acids and non humic fraction were estimated by the method as described by Hsu and Lo [
18]. Humification index (HI), i.e., the ratio between Humic acids and fulvic acids is deduced from the equation:
Water-Soluble Carbon (Cw)
20 gms of compost was weighed and extracted with 200ml of deionized water by shaking for 24 hrs. The extracts were centrifuged at 10,000 RPM for 25 mins and filtered through 0.45-μm filter membranes (mdi, India). Water extracts are immediately analysed for organic carbon [
18].
Enzyme Assay and Measurement
Assays of hydrolases (β-Glucosidase, BAA-Hydrolyzing Protease, Urease and Phosphatase) and dehydrogenase activities were performed as described by Garcia et al., [
19,
20]. Dehydrogenase assay was based on the combination of two methods [
21,
22]. To determine β-Glucosidase activity 0.05 M 4-nitrophenyl-β-D- gluconopyranoside (PNG) was used as substrate [
23] while,0.115 M p-nitrophenyl-phosphate (PNPP) was used as substrate to measure the phosphatase activity. The para-nitrophenol (PNP) produced by both hydrolases was extracted and determined spectrophotometrically at 398 nm. [
24]. To determine the BAA-hydrolysing Protease and Urease activities, 0.03 M N-α-Benzoyl-L-Argininamide (BAA) and 6.4% urea, respectively were used as substrates. The ammonium released by the two hydrolytic reactions was measured by an ammonium selective electrode (ORION, Model.95–12). To determine dehydrogenase activity, 0.4% 2-p-iodophenyl-3-p-nitrophenyl-5-tetrazolium chloride (INT) was used as substrate. Iodonitrotetrazolium formazan (INTF) produced in the reduction of INT was measured spectrophotometrically at 490 nm.
Germination Index
The absence of phyto-inhibitory substances that reflect maturity of compost was tested by seed germination. Germination tests were performed with garden cress (L
epidium sativum L.) Seeds were soaked in compost extracts in water (1: 10 w/v) for 48 h.
Lepidium sativum seeds were used because of their rapid germination and sensitivity to phytotoxic compounds [
25]. The germination index, inversely related to the presence of phytotoxic substances in compost, was calculated as the percentage of seeds germinated on filter paper in Petri dishes with 10 ml of compost extract multiplied by the average length of roots in mm expressed as percentage of a control with distilled water [
26]. The percentages of relative seed germination, relative root elongation and germination index (GI) are calculated by the following formula:
Results and Discussion
The physico chemical analysis of the manure and saw dust and sediments from two different strata used in the present study are presented in
Table 2 and
Table 3 respectively. A representative sample was taken by picking up material from different points of the two piles.
Temperature, Moisture Content, Ph & Electrical Conductivity
The temperature variation during composting followed a pattern similar to many other composting systems [
27,
28]. In Pile 1 the temperature rised only upto 46° because of the presence of highly toxic compounds and thus low microbial activity while in pile 2 there was a steep increase in temperature up to 58° due to the availability of comparatively more degradable organic matter and hence intense microbial activity. The thermophillic phase lasted for nearly 7 weeks. After this period of elevation the temperature gradually decreased to ambient levels and this marked the end of the thermophilic phase of composting. At this stage the decomposition rate stabilized with a consequent decrease in temperature and microbial activities.
During composting the moisture content of the piles decreased which is due to the evaporation of water as a consequence of turning the piles and microbial heat generation. The continuous decrease in moisture content during composting is an indication of organic matter decomposition [
29]. The moisture content in Pile 1 decreased up to 42% while that in Pile 2 decreased to 30%. The intense microbial activity and organic matter degradation during the first weeks of thermophilic phase led to the formation of ammonia as a consequence of ammonification of organic nitrogen. The solubilzation of ammonia led to the formation of ammonium and an increase in the pH values in the composting mixtures from an initial of 6.8 to 7.6 in pile 1 and from 6.7 to 8.2 in pile 2. Electrical conductivity increased due to the concentration of the salts because of degradation of organic matter [
51]. Production of Nitrate-N also explains the increase in conductivity of the composting mixtures. This is important from an agricultural point of view since an increase in electrical conductivity is a direct consequence of the increased concentration of nutrients, such as nitrate.
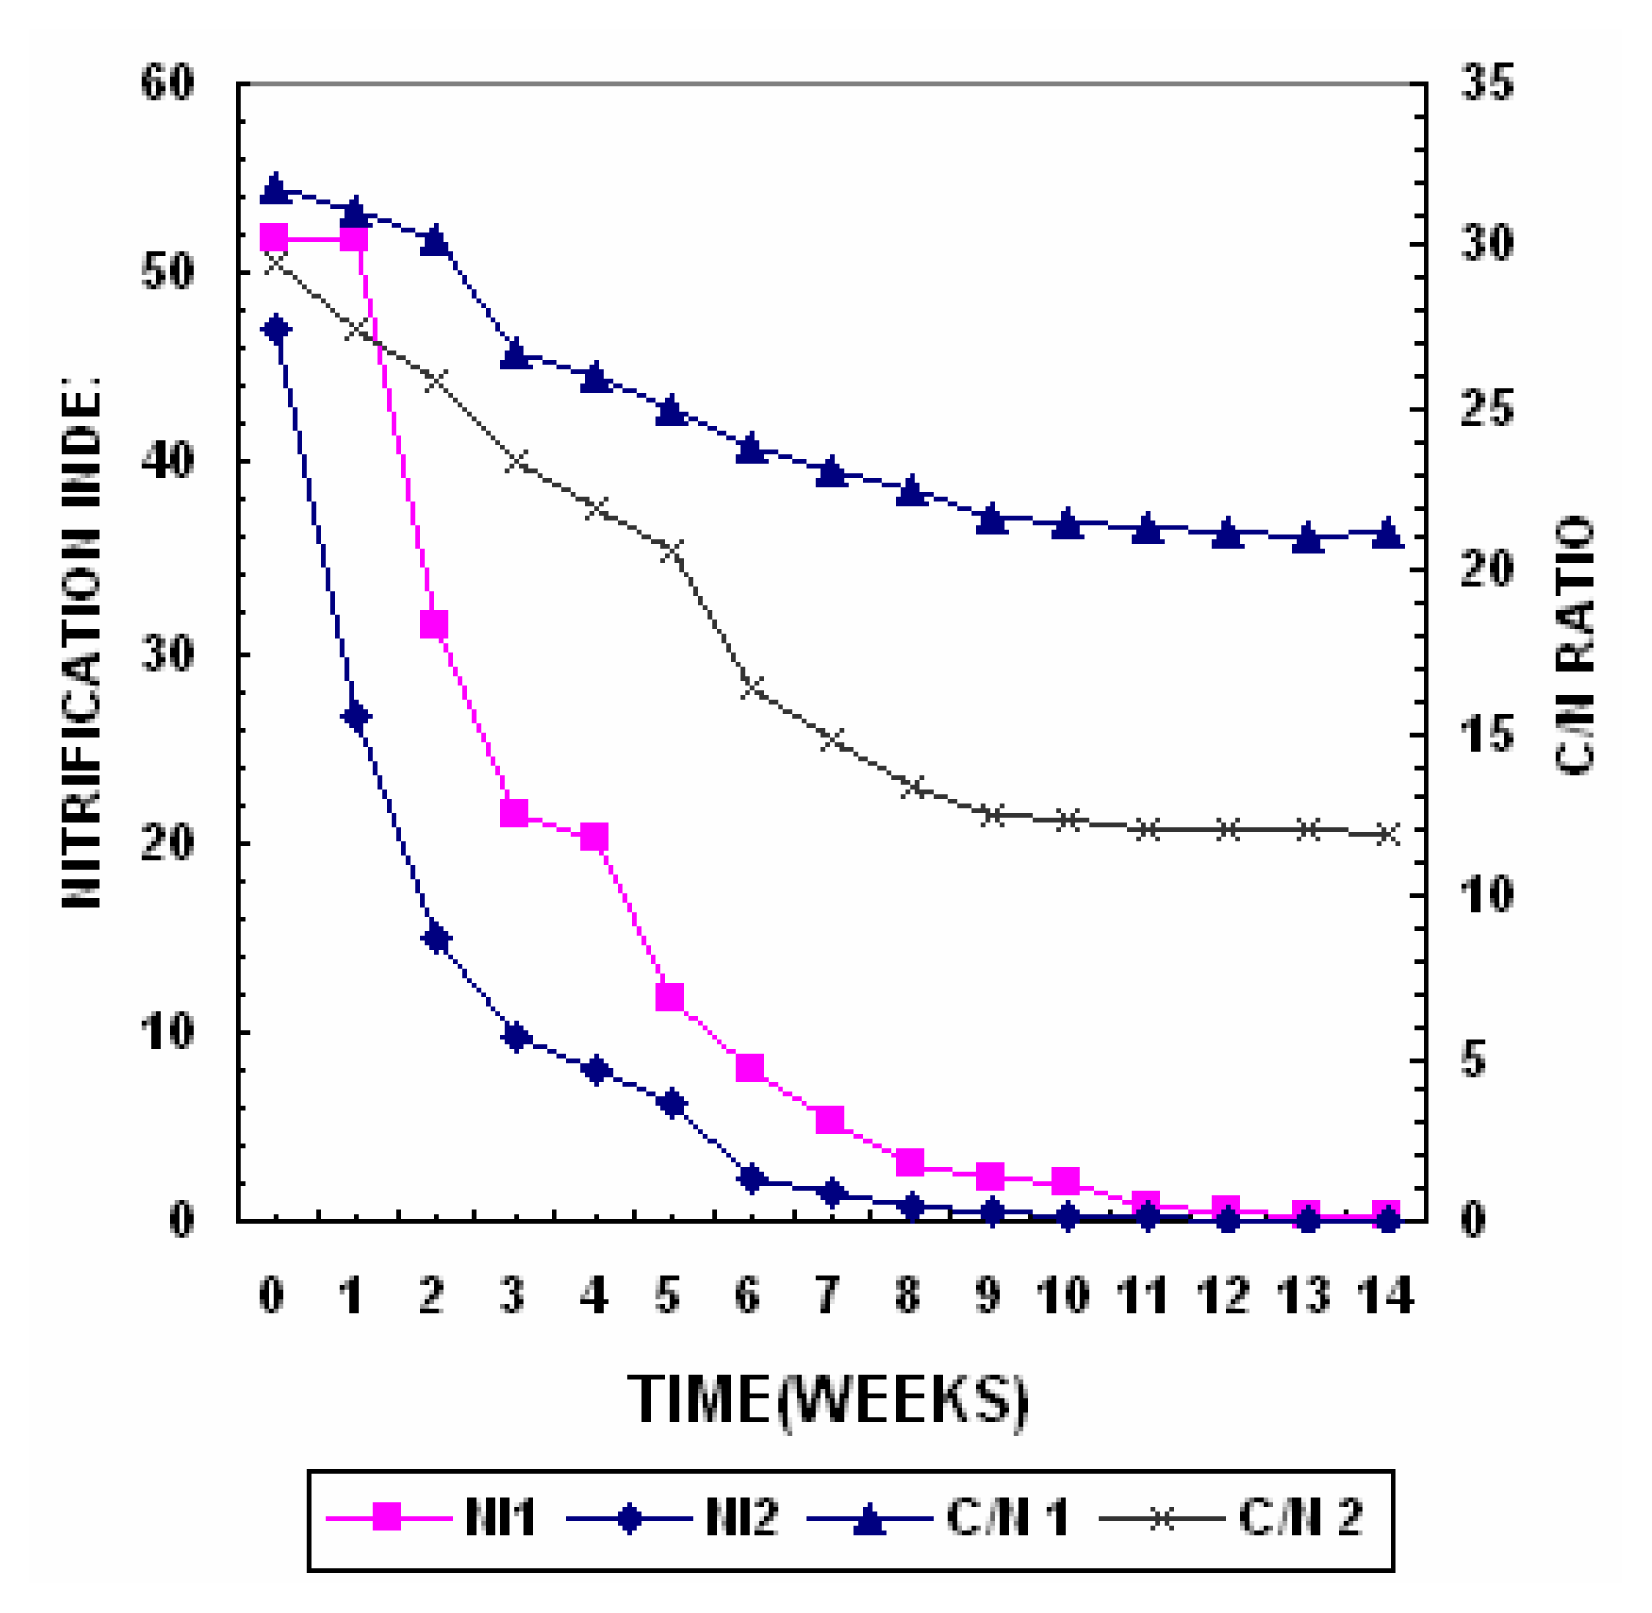
Changes in the Carbon/Nitrogen Ratio & Compost Mineralization Index
The changes in the C/N ratio reflect organic matter decomposition and stabilization during composting and are represented in
Figure 2. In the initial stage of composting intense mineralization processes takes place which is manifested by a considerable decrease in carbon and increase in ash content in both the piles, the C/N ratio decreased due to the mineralization of the organic matter [
30]. The total nitrogen content increased during composting from an initial of 1.6% to 1.75% in pile 1 and from 1.65% to 1.76% in Pile 2. These nitrogen increases are probably due to a concentration effect caused by the decrease of the substrate carbon resulting from CO
2 lost [
31] as a consequence of the degradation of non-nitrogenous organic matter (Carbohydrates etc.).
The organic carbon concentration in Pile 2 degraded much more intensely during the thermophillic phase of composting due to greater activity of the micro organisms and the presence of easily degradable substances. After 14 weeks of composting the organic matter in Piles 1 and 2 decreased from 48.9% to 34% and from 48% to 21% respectively. The C/N ratio decreased due to the mineralization of the organic matter. In pile 1 the Carbon/Nitrogen decreased from an initial value of 30.5 to 19.4 at the end of the process while for the same period of time in pile 2 the initial carbon/nitrogen ratio decreased from 29.5 to 11.9. According to [
32] a Carbon/Nitrogen in the range of 10–15 of the compost indicates a good degree of maturity.
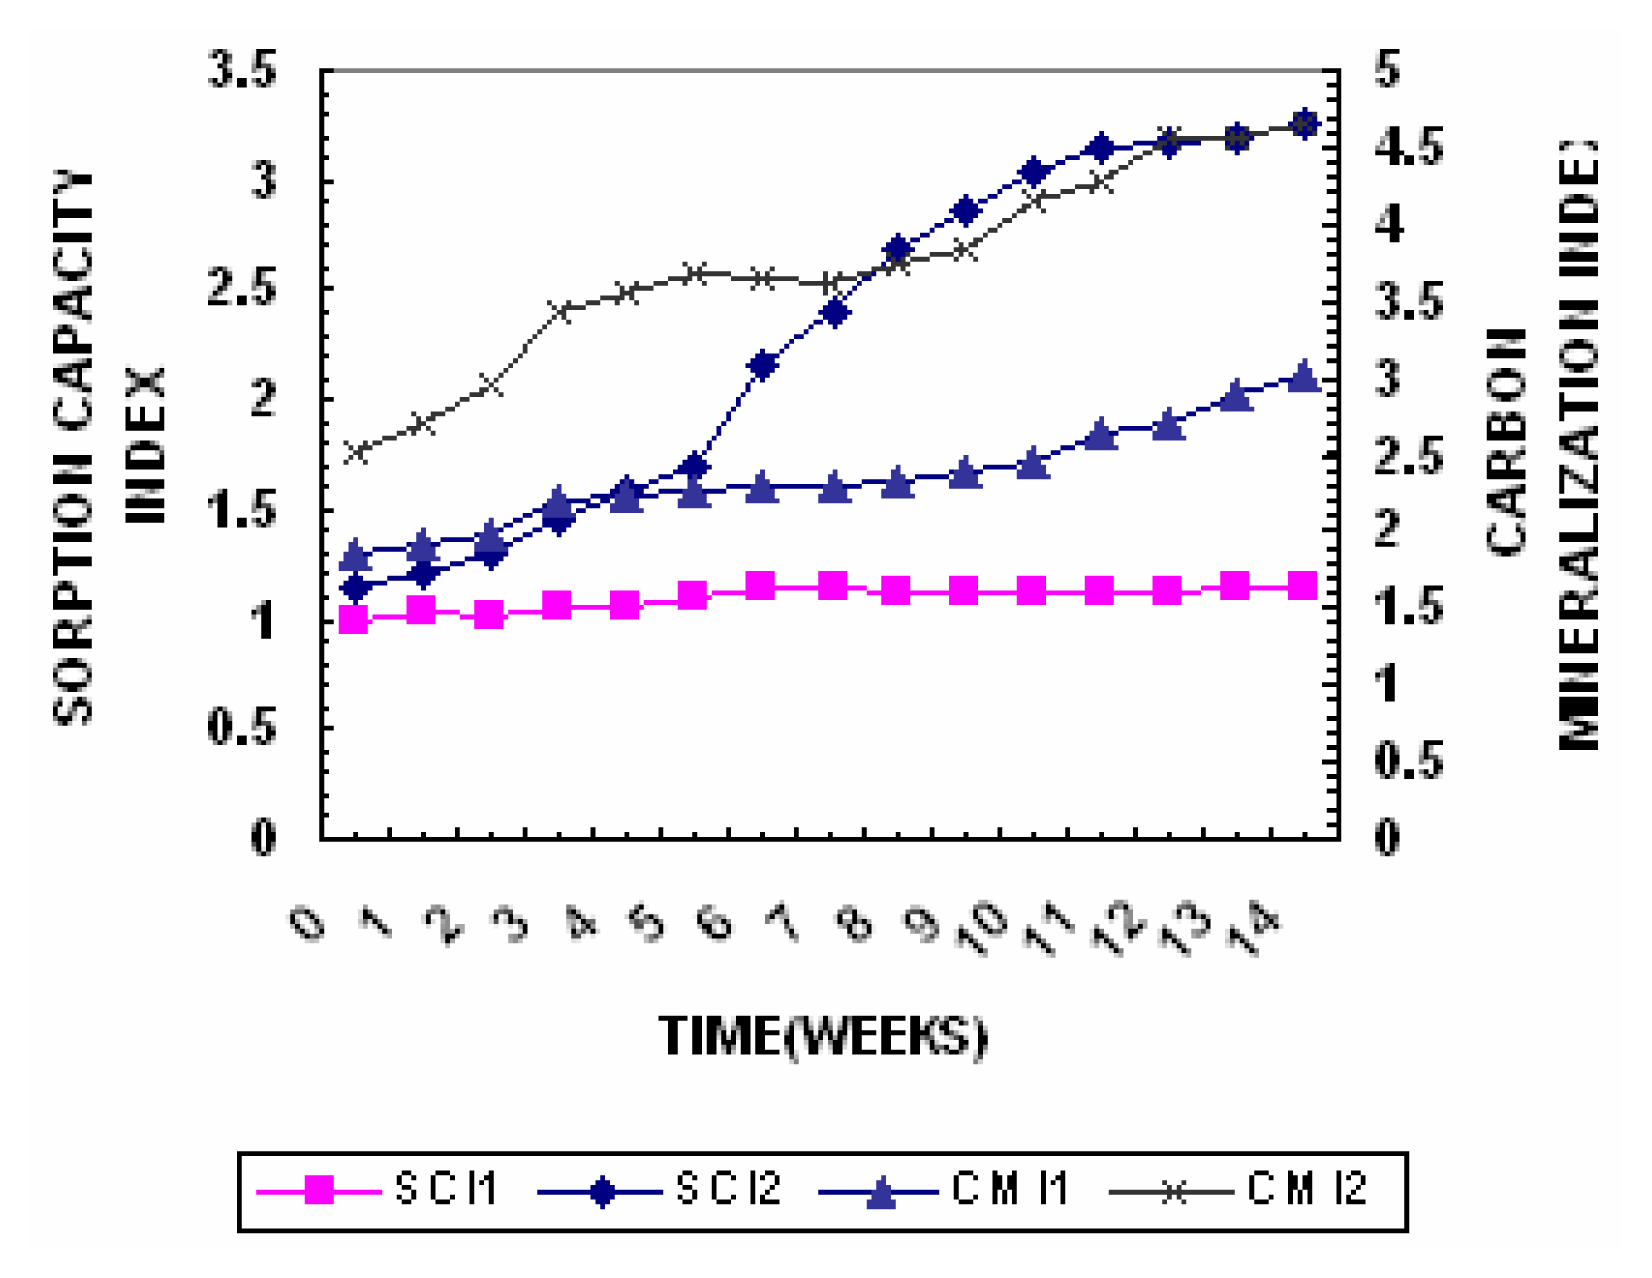
The compost mineralization index is expressed as Ash content/Oxidizable Carbon. The changes in Compost Mineralization Index are represented in
Figure 5. In the initial stage of composting (about 7 weeks) the intense mineralization process takes place, which is manifested by a considerable decrease in carbon and increase in ash content. In Pile 1 the ash content increased from 45.1% to 52.8% and the oxidizable carbon decreased from 19.5% to 16.2% the compost mineralization index increased from 1.85 to 3.01. The ash content in Pile 2 increased from 49.4% to 61.9% and the oxidizable carbon decrease from 20.4% to 14.1% and the compost mineralization index increased from 2.5 to 4.65.
Nitrification Index
The nitrification process has been used as maturity index of composting [
33]. The changes in Nitrification Index expressed as NO3
− -N/NH
4+ -N during the composting process is presented in
Figure 2. The NH
4+ - N content in pile 2 increased from 658 mg/kg to 725 mg/kg during the thermophilic phase. This increase could be due to conversion of organic N to NH
4+ -N via the ammonification process and then the NH
4+ - N content decreased to 144 mg/kg towards the end of maturation phase. A similar trend was observed by [
34,
35]. This decreasing trend guaranteed that ammonification was ending and can be used as a criterion of compost maturity [
36]. The ammonia produced during the thermophilic phase is oxidized to NO
3− -N and thus the concentration of ammonia decreases with the increase in NO
3− -N. In Pile 1 the increase in ammonical nitrogen was not very significant and so was the decrease. The NO
2 concentration was negligible in both the piles, indicating that aerobic conditions prevailed during the composting process.
Appreciable amounts of NO
3− - N could be observed in Pile 2 the values increased from 0.01% to 4.5%, which were reached after maturation. A NH
4+/NO
3− ratio in favour of the oxidized form is considered desirable for mature compost. In Pile 1 the NH
4+/NO
3− ratio was 0.28 while in Pile 2 the ratio was 0.03 towards the end of composting. At the end of the process the concentration of nitrates should be higher than that of ammonium indicating that the process has been prepared under adequate conditions of aeration [
29]. Due to the presence of highly toxic organics in Pile 1 there was low mineralization of organic nitrogen which in turn resulted in low ammonia evolution whereas in Pile 2 low concentration of organics resulted I higher nitrogen mineralization and hence higher ammonia evolution A high concentration of NH
4- N in compost indicates instability and according to Zucconi & Bertoldi [
12] it should not exceed 0.04% in mature compost [
33] established a limit a 0.16 as a ratio between ammonium nitrogen and nitric nitrogen as an index of maturity in composts.
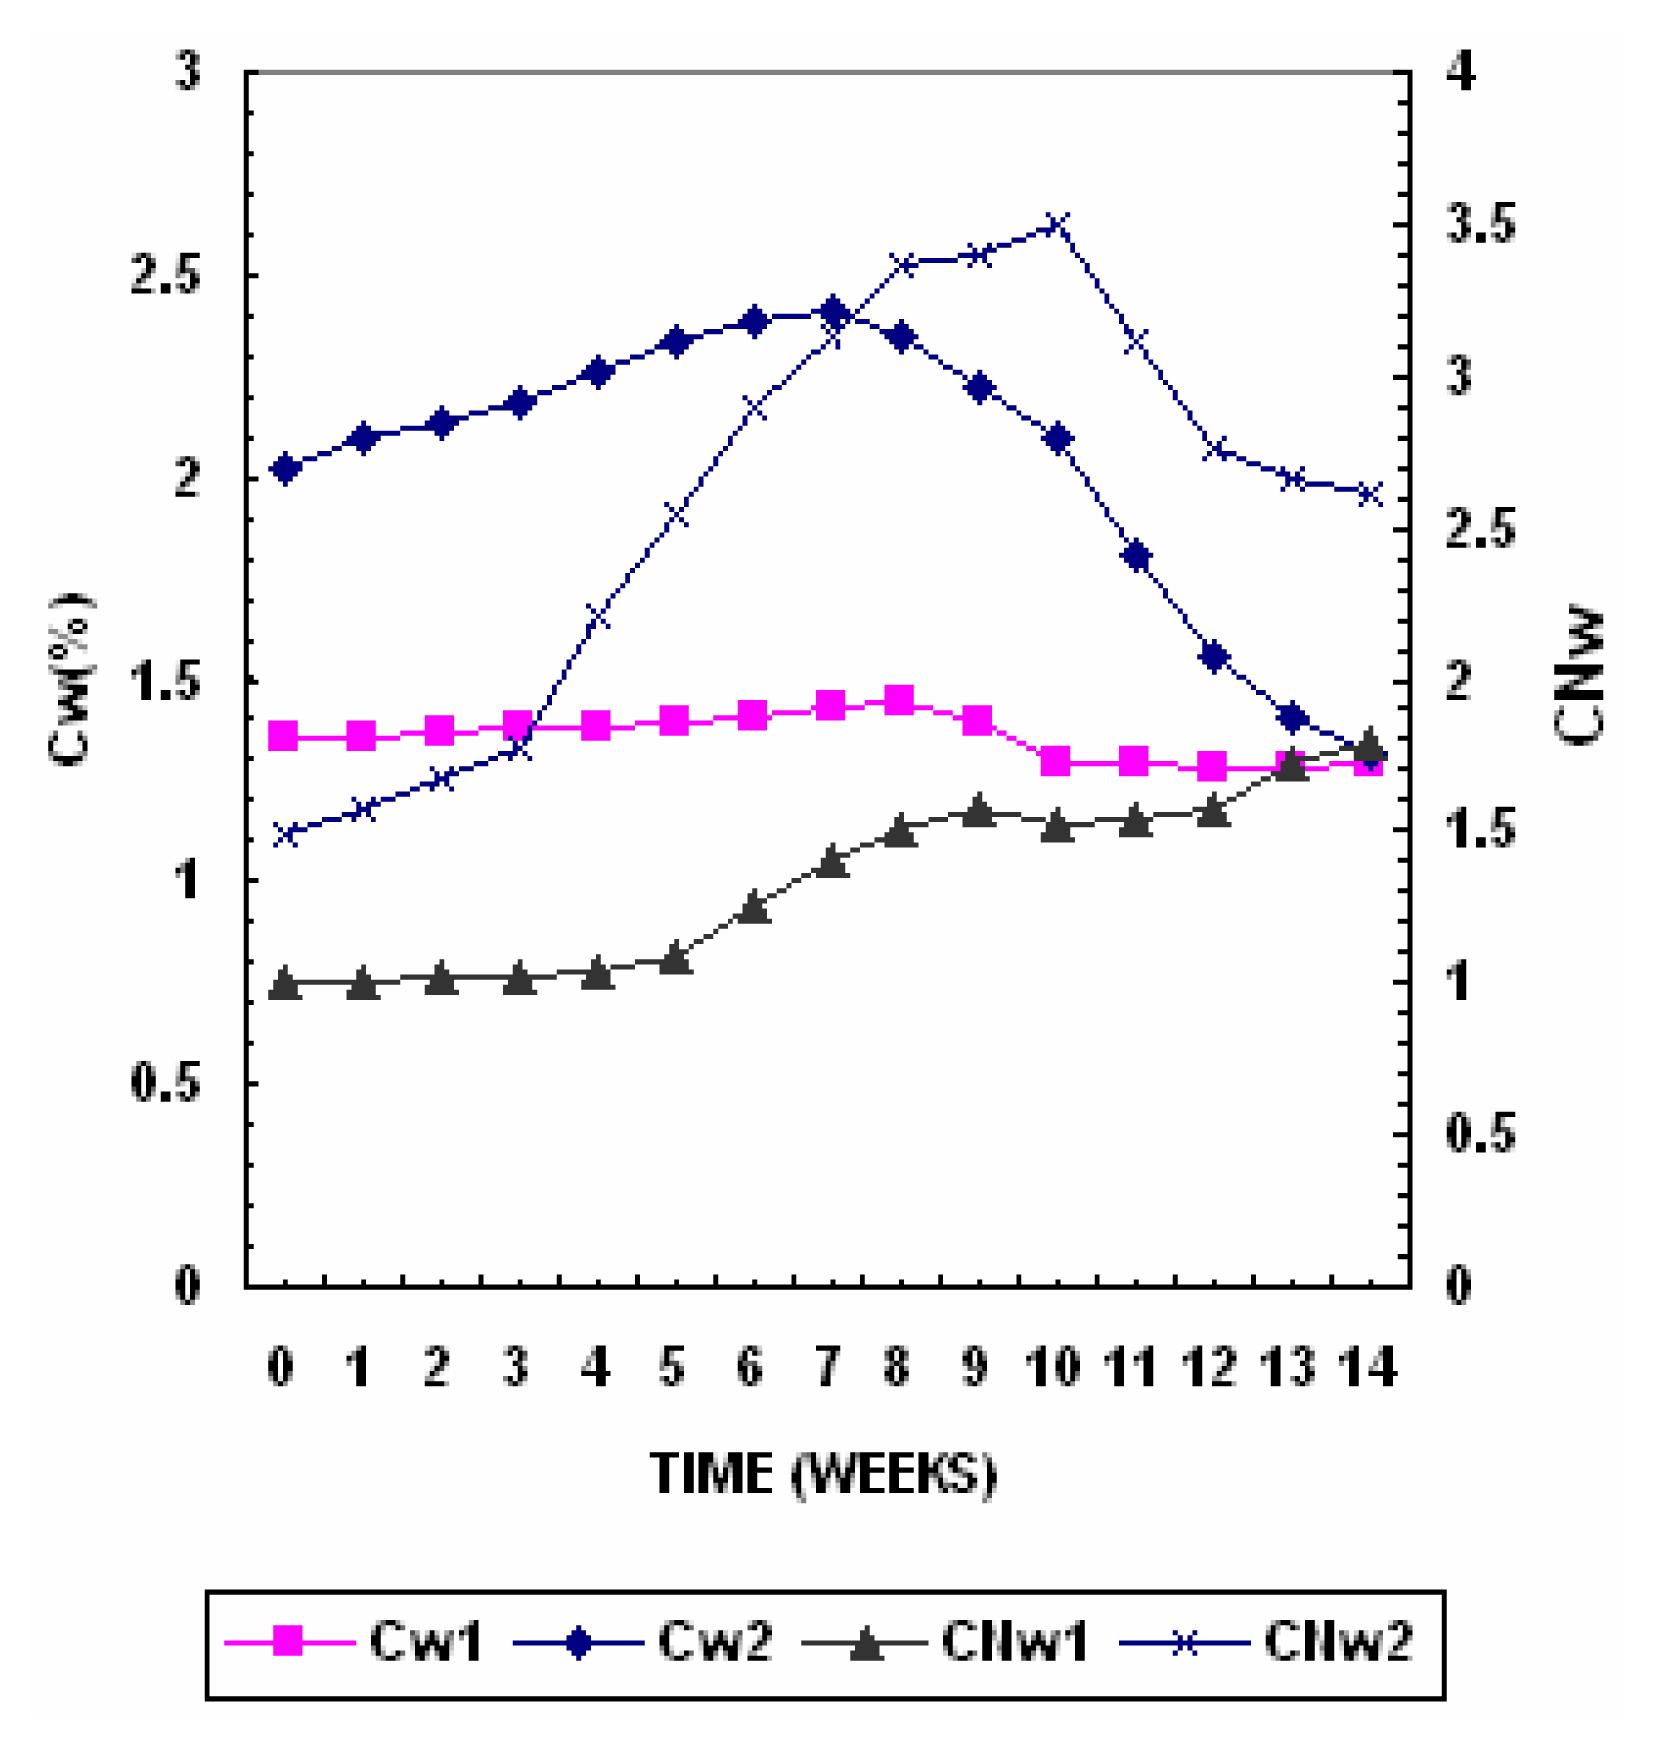
Water Soluble Carbon (Cw)
The water-soluble carbon variation with composting time is presented in
Figure 3. Water–soluble organic carbon is the most readily biologically active compound in composts applied to soils. Water-soluble organic carbon level in Pile 1 gradually increased from 1.35% to 1.44% in the 7
th week and then gradually decreased to 1.29% towards the end. While in Pile 2 the water-soluble organic carbon level gradually increased from 2.02% to 2.41% in the 7
th week and then gradually decreased to 1.32% towards the maturation phase. As carbon component that are easily available to microbes organic and amino acids, proteins were degraded during the thermophillic stage of the decomposition, breakdown products were continuously released resulting in an increase in water-soluble carbon [
18]. A decline in water-soluble carbon is often used as an indicator of compost maturity [
37]. In matured compost most of the soluble organic carbon is present as humic substances, which are resistant to further decomposition, thus explaining its increased stability observed with time during composting. A limit of C
w < 1.7% can be used to reflect a good maturation degree. [
33].
CNw (Water soluble)
The water-soluble carbon and nitrogen index is presented in
Figure 3. Water-soluble organic carbon level in Pile 1 gradually decreased by about 4.4% while in Pile 2 the decrease was 34.6%. The easily biodegradable carbon components that are highly available to microbes were degraded during the thermophillic stage of the decomposition, and the breakdown products were continuously released resulting in an increase in water-soluble carbon [
18]. During composting the total nitrogen content increases with simultaneous decrease of its solubility in water (Nw) and towards the maturation phase the amount of mineral water soluble forms of nitrogen increased. [
16]. In Pile 1 the Nw decrease form 13.5% to 7.2% and in Pile 2 the decrease was form 13.5% to 5.0%. The CN
w increased from 0.99 to 1,7 in Pile 1 while in Pile 2 the CN
w increased from 1.4 to 2.6 at the end of composting period.
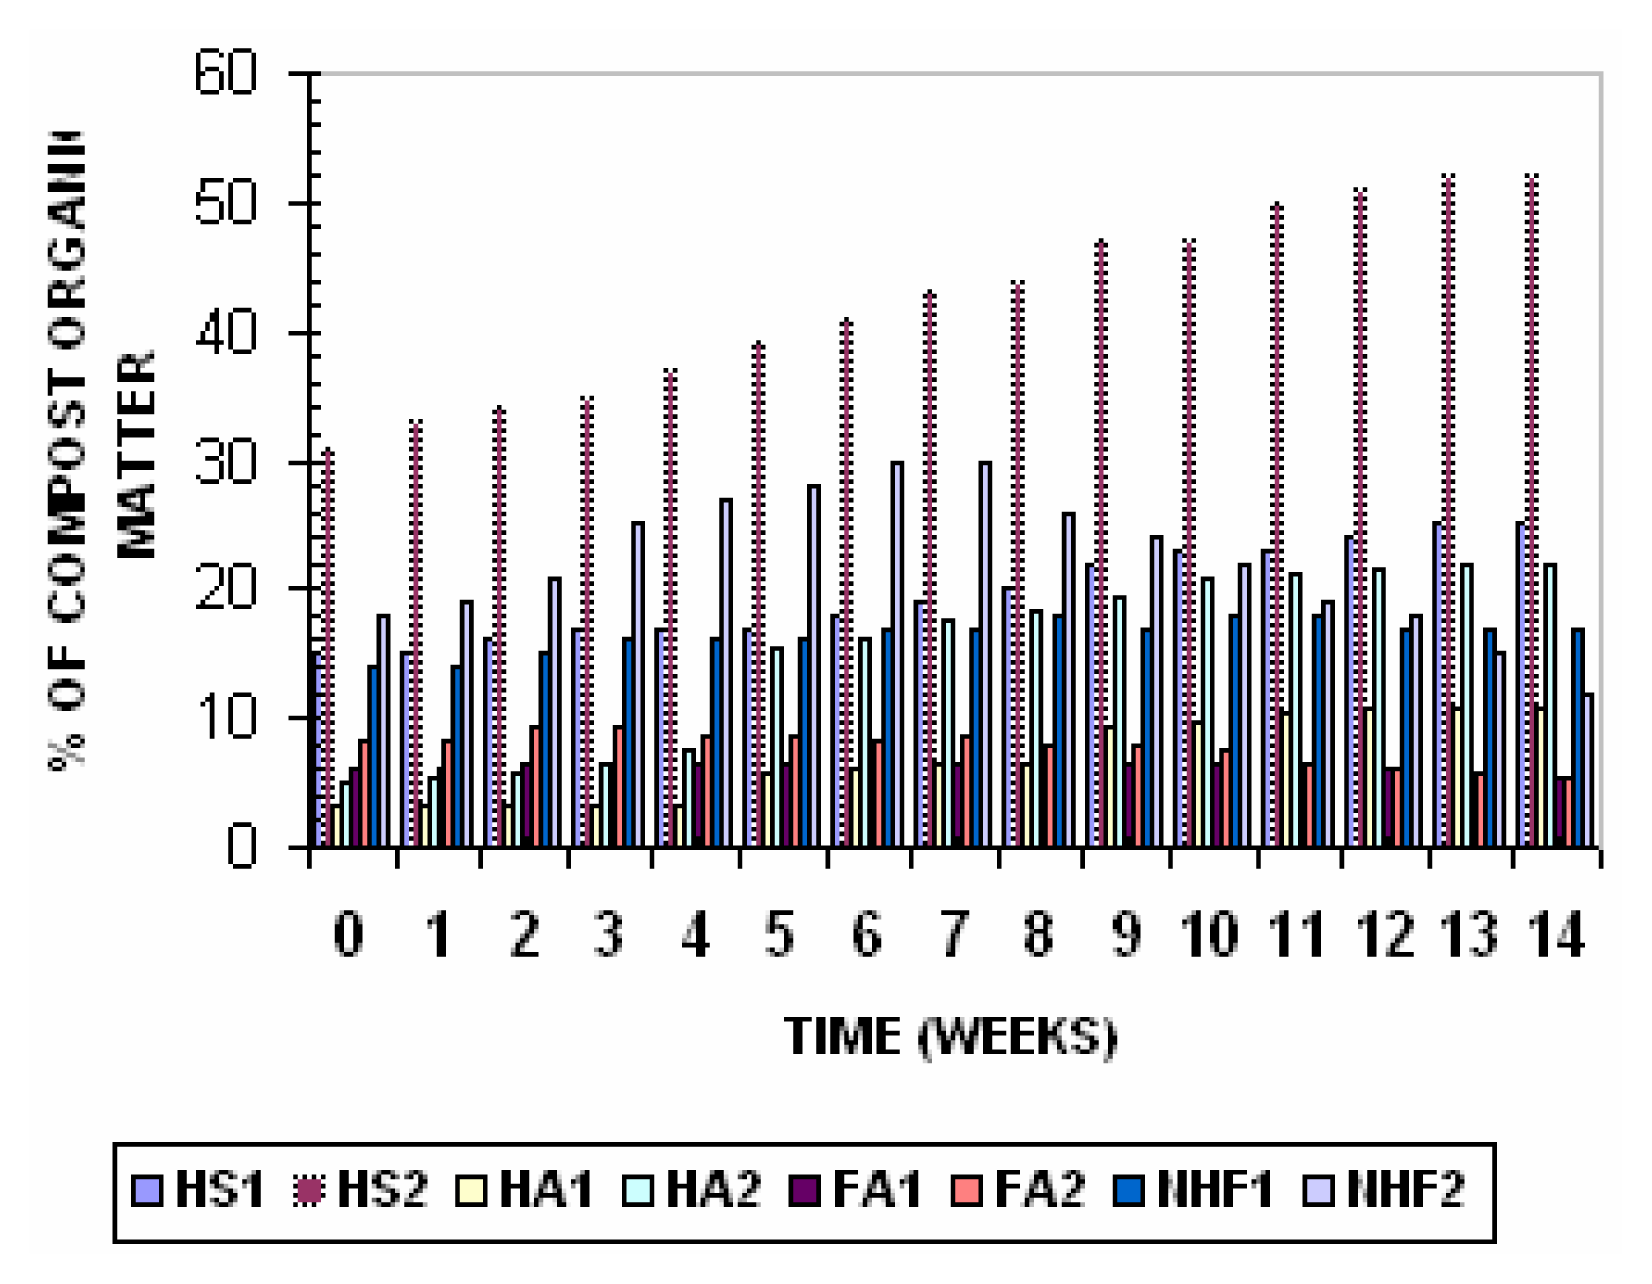
Humic Substance Content
Humic substances comprise the most important fraction of organic matter because of their unique properties, such as the capacity to interact with metal ions, the ability to buffer pH, and the ability to act as a potential source of nutrients for plants [
18]. The relative contents of humic substances and non-humic substances during composting are presented in
Figure 4. The quantities of Humic acids, Fulvic acids and non-humic fraction in composting mixture at various stages of the composting process represent the humification process.
In Pile 1 total humic substances increased from 15% of organic matter to 25% of organic matter after 7 weeks, stabilizing at this value till the end of the process. The fulvic acid level gradually decreased from 6.1% of organic matter to 5.4% in mature compost. The humic acid level increased from 3.2% to 10.8% in the mature compost.
In Pile 2 Total humic substances increased from 31% of organic matter to 52% of organic matter after 7 weeks, stabilizing at this value till the end of the process. The fulvic acid gradually decreased from 8.2% of organic matter to 5.4% in mature compost. The humic acids increased from 5.2 to 21.9% in the mature compost.
The increasing level of humic acids during composting process represents the humification and maturity of compost. In general, fresh composts contain low levels of humic acids and higher levels of fulvic acids [
10]. During composting humic acids increased, where as fulvic acids slightly decreased. The non humic fraction in Pile 1 increased rapidly from 14% to 17% but then did not decrease further due to low organic matter degradation. in Pile 2 non humic fraction increased rapidly from 18% to 30% of organic matter for the first 7 weeks of composting, and then decreased to 12% in the mature compost may be due to decomposition and humification of the break down products and presence of easily biodegradable organic matter during the maturation stage.
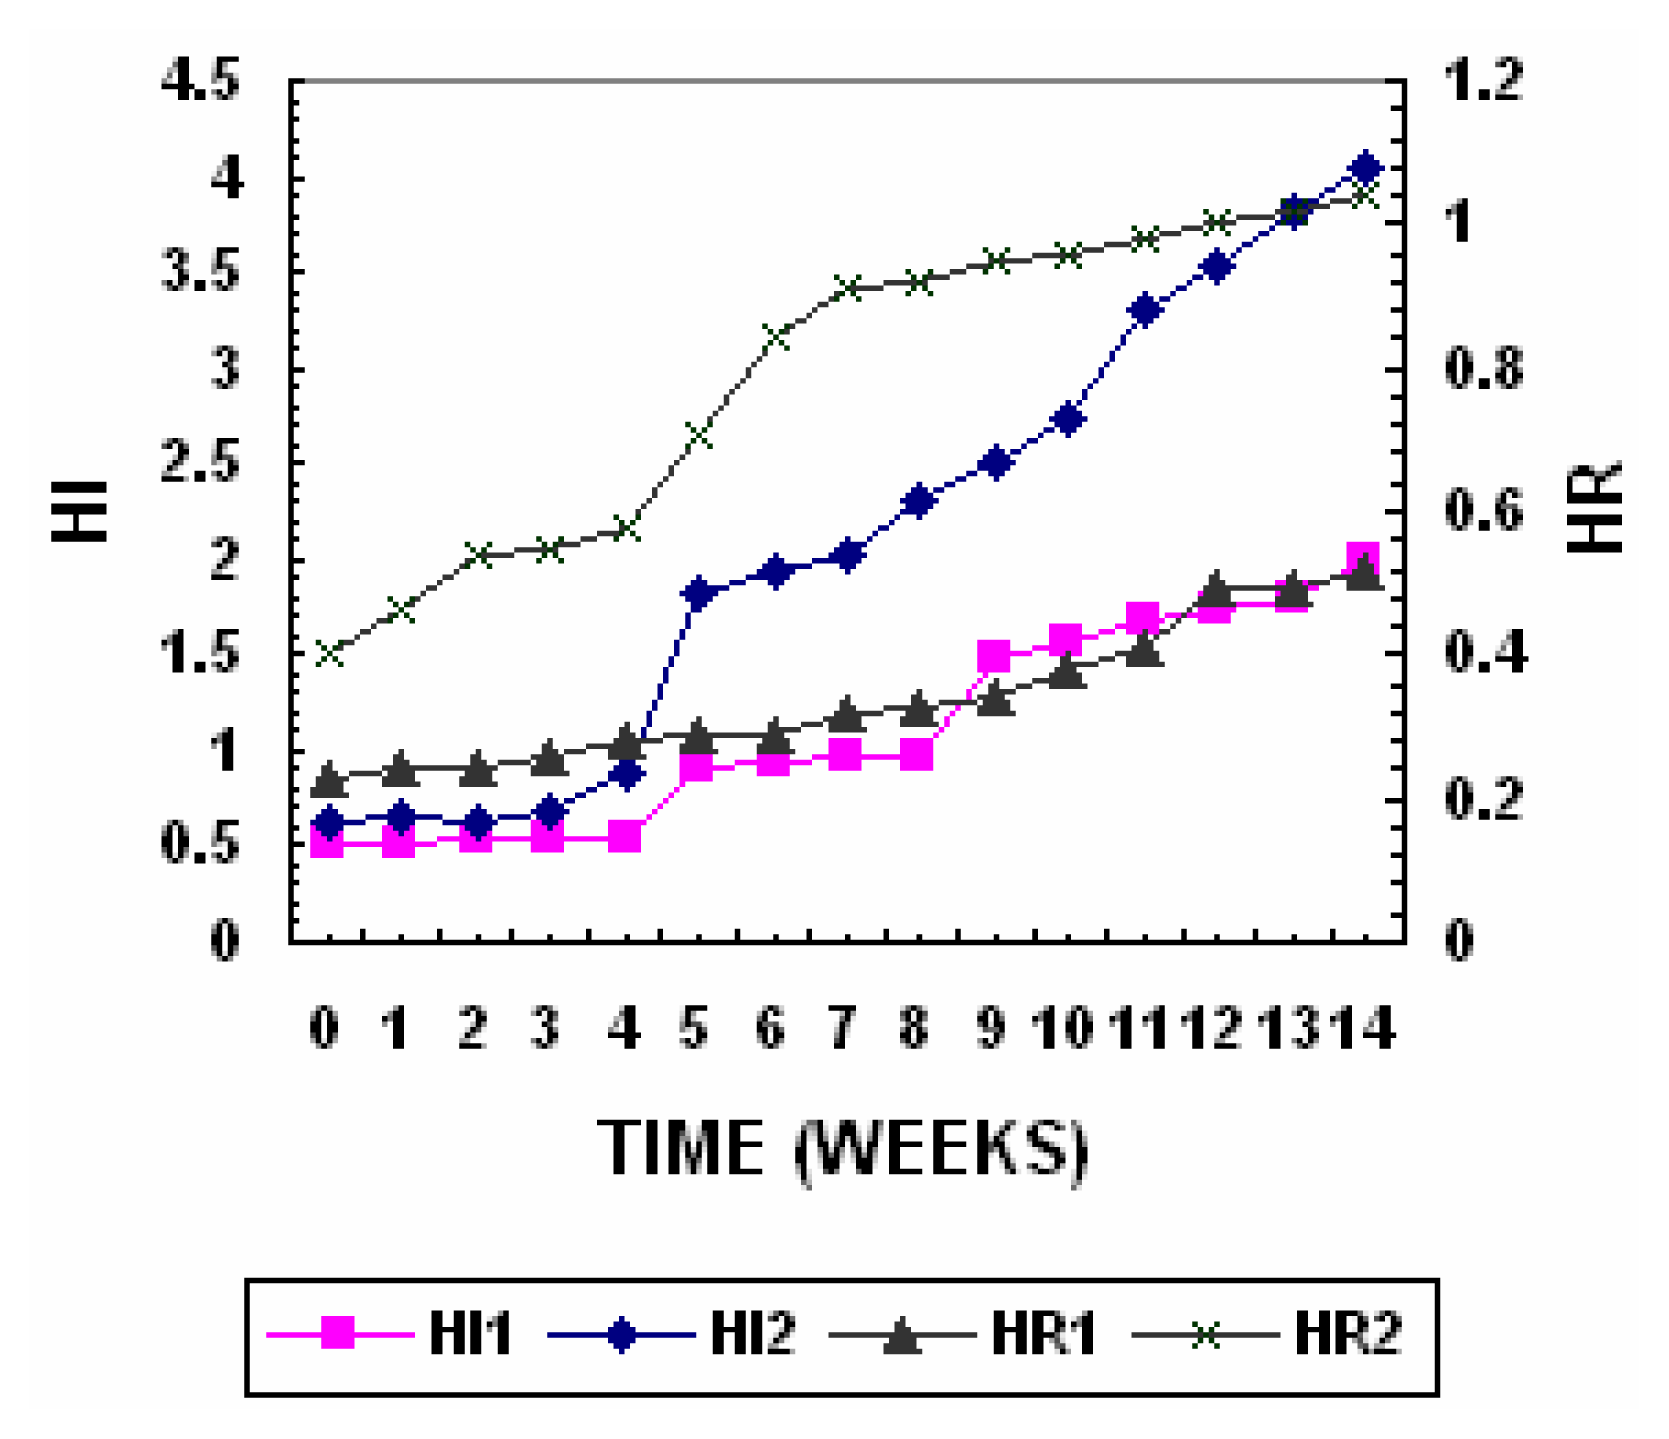
The Humification index and Humification ratio of the two piles are presented in
Figure 8. Humification index in Pile 1 remained steady at 0.6–0.7 for the first 4 weeks and increased sharply to 1.3 in the seventh week and slowly increased to a final value of 1.8 towards maturity of compost. Humification index in Pile 2 remained steady at 0.6–0.8 for the first 4 weeks and increased sharply to 1.8 in the seventh week and slowly increased to a final value of 4.0 towards maturity of compost. The changes in humification index reveal that Fulvic fraction and non humic fraction extracted from sediment contain relatively high levels of biodegradable organic matter that was mostly decomposed during first 7 weeks of composting. The humification ratio in Pile 1 increased from 0.29 to 0.94 while in Pile 2 it increased from 0.4 to 1.04.
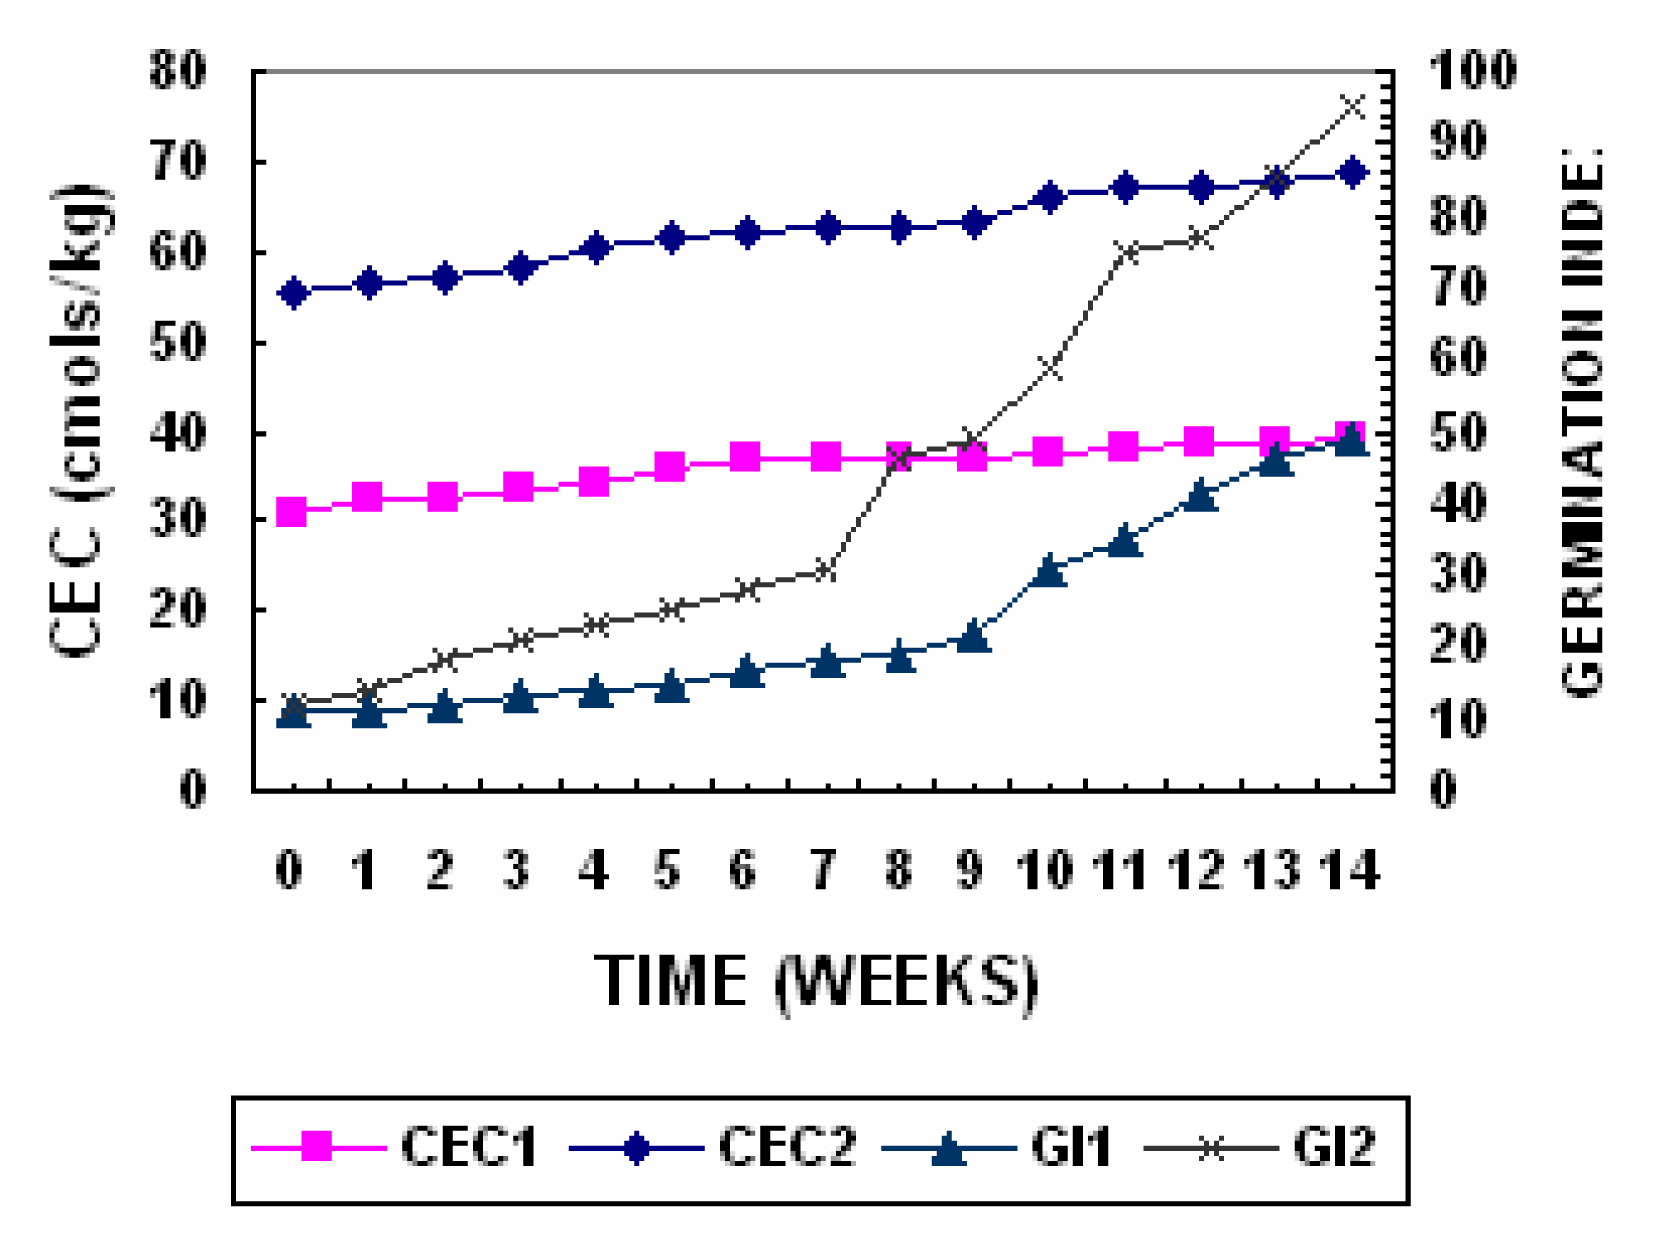
Cation Exchange Capacity & Sorption Capacity Index
One of the variables that are frequently determined to estimate the degree of transformation reached by compost during the process of composting is cation exchange capacity (CEC). The changes in cation exchange capacity are presented in
Figure 9. Its determination in an organic amendment is of great value because it allows us to know the stability degree of the amendment. Several studies accomplished with different kinds of compost have demonstrated that CEC increases with the stability degree of the compost. On the other hand, this parameter gives an indication of the amendment’s capacity for catching nutrients and immobilizing phytotoxic substances as well as for buffering unforeseen pH changes. The obtained results showed that the CEC increased from an initial value of 31cmol/kg
−1 to final values of 38.9cmol kg
−1 in Pile 1 while in Pile 2 the value increased from an initial value of 55.3 to 68.6 cmol kg
−1. The value in the Pile 2 was higher than the minimum recommended for mature compost (67 cmol kg
−1) thus indicating that the compost is mature [
11,
52].
The Cation Exchange Capacity/Corganic ratio reflects the degree of maturity of specific humic compounds and according to Inbar et al., [
38] it can be connected with the increase of the functional groups during humification process. The cation exchange capacity increases and organic carbon decreases with composting. The changes in Sorption Capacity Index are represented in
Figure 5. At the end of the active phase Pile 1 had a sorption capacity index of 1.1 while Pile 2 had a value of 3.2 which was greater than 1.7 the lowest limit for describing well humified manures [
11].
Germination Index (GI)
The GI values increased during the composting process due to decomposition of the phytotoxic organic compounds. The change in germination index is presented in
Figure 9. These phytotoxic compounds, which were present in raw waste or produced during the first days of composting as intermediate products of microbial metabolism, were degraded during the process, giving mature composts, which could safely be used with plants. The sample taken from the Piles 1 had GI a of 49 while Pile 2 had a GI of 95 which is greater than 80 and according to Zucconi et al., [
25] & Tiquia et al., [
39] indicates a phytotoxic-free compost.
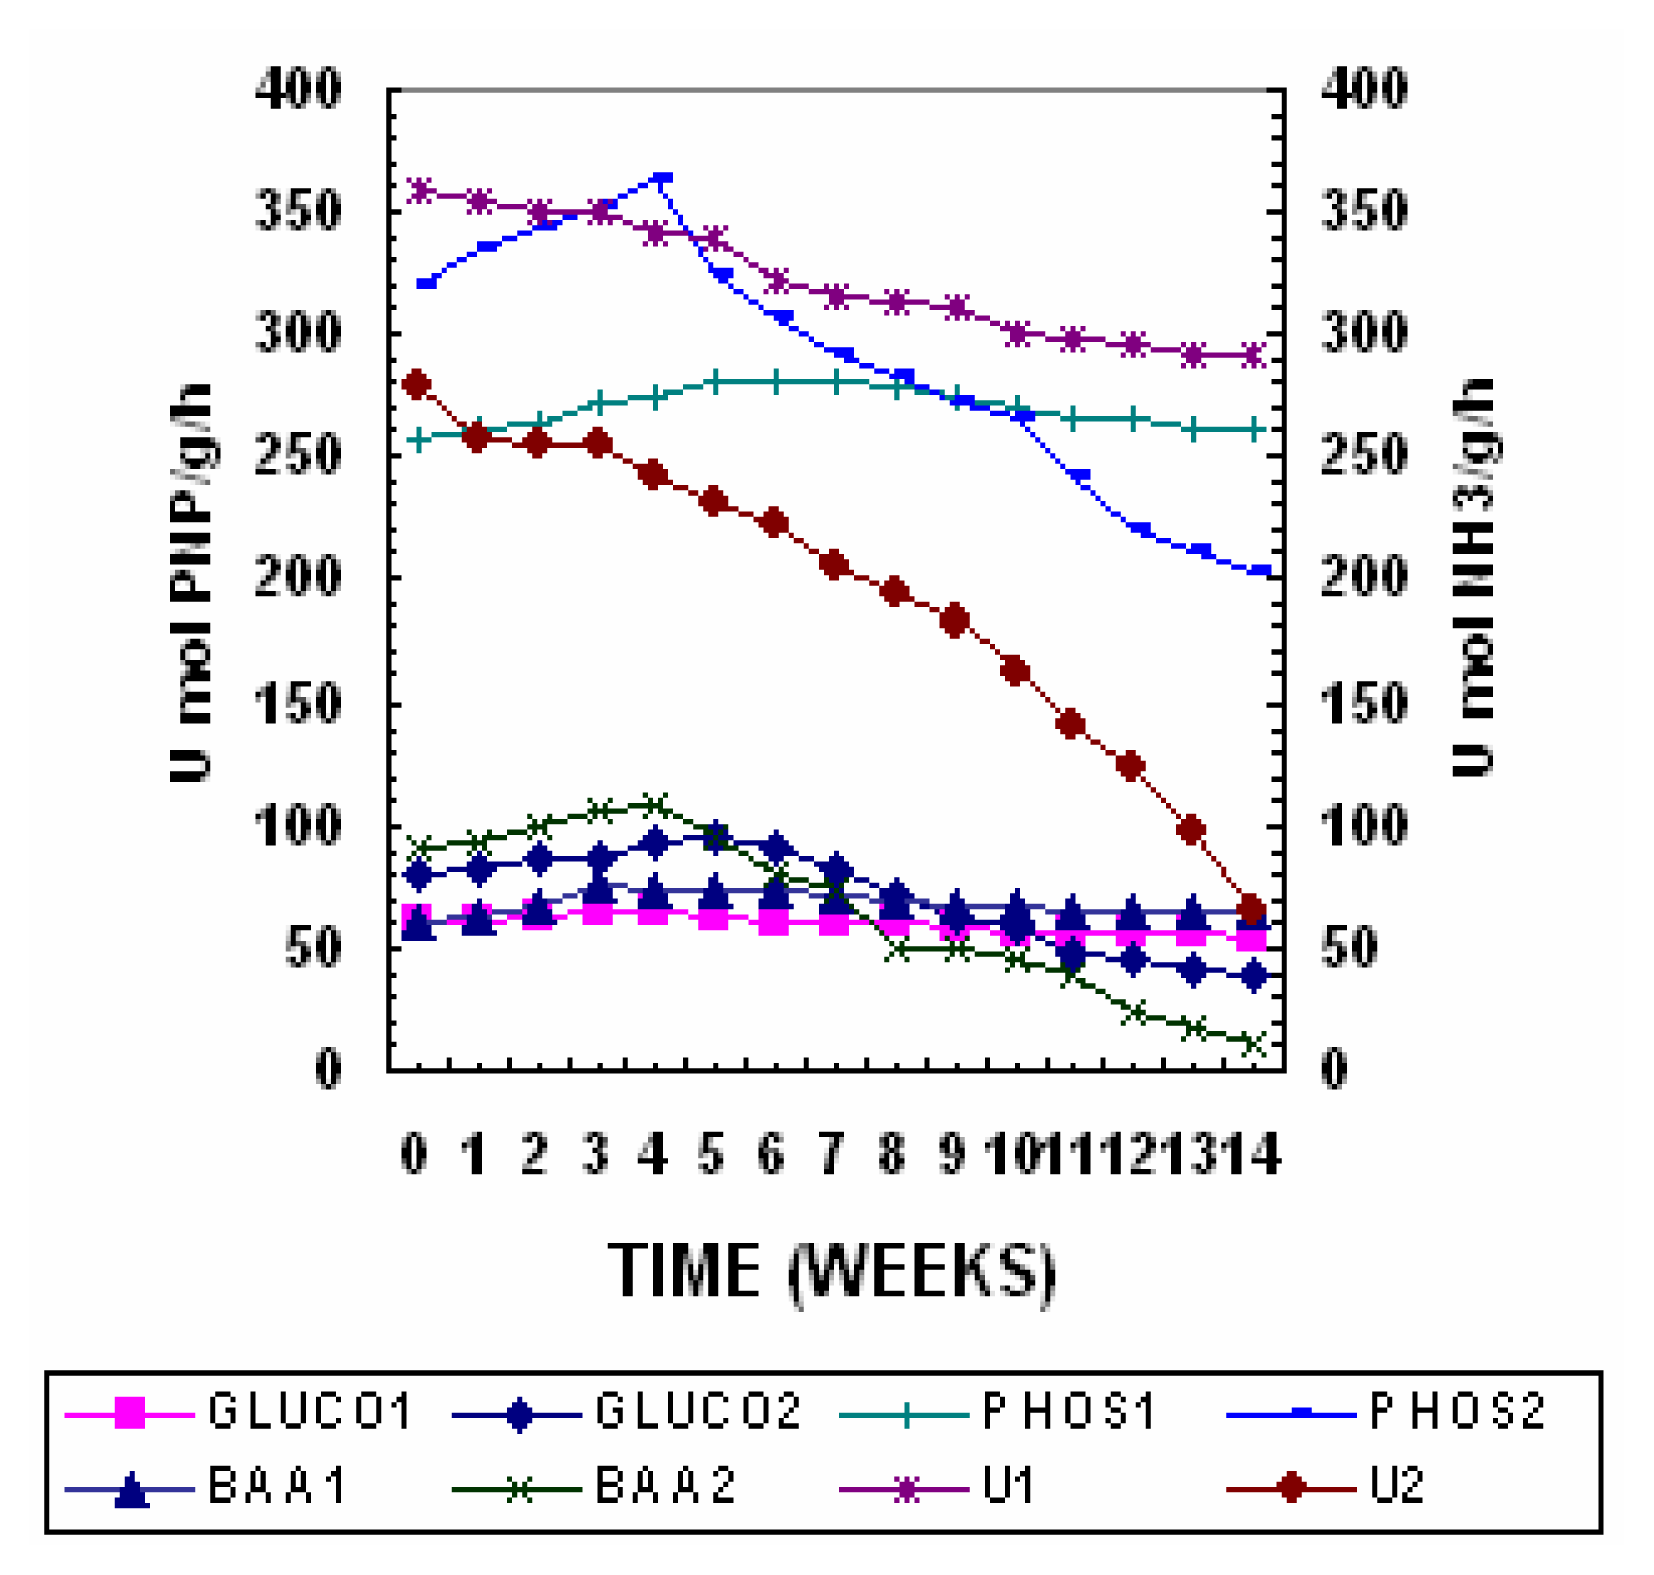
Profiles of Enzymatic Activities
The degradation of the labile substrates contained in organic matter can be followed by studying specific hydrolases, which are relatively easy to determine, and specific to the substrate. The hydrolases monitored in the present work (BAA-Hydrolysing Protease, Urease, β-glucosidase, Dehydrogenase and Phosphatase could represent a good index of qualitative fluctuations of substrate during composting since they are substrate-inducible enzymes. The changes in enzymatic activities in Pile 1 and 2 are shown in
Fig. 6. The high initial activity of these enzymes reflected the high microbial activity. The presence of a high content of degradable compounds in the pile 2 might have stimulated enzyme synthesis. As substrate decreased, the enzyme activity decreased as well [
40].
The β-glucosidase activity decreased throughout the composting process, in Pile 2 as may be expected, since carbonated structures are degraded as composting proceeded and only the most resistant and those with the smallest number of side chains remain at the end of the process. β-Glucosidase and BAA-hydrolyzing protease which are enzymes involved in C and N cycles, respectively showed a sharp decrease during the first 7 weeks, and then stabilized as a consequence of decrease in available organic substrates [
41].
Urease activity is closely related with the nitrogen cycle and it is involved in the hydrolysis of proteins to ammonium hydrolyzing urea-type substrates. It is believed that denaturalization of the enzyme during composting due to high temperature does not occur since urease is stable up to 80° C [
42]. There is a pronounced difference between the values of the initial and composted samples. This is perhaps because the enzyme depends on microbial biomass, which implies that when the biomass is degraded (due to composting) enzymatic activity decreases. The activity of urease which catalyses the hydrolysis of urea to CO
2 and NH
4+, increased during the first 4 weeks of experiment probably as a consequence of diminution of high initial concentration of NH
4+ in the substrate which may be responsible for the inhibition of this activity [
43]. Subsequently urease activity decreased until week 7 and then remained more or less stable till the terminal phase of the composting process.
Phosphatase is a key enzyme in the phosphorus cycle, which is induced by the substrate. Its activity is largely dependent on microbial biomass [
40]. Phosphatase activity showed a sharp increase during the thermophilic phase followed by a gradual decrease. The increase observed during the thermophillic phase can be associated to high microbial activity, which occurs during this stage. The phosphatase hydrolyses compounds of organic phosphorous and transforms them into different forms of inorganic phosphorous [
44]. Thus, the decrease in activity observed might be due to enzyme inhibition by inorganic phosphorous temporarily released from the mineralization of the organic phosphorous [
45]. Phosphatases are enzymes with relatively broad specificity capable of hydrolyzing various organic phosphate esters [
46]. The high initial activity could be related to the presence of organic phosphate compounds which may act as inducers of enzyme synthesis after a slight decrease during the first week phosphate activity stabilized at about 200 μmol PNP g
−1 h
−1 in Pile 2 and at 260 μmol PNP g
−1 h
−1 in Pile 1 [
19].
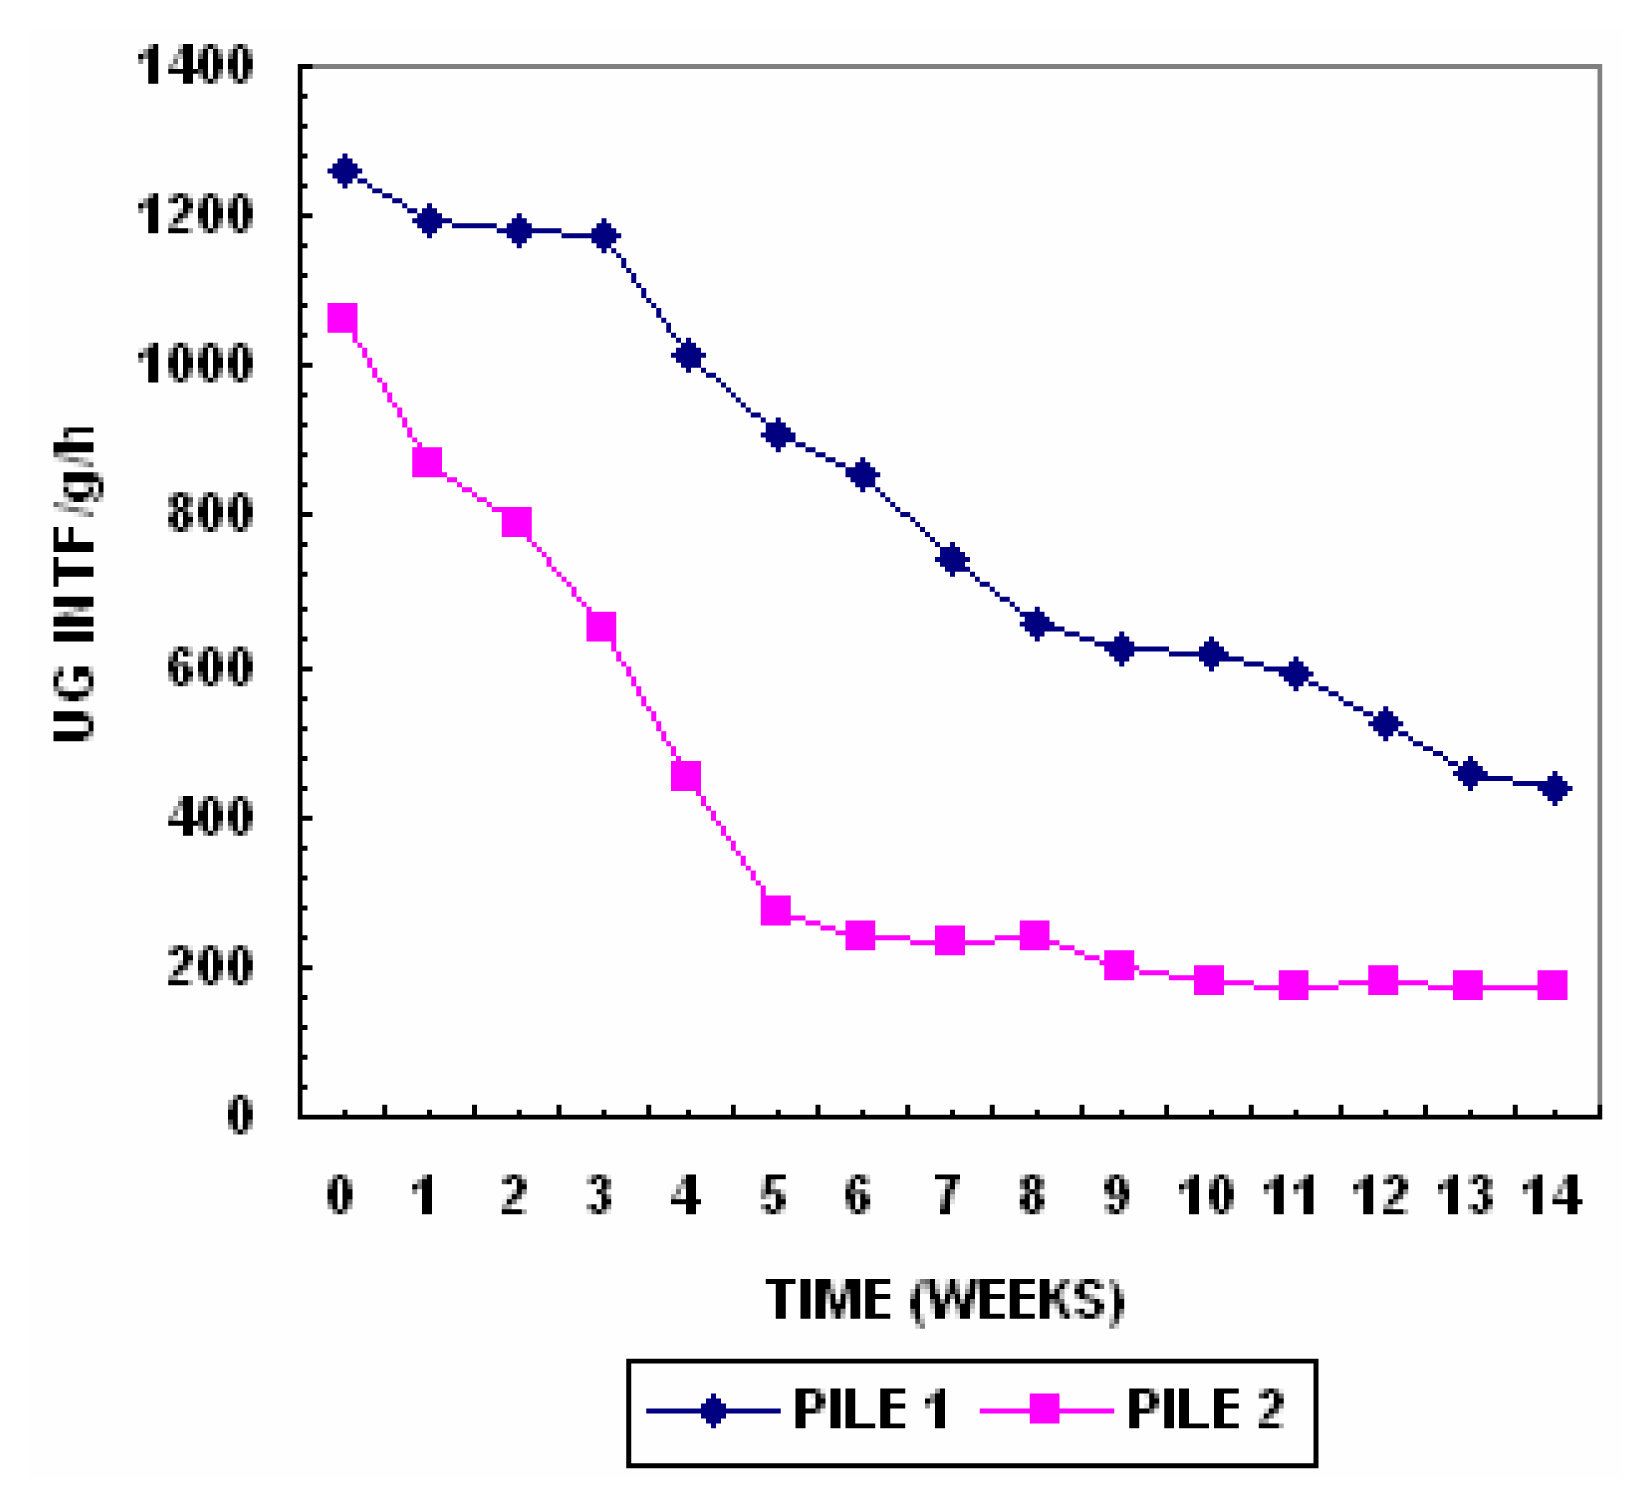
Dehydrogenase activity in soils and other biological systems has been used as a measure of the overall microbial activity [
47] since it is an intracellular enzyme related to the oxidative phosphorylation process [
48]. The initial high dehydrogenase activity recorded might have been the result of high microbial activity due to the high water soluble carbon concentration after two weeks dehydrogenase activity decreased until the end of composting. The dehydrogenase activity is represented in
Figure 7.
Characterization of Final Compost
A number of physical, chemical and biological indices have been linked to the maturity of composts [
49]. The compost in Pile 2 was alkaline, pleasantly earthy in smell and dark down. Compost characteristics are presented in
Table 2. From the results obtained, compost in Pile 2 showed a C/N ratio of 11.9, which is in accordance with the recommended value between 10 and 15 [
32]. This indicates that there is a considerable decrease in organic matter, water-soluble carbon and nitrogen. A total N content in composts is higher than the minimum level recommended (0.6% total N) by Zucconi and De Bertoldi [
12]. Enzymatic activities observed in the present study are intracellular activities of proliferating microorganisms and not due to the activities of extra cellular enzymes. Hence hydrolytic and dehydrogenase activities are sensitive indicators of the state and evolution of the organic matter and the overall quality of the compost. The macronutrient contents were above the minimum recommended (0.5% P
2O
5; 0.3% K
2O; 0.3% K
2O; 0.3% MgO; 2.0% CaO) by Zucconi and De Bertoldi [at high pH conditions [
50]. Heavy metals present, in
12]. Metal mobility and availability was reduced by increased pH values since cationic ions are less available all the composts, were below the maximum values permitted for each element. Further studies on the regulatory standards of the composted product can validate the applicability of these stabilized sediments for successful application as biosolids.
Cost of Treatment
The tentative cost of the treatment is calculated for the entire lake area of 0.5 Km2 from the studies carried out in lab scale. The lakebed is more polluted at certain quartets and towards the inlet and outlet culverts. From our study only 50% of the lake area needs dredging to a depth of 0.25m and the volume of the total sediment to be dredged will be 31,250 m3. The estimate cost for dredging and transportation of the polluted sediment to TSDF is Rs7, 00,00,000/-(US$16,00,000). The cost for ploughing the entire lake area to a depth of 0.6m is Rs 2,00,00,000/- (US$4,50,000). The total cost of rejuvenation of the lake by liming, composting and further biological activity is calculated to be Rs 1,00,00,000/- (US$2,30,000). Therefore the approximate cost calculated from our studies Rs 10,00,00,000/-(US$ 22,80,000). The cost of the treatment calculated is an extrapolation from our studies carried out under lab condition and is subjected to vary with the nature of the pollutants.
Conclusions
Remediation of contaminated lake sediments using bioremediation can be a cost effective solution. The present study envisaged on the applicability of this technology for the entire lake insitu by carrying out lab scale studies of different stratum. The study revealed that the after the elimination of the top layer for physicochemical treatment the lower layers showed decreasing levels of concentration with depth indicating the slow transport rate of the pollutant. Aerobic composting, a bioremediation technology adopted in the present study was found to be very effective for the bottom layers and was significant for the top layers. Hence from our study it is concluded that my mixing the entire lakebed with a conventional farming technique called as “Ploughing”, and pretreatment with lime can render the stabilization of metal pollutants. However, liming may not completely stabilize metals in the case of lake beds contaminated with higher metal concentrations. Thus the stabilization of these lakes has to be addressed on pollutant specific scenarios with integration of physico-chemical and biological stabilization methodologies. The success of the composting of lake sediments was achieved by optimizing the C/N ratio of the piles to 30:1, moisture content of 55%. Further addition of bulking agents and organic amendments in the ratio of 2:1:1 (Sediment: sawdust: manure). The success of the composting maturity was assessed by evaluating indices C/N, Cw (water soluble carbon), CNw (Cw/Nw), nitrification index (NH4/NO−3), Cation Exchange Capacity (CEC), germination index, humification ratio, compost mineralization index (ash content/oxidizable carbon), sorption capacity index (CEC/oxidizable carbon). Enzyme activities of agricultural interest like urease, phosphatase, β-glucosidase, dehydrogenase and BAA-hydrolyzing protease, which are involved in the nitrogen, phosphorus and carbon cycles, were also assessed. Total content of macro and micronutrients in the final compost was also determined to assess the fertilizer value. The indices are compared with the literature values and can be concluded that the maturity indices are useful indicators for the success of the composting technology. The treat ability of the contaminated sediment can be evaluated using these indices and on standardizing these indicators can be successfully applicable for prototype application. The study also made an attempt to work out the cost of this treatment option. Thus it can be concluded that treatment of contaminated lake sediments should be addressed as case-by-case scenario. Bioremediation coupled with other physico-chemical and emerging technologies can be an effective insitu solution in handling the remediation of the natural water bodies and bring them back to life to support other dependent systems


