
Role of Body Mass and Physical Activity in Autonomic Function Modulation on Post-COVID-19 Condition: An Observational Subanalysis of Fit-COVID Study

 , , ,
, , ,  , , , , , and
Abstract
:1. Introduction
2. Materials and Methods
2.1. Ethical Approval
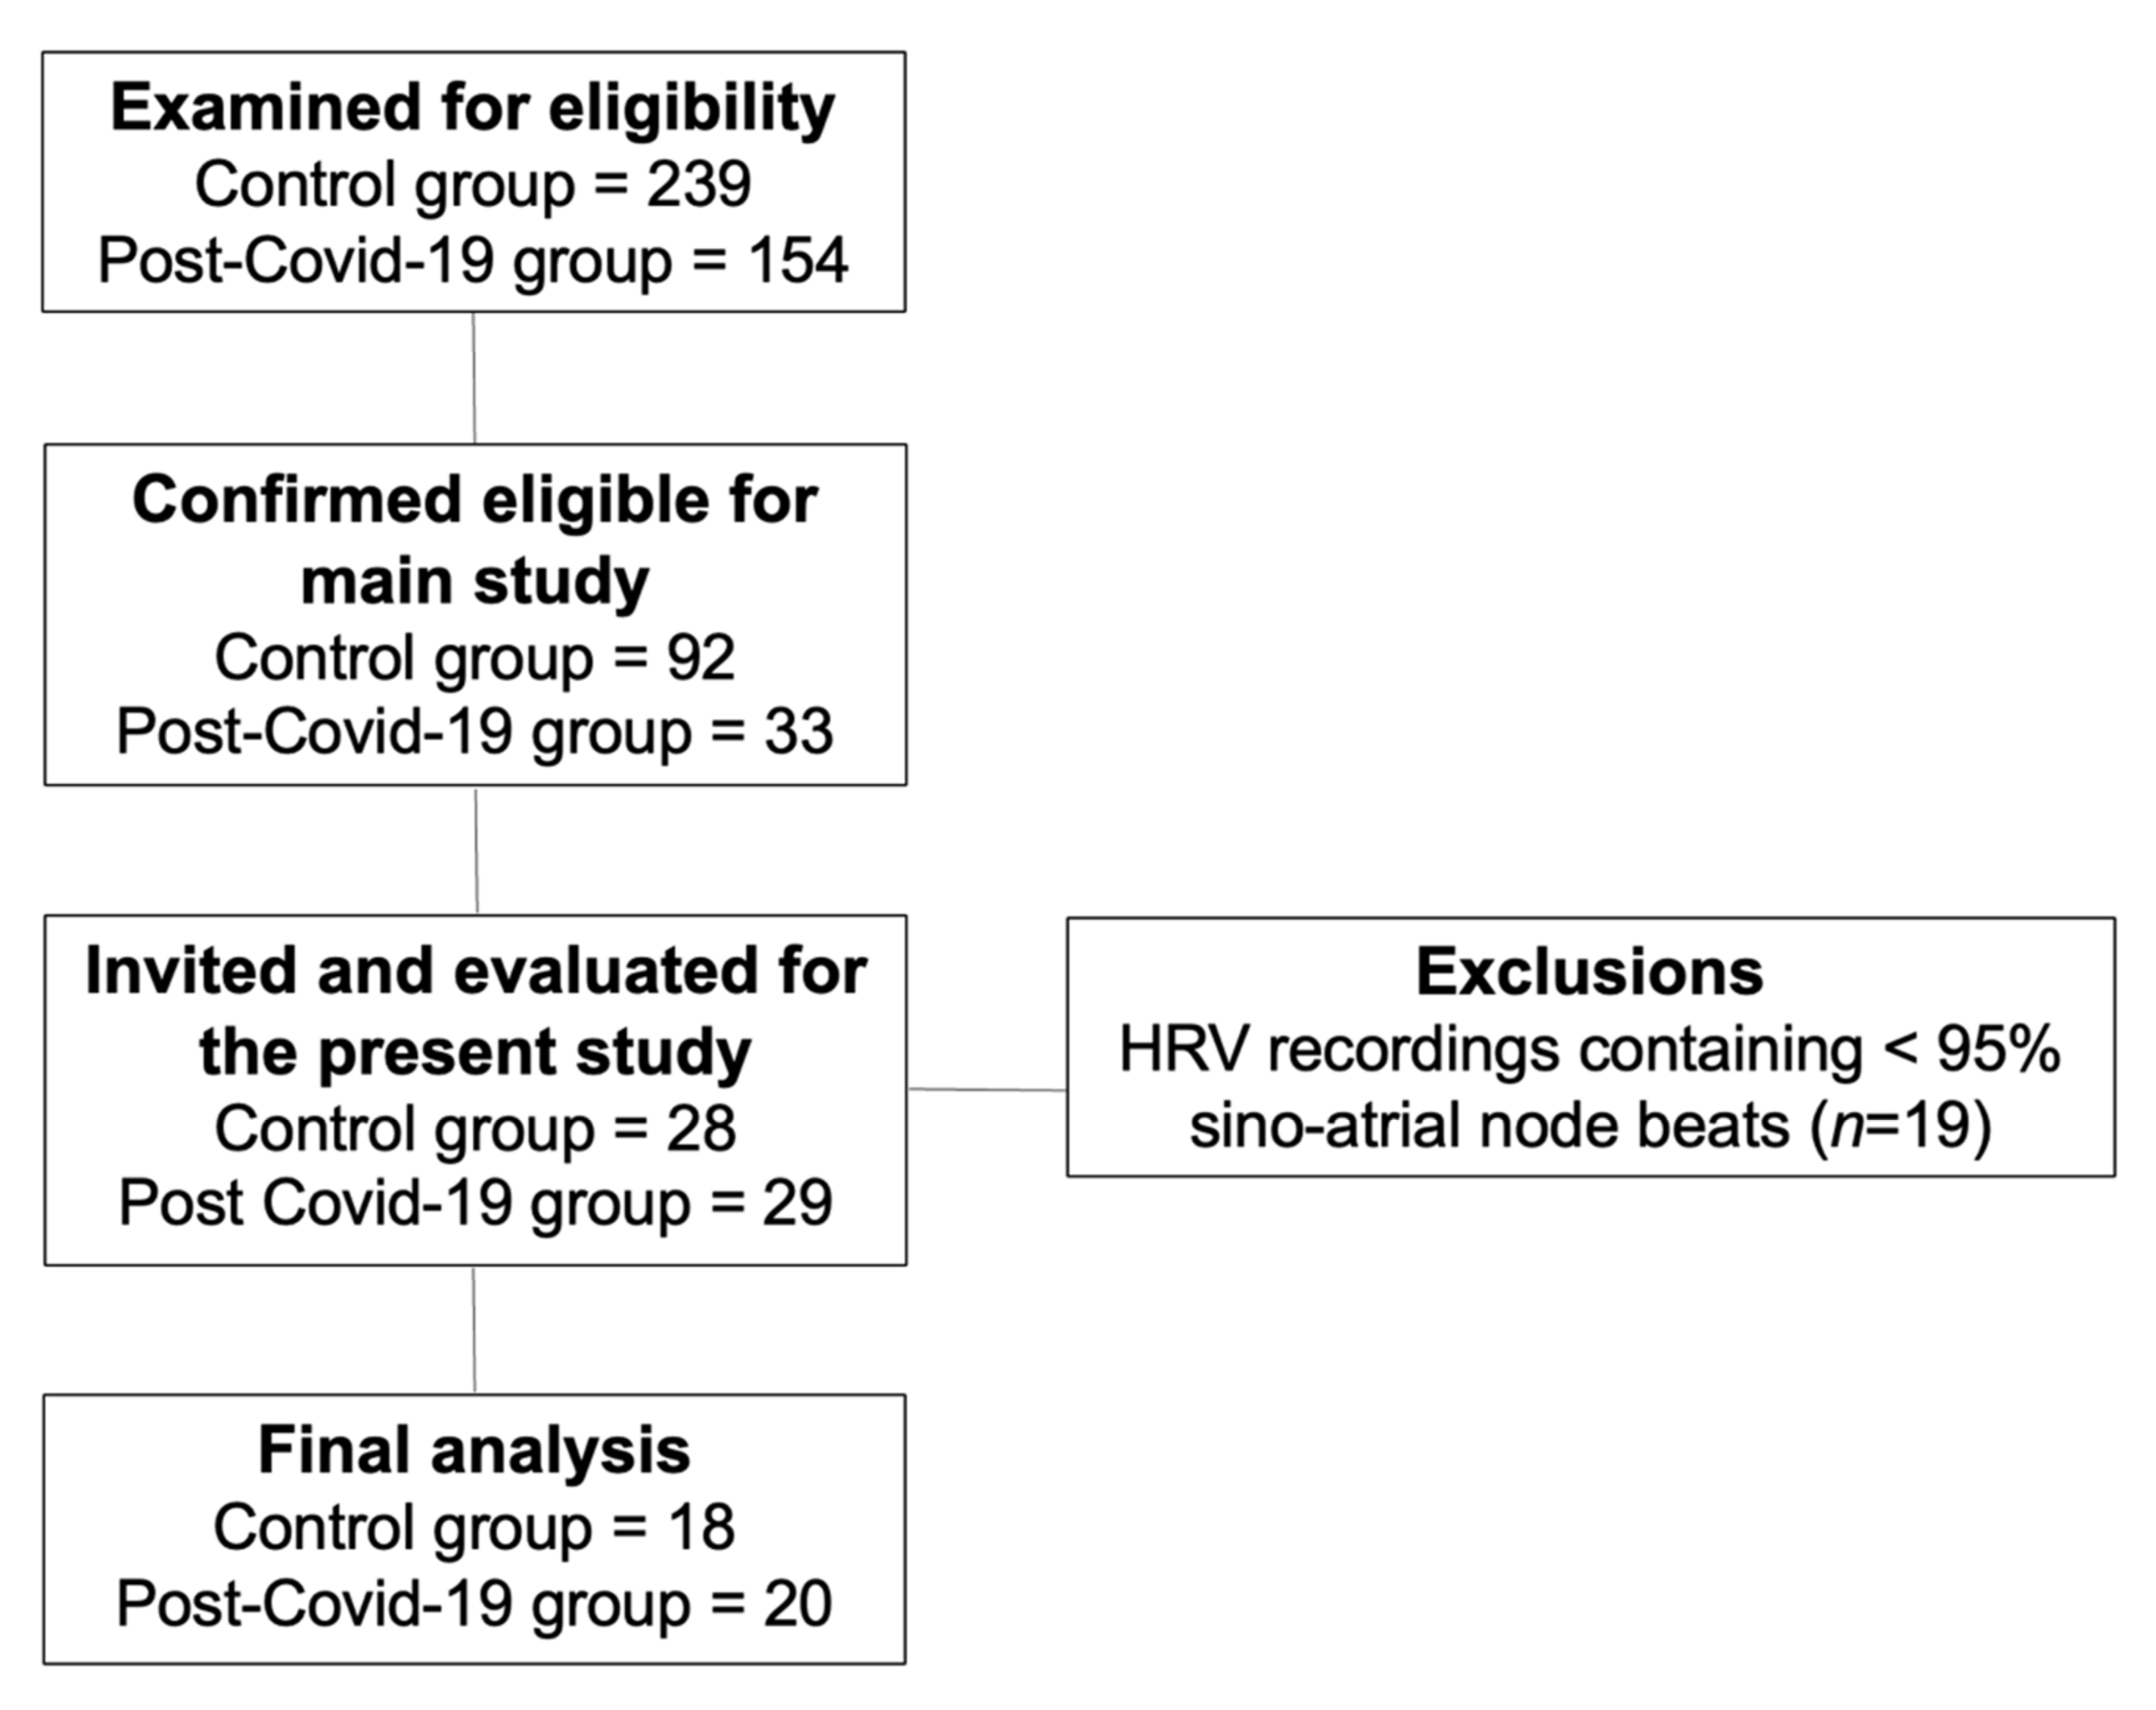
2.2. Study Design
2.3. Experimental Measures
2.3.1. Initial Evaluation
2.3.2. Body Mass Index
2.3.3. Physical Activity Level
2.3.4. Heart Rate Variability
2.4. Statistical Analysis
3. Results
4. Discussion
5. Conclusions
Author Contributions
Funding
Institutional Review Board Statement
Informed Consent Statement
Data Availability Statement
Acknowledgments
Conflicts of Interest
Appendix A

| Variables | Odds Ratio | 95% CI | p Value |
|---|---|---|---|
| Sympathetic nervous system activity | |||
| Stress index | 1.22 | 1.00 to 1.48 | 0.041 * |
| Parasympathetic nervous system activity | |||
| RMSSD | 0.89 | 0.81 to 0.98 | 0.026 * |
| pNN50 | 0.88 | 0.78 to 1.00 | 0.068 |
| SD1 (ms) | 0.85 | 0.74 to 0.98 | 0.027 * |
| Global variability | |||
| SDNN | 0.92 | 0.85 to 0.99 | 0.039 * |
| TINN | 0.98 | 0.96 to 1.00 | 0.051 |
| SD2 (ms) | 0.93 | 0.87 to 0.99 | 0.024 * |
Appendix B
| Body Mass Index (BMI) | MVPA | ||||||
|---|---|---|---|---|---|---|---|
| Odds Ratio | 95% CI | p Value | Odds Ratio | 95% CI | p Value | ||
| Sympathetic activity | Sympathetic activity | ||||||
| Stress index | 1.20 | 0.98 to 1.48 | 0.071 | Stress index | 1.25 | 0.97 to 1.61 | 0.082 |
| BMI | 1.03 | 0.88 to 1.20 | 0.692 | MVPA | 1.00 | 0.97 to 1.03 | 0.919 |
| Parasympathetic activity | Parasympathetic activity | ||||||
| RMSSD | 0.90 | 0.81 to 0.99 | 0.044 * | RMSSD | 0.88 | 0.78 to 1.00 | 0.060 |
| BMI | 1.02 | 0.88 to 1.20 | 0.713 | MVPA | 1.00 | 0.97 to 1.03 | 0.850 |
| pNN50 | 0.90 | 0.79 to 1.02 | 0.112 | pNN50 | 0.88 | 0.75 to 1.03 | 0.125 |
| BMI | 1.05 | 0.91 to 1.21 | 0.493 | MVPA | 0.99 | 0.97 to 1.02 | 0.951 |
| SD1 (ms) | 0.86 | 0.74 to 0.99 | 0.045 * | SD1 (ms) | 0.84 | 0.70 to 1.00 | 0.062 |
| BMI | 1.02 | 0.88 to 1.20 | 0.711 | MVPA | 1.00 | 0.97 to 1.03 | 0.852 |
| Global variability | Global variability | ||||||
| SDNN | 0.92 | 0.85 to 1.00 | 0.080 | SDNN | 0.89 | 0.80 to 1.00 | 0.049 * |
| BMI | 1.02 | 0.87 to 1.19 | 0.752 | MVPA | 1.00 | 0.97 to 1.03 | 0.876 |
| TINN | 0.98 | 0.96 to 1.00 | 0.103 | TINN | 0.97 | 0.95 to 1.00 | 0.098 |
| BMI | 1.03 | 0.88 to 1.20 | 0.691 | MVPA | 1.00 | 0.97 to 1.03 | 0.965 |
| SD2 (ms) | 0.93 | 0.87 to 0.99 | 0.046 * | SD2 (ms) | 0.97 | 0.89 to 1.06 | 0.601 |
| BMI | 1.01 | 0.86 to 1.19 | 0.829 | MVPA | 0.98 | 0.96 to 1.01 | 0.409 |
References
- Atzrodt, C.L.; Maknojia, I.; McCarthy, R.D.P.; Oldfield, T.M.; Po, J.; Ta, K.T.L.; Stepp, H.E.; Clements, T.P. A Guide to COVID-19: A global pandemic caused by the novel coronavirus SARS-CoV-2. FEBS J. 2020, 287, 3633–3650. [Google Scholar] [CrossRef] [PubMed]
- Ahn, D.G.; Shin, H.J.; Kim, M.H.; Lee, S.; Kim, H.S.; Myoung, J.; Kim, B.T.; Kim, S.J. Current Status of Epidemiology, Diagnosis, Therapeutics, and Vaccines for Novel Coronavirus Disease 2019 (COVID-19). J. Microbiol. Biotechnol. 2020, 30, 313–324. [Google Scholar] [CrossRef] [PubMed]
- Goërtz, Y.M.J.; Van Herck, M.; Delbressine, J.M.; Vaes, A.W.; Meys, R.; Machado, F.V.C.; Houben-Wilke, S.; Burtin, C.; Posthuma, R.; Franssen, F.M.E.; et al. Persistent symptoms 3 months after a SARS-CoV-2 infection: The post-COVID-19 syndrome? ERJ Open Res. 2020, 6, 542–2020. [Google Scholar] [CrossRef] [PubMed]
- Pan, Y.; Yu, Z.; Yuan, Y.; Han, J.; Wang, Z.; Chen, H.; Wang, S.; Wang, Z.; Hu, H.; Zhou, L.; et al. Alteration of Autonomic Nervous System Is Associated with Severity and Outcomes in Patients with COVID-19. Front. Physiol. 2021, 12, 630038. [Google Scholar] [CrossRef]
- Stute, N.L.; Stickford, J.L.; Province, V.M.; Augenreich, M.A.; Ratchford, S.M.; Stickford, A.S.L. COVID-19 is getting on our nerves: Sympathetic neural activity and haemodynamics in young adults recovering from SARS-CoV-2. J. Physiol. 2021, 599, 4269–4285. [Google Scholar] [CrossRef]
- Dani, M.; Dirksen, A.; Taraborrelli, P.; Torocastro, M.; Panagopoulos, D.; Sutton, R.; Lim, P.B. Autonomic dysfunction in long COVID: Rationale, physiology and management strategies. Clin. Med. 2021, 21, e63–e67. [Google Scholar] [CrossRef]
- Lambermont, B.; Davenne, E.; Maclot, F.; Delvenne, P. SARS-CoV-2 in carotid body. Intensive Care Med. 2021, 47, 342–343. [Google Scholar] [CrossRef]
- Guilmot, A.; Maldonado Slootjes, S.; Sellimi, A.; Bronchain, M.; Hanseeuw, B.; Belkhir, L.; Yombi, J.C.; De Greef, J.; Pothen, L.; Yildiz, H.; et al. Immune-Mediated neurological syndromes in SARS-CoV-2-infected patients. J. Neurol. 2021, 268, 751–757. [Google Scholar] [CrossRef]
- Konig, M.F.; Powell, M.; Staedtke, V.; Bai, R.Y.; Thomas, D.L.; Fischer, N.; Huq, S.; Khalafallah, A.M.; Koenecke, A.; Xiong, R.; et al. Preventing cytokine storm syndrome in COVID-19 using α-1 adrenergic receptor antagonists. J. Clin. Investig. 2020, 130, 3345–3347. [Google Scholar] [CrossRef]
- Goldberger, J.J.; Arora, R.; Buckley, U.; Shivkumar, K. Autonomic Nervous System Dysfunction: JACC Focus Seminar. J. Am. Coll. Cardiol. 2019, 73, 1189–1206. [Google Scholar] [CrossRef]
- Brunner-La Rocca, H.P.; Esler, M.D.; Jennings, G.L.; Kaye, D.M. Effect of cardiac sympathetic nervous activity on mode of death in congestive heart failure. Eur. Heart J. 2001, 22, 1136–1143. [Google Scholar] [CrossRef] [Green Version]
- Taylor, C.E.; Willie, C.K.; Ainslie, P.N.; Tzeng, Y.C. Assessment of human baroreflex function using carotid ultrasonography: What have we learnt? Acta Physiol. 2014, 211, 297–313. [Google Scholar] [CrossRef]
- Holwerda, S.W.; Luehrs, R.E.; Gremaud, A.L.; Wooldridge, N.A.; Stroud, A.K.; Fiedorowicz, J.G.; Abboud, F.M.; Pierce, G.L. Relative burst amplitude of muscle sympathetic nerve activity is an indicator of altered sympathetic outflow in chronic anxiety. J. Neurophysiol. 2018, 120, 11–22. [Google Scholar] [CrossRef]
- Koopman, J.J.; van Bodegom, D.; Maan, A.C.; Li, Z.; Ziem, J.B.; Westendorp, R.G.; Jukema, J.W. Heart rate variability, but not heart rate, is associated with handgrip strength and mortality in older Africans at very low cardiovascular risk: A population-based study. Int. J. Cardiol. 2015, 187, 559–561. [Google Scholar] [CrossRef] [Green Version]
- Barizien, N.; Le Guen, M.; Russel, S.; Touche, P.; Huang, F.; Vallée, A. Clinical characterization of dysautonomia in long COVID-19 patients. Sci. Rep. 2021, 11, 14042. [Google Scholar] [CrossRef]
- Raj, S.R.; Arnold, A.C.; Barboi, A.; Claydon, V.E.; Limberg, J.K.; Lucci, V.M.; Numan, M.; Peltier, A.; Snapper, H.; Vernino, S. Long-COVID postural tachycardia syndrome: An American Autonomic Society statement. Clin. Auton. Res. Off. J. Clin. Auton. Res. Soc. 2021, 31, 365–368. [Google Scholar] [CrossRef]
- Staats, P.; Giannakopoulos, G.; Blake, J.; Liebler, E.; Levy, R.M. The Use of Non-invasive Vagus Nerve Stimulation to Treat Respiratory Symptoms Associated with COVID-19: A Theoretical Hypothesis and Early Clinical Experience. Neuromodulation J. Int. Neuromodul. Soc. 2020, 23, 784–788. [Google Scholar] [CrossRef]
- Genovesi, S.; Prata Pizzala, D.M.; Pozzi, M.; Ratti, L.; Milanese, M.; Vincenti, A.; Stella, A.; Mancia, G. Baroreceptor sensitivity and baroreceptor effectiveness index in cirrhosis: The relevance of hepatic venous pressure gradient. Liver Int. Off. J. Int. Assoc. Study Liver 2010, 30, 232–239. [Google Scholar] [CrossRef]
- Sorkness, R.; Clough, J.J.; Castleman, W.L.; Lemanske, R.F., Jr. Virus-induced airway obstruction and parasympathetic hyperresponsiveness in adult rats. Am. J. Respir. Crit. Care Med. 1994, 150, 28–34. [Google Scholar] [CrossRef]
- Freeman, R.; Komaroff, A.L. Does the chronic fatigue syndrome involve the autonomic nervous system? Am. J. Med. 1997, 102, 357–364. [Google Scholar] [CrossRef]
- Williams, S.M.; Eleftheriadou, A.; Alam, U.; Cuthbertson, D.J.; Wilding, J.P.H. Cardiac Autonomic Neuropathy in Obesity, the Metabolic Syndrome and Prediabetes: A Narrative Review. Diabetes Ther. Res. Treat. Educ. Diabetes Relat. Disord. 2019, 10, 1995–2021. [Google Scholar] [CrossRef] [Green Version]
- Rastović, M.; Srdić-Galić, B.; Barak, O.; Stokić, E.; Polovina, S. Aging, heart rate variability and metabolic impact of obesity. Acta Clin. Croat. 2019, 58, 430–438. [Google Scholar] [CrossRef]
- Hautala, A.J.; Kiviniemi, A.M.; Tulppo, M.P. Individual responses to aerobic exercise: The role of the autonomic nervous system. Neurosci. Biobehav. Rev. 2009, 33, 107–115. [Google Scholar] [CrossRef]
- Fu, Q.; Levine, B.D. Exercise and the autonomic nervous system. Handb. Clin. Neurol. 2013, 117, 147–160. [Google Scholar] [CrossRef]
- Chu, Y.; Yang, J.; Shi, J.; Zhang, P.; Wang, X. Obesity is associated with increased severity of disease in COVID-19 pneumonia: A systematic review and meta-analysis. Eur. J. Med. Res. 2020, 25, 64. [Google Scholar] [CrossRef]
- Minuzzi, L.G.; Seelaender, M.; Silva, B.S.A.; Cunha, E.; Deus, M.C.; Vasconcellos, F.T.F.; Marqueze, L.F.B.; Gadotti, A.C.; Baena, C.P.; Pereira, T.; et al. COVID-19 Outcome Relates with Circulating BDNF, according to Patient Adiposity and Age. Front. Nutr. 2021, 8, 784429. [Google Scholar] [CrossRef]
- Gao, F.; Zheng, K.I.; Wang, X.B.; Sun, Q.F.; Pan, K.H.; Wang, T.Y.; Chen, Y.P.; Targher, G.; Byrne, C.D.; George, J.; et al. Obesity Is a Risk Factor for Greater COVID-19 Severity. Diabetes Care 2020, 43, e72–e74. [Google Scholar] [CrossRef]
- Bull, F.C.; Al-Ansari, S.S.; Biddle, S.; Borodulin, K.; Buman, M.P.; Cardon, G.; Carty, C.; Chaput, J.P.; Chastin, S.; Chou, R.; et al. World Health Organization 2020 guidelines on physical activity and sedentary behaviour. Br. J. Sports Med. 2020, 54, 1451–1462. [Google Scholar] [CrossRef]
- Sallis, R.; Young, D.R.; Tartof, S.Y.; Sallis, J.F.; Sall, J.; Li, Q.; Smith, G.N.; Cohen, D.A. Physical inactivity is associated with a higher risk for severe COVID-19 outcomes: A study in 48,440 adult patients. Br. J. Sports Med. 2021, 55, 1099–1105. [Google Scholar] [CrossRef]
- De Souza, F.R.; Motta-Santos, D.; Dos Santos Soares, D.; de Lima, J.B.; Cardozo, G.G.; Guimarães, L.S.P.; Negrão, C.E.; Dos Santos, M.R. Association of physical activity levels and the prevalence of COVID-19-associated hospitalization. J. Sci. Med. Sport 2021, 24, 913–918. [Google Scholar] [CrossRef]
- Strahm, C.; Seneghini, M.; Güsewell, S.; Egger, T.; Leal, O.; Brucher, A.; Lemmenmeier, E.; Kleeb, D.M.; Möller, J.C.; Rieder, P.; et al. Symptoms compatible with long-COVID in healthcare workers with and without SARS-CoV-2 infection–Results of a prospective multicenter cohort. medRxiv 2021. [Google Scholar] [CrossRef]
- Camm, A.J.; Malik, M.; Bigger, J.T.; Breithardt, G.; Cerutti, S.; Cohen, R.J.; Coumel, P.; Fallen, E.L.; Kennedy, H.L.; Kleiger, R.E.; et al. Task Force of the European Society of Cardiology and the North American Society of Pacing and Electrophysiology. Heart rate variability: Standards of measurement, physiological interpretation and clinical use. Circulation 1996, 93, 1043–1065. [Google Scholar]
- Lira, F.S.; Pereira, T.; Guerra Minuzzi, L.; Figueiredo, C.; Olean-Oliveira, T.; Figueira Freire, A.P.C.; Coelho, E.S.M.J.; Caseiro, A.; Thomatieli-Santos, R.V.; Dos Santos, V.R.; et al. Modulatory Effects of Physical Activity Levels on Immune Responses and General Clinical Functions in Adult Patients with Mild to Moderate SARS-CoV-2 Infections-A Protocol for an Observational Prospective Follow-Up Investigation: Fit-COVID-19 Study. Int. J. Environ. Res. Public Health 2021, 18, 3249. [Google Scholar] [CrossRef] [PubMed]
- Von Elm, E.; Altman, D.G.; Egger, M.; Pocock, S.J.; Gøtzsche, P.C.; Vandenbroucke, J.P. The Strengthening the Reporting of Observational Studies in Epidemiology (STROBE) Statement: Guidelines for reporting observational studies. Int. J. Surg. 2014, 12, 1495–1499. [Google Scholar] [CrossRef] [Green Version]
- World Health Organization COVID-19: Surveillance, Case Investigation and Epidemiological Protocols. Available online: https://www.who.int/publications/i/item/WHO-2019-nCoV-Surveillance_Case_Definition-2020.2 (accessed on 26 July 2021).
- Beevers, G.; Lip, G.Y.H.; Brien, E. Blood pressure measurement. BMJ 2001, 322, 1043. [Google Scholar] [CrossRef]
- Nuttall, F.Q. Body Mass Index: Obesity, BMI, and Health: A Critical Review. Nutr. Today 2015, 50, 117–128. [Google Scholar] [CrossRef] [Green Version]
- Matthews, C.E.; Chen, K.Y.; Freedson, P.S.; Buchowski, M.S.; Beech, B.M.; Pate, R.R.; Troiano, R.P. Amount of time spent in sedentary behaviors in the United States, 2003–2004. Am. J. Epidemiol. 2008, 167, 875–881. [Google Scholar] [CrossRef] [Green Version]
- Troiano, R.P.; Berrigan, D.; Dodd, K.W.; Mâsse, L.C.; Tilert, T.; McDowell, M. Physical activity in the United States measured by accelerometer. Med. Sci. Sports Exerc. 2008, 40, 181–188. [Google Scholar] [CrossRef]
- Vanderlei, L.C.M.; Pastre, C.M.; Hoshi, R.A.; Carvalho, T.D.D.; Godoy, M.F.D. Noções básicas de variabilidade da frequência cardíaca e sua aplicabilidade clínica. Braz. J. Cardiovasc. Surg. 2009, 24, 205–217. [Google Scholar] [CrossRef] [Green Version]
- Kubios. HRV in Evaluating ANS Function. Available online: https://www.kubios.com/hrv-ans-function/ (accessed on 25 September 2021).
- Fritz, C.O.; Morris, P.E.; Richler, J.J. Effect size estimates: Current use, calculations, and interpretation. J. Exp. Psychology. Gen. 2012, 141, 2–18. [Google Scholar] [CrossRef] [Green Version]
- Zhang, J.; Wang, X.; Jia, X.; Li, J.; Hu, K.; Chen, G.; Wei, J.; Gong, Z.; Zhou, C.; Yu, H.; et al. Risk factors for disease severity, unimprovement, and mortality in COVID-19 patients in Wuhan, China. Clin. Microbiol. Infect. Off. Publ. Eur. Soc. Clin. Microbiol. Infect. Dis. 2020, 26, 767–772. [Google Scholar] [CrossRef]
- Radin, J.M.; Quer, G.; Ramos, E.; Baca-Motes, K.; Gadaleta, M.; Topol, E.J.; Steinhubl, S.R. Assessment of Prolonged Physiological and Behavioral Changes Associated with COVID-19 Infection. JAMA Netw. Open 2021, 4, e2115959. [Google Scholar] [CrossRef]
- Porzionato, A.; Emmi, A.; Barbon, S.; Boscolo-Berto, R.; Stecco, C.; Stocco, E.; Macchi, V.; De Caro, R. Sympathetic activation: A potential link between comorbidities and COVID-19. FEBS J. 2020, 287, 3681–3688. [Google Scholar] [CrossRef]
- Choi, A.M.; Knobil, K.; Otterbein, S.L.; Eastman, D.A.; Jacoby, D.B. Oxidant stress responses in influenza virus pneumonia: Gene expression and transcription factor activation. Am. J. Physiol. 1996, 271, L383–L391. [Google Scholar] [CrossRef]
- Stockwell, S.; Trott, M.; Tully, M.; Shin, J.; Barnett, Y.; Butler, L.; McDermott, D.; Schuch, F.; Smith, L. Changes in physical activity and sedentary behaviours from before to during the COVID-19 pandemic lockdown: A systematic review. BMJ Open Sport Exerc. Med. 2021, 7, e000960. [Google Scholar] [CrossRef]
- Catucci, A.; Scognamiglio, U.; Rossi, L. Lifestyle Changes Related to Eating Habits, Physical Activity, and Weight Status During COVID-19 Quarantine in Italy and Some European Countries. Front. Nutr. 2021, 8, 718877. [Google Scholar] [CrossRef]
- Alamri, E.S. Effects of COVID-19 home confinement on eating behavior: A review. J. Public Health Res. 2021, 10. [Google Scholar] [CrossRef]
- Dong, J.G. The role of heart rate variability in sports physiology. Exp. Ther. Med. 2016, 11, 1531–1536. [Google Scholar] [CrossRef] [Green Version]
- Young, H.A.; Benton, D. Heart-rate variability: A biomarker to study the influence of nutrition on physiological and psychological health? Behav. Pharmacol. 2018, 29, 140–151. [Google Scholar] [CrossRef] [Green Version]
- Choi, J.; Joseph, L.; Pilote, L. Obesity and C-reactive protein in various populations: A systematic review and meta-analysis. Obes. Rev. Off. J. Int. Assoc. Study Obes. 2013, 14, 232–244. [Google Scholar] [CrossRef]
- Spierer, D.K.; DeMeersman, R.E.; Kleinfeld, J.; McPherson, E.; Fullilove, R.E.; Alba, A.; Zion, A.S. Exercise training improves cardiovascular and autonomic profiles in HIV. Clin. Auton. Res. Off. J. Clin. Auton. Res. Soc. 2007, 17, 341–348. [Google Scholar] [CrossRef] [PubMed]
- Da Silva, C.S.; Deresz, L.F.; Castelli, G.M.; Dorneles, G.P.; Mignoni, L.; Dal Lago, P. Short-Term aerobic training improves heart rate variability in men living with HIV: A pre-post pilot study. HIV Res. Clin. Pract. 2020, 21, 99–104. [Google Scholar] [CrossRef] [PubMed]
- Da Silva, V.P.; de Oliveira, N.A.; Silveira, H.; Mello, R.G.T.; Deslandes, A.C. Heart rate variability indexes as a marker of chronic adaptation in athletes: A systematic review. Ann. Noninvasive Electrocardiol. 2015, 20, 108–118. [Google Scholar] [CrossRef] [PubMed]
- Michelini, L.C.; Stern, J.E. Exercise-induced neuronal plasticity in central autonomic networks: Role in cardiovascular control. Exp. Physiol. 2009, 94, 947–960. [Google Scholar] [CrossRef] [Green Version]
- Newton, J.L.; Pairman, J.; Hallsworth, K.; Moore, S.; Plötz, T.; Trenell, M.I. Physical activity intensity but not sedentary activity is reduced in chronic fatigue syndrome and is associated with autonomic regulation. QJM Mon. J. Assoc. Physicians 2011, 104, 681–687. [Google Scholar] [CrossRef] [Green Version]
- Del Rio, R.; Marcus, N.J.; Inestrosa, N.C. Potential Role of Autonomic Dysfunction in COVID-19 Morbidity and Mortality. Front. Physiol. 2020, 11, 561749. [Google Scholar] [CrossRef]
- Mendeley Data. Available online: https://data.mendeley.com/datasets/t45r8yd6jd/1 (accessed on 12 December 2021).
| Groups | Control | Post-COVID-19 | |||||
|---|---|---|---|---|---|---|---|
| Variables | Mean/ Median | SD/IQR | Mean/ Median | SD/IQR | Diff between Means | 95%CI | p-Value |
| Sex (F/M) | (5/13) | - | (9/11) | - | - | - | 0.3276 |
| Age (years) | 26.22 | 5.22 | 29.17 | 6.32 | −2.95 ± 1.89 | −0.89 to 6.80 | 0.1276 |
| Weight (kg) | 74.59 | 17.32 | 76.57 | 14.36 | −1.98 ± 5.14 | −8.45 to 12.42 | 0.7023 |
| Height (m) | 1.69 | 0.09 | 1.73 | 0.08 | −0.03 ± 0.02 | −0.09 to 0.01 | 0.1712 |
| BMI (kg/m2) | 24.67 | 4.79 | 26.76 | 5.12 | −2.09 ± 1.61 | −1.18 to 5.36 | 0.2039 |
| Systolic blood pressure | 120.00 | 120–120 | 120.00 | 120–130 | 8.55 ± 5.02 | −1.64 to 18.75 | 0.1189 |
| Diastolic blood pressure | 80.00 | 80–80 | 80.00 | 80–80 | 0.05 ± 1.06 | −2.11 to 2.22 | 0.9588 |
| Sedentary activity (min/day) | 578.40 | 534.90–676.70 | 499.60 | 467.10–593.50 | 55.99 ± 97.31 | −254.70 to 142.70 | 0.5693 |
| Light activity (min/day) | 239.00 | 65.15 | 309.00 | 116.5 | −70.01 ± 33.37 | 1.87 to 138.10 | 0.0444 * |
| Moderate activity (min/day) | 17.90 | 5.10–29.90 | 13.36 | 9.25–33.72 | 0.03 ± 8.05 | −16.48 to 16.41 | 0.9966 |
| Vigorous activity (min/day) | 3.64 | 0.0–15.80 | 0.00 | 0.00–0.50 | −7.931 ± 3.04 | −14.14 to −1.72 | 0.0380 * |
| MVPA (min/day) | 23.72 | 12.60–46.00 | 14.79 | 9.57–34.04 | 8.58 ± 9.94 | −28.89 to 11.72 | 0.3964 |
| Groups | Control | Post-COVID-19 | |||||
|---|---|---|---|---|---|---|---|
| Variables | Mean/ Median | SD/[IQR] | Mean/Median | SD/[IQR] | Diff between Means | 95%CI | p-Value |
| Sympathetic nervous system activity | |||||||
| Mean HR | 79.83 | 8.85 | 83.85 | 13.38 | 4.01 ± 3.72 | −3.54 to 11.58 | 0.2882 |
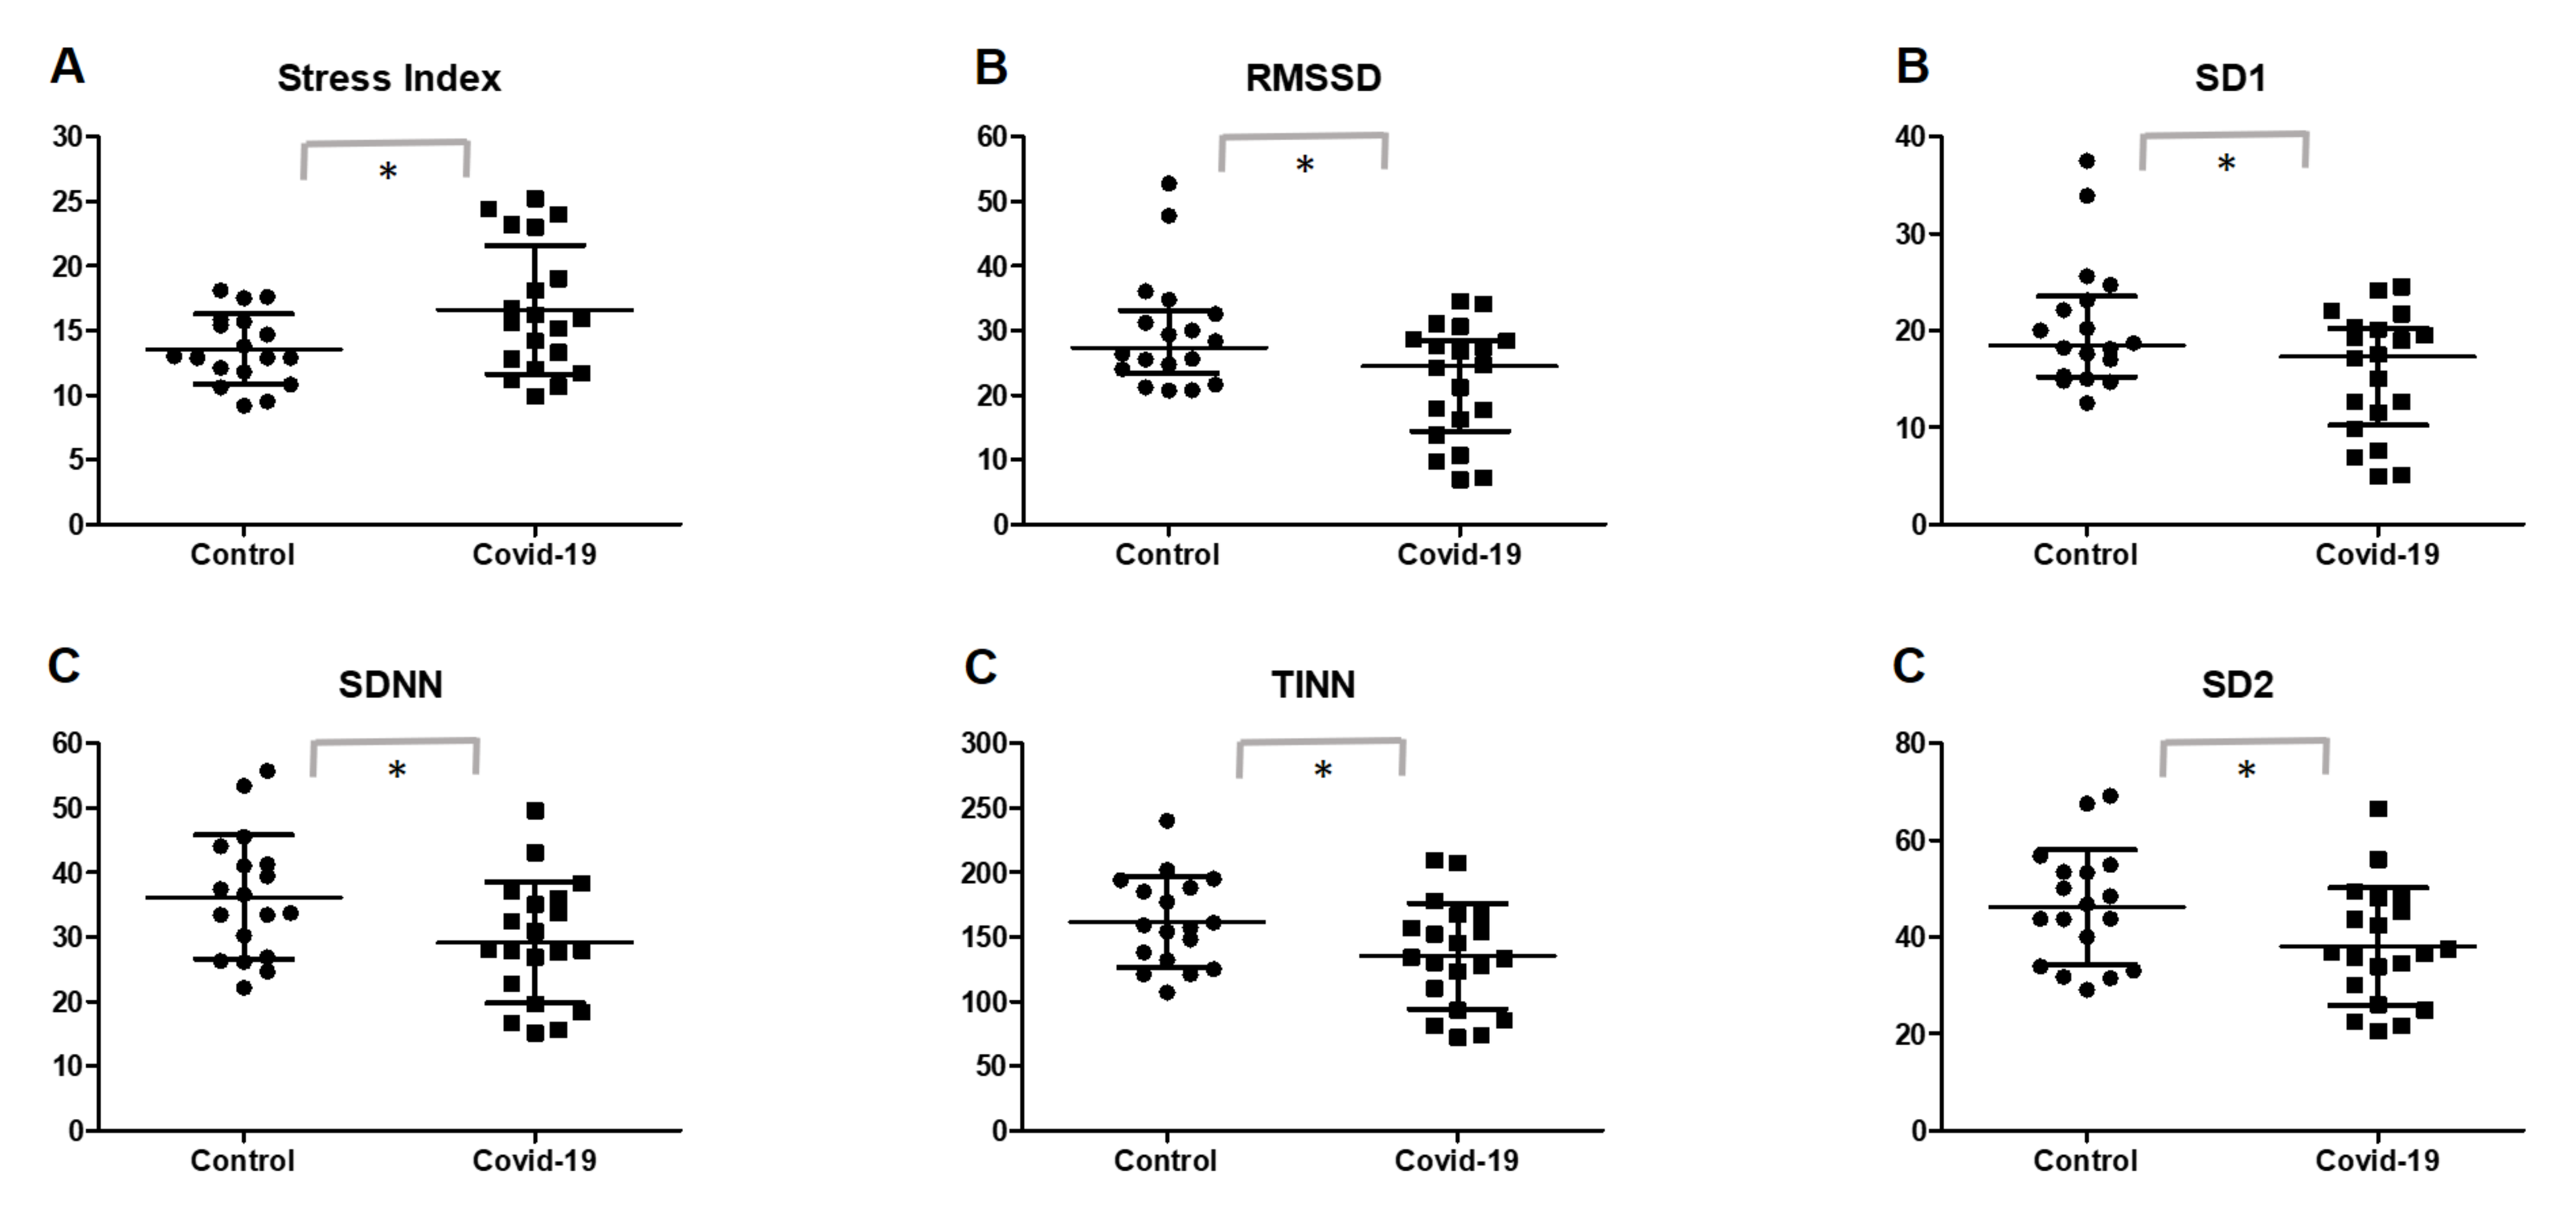
| Stress index | 13.57 | 2.72 | 16.62 | 4.98 | 3.04 ± 1.32 | 0.35 to 5.72 | 0.0273 * |
| LF (nu) | 65.49 | 15.30 | 66.61 | 15.65 | 1.12 ± 5.03 | −9.09 to 11.33 | 0.825 |
| SNS index | 1.59 | 0.89 | 2.37 | 1.57 | 0.77 ± 0.44 | −0.07 to 1.63 | 0.0719 |
| Parasympathetic nervous system activity | |||||||
| Mean RR | 738.50 | 694.0–846.50 | 689.50 | 648.0–800.0 | −25.94 ± 37.00 | −101.0 to 49.15 | 0.1834 |
| RMSSD | 27.40 | 23.40–33.15 | 24.45 | 14.40–28.55 | −7.69 ± 2.88 | −13.55 to −1.83 | 0.0452 * |
| HF (nu) | 34.49 | 15.30 | 33.33 | 15.65 | −1.15 ± 5.03 | −11.36 to 9.05 | 0.8198 |
| pNN50 | 6.73 | 3.74–12.50 | 3.41 | 0.25–7.36 | −4.70 ± 2.23 | −9.24 to 0.17 | 0.055 |
| SD1 (ms) | 19.35 | 16.58–23.50 | 17.30 | 10.23–20.25 | −5.42 ± 2.04 | −9.58 to −1.27 | 0.0118 * |
| PNS index | −1.21 | −1.49–(−0.90) | −1.60 | −2.13–(−0.94) | −0.36 ± 0.23 | −0.83 to 0.11 | 0.0845 |
| Global variability | |||||||
| SDNN | 36.17 | 9.59 | 29.13 | 9.37 | −7.04 ± 3.07 | −13.29 to −0.79 | 0.0282 * |
| RR triangular index | 9.02 | 1.91 | 7.91 | 2.34 | −1.10 ± 0.69 | −2.52 to 0.31 | 0.1218 |
| TINN | 161.30 | 34.93 | 135 | 40.77 | −26.33 ± 12.39 | −51.47 to −1.19 | 0.0404 * |
| LF/HF | 1.99 | 1.47–3.39 | 1.83 | 1.11–3.88 | 0.57 ± 0.71 | −0.86 to 2.01 | 0.9883 |
| SD2 (ms) | 47.93 | 11.53 | 38.02 | 12.17 | −9.91 ± 3.85 | −17.74 to −2.08 | 0.0145 * |
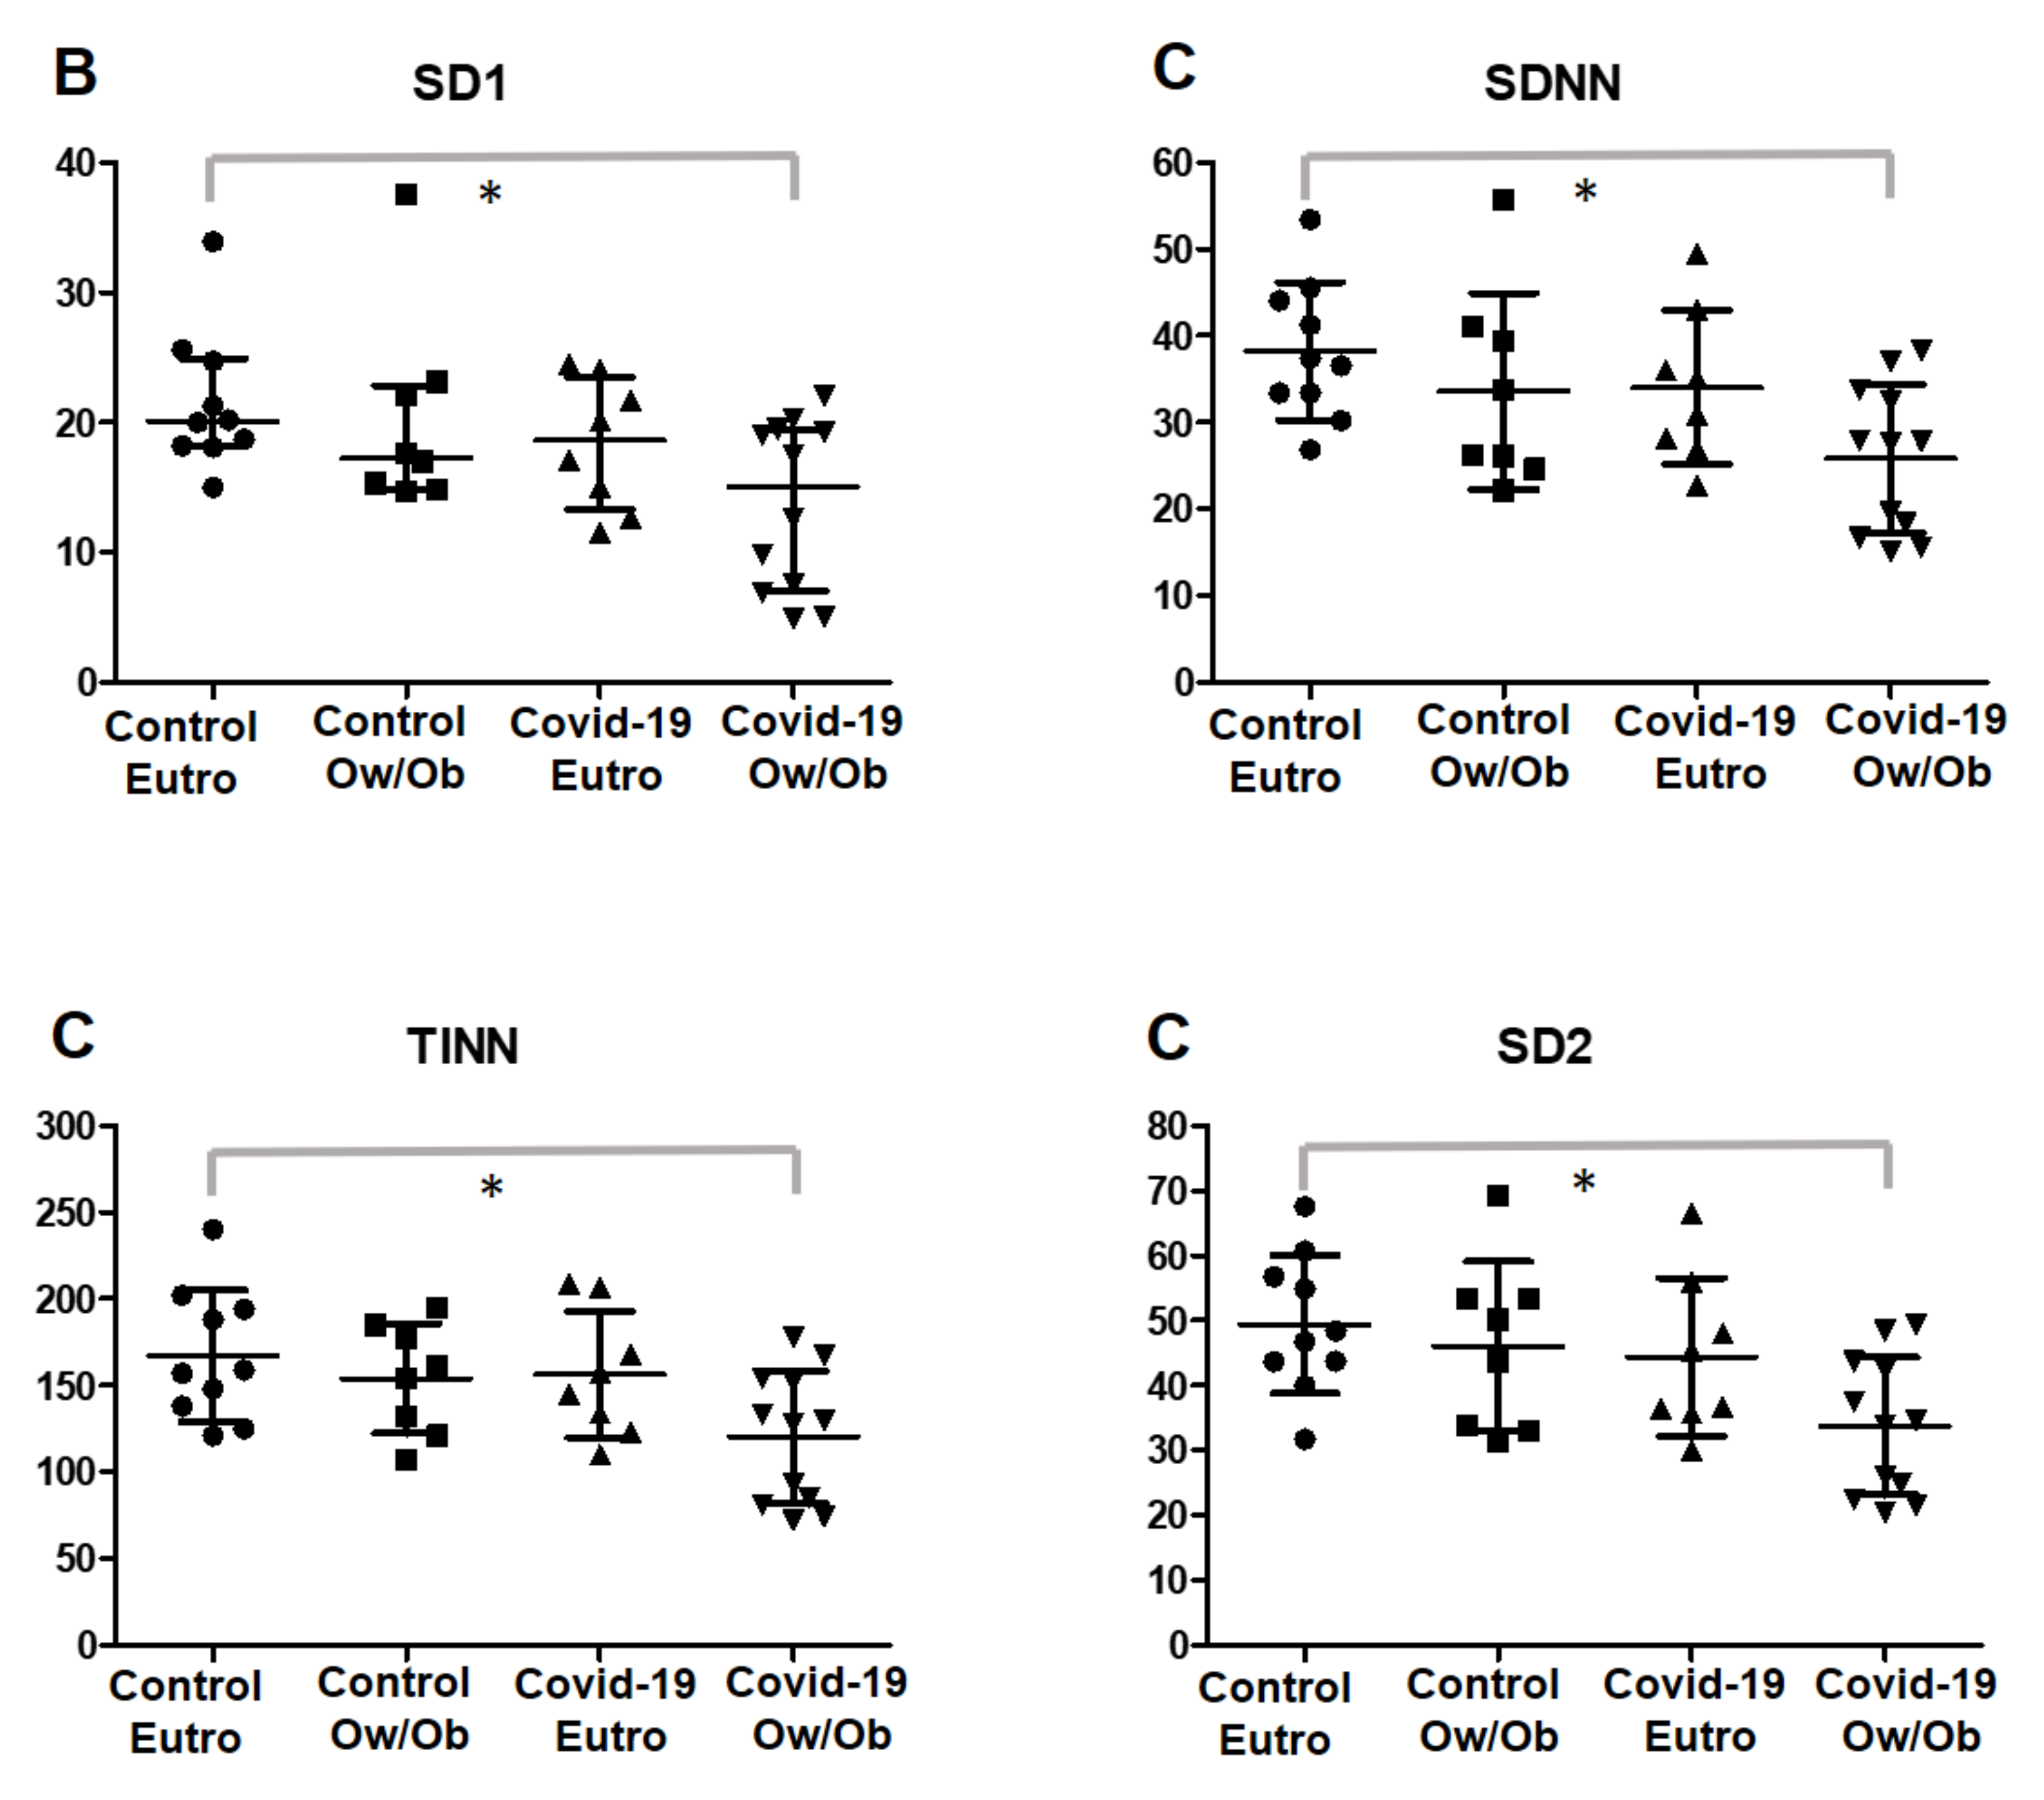
| Control | Post-COVID-19 | ||||||||
|---|---|---|---|---|---|---|---|---|---|
| Groups | Non-Obese (n = 10) | Overweight/Obese (n = 8) | Non-Obese (n = 8) | Overweight/Obese (n = 12) | |||||
| Variables | Mean/Median | SD/[IQR] | Mean/ Median | SD/[IQR] | Mean/ Median | SD/[IQR] | Mean/ Median | SD/[IQR] | p-Value |
| Sympathetic activity | |||||||||
| Mean HR | 83.10 | 8.43 | 75.75 | 8.03 | 84.63 | 14.01 | 83.33 | 13.55 | 0.2421 |
| Stress index | 13.70 | 3.01 | 13.41 | 2.49 | 14.59 | 3.20 | 17.97 | 5.59 | 0.2276 |
| LF (nu) | 61.95 | 17.65 | 69.92 | 11.31 | 58.42 | 10.90 | 72.08 | 16.31 | 0.1643 |
| SNS index | 1.82 | 0.94 | 1.29 | 0.76 | 2.09 | 1.32 | 2.55 | 1.74 | 0.2184 |
| Parasympathetic activity | |||||||||
| Mean RR | 728.80 | 79.83 | 800 | 90.11 | 727.50 | 141.30 | 739.2 | 131.4 | 0.2339 |
| RMSSD | 28.90 | (25.58–35.13) | 24.40 | (21.00–32.25) | 26.30 | (18.73–33.23) | 21.25 | (9.95–27.53) | 0.0786 |
| HF (nu) | 38.03 | 17.65 | 30.06 | 11.3 | 41.54 | 10.91 | 27.87 | 16.3 | 0.1142 |
| pNN50 | 7.32 | (6.00–14.49) | 4.45 | (0.83–11.40) | 4.96 | (2.04–12.16) | 1.54 | (0–7.07) | 0.0506 |
| SD1 (ms) | 20.10 | (18.18–24.93) | 17.3 | (14.93–22.85) | 18.60 | (13.28–23.50) | 15.05 | (7.075–19.45) | 0.0301 * |
| PNS index | −1.33 | (−1.53–(−0.92)) | −0.97 | (−1.45–(−0.82)) | −1.48 | (−2.08–(−0.95)) | −1.65 | (−2.17–(−0.71)) | 0.3112 |
| Global variability | |||||||||
| SDNN | 38.22 | 7.95 | 33.61 | 11.34 | 34.05 | 8.87 | 25.85 | 8.50 | 0.024 * |
| RR triangular index | 9.58 | 2.26 | 8.31 | 1.12 | 9.04 | 2.04 | 7.15 | 2.29 | 0.0507 |
| TINN | 167.20 | 37.96 | 154 | 31.63 | 156.60 | 36.57 | 120.60 | 38.11 | 0.0288 * |
| LF/HF | 2.06 | 1.14 | 2.91 | 1.87 | 1.58 | 0.81 | 3.97 | 3.02 | 0.0605 |
| SD2 (ms) | 49.45 | 10.61 | 46.03 | 13.06 | 44.38 | 12.20 | 33.78 | 10.6 | 0.0179 * |
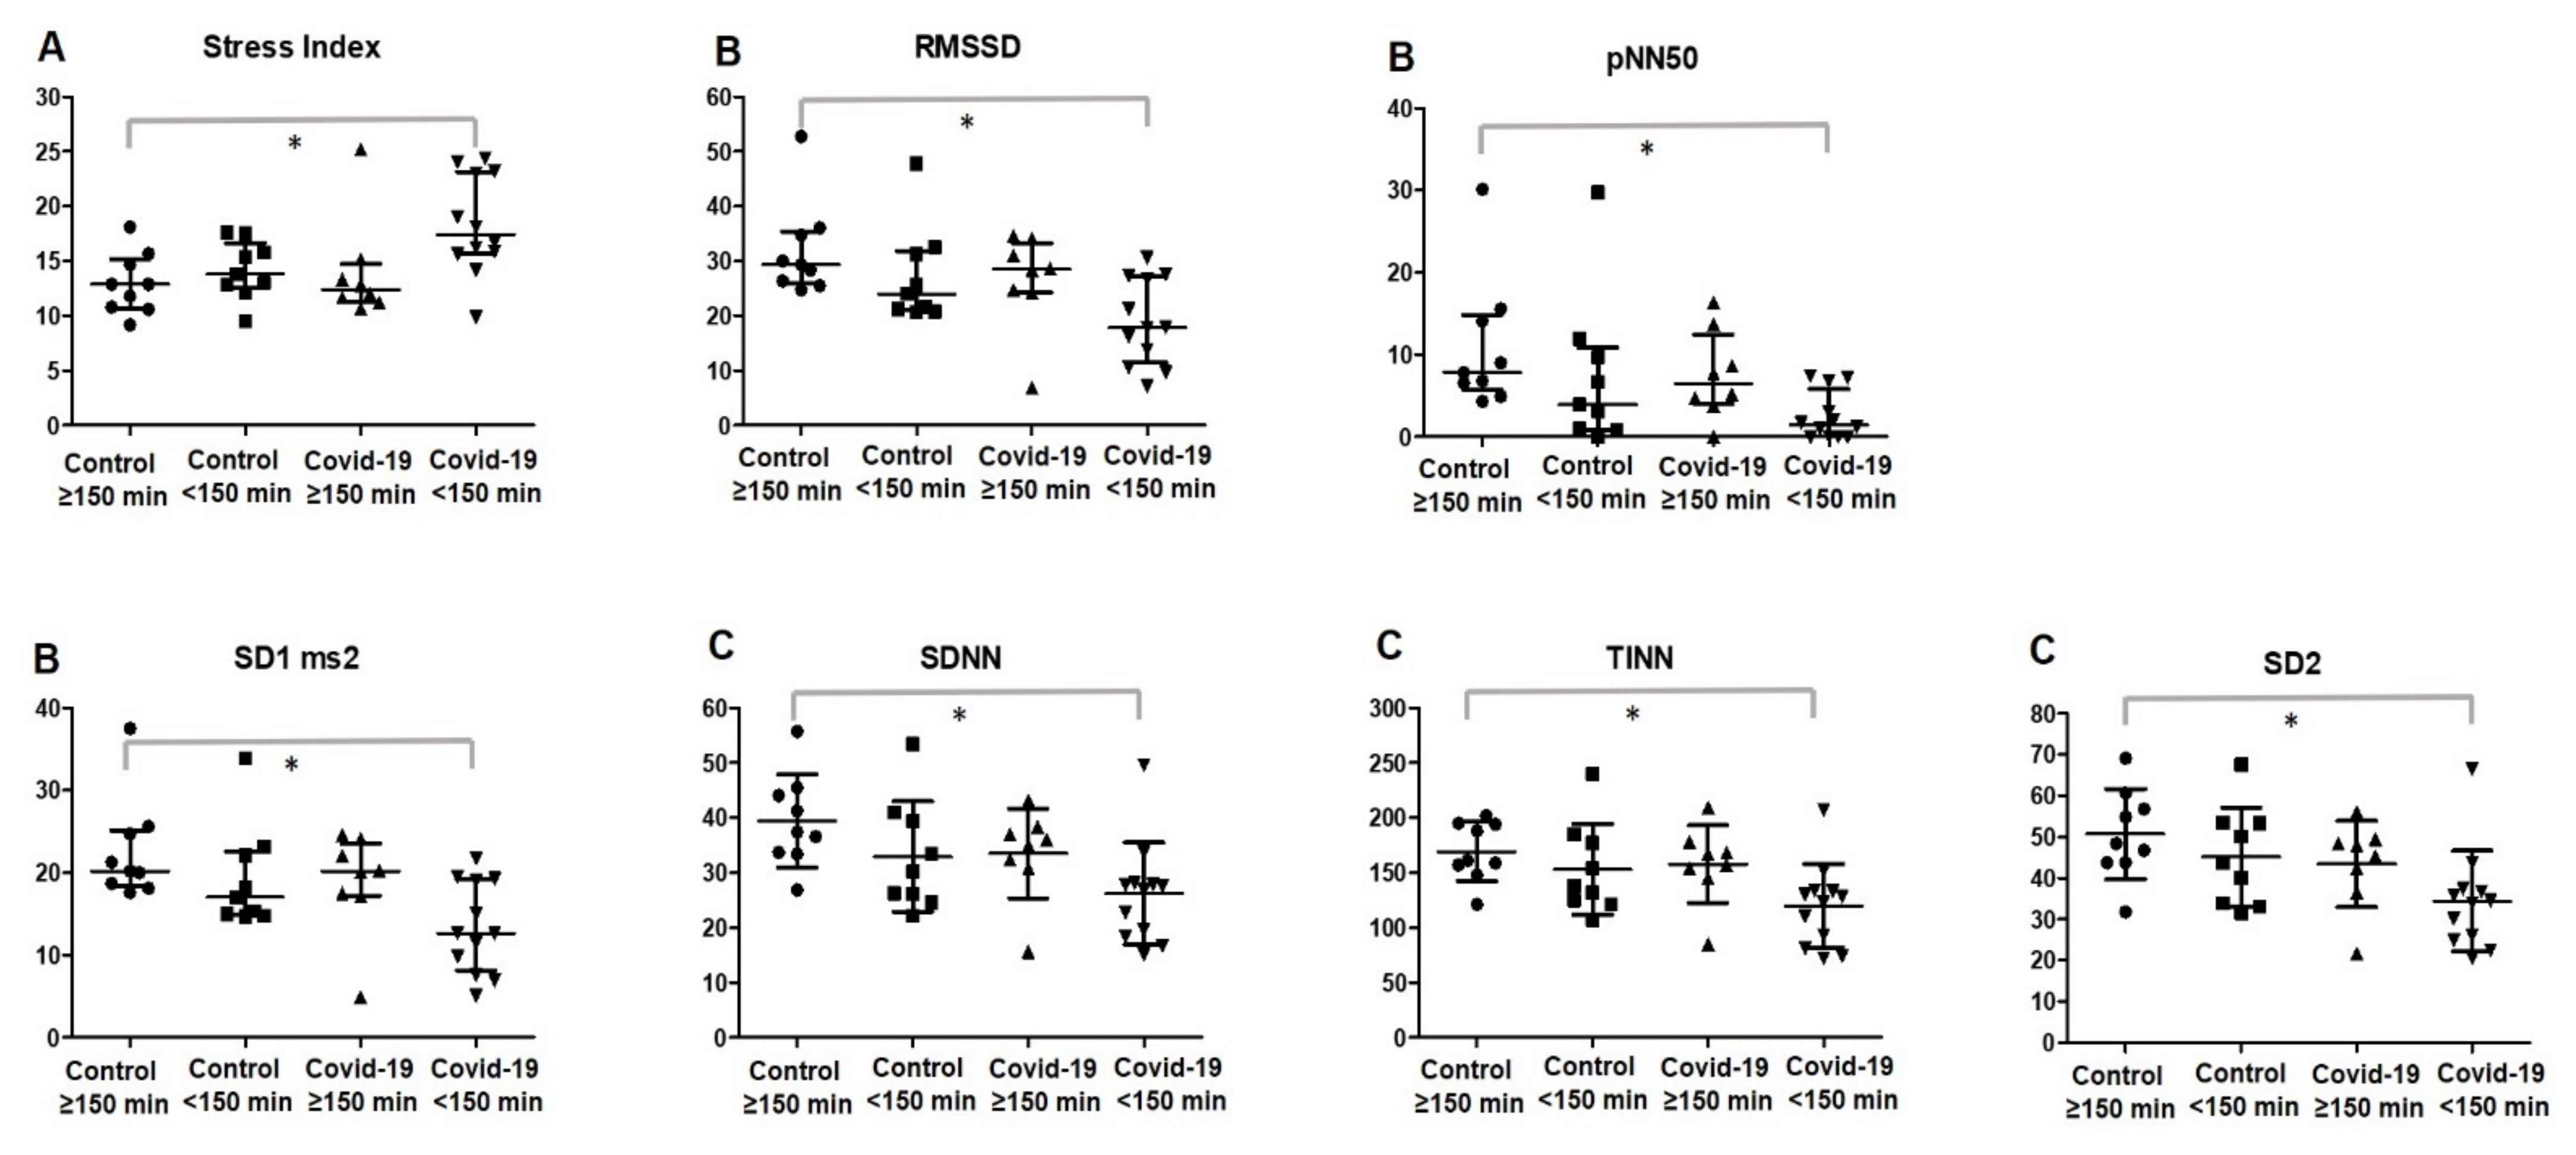
| Control Group | Post-COVID-19 | ||||||||
|---|---|---|---|---|---|---|---|---|---|
| Groups | ≥150 min MVPA (n = 9) | <150 min MVPA (n = 9) | ≥150 min MVPA (n = 8) | <150 min MVPA (n = 12) | |||||
| Variables | Mean/ Median | SD/[IQR] | Mean/ Median | SD/[IQR] | Mean/Median | SD/[IQR] | Mean/Median | SD/[IQR] | p-Value |
| Sympathetic activity | |||||||||
| Mean HR | 80.33 | 9.77 | 79.33 | 8.39 | 77.75 | 18.13 | 87.92 | 7.41 | 0.1755 |
| Stress index | 12.90 | (10.70–15.20) | 13.80 | (12.50–16.65) | 12.40 | (11.33–14.73) | 17.40 | (15.68–23.15) | 0.0147 * |
| LF (nu) | 60.08 | 18.54 | 70.91 | 9.37 | 65.20 | 13.12 | 67.56 | 17.64 | 0.5058 |
| SNS index | 1.52 | 0.95 | 1.65 | 0.86 | 1.57 | 1.88 | 2.90 | 1.10 | 0.374 |
| Parasympathetic activity | |||||||||
| Mean RR | 757.40 | 104.10 | 763.40 | 78.92 | 806.50 | 178.10 | 686.5 | 59.63 | 0.1113 |
| RMSSD | 29.40 | (25.95–35.45) | 24 | (21.00–31.90) | 28.50 | (24.33–33.33) | 17.85 | (11.48–27.15) | 0.0148 * |
| HF (nu) | 39.90 | 18.54 | 29.08 | 9.37 | 34.78 | 13.11 | 32.37 | 17.63 | 0.5044 |
| pNN50 | 7.84 | (5.76–14.85) | 3.95 | (0.89–10.85) | 6.48 | (4.04–12.46) | 1.45 | (0.0–5.82) | 0.0126 * |
| SD1 (ms) | 20.20 | (18.40–25.15) | 17 | (14.90–22.60) | 20.20 | (17.20–23.58) | 12.65 | (8.15–19.23) | 0.0155 * |
| PNS index | −1.32 | (−1.45–(−0.87)) | −1 | (−1.62–(−0.86) | −0.87 | (−1.79–(−0.13)) | −1.82 | (−2.17-–(−1.33)) | 0.317 |
| Global variability | |||||||||
| SDNN | 39.40 | 8.40 | 32.94 | 10.07 | 33.54 | 8.14 | 26.19 | 9.27 | 0.0203 * |
| RR triangular index | 9.52 | (8.13–10.46) | 8.45 | (6.94–8.97) | 8.92 | (8.10–10.23) | 7.65 | (4.97–8.40) | 0.0509 |
| TINN | 169.40 | 26.93 | 153.20 | 41.47 | 157.90 | 35.25 | 119.80 | 38.02 | 0.0192 * |
| LF/HF | 1.64 | (1.06–3.30) | 2.61 | (1.64–3.43) | 1.49 | (1.20–3.45) | 2.67 | (0.95–4.23) | 0.6431 |
| SD2 (ms) | 48.40 | (43.80–58.75) | 43.70 | (33.45–53.35) | 46.65 | (37.90–49.15) | 34.25 | (25.18–37.25) | 0.0184 * |
| Control | Post-COVID-19 | ||||||||
|---|---|---|---|---|---|---|---|---|---|
| Groups | Non-obese + >150 min MVPA (n = 7) | Ow/Ob + <150 min MVPA (n = 6) | Non-obese + >150 min MVPA (n = 4) | Ow/Ob + <150 min MVPA (n = 8) | |||||
| Variables | Mean/ Median | SD/[IQR] | Mean/ Median | SD/[IQR] | Mean/ Median | SD/[IQR] | Mean/ Median | SD/[IQR] | p-Value |
| Sympathetic activity | |||||||||
| Mean HR | 84 | (75–87.00) | 77.5 | (70.75–81.00) | 84.5 | (63.50–94.25) | 90 | (82.50–91.00) | 0.0772 |
| Stress index | 12.9 | (10.80–15.70) | 13.4 | (12.70–16.25) | 13.05 | (11.98–14.73) | 19.6 | (15.68–23.80) | 0.0149 * |
| LF (nu) | 62.13 | (41.57–72.84) | 67.55 | (60.43–80.16) | 55.19 | (51.51–58.73) | 78.63 | (48.76–86.92) | 0.2434 |
| SNS index | 1.55 | (0.92–2.52) | 1.365 | (1.14–1.92) | 1.68 | (0.41–2.71) | 3.11 | (2.05–4.00) | 0.0237 ** |
| Parasympathetic activity | |||||||||
| Mean RR | 716 | (688.0–795.0) | 772.5 | (744.0–847.3) | 712 | (636.0–958.3) | 668.5 | (658.0–727.0) | 0.0659 |
| RMSSD | 29.4 | (26.4–34.80) | 22.8 | (20.78–31.55) | 31.25 | (25.25–34.48) | 15.8 | 9.95–27.15 | 0.0174 * |
| HF (nu) | 37.89 | (27.14–58.37) | 32.44 | (19.82–39.55) | 44.79 | (41.23–48.48) | 21.21 | (13.06–51.18) | 0.2434 |
| pNN50 | 7.84 | (6.57–14.12) | 2.475 | (0.58–10.29) | 9.47 | (4.83–15.70) | 0.5 | (0.0–5.60) | 0.0215 * |
| SD1 (ms) | 20.2 | (18.70–24.70) | 16.15 | (14.78–22.35) | 22.1 | (17.85–24.40) | 11.2 | (7.07–19.23) | 0.0174 * |
| PNS index | −1.32 | (−1.410–(−0.98)) | −0.975 | (−1.41–(−0.90)) | −1.275 | (−1.798–(−0.025)) | −1.825 | (−2.17–(−1.33)) | 0.5407 |
| Global variability | |||||||||
| SDNN | 37.4 | (33.40–44.10) | 26.2 | (23.98–39.80) | 35.5 | (31.93–41.33) | 23.6 | (17.13–27.88) | 0.0128 * |
| RR triangular index | 9.52 | (8.0–11.06) | 8.09 | (6.78–8.89) | 8.92 | (8.76–11.38) | 6.81 | (4.51–8.40) | 0.0374 * |
| TINN | 159 | (148.0–194.0) | 143 | (117.5–179.0) | 162.5 | (148.0–198.8) | 110.5 | (75.75–132.3) | 0.0123 * |
| LF/HF | 1.641 | (0.71–2.68) | 2.15 | (1.53–4.31) | 1.23 | (1.06–1.42) | 3.703 | (0.95–7.06) | 0.2434 |
| SD2 (ms) | 48.4 | (43.80–56.80) | 42 | (32.63–53.33) | 46.65 | (1.67–2.68) | 29.95 | (23.10) | 0.0198 * |
Publisher’s Note: MDPI stays neutral with regard to jurisdictional claims in published maps and institutional affiliations. |
© 2022 by the authors. Licensee MDPI, Basel, Switzerland. This article is an open access article distributed under the terms and conditions of the Creative Commons Attribution (CC BY) license (https://creativecommons.org/licenses/by/4.0/).
Share and Cite
Freire, A.P.C.F.; Lira, F.S.; Morano, A.E.v.A.; Pereira, T.; Coelho-E-Silva, M.-J.; Caseiro, A.; Christofaro, D.G.D.; Marchioto Júnior, O.; Dorneles, G.P.; Minuzzi, L.G.; et al. Role of Body Mass and Physical Activity in Autonomic Function Modulation on Post-COVID-19 Condition: An Observational Subanalysis of Fit-COVID Study. Int. J. Environ. Res. Public Health 2022, 19, 2457. https://doi.org/10.3390/ijerph19042457
Freire APCF, Lira FS, Morano AEvA, Pereira T, Coelho-E-Silva M-J, Caseiro A, Christofaro DGD, Marchioto Júnior O, Dorneles GP, Minuzzi LG, et al. Role of Body Mass and Physical Activity in Autonomic Function Modulation on Post-COVID-19 Condition: An Observational Subanalysis of Fit-COVID Study. International Journal of Environmental Research and Public Health. 2022; 19(4):2457. https://doi.org/10.3390/ijerph19042457
Chicago/Turabian StyleFreire, Ana Paula Coelho Figueira, Fabio Santos Lira, Ana Elisa von Ah Morano, Telmo Pereira, Manuel-João Coelho-E-Silva, Armando Caseiro, Diego Giulliano Destro Christofaro, Osmar Marchioto Júnior, Gilson Pires Dorneles, Luciele Guerra Minuzzi, and et al. 2022. "Role of Body Mass and Physical Activity in Autonomic Function Modulation on Post-COVID-19 Condition: An Observational Subanalysis of Fit-COVID Study" International Journal of Environmental Research and Public Health 19, no. 4: 2457. https://doi.org/10.3390/ijerph19042457