
Assessing and Qualifying Neighborhood Walkability for Older Adults: Construction and Initial Testing of a Multivariate Spatial Accessibility Model


Abstract
1. Introduction
2. Methods
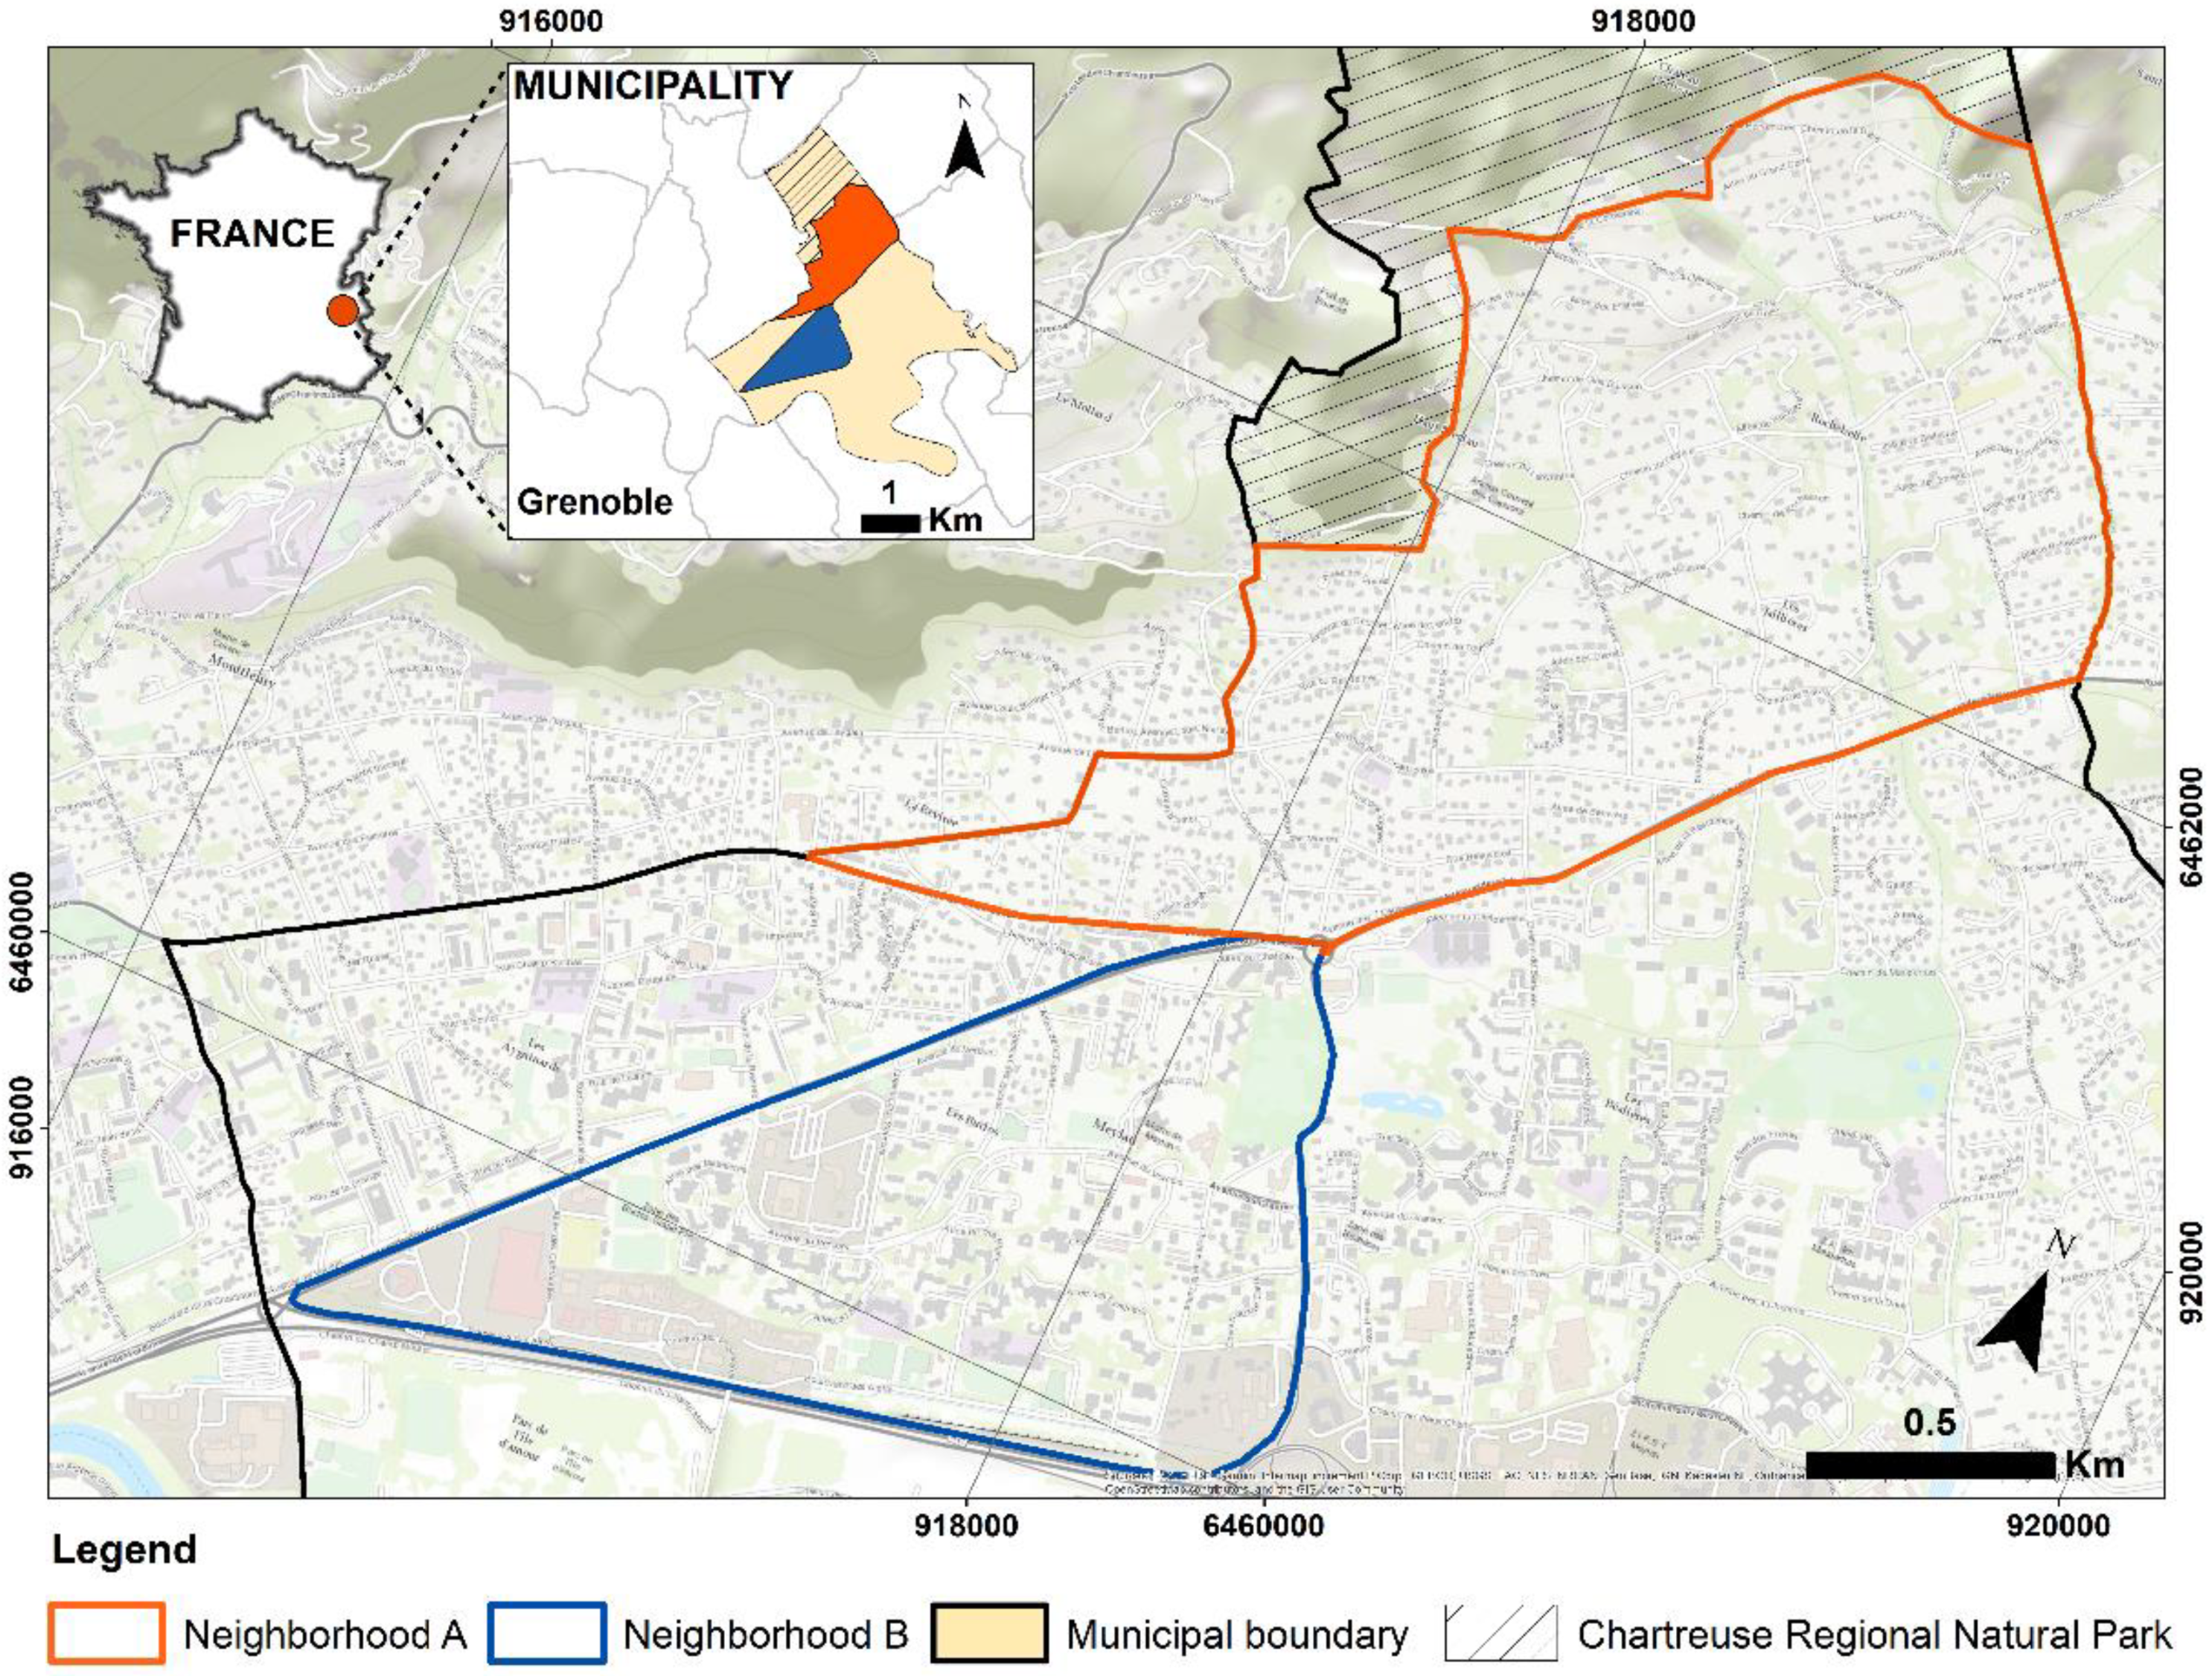
2.1. Study Area
2.2. Analysis Variables
2.2.1. Data Sources
2.2.2. Pedestrian Network
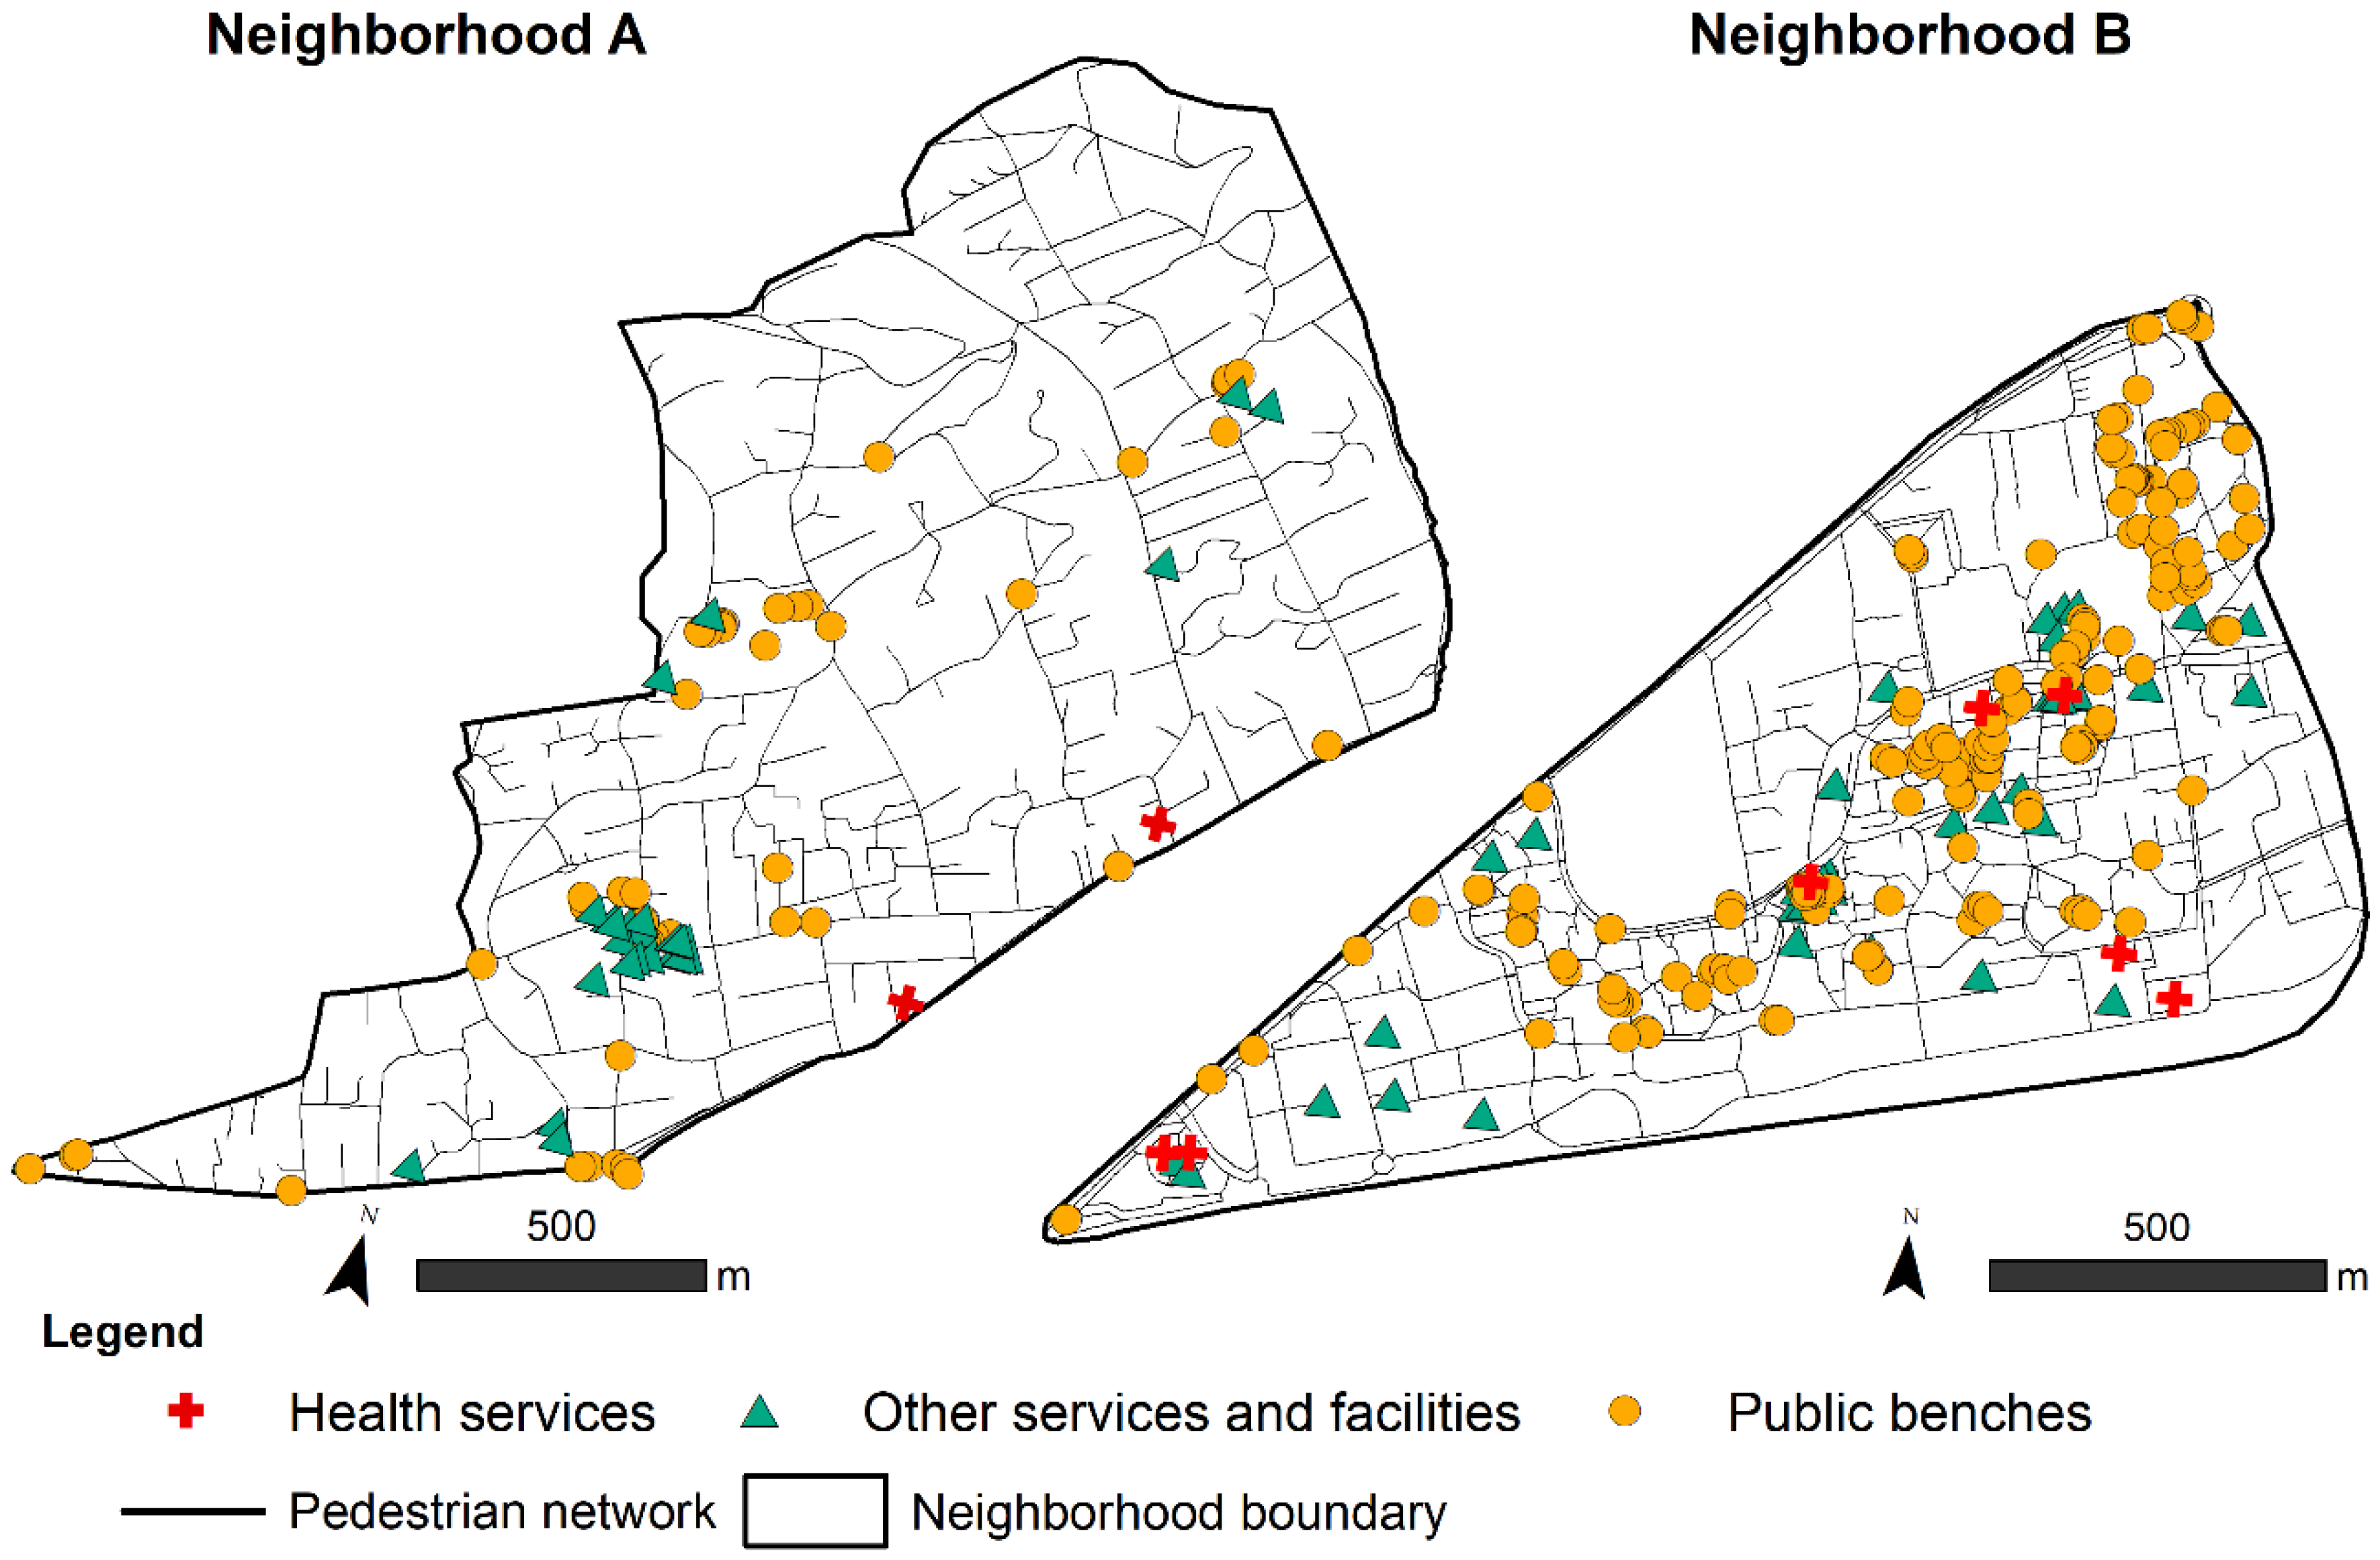
2.2.3. Services and Facilities
2.2.4. Urban Furniture: The Case of Public Benches
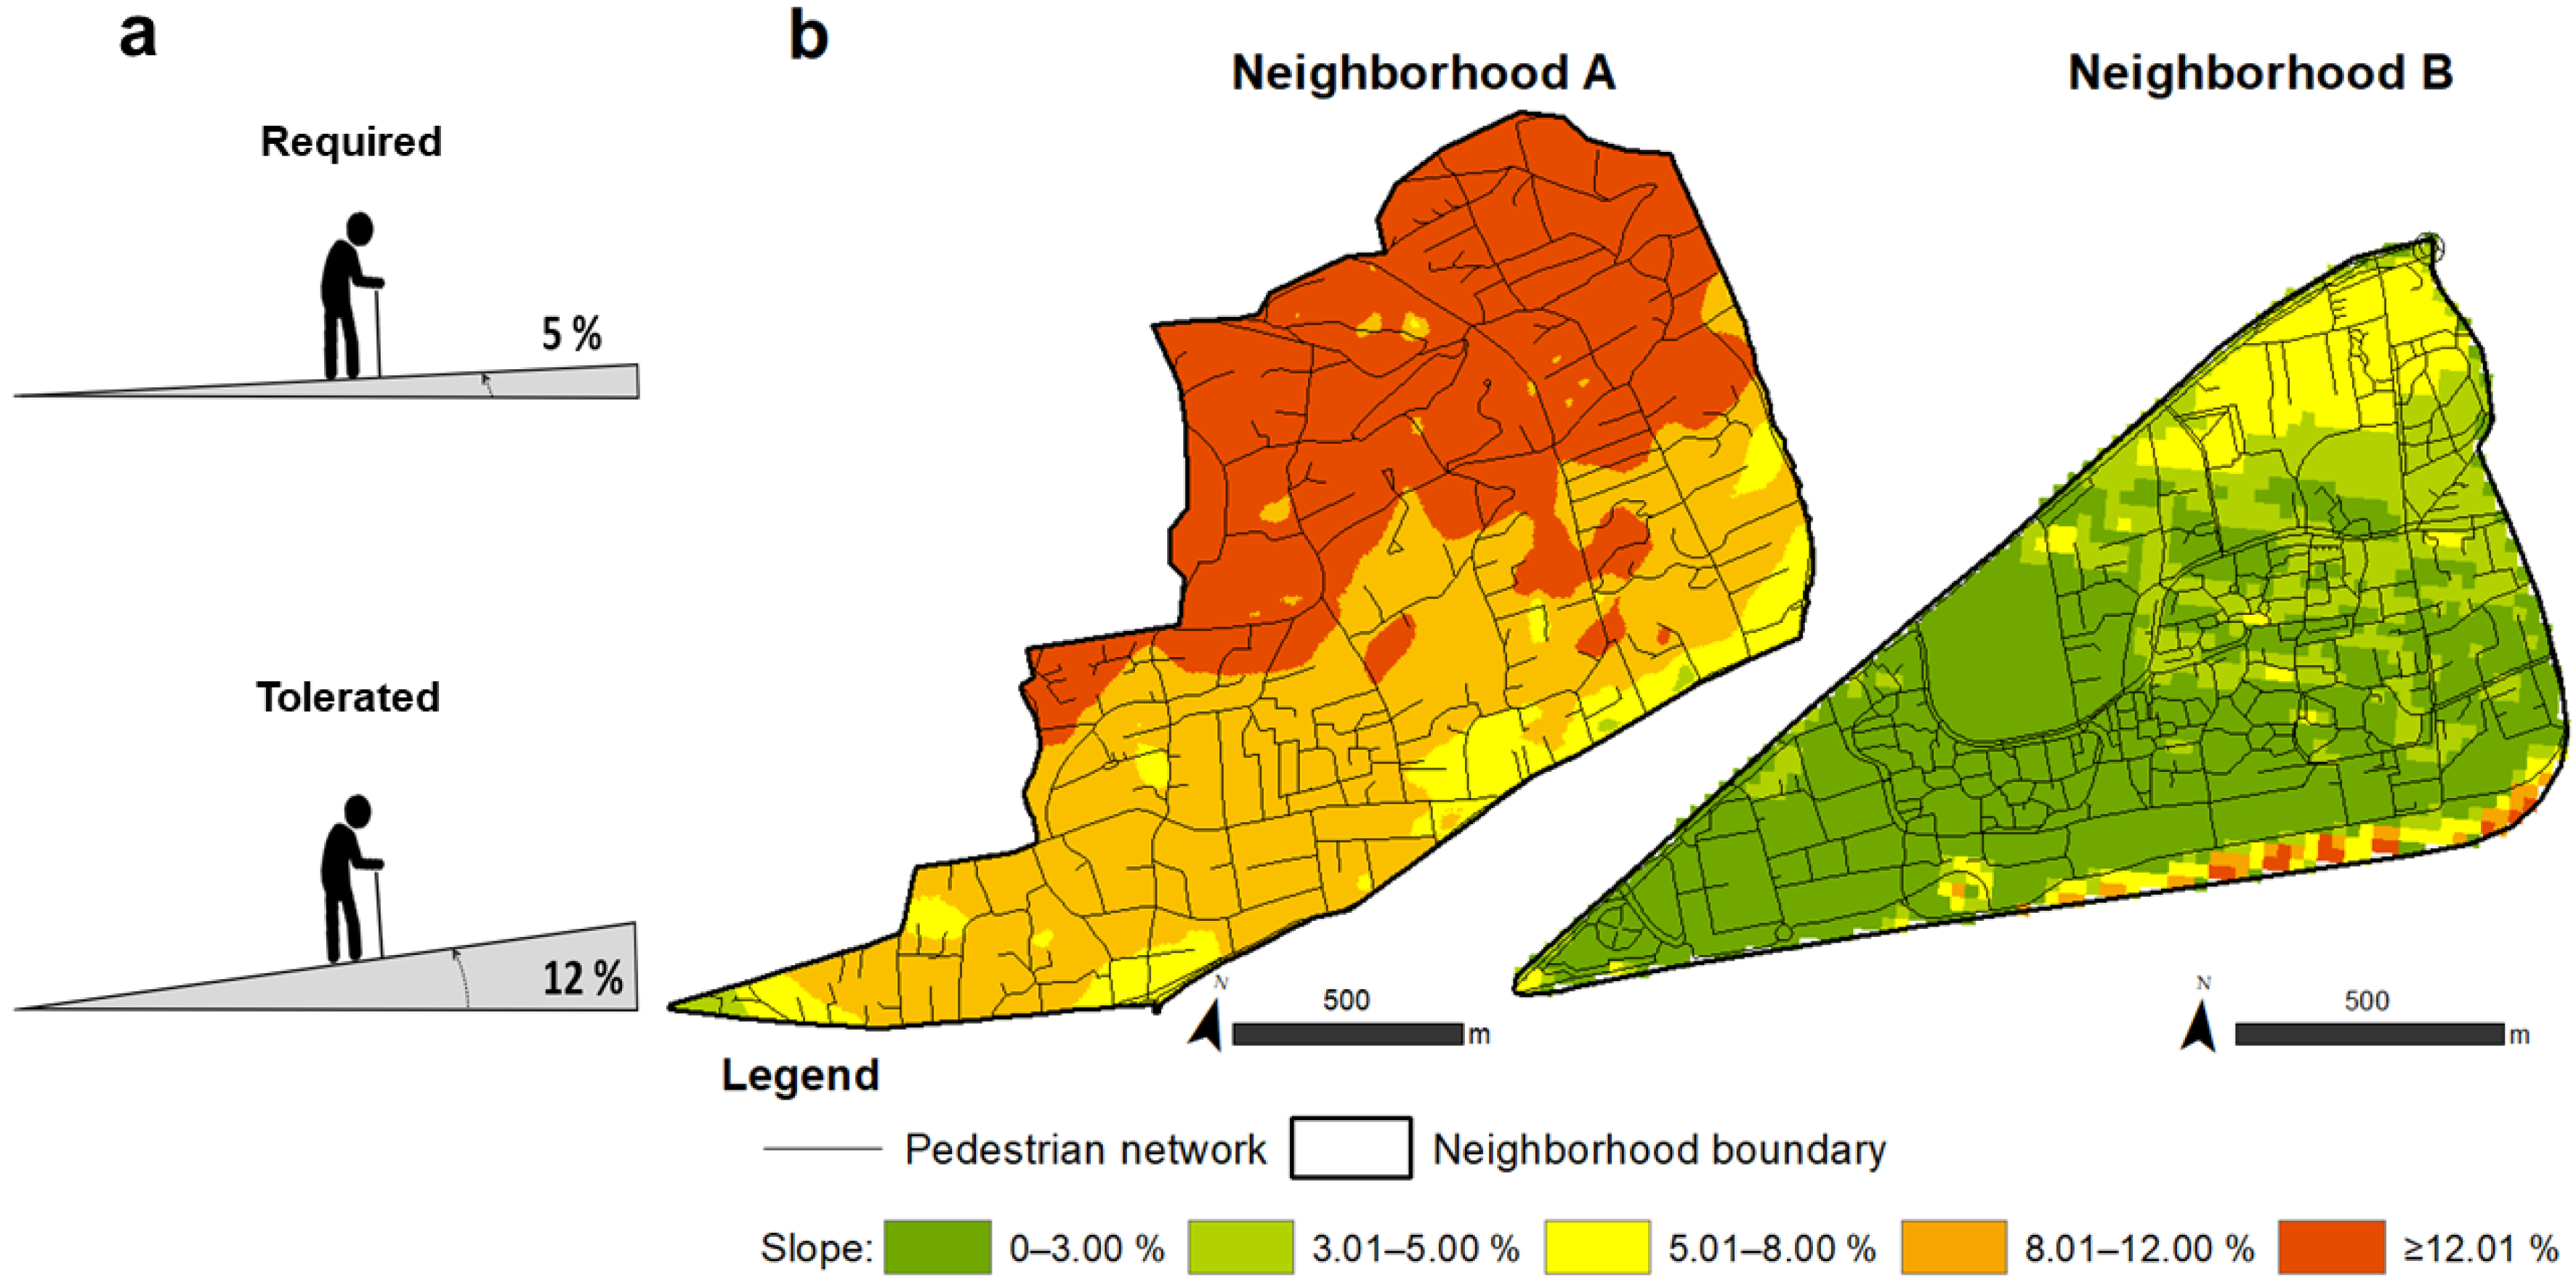
2.2.5. Slopes and Gradients
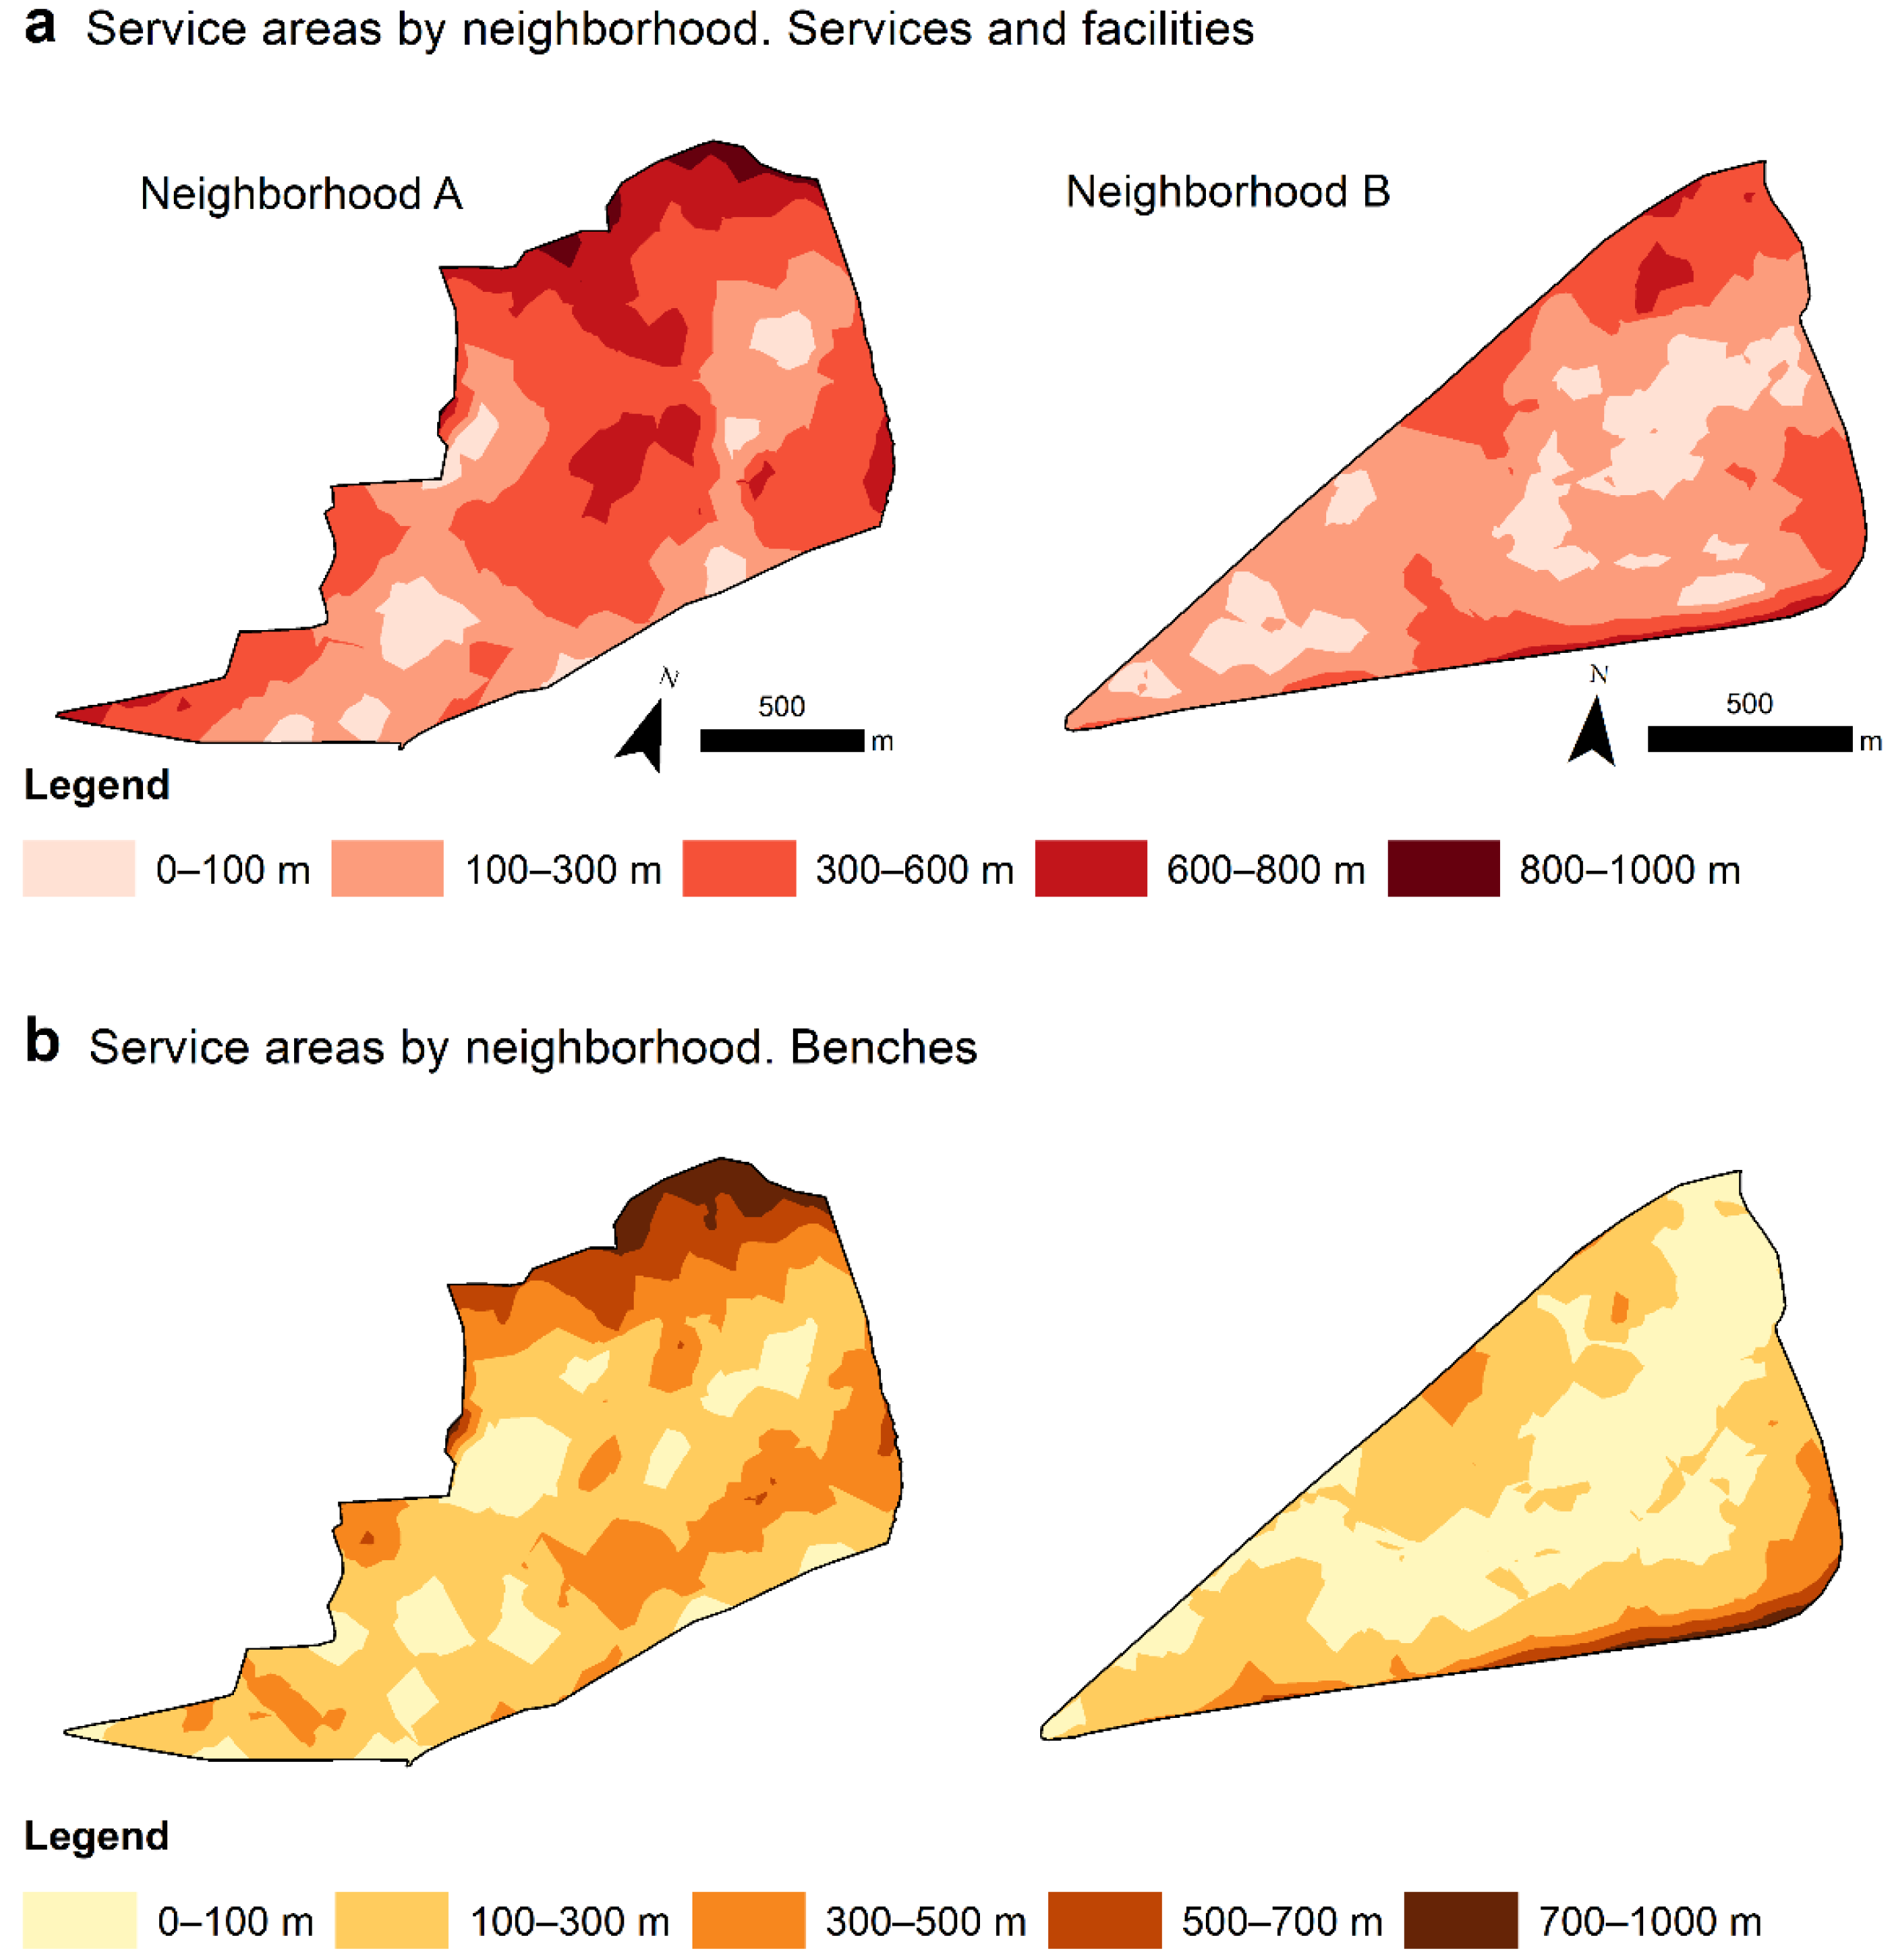
2.3. Proximity Based on Service Areas
2.4. Map Algebra to Identify Potentially Accessible Areas
2.4.1. Older Adult Profiles
Profile 1: Healthy Older Adults
Profile 2: Older Adults with Chronic Disease (The Case of Diabetes)
Profile 3: Older Adults with Reduced Mobility Which Use an Assistive Mobility Device (Cane, Walker, and/or Crutches)
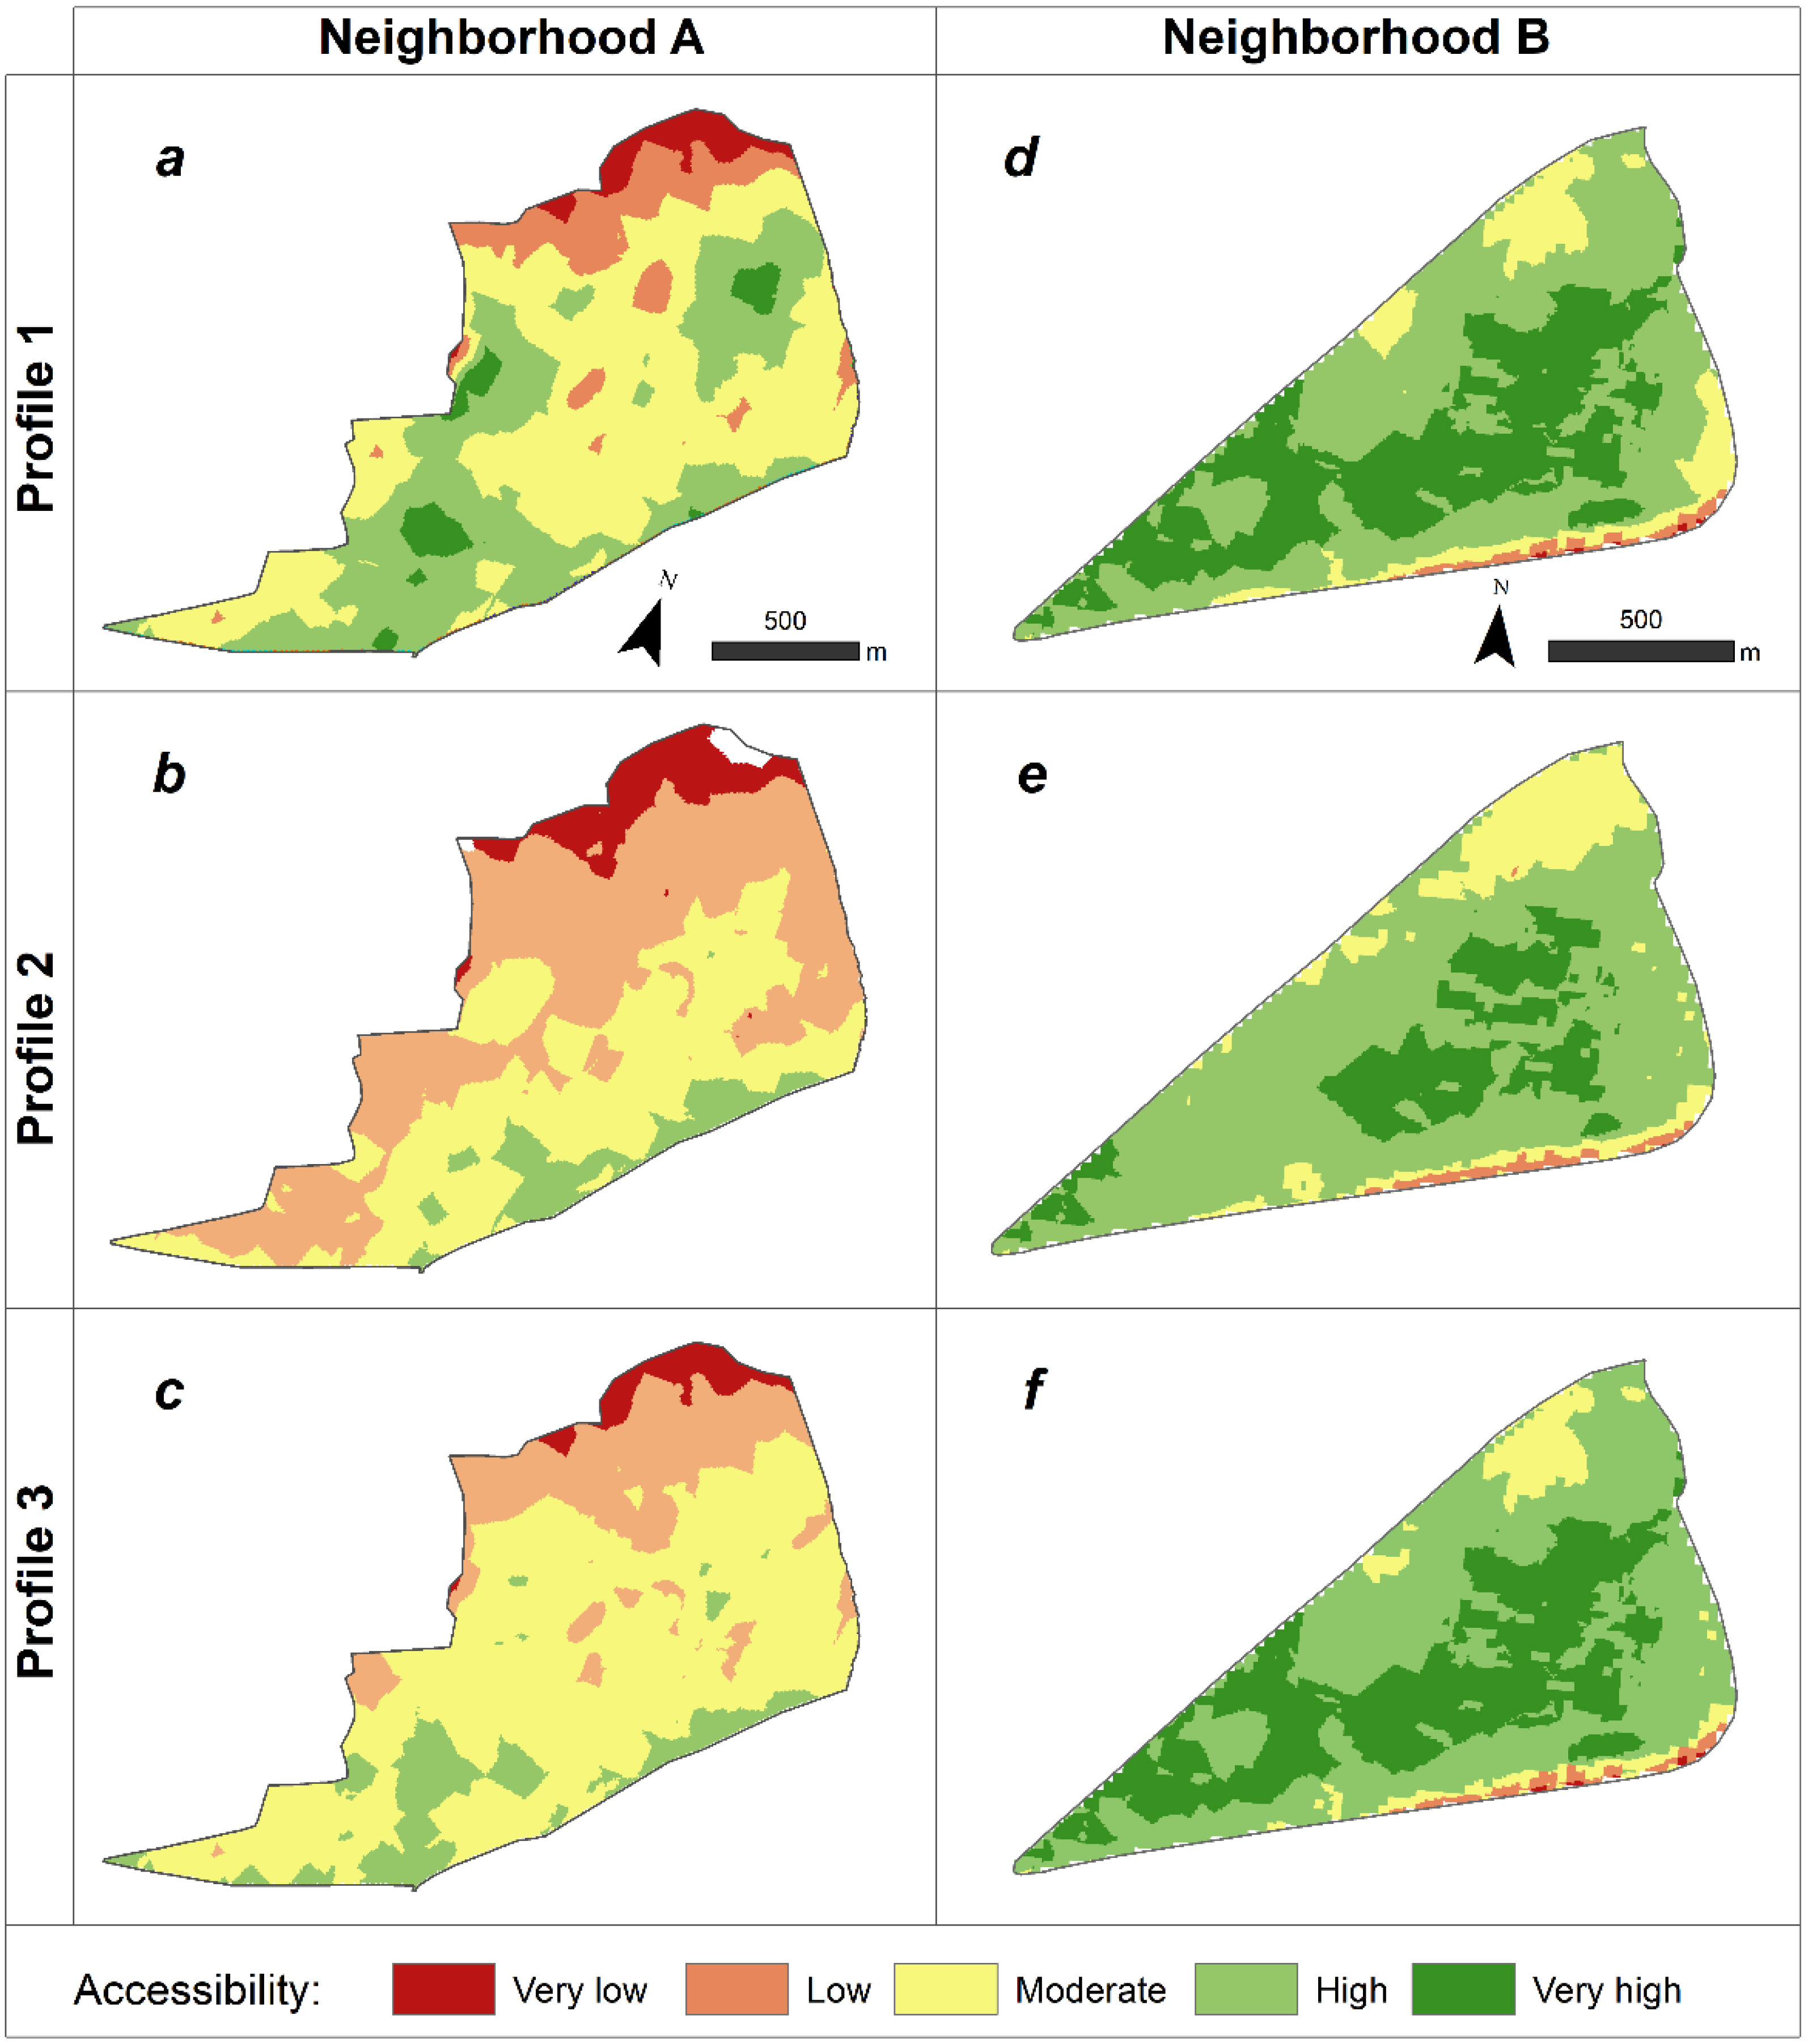
3. Results
Accessibility by Older Adult Profile
4. Discussion
5. Conclusions
Author Contributions
Funding
Institutional Review Board Statement
Informed Consent Statement
Data Availability Statement
Conflicts of Interest
References
- United Nations World Population Prospects—Population Division—United Nations; Department of Economic and Social Affairs. 2019. Available online: https://population.un.org/wpp/ (accessed on 12 November 2020).
- Lord, S.; Piché, D. Vieillissement et Aménagement: Perspectives Plurielles; Les Presses de l’Université de Montréal: Montreal, QC, Canada, 2018; ISBN 978-2-7606-3833-4. [Google Scholar]
- Buffel, T.; Phillipson, C.; Scharf, T. Ageing in Urban Environments: Developing “age-Friendly” Cities. Crit. Soc. Policy 2012, 32, 597–617. [Google Scholar] [CrossRef]
- Bonaccorsi, G.; Manzi, F.; Del Riccio, M.; Setola, N.; Naldi, E.; Milani, C.; Giorgetti, D.; Dellisanti, C.; Lorini, C. Impact of the Built Environment and the Neighborhood in Promoting the Physical Activity and the Healthy Aging in Older People: An Umbrella Review. Int. J. Environ. Res. Public Health 2020, 17, 6127. [Google Scholar] [CrossRef] [PubMed]
- Van Cauwenberg, J.; Nathan, A.; Barnett, A.; Barnett, D.W.; Cerin, E.; Council on Environment and Physical Activity (CEPA)-Older Adults Working Group. Relationships Between Neighbourhood Physical Environmental Attributes and Older Adults’ Leisure-Time Physical Activity: A Systematic Review and Meta-Analysis. Sports Med. 2018, 48, 1635–1660. [Google Scholar] [CrossRef]
- Rosso, A.; Auchincloss, A.; Michael, Y. The Urban Built Environment and Mobility in Older Adults: A Comprehensive Review. J. Aging Res. 2011, 2011, 816106. [Google Scholar] [CrossRef]
- Gwiazdzinski, L.; Chibane, S. Analyse de La Marchabilité Dans Les Espaces Urbains et Périurbains. Le Cas de La Métropole Grenobloise. Géocarrefour 2015, 90, 187–201. [Google Scholar]
- Barnett, D.W.; Barnett, A.; Nathan, A.; Van Cauwenberg, J.; Cerin, E. Council on Environment and Physical Activity (CEPA)—Older Adults working group Built Environmental Correlates of Older Adults’ Total Physical Activity and Walking: A Systematic Review and Meta-Analysis. Int. J. Behav. Nutr. Phys. Act. 2017, 14, 103. [Google Scholar] [CrossRef]
- Cerin, E.; Nathan, A.; van Cauwenberg, J.; Barnett, D.W.; Barnett, A. Council on Environment and Physical Activity (CEPA)—Older Adults working group The Neighbourhood Physical Environment and Active Travel in Older Adults: A Systematic Review and Meta-Analysis. Int. J. Behav. Nutr. Phys. Act. 2017, 14, 15. [Google Scholar] [CrossRef]
- Heam, A.S.; Dejeammes, M. L’insécurité Routière des Piétons Agés a Travers le Système Mobilité—Urbanisme—Réseau; Centre D’études sur les Réseaux, les Transports, L’urbanisme et les Constructions Publiques (CERTU). 2000, p. 80. Available online: https://hal-lara.archives-ouvertes.fr/hal-02150463/document (accessed on 15 July 2021).
- Raulin, F.; Lord, S.; Negron-Poblete, P. Évaluation de la marchabilité de trois environnements urbains de la région métropolitaine montréalaise à partir de l’outil MAPPA. VertigO 2016, 16. [Google Scholar] [CrossRef]
- Huguenin-Richard, F.; Dommes, A.; Granié, M.-A.; Cloutier, M.-S.; Coquelet, C. La Marche à Pied Chez Les Personnes Âgées: Enjeux de Mobilité et de Sécurité [Walking for Older Adults: Questions of Mobility and Security]. HAL. 2014. Available online: https://hal.archives-ouvertes.fr/hal-01358987/document (accessed on 18 November 2020).
- Carlin, T.; Vuillerme, N. Step and Distance Measurement From a Low-Cost Consumer-Based Hip and Wrist Activity Monitor: Protocol for a Validity and Reliability Assessment. JMIR Res. Protoc. 2021, 10, e21262. [Google Scholar] [CrossRef] [PubMed]
- Ó. Breasail, M.; Biswas, B.; Smith, M.D.; Mazhar, M.K.A.; Tenison, E.; Cullen, A.; Lithander, F.E.; Roudaut, A.; Henderson, E.J. Wearable GPS and Accelerometer Technologies for Monitoring Mobility and Physical Activity in Neurodegenerative Disorders: A Systematic Review. Sensors 2021, 21, 8261. [Google Scholar] [CrossRef]
- Boyer, K.A.; Johnson, R.T.; Banks, J.J.; Jewell, C.; Hafer, J.F. Systematic Review and Meta-Analysis of Gait Mechanics in Young and Older Adults. Exp. Gerontol. 2017, 95, 63–70. [Google Scholar] [CrossRef] [PubMed]
- Anton, S.D.; Cruz-Almeida, Y.; Singh, A.; Alpert, J.; Bensadon, B.; Cabrera, M.; Clark, D.J.; Ebner, N.C.; Esser, K.A.; Fillingim, R.B.; et al. Innovations in Geroscience to Enhance Mobility in Older Adults. Exp. Gerontol. 2020, 142, 111123. [Google Scholar] [CrossRef] [PubMed]
- WHO. Global Age-Friendly Cities: A Guide; WHO: Geneva, Switzerland, 2007; Available online: https://www.who.int/ageing/publications/Global_age_friendly_cities_Guide_English.pdf (accessed on 18 November 2020).
- Geurs, K.T.; van Wee, B. Accessibility Evaluation of Land-Use and Transport Strategies: Review and Research Directions. J. Transp. Geogr. 2004, 12, 127–140. [Google Scholar] [CrossRef]
- Chen, Y.; Bouferguene, A.; Shirgaokar, M.; Al-Hussein, M. Spatial Analysis Framework for Age-Restricted Communities Integrating Spatial Distribution and Accessibility Evaluation. J. Urban Plan. Dev. 2020, 146, 04019021. [Google Scholar] [CrossRef]
- Hansen, W.G. How Accessibility Shapes Land Use. J. Am. Inst. Plan. 1959, 25, 73–76. [Google Scholar] [CrossRef]
- Handy, S.L.; Niemeier, D.A. Measuring Accessibility: An Exploration of Issues and Alternatives. Environ. Plan A 1997, 29, 1175–1194. [Google Scholar] [CrossRef]
- Ihantamalala, F.A.; Herbreteau, V.; Révillion, C.; Randriamihaja, M.; Commins, J.; Andréambeloson, T.; Rafenoarimalala, F.H.; Randrianambinina, A.; Cordier, L.F.; Bonds, M.H.; et al. Improving Geographical Accessibility Modeling for Operational Use by Local Health Actors. Int. J. Health Geogr. 2020, 19, 27. [Google Scholar] [CrossRef]
- Blanford, J.I.; Kumar, S.; Luo, W.; MacEachren, A.M. It’s a Long, Long Walk: Accessibility to Hospitals, Maternity and Integrated Health Centers in Niger. Int. J. Health Geogr. 2012, 11, 24. [Google Scholar] [CrossRef]
- Santana-Santana, S.B.; Peña-Alonso, C.; Pérez-Chacón Espino, E. Assessing Physical Accessibility Conditions to Tourist Attractions. The Case of Maspalomas Costa Canaria Urban Area (Gran Canaria, Spain). Appl. Geogr. 2020, 125, 102327. [Google Scholar] [CrossRef]
- Leung, M.; Chow, C.B.; Ip, P.-K.P.; Yip, S.-F.P. Geographical Accessibility of Community Social Services and Incidence of Self-Harm. Spat. Spatio-Temporal Epidemiol. 2020, 33, 100334. [Google Scholar] [CrossRef]
- Burns, C.M.; Inglis, A.D. Measuring Food Access in Melbourne: Access to Healthy and Fast Foods by Car, Bus and Foot in an Urban Municipality in Melbourne. Health Place 2007, 13, 877–885. [Google Scholar] [CrossRef]
- Pearce, J.; Blakely, T.; Witten, K.; Bartie, P. Neighborhood Deprivation and Access to Fast-Food Retailing: A National Study. Am. J. Prev. Med. 2007, 32, 375–382. [Google Scholar] [CrossRef]
- Özer, Ö. Accessibility of Spatial Networks: Using ArcGIS Network Analyst and Space Syntax to Investigate Accessibility to Urban Facilities. 2017. Available online: https://www.researchgate.net/publication/324910409_Accessibility_of_Spatial_Networks_Using_ArcGIS_network_analyst_and_space_syntax_to_investigate_accessibility_to_urban_facilities (accessed on 3 December 2020).
- López-Lara, E.; Garrido-Cumbrera, M.; Díaz-Cuevas, M.P. Improving Territorial Accessibility of Mental Health Services: The Case of Spain. Eur. J. Psychiatry 2012, 26, 227–235. [Google Scholar] [CrossRef][Green Version]
- Cheng, L.; Yang, M.; De Vos, J.; Witlox, F. Examining Geographical Accessibility to Multi-Tier Hospital Care Services for the Elderly: A Focus on Spatial Equity. J. Transp. Health 2020, 19, 100926. [Google Scholar] [CrossRef]
- Engels, B.; Liu, G.-J. Social Exclusion, Location and Transport Disadvantage amongst Non-Driving Seniors in a Melbourne Municipality, Australia. J. Transp. Geogr. 2011, 19, 984–996. [Google Scholar] [CrossRef]
- Zhou, P.; Hughes, A.K.; Grady, S.C.; Fang, L. Physical Activity and Chronic Diseases among Older People in a Mid-Size City in China: A Longitudinal Investigation of Bipolar Effects. BMC Public Health 2018, 18, 486. [Google Scholar] [CrossRef]
- Van Cauwenberg, J.; Van Holle, V.; Simons, D.; Deridder, R.; Clarys, P.; Goubert, L.; Nasar, J.; Salmon, J.; De Bourdeaudhuij, I.; Deforche, B. Environmental Factors Influencing Older Adults’ Walking for Transportation: A Study Using Walk-along Interviews. Int. J. Behav. Nutr. Phys. Act. 2012, 9, 85. [Google Scholar] [CrossRef] [PubMed]
- Ottoni, C.A.; Sims-Gould, J.; Winters, M.; Heijnen, M.; McKay, H.A. “Benches Become like Porches”: Built and Social Environment Influences on Older Adults’ Experiences of Mobility and Well-Being. Soc. Sci. Med. 2016, 169, 33–41. [Google Scholar] [CrossRef]
- Gadais, T.; Boulanger, M.; Trudeau, F.; Rivard, M.-C. Environments Favorable to Healthy Lifestyles: A Systematic Review of Initiatives in Canada. J. Sport Health Sci. 2018, 7, 7–18. [Google Scholar] [CrossRef]
- Wallach, I. Diversité et vieillissement. Frontières 2012, 25, 5. [Google Scholar] [CrossRef]
- De Lapasse, B. Fiche d’Analyse de l’Observatoire des Territoires. 2018, p. 18. Available online: https://www.observatoire-des-territoires.gouv.fr/sites/default/files/2019-11/le_vieillissement_de_la_population_et_ses_enjeux_0.pdf (accessed on 10 January 2022).
- PLUI, X. Ville de XXXX—Plan Local D’urbanisme Intercommunal—Rapport De Présentation—Approuvé le 02/04/2012 Modification Simplifiée n°3—Approuvé le 15 Decembre 2014. 2014. Available online: https://www.ambertlivradoisforez.fr/wp-content/uploads/2019/02/Dispositions-compl%C3%A9mentaires.pdf (accessed on 8 September 2020).
- Insee Dossier Complet—Commune de XXXX (38229)—Insee. Available online: https://www.insee.fr/fr/statistiques/2011101?geo=COM-38229 (accessed on 2 March 2021).
- Villeneuve, P.J.; Ysseldyk, R.L.; Root, A.; Ambrose, S.; DiMuzio, J.; Kumar, N.; Shehata, M.; Xi, M.; Seed, E.; Li, X.; et al. Comparing the Normalized Difference Vegetation Index with the Google Street View Measure of Vegetation to Assess Associations between Greenness, Walkability, Recreational Physical Activity, and Health in Ottawa, Canada. Int. J. Environ. Res. Public Health 2018, 15, 1719. [Google Scholar] [CrossRef] [PubMed]
- Rosenberg, D.E.; Huang, D.L.; Simonovich, S.D.; Belza, B. Outdoor Built Environment Barriers and Facilitators to Activity among Midlife and Older Adults with Mobility Disabilities. Gerontologist 2013, 53, 268–279. [Google Scholar] [CrossRef]
- Delclòs-Alió, X.; Marquet, O.; Vich, G.; Schipperijn, J.; Zhang, K.; Maciejewska, M.; Miralles-Guasch, C. Temperature and Rain Moderate the Effect of Neighborhood Walkability on Walking Time for Seniors in Barcelona. Int. J. Environ. Res. Public Health 2020, 17, 14. [Google Scholar] [CrossRef]
- Zhou, P.; Grady, S.C.; Chen, G. How the Built Environment Affects Change in Older People’s Physical Activity: A Mixed- Methods Approach Using Longitudinal Health Survey Data in Urban China. Soc. Sci. Med. 2017, 192, 74–84. [Google Scholar] [CrossRef]
- Goldman, L.; Owusu, S.; Smith, C.; Martens, D.; Lynch, M. Age-friendly New York city: A case study. In Age-Friendly Cities in International Comparison: Political Lessons, Scientific Avenues and Democratic Issues; Moulaert, T., Garon, S., Eds.; Springer: New York, NY, USA, 2016; pp. 171–190. [Google Scholar]
- Leuba, J.; Bucheli, D. Bancs Publics. Concept D’évaluation de L’offre et des Besoins dans Huit Quartiers de Lausanne; Mobilité piétonne Suisse: Laussane, Switzerland, 2015; p. 40. Available online: https://mobilitepietonne.ch/wordpress/wp-content/uploads/2016/07/Concept-bancs-publics_2015_Lausanne_web.pdf (accessed on 20 December 2020).
- Bancs de Service Public. Supplément D’Architectures. 2015. Available online: https://pmbdoc.eivp-paris.fr/opac/index.php?lvl=notice_display&id=20942 (accessed on 20 December 2020).
- Ståhl, A.; Carlsson, G.; Hovbrandt, P.; Iwarsson, S. “Let’s Go for a Walk!”: Identification and Prioritisation of Accessibility and Safety Measures Involving Elderly People in a Residential Area. Eur. J. Ageing 2008, 5, 265–273. [Google Scholar] [CrossRef] [PubMed]
- Moulaert, T. Citizenbench: Des Bancs Pour Les Aînés ? Territoires, Vieillissements et Pratiques Citoyennes [Citizenbench: Benches for Older Adults? Territories, Ageing and Citizenship Practices] 2020. Available online: https://www.pacte-grenoble.fr/programmes/citizenbench-des-bancs-pour-les-aines (accessed on 20 December 2020).
- Brookfield, K.; Ward Thompson, C.; Scott, I. The Uncommon Impact of Common Environmental Details on Walking in Older Adults. Int. J. Environ. Res. Public Health 2017, 14, 190. [Google Scholar] [CrossRef]
- Carlier, E.; Ganaire, E.; Grenu, L.; Halgrain, S.; Henique, J. Le Banc-Relais. Préconisations pour un développement de l’implantation des bancs dans l’espace public métropolitain. In Cahier n°1; Agence de Développement Et D’urbanisme de Lille Métropole, Métropole Européenne de Lille: Lille, France, 2017; Available online: https://www.adu-lille-metropole.org/wp-content/uploads/2021/05/Cahier1bancrelais.pdf (accessed on 15 January 2021).
- Amaya, V. Construction d’un Modèle Hypothétique d’accessibilité Potentielle à l’espace Public Pour Les Aînés: Études de Cas Sur Les Bancs Publics [Construction of a Hypothetical Model of Potential Accessibility to Public Space for the Older Adults: Case Studies on Public Benches]. Master’s Thesis, Université Alpes, Saint-Martin-d’Hères, France, 2020. [Google Scholar]
- Moran, M.; Van Cauwenberg, J.; Hercky-Linnewiel, R.; Cerin, E.; Deforche, B.; Plaut, P. Understanding the Relationships between the Physical Environment and Physical Activity in Older Adults: A Systematic Review of Qualitative Studies. Int. J. Behav. Nutr. Phys. Act. 2014, 11, 79. [Google Scholar] [CrossRef]
- Bruyere, L. L’accessibilité à la voirie. L’essentiel de la réglementation et son actualité; Direction technique Territoires et ville CEREMA: Poitiers, France, 2014; p. 65. Available online: https://docplayer.fr/63625921-L-accessibilite-a-la-voirie.html (accessed on 23 April 2021).
- Charreire, H.; Simon, C.; Chaix, B.; Casey, R.; Salze, P.; Giacoman, C.; Banos, A.; Badariotti, D.; Fischler, C.; Weber, C.; et al. Comment évaluer l’environnement alimentaire à l’aide des systèmes d’information Géographique ? Revue méthodologique. Cah. Nutr. Diététique 2011, 46, 111–119. [Google Scholar] [CrossRef]
- Murad, A. Using GIS for Determining Variations in Health Access in Jeddah City, Saudi Arabia. ISPRS Int. J. Geo-Inf. 2018, 7, 254. [Google Scholar] [CrossRef]
- Malik, N.A.; Shaikh, M.A. Spatial Distribution and Accessibility to Public Sector Tertiary Care Teaching Hospitals: Case Study from Pakistan. East Mediterr. Health J. 2019, 25, 431–434. [Google Scholar] [CrossRef] [PubMed]
- Tome, A.; Santos, B.; Carvalheira, C. GIS-Based Transport Accessibility Analysis to Community Facilities in Mid-Sized Cities. IOP Conf. Ser. Mater. Sci. Eng. 2019, 471, 062034. [Google Scholar] [CrossRef]
- Nadja, V. Evaluation des Déplacements Piétons Quotidiens Application A La Ville De Luxembourg; Universite De Lyon, Ecole Doctorale Sciences Sociales: Lyon, France, 2016. [Google Scholar]
- Biazzo, I.; Monechi, B.; Loreto, V. General Scores for Accessibility and Inequality Measures in Urban Areas. R. Soc. Open Sci. 2019, 6, 190979. [Google Scholar] [CrossRef]
- Franke, T.; Tong, C.; Ashe, M.C.; McKay, H.; Sims-Gould, J. The Secrets of Highly Active Older Adults. J. Aging Stud. 2013, 27, 398–409. [Google Scholar] [CrossRef] [PubMed]
- Prescott, M.; Miller, W.C.; Routhier, F.; Mortenson, W.B. Factors Affecting the Activity Spaces of People Who Use Mobility Devices to Get around the Community. Health Place 2020, 64, 102375. [Google Scholar] [CrossRef]
- Eastman, J.R.; Jin, W.; Kyem, P.; Toledano, J. Raster Procedures for Multi-Criteria/Multi-Objective Decisions. Photogramm. Eng. Remote Sens. 1995, 61, 539–547. [Google Scholar]
- Chapon, P.-M.; Renard, F.; Gueslot, J.; Dautan, M.; Robert, P.; Guérin, O. Analyse des territoires de vie et de la mobilité de personnes âgées au moyen de traceurs GPS [Analysis of the Areas of Life and the Mobility of Elderly Persons using GPS Trackers]. Ann. De Géographie 2011, 679, 320–333. [Google Scholar] [CrossRef]
- Chaudhury, H.; Campo, M.; Michael, Y.; Mahmood, A. Neighbourhood Environment and Physical Activity in Older Adults. Soc. Sci. Med. 2016, 149, 104–113. [Google Scholar] [CrossRef]
- Hand, C.; Huot, S.; Laliberte Rudman, D.; Wijekoon, S. Qualitative-Geospatial Methods of Exploring Person-Place Transactions in Aging Adults: A Scoping Review. Gerontologist 2017, 57, e47–e61. [Google Scholar] [CrossRef]
- Parekh, R.; Maleku, A.; Fields, N.; Adorno, G.; Schuman, D.; Felderhoff, B. Pathways to Age-Friendly Communities in Diverse Urban Neighborhoods: Do Social Capital and Social Cohesion Matter? J. Gerontol. Soc. Work. 2018, 61, 492–512. [Google Scholar] [CrossRef]
- Paumard, C. Les bénéfices de l’activité physique dans les pathologies chroniques. NPG Neurol.—Psychiatr.—Gériatrie 2014, 14, 201–208. [Google Scholar] [CrossRef]
- Manini, T.M.; Pahor, M. Physical Activity and Maintaining Physical Function in Older Adults. Br. J. Sports Med. 2009, 43, 28–31. [Google Scholar] [CrossRef]
- Fagot-Campagna, A.; Bourdel-Marchasson, I.; Simon, D. Burden of Diabetes in an Aging Population: Prevalence, Incidence, Mortality, Characteristics and Quality of Care. Diabetes Metab. 2005, 31, 5S35–5S52. [Google Scholar] [CrossRef]
- Doucet, J.; Bordier, L.; Marinari, A.; Proux, A.; Bauduceau, B. Faut-il adapter les médicaments antidiabétiques et cardiovasculaires chez la personne âgée diabétique ? Médecine Des Mal. Métaboliques 2013, 7, 533–537. [Google Scholar] [CrossRef]
- West, B.A.; Bhat, G.; Stevens, J.; Bergen, G. Assistive Device Use and Mobility-Related Factors among Adults Aged ≥ 65 Years. J. Saf. Res. 2015, 55, 147–150. [Google Scholar] [CrossRef]
- Caradec, V. L’expérience sociale du vieillissement. Idees Econ. Soc. 2009, 157, 38–45. [Google Scholar] [CrossRef]
- Schreuer, N.; Plaut, P.; Golan, L.; Sachs, D. The Relations between Walkable Neighbourhoods and Active Participation in Daily Activities of People with Disabilities. J. Transp. Health 2019, 15, 100630. [Google Scholar] [CrossRef]
- Buffel, T.; Verté, D.; Donder, L.D.; Witte, N.D.; Dury, S.; Vanwing, T.; Bolsenbroek, A. Theorising the Relationship between Older People and Their Immediate Social Living Environment. Int. J. Lifelong Educ. 2012, 31, 13–32. [Google Scholar] [CrossRef]
- Gardner, P.J. Natural Neighborhood Networks—Important Social Networks in the Lives of Older Adults Aging in Place. J. Aging Stud. 2011, 25, 263–271. [Google Scholar] [CrossRef]
- Unal, M.; Uslu, C. GIS-based accessibility analysis of urban emergency shelters: The case of Adana city. Proc. ISPRS—Int. Arch. Photogramm. Remote Sens. Spat. Inf. Sci. 2016, XLII–2/W1, 95–101. [Google Scholar] [CrossRef]
- Verderber, S. Preventing Chronic Disease among the Aged: A Call for Evidence-Based Design Research. HERD Health Environ. Res. Des. J. 2009, 2, 71–83. [Google Scholar] [CrossRef]
- Zhang, F.; Li, D.; Chan, A.P.C. Diverse Contributions of Multiple Mediators to the Impact of Perceived Neighborhood Environment on the Overall Quality of Life of Community-Dwelling Seniors: A Cross-Sectional Study in Nanjing, China. Habitat Int. 2020, 104, 102253. [Google Scholar] [CrossRef]
- Viriot-Durandal, J.-P.; Scheider, M. La démarche Villes et communautés amies des aînés. Quand vieillir devient un enjeu international pour les sociétés contemporaines. Vie Soc. 2016, 16, 177–194. [Google Scholar] [CrossRef]
- Wennberg, H.; Phillips, J.; Ståhl, A. How Older People as Pedestrians Perceive the Outdoor Environment—Methodological Issues Derived from Studies in Two European Countries. Ageing Soc. 2018, 38, 2435–2467. [Google Scholar] [CrossRef] [PubMed]
- Tucker, P.; Gilliland, J. The Effect of Season and Weather on Physical Activity: A Systematic Review. Public Health 2007, 121, 909–922. [Google Scholar] [CrossRef] [PubMed]
- Akande, V.O.; Ruiter, R.A.C.; Kremers, S.P.J. Environmental and Motivational Determinants of Physical Activity among Canadian Inuit in the Arctic. Int. J. Environ. Res. Public Health 2019, 16, 2437. [Google Scholar] [CrossRef]
- Chapman, D.; Nilsson, K.L.; Rizzo, A.; Larsson, A. Winter City Urbanism: Enabling All Year Connectivity for Soft Mobility. Int. J. Environ. Res. Public Health 2019, 16, 1820. [Google Scholar] [CrossRef] [PubMed]
- Mueller, W.; Wilkinson, P.; Milner, J.; Vardoulakis, S.; Steinle, S.; Pärkkä, J.; Parmes, E.; Cluitmans, L.; Kuijpers, E.; Pronk, A.; et al. Neighbourhood and Path-Based Greenspace in Three European Countries: Associations with Objective Physical Activity. BMC Public Health 2021, 21, 282. [Google Scholar] [CrossRef] [PubMed]
- Hörder, H.; Skoog, I.; Frändin, K. Health-Related Quality of Life in Relation to Walking Habits and Fitness: A Population-Based Study of 75-Year-Olds. Qual Life Res. 2013, 22, 1213–1223. [Google Scholar] [CrossRef] [PubMed]
- Raffegeau, T.E.; Kellaher, G.K.; Terza, M.J.; Roper, J.A.; Altmann, L.J.; Hass, C.J. Older Women Take Shorter Steps during Backwards Walking and Obstacle Crossing. Exp. Gerontol. 2019, 122, 60–66. [Google Scholar] [CrossRef]
- Pollard, T.M.; Wagnild, J.M. Gender Differences in Walking (for Leisure, Transport and in Total) across Adult Life: A Systematic Review. BMC Public Health 2017, 17, 341. [Google Scholar] [CrossRef]
- Lange, J.; Norman, P. Quantifying Service Accessibility/Transport Disadvantage for Older People in Non-Metropolitan South Australia. Appl. Spat. Anal. 2018, 11, 1–19. [Google Scholar] [CrossRef]
- Ngamini Ngui, A.; Apparicio, P. L’accessibilité potentielle aux services de santé mentale à Montréal: Approche par les systèmes d’information géographique. Rev. D’Epidémiologie St. Publique 2011, 59, 369–378. [Google Scholar] [CrossRef] [PubMed]
- Althoff, T.; Sosič, R.; Hicks, J.L.; King, A.C.; Delp, S.L.; Leskovec, J. Large-Scale Physical Activity Data Reveal Worldwide Activity Inequality. Nature 2017, 547, 336–339. [Google Scholar] [CrossRef] [PubMed]
- Kim, J. What about People in Accessibility? A Comparative Analysis between Place-Based Accessibility and Person-Based Accessibility. APA Student Paper Competition: Master’s Thesis, University of Illinois, Urbana-Champaign, IL, USA, 1 January 2018. [Google Scholar]


| DETAIL | Neighborhood A (Quantity) | Neighborhood B (Quantity) | |
|---|---|---|---|
| Health services | Health centers | 0 | 1 |
| Specialized health facilities (dental clinic, podiatrist, optician, etc.) | 1 | 4 | |
| Pharmacies | 1 | 2 | |
| Emergency services | 0 | 0 | |
| Municipal services and amenities | Gendarmerie | 0 | 2 |
| Cemetery | 1 | 1 | |
| Post office | 1 | 1 | |
| Townhall | 0 | 1 | |
| Community Center for Social Action (CCAS) | 0 | 1 | |
| Neighborhood house | 1 | 1 | |
| Social and cultural facilities | Places of worship | 4 | 0 |
| Sports facilities | 1 | 2 | |
| Neighborhood meeting hall | 2 | 0 | |
| Retirement home/ nursing home | 0 | 2 | |
| Conservatory | 0 | 1 | |
| Library | 1 | 1 | |
| Shopping | Local shops (hairdresser, cheese shop, grocery store, butchers, etc.) | 8 | 9 |
| Restaurants | 1 | 5 | |
| Banks | 0 | 2 | |
| Shopping center | 0 | 1 | |
| Supermarkets | 1 | 2 | |
| Bars | 0 | 1 | |
| Schools and childcare facilities | Schools, nurseries | 4 | 5 |
| Total | 27 | 45 | |
| 100% Weighting | Variable | Rank (m) | Accessibility Level | ||
|---|---|---|---|---|---|
| Profile 1 | Profile 2 | Profile 3 | |||
| 45 | 30 | 30 | BENCHES | 0–100 | Very High |
| 100–300 | High | ||||
| 300–500 | Moderate | ||||
| 500–700 | Low | ||||
| 700–1000 | Very Low | ||||
| 45 | 40 | 30 | * HEALTH SERVICES | 0–100 | Very High |
| 100–300 | High | ||||
| 300–600 | Moderate | ||||
| 600–800 | Low | ||||
| 800–1000 | Very Low | ||||
| 10 | OTHER SERVICES AND FACILITIES | 0–100 | Very High | ||
| 100–300 | High | ||||
| 300–600 | Moderate | ||||
| 600–800 | Low | ||||
| 800–1000 | Very Low | ||||
| 10 | 20 | 40 | SLOPE GRADIENTS (%) | 0–3.00% | Very High |
| 3.01–5.00% | High | ||||
| 5.01–8.00% | Moderate | ||||
| 8.01–12.00% | Low | ||||
| ≥12.01% | Very Low | ||||
Publisher’s Note: MDPI stays neutral with regard to jurisdictional claims in published maps and institutional affiliations. |
© 2022 by the authors. Licensee MDPI, Basel, Switzerland. This article is an open access article distributed under the terms and conditions of the Creative Commons Attribution (CC BY) license (https://creativecommons.org/licenses/by/4.0/).
Share and Cite
Amaya, V.; Moulaert, T.; Gwiazdzinski, L.; Vuillerme, N. Assessing and Qualifying Neighborhood Walkability for Older Adults: Construction and Initial Testing of a Multivariate Spatial Accessibility Model. Int. J. Environ. Res. Public Health 2022, 19, 1808. https://doi.org/10.3390/ijerph19031808
Amaya V, Moulaert T, Gwiazdzinski L, Vuillerme N. Assessing and Qualifying Neighborhood Walkability for Older Adults: Construction and Initial Testing of a Multivariate Spatial Accessibility Model. International Journal of Environmental Research and Public Health. 2022; 19(3):1808. https://doi.org/10.3390/ijerph19031808
Chicago/Turabian StyleAmaya, Valkiria, Thibauld Moulaert, Luc Gwiazdzinski, and Nicolas Vuillerme. 2022. "Assessing and Qualifying Neighborhood Walkability for Older Adults: Construction and Initial Testing of a Multivariate Spatial Accessibility Model" International Journal of Environmental Research and Public Health 19, no. 3: 1808. https://doi.org/10.3390/ijerph19031808
APA StyleAmaya, V., Moulaert, T., Gwiazdzinski, L., & Vuillerme, N. (2022). Assessing and Qualifying Neighborhood Walkability for Older Adults: Construction and Initial Testing of a Multivariate Spatial Accessibility Model. International Journal of Environmental Research and Public Health, 19(3), 1808. https://doi.org/10.3390/ijerph19031808