
Association between Primary Care Utilization and Emergency Room or Hospital Inpatient Services Utilization among the Middle-Aged and Elderly in a Self-Referral System: Evidence from the China Health and Retirement Longitudinal Study 2011–2018
Abstract
:1. Introduction
2. Materials and Methods
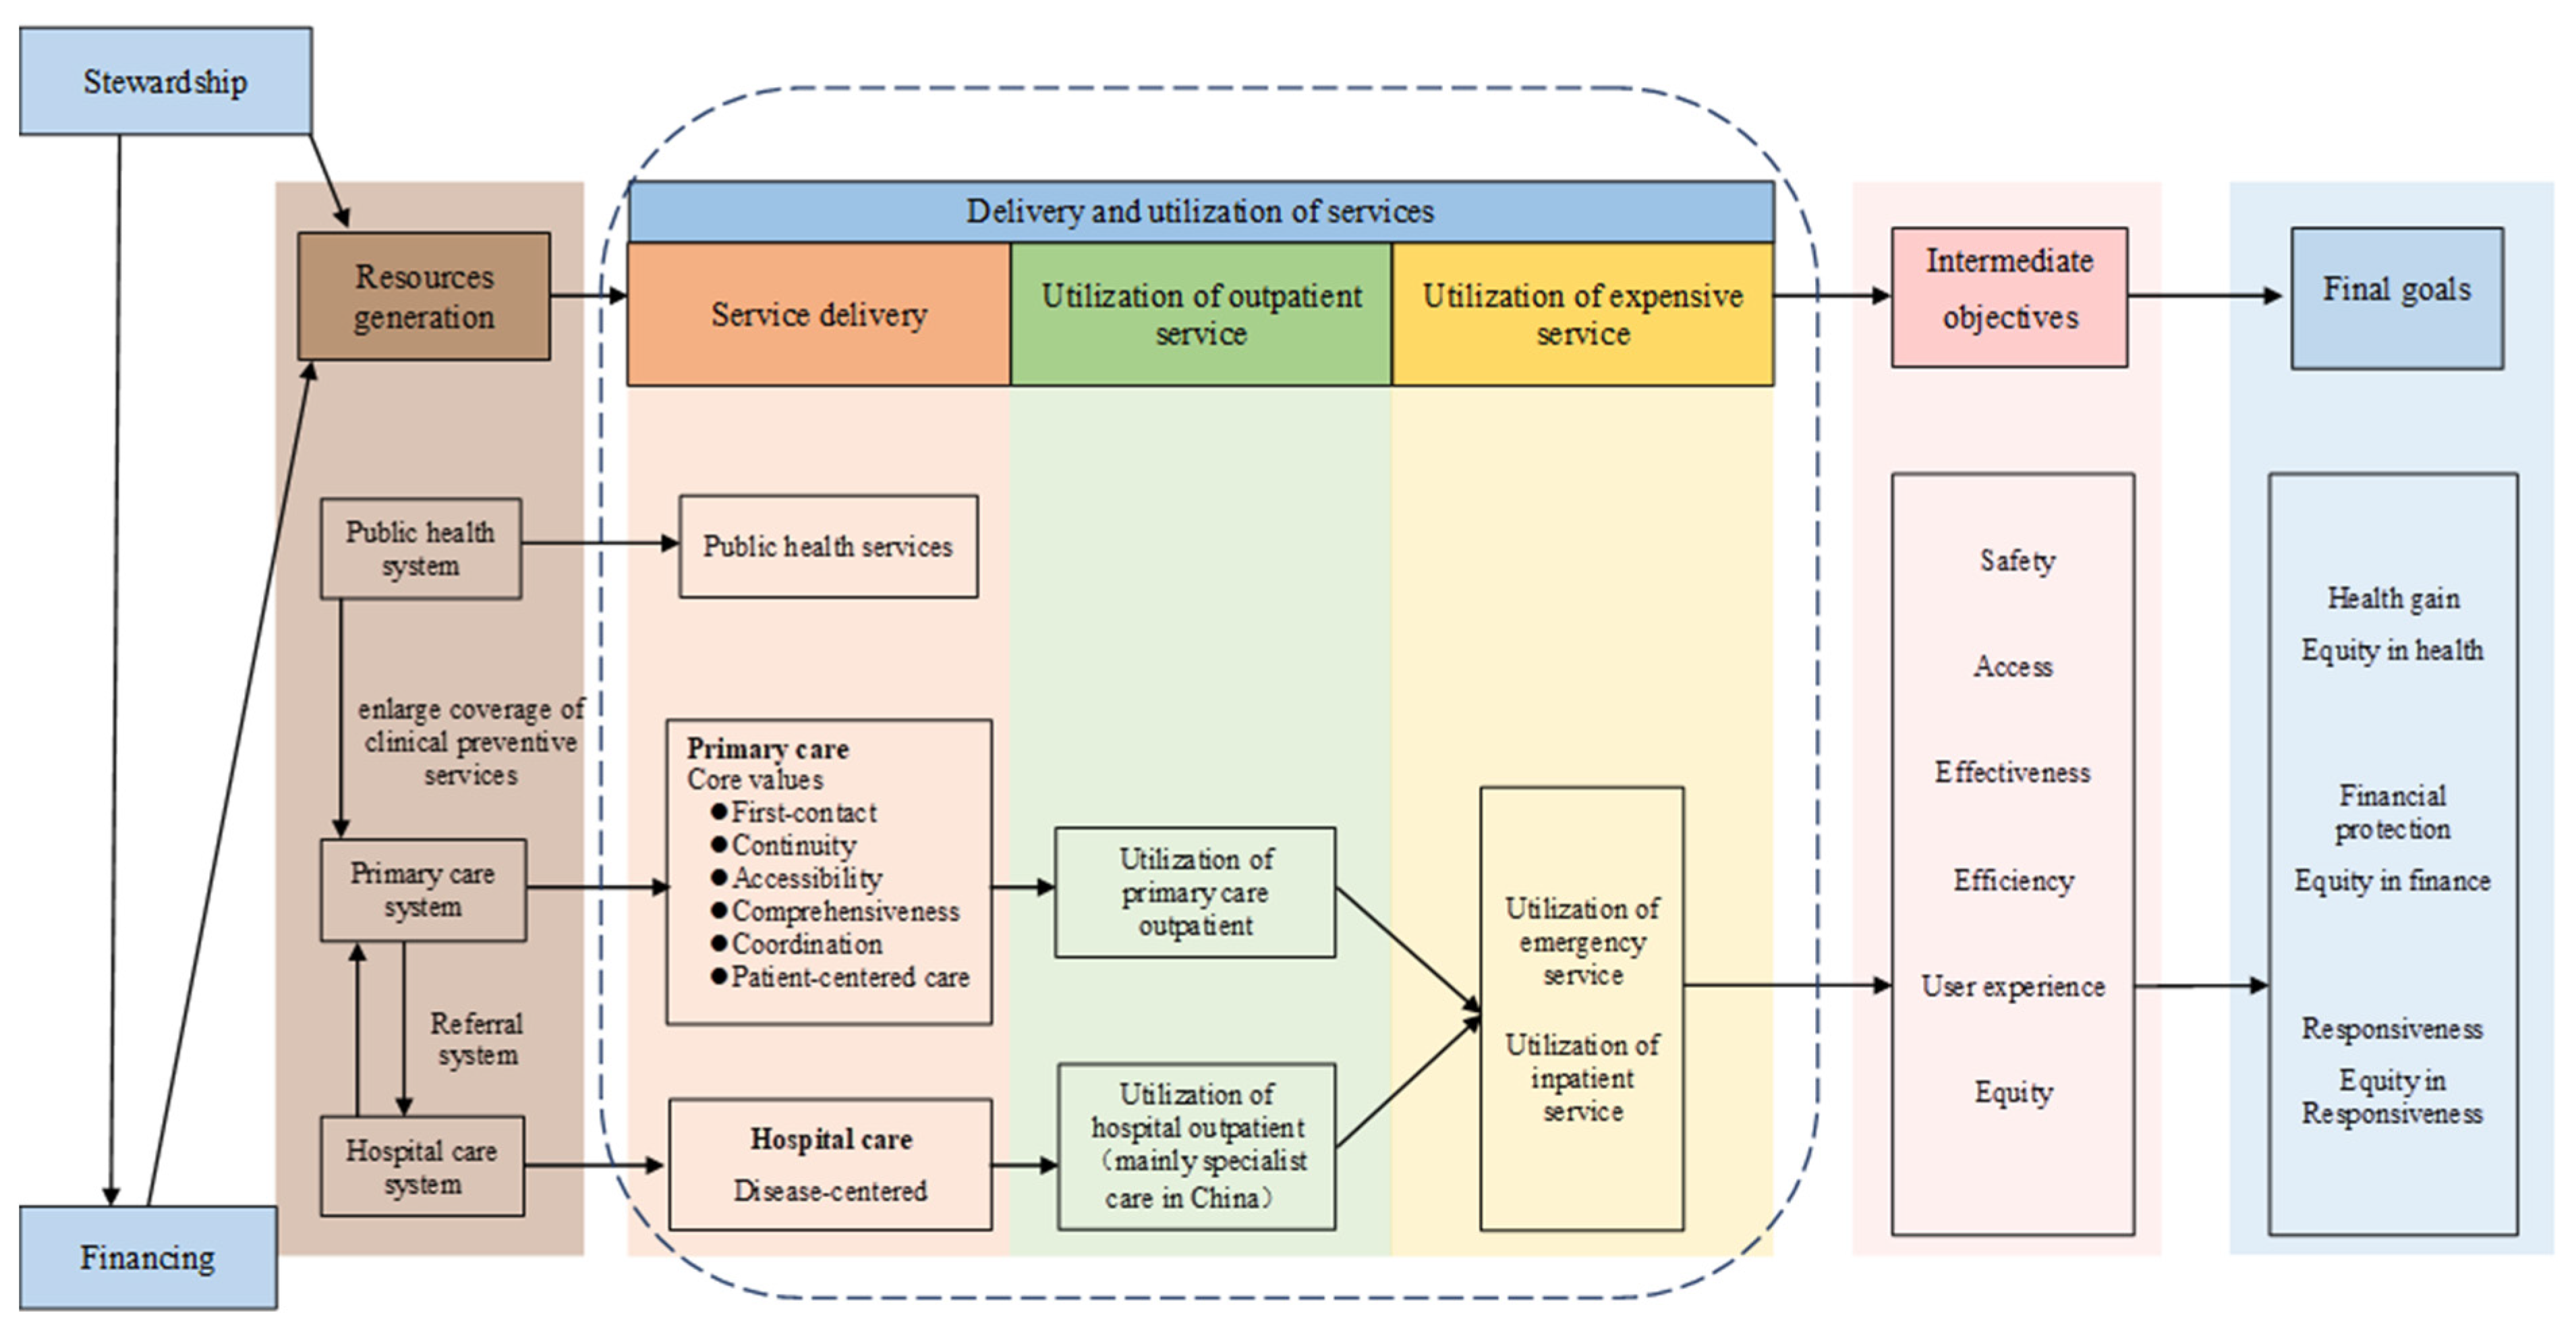
2.1. Assessment Framework
2.2. Data Sources
2.3. Variables
2.3.1. Dependent Variables
2.3.2. Exposure
2.3.3. Covariates
2.4. Statistical Analysis
3. Results
3.1. Descriptive Statistics
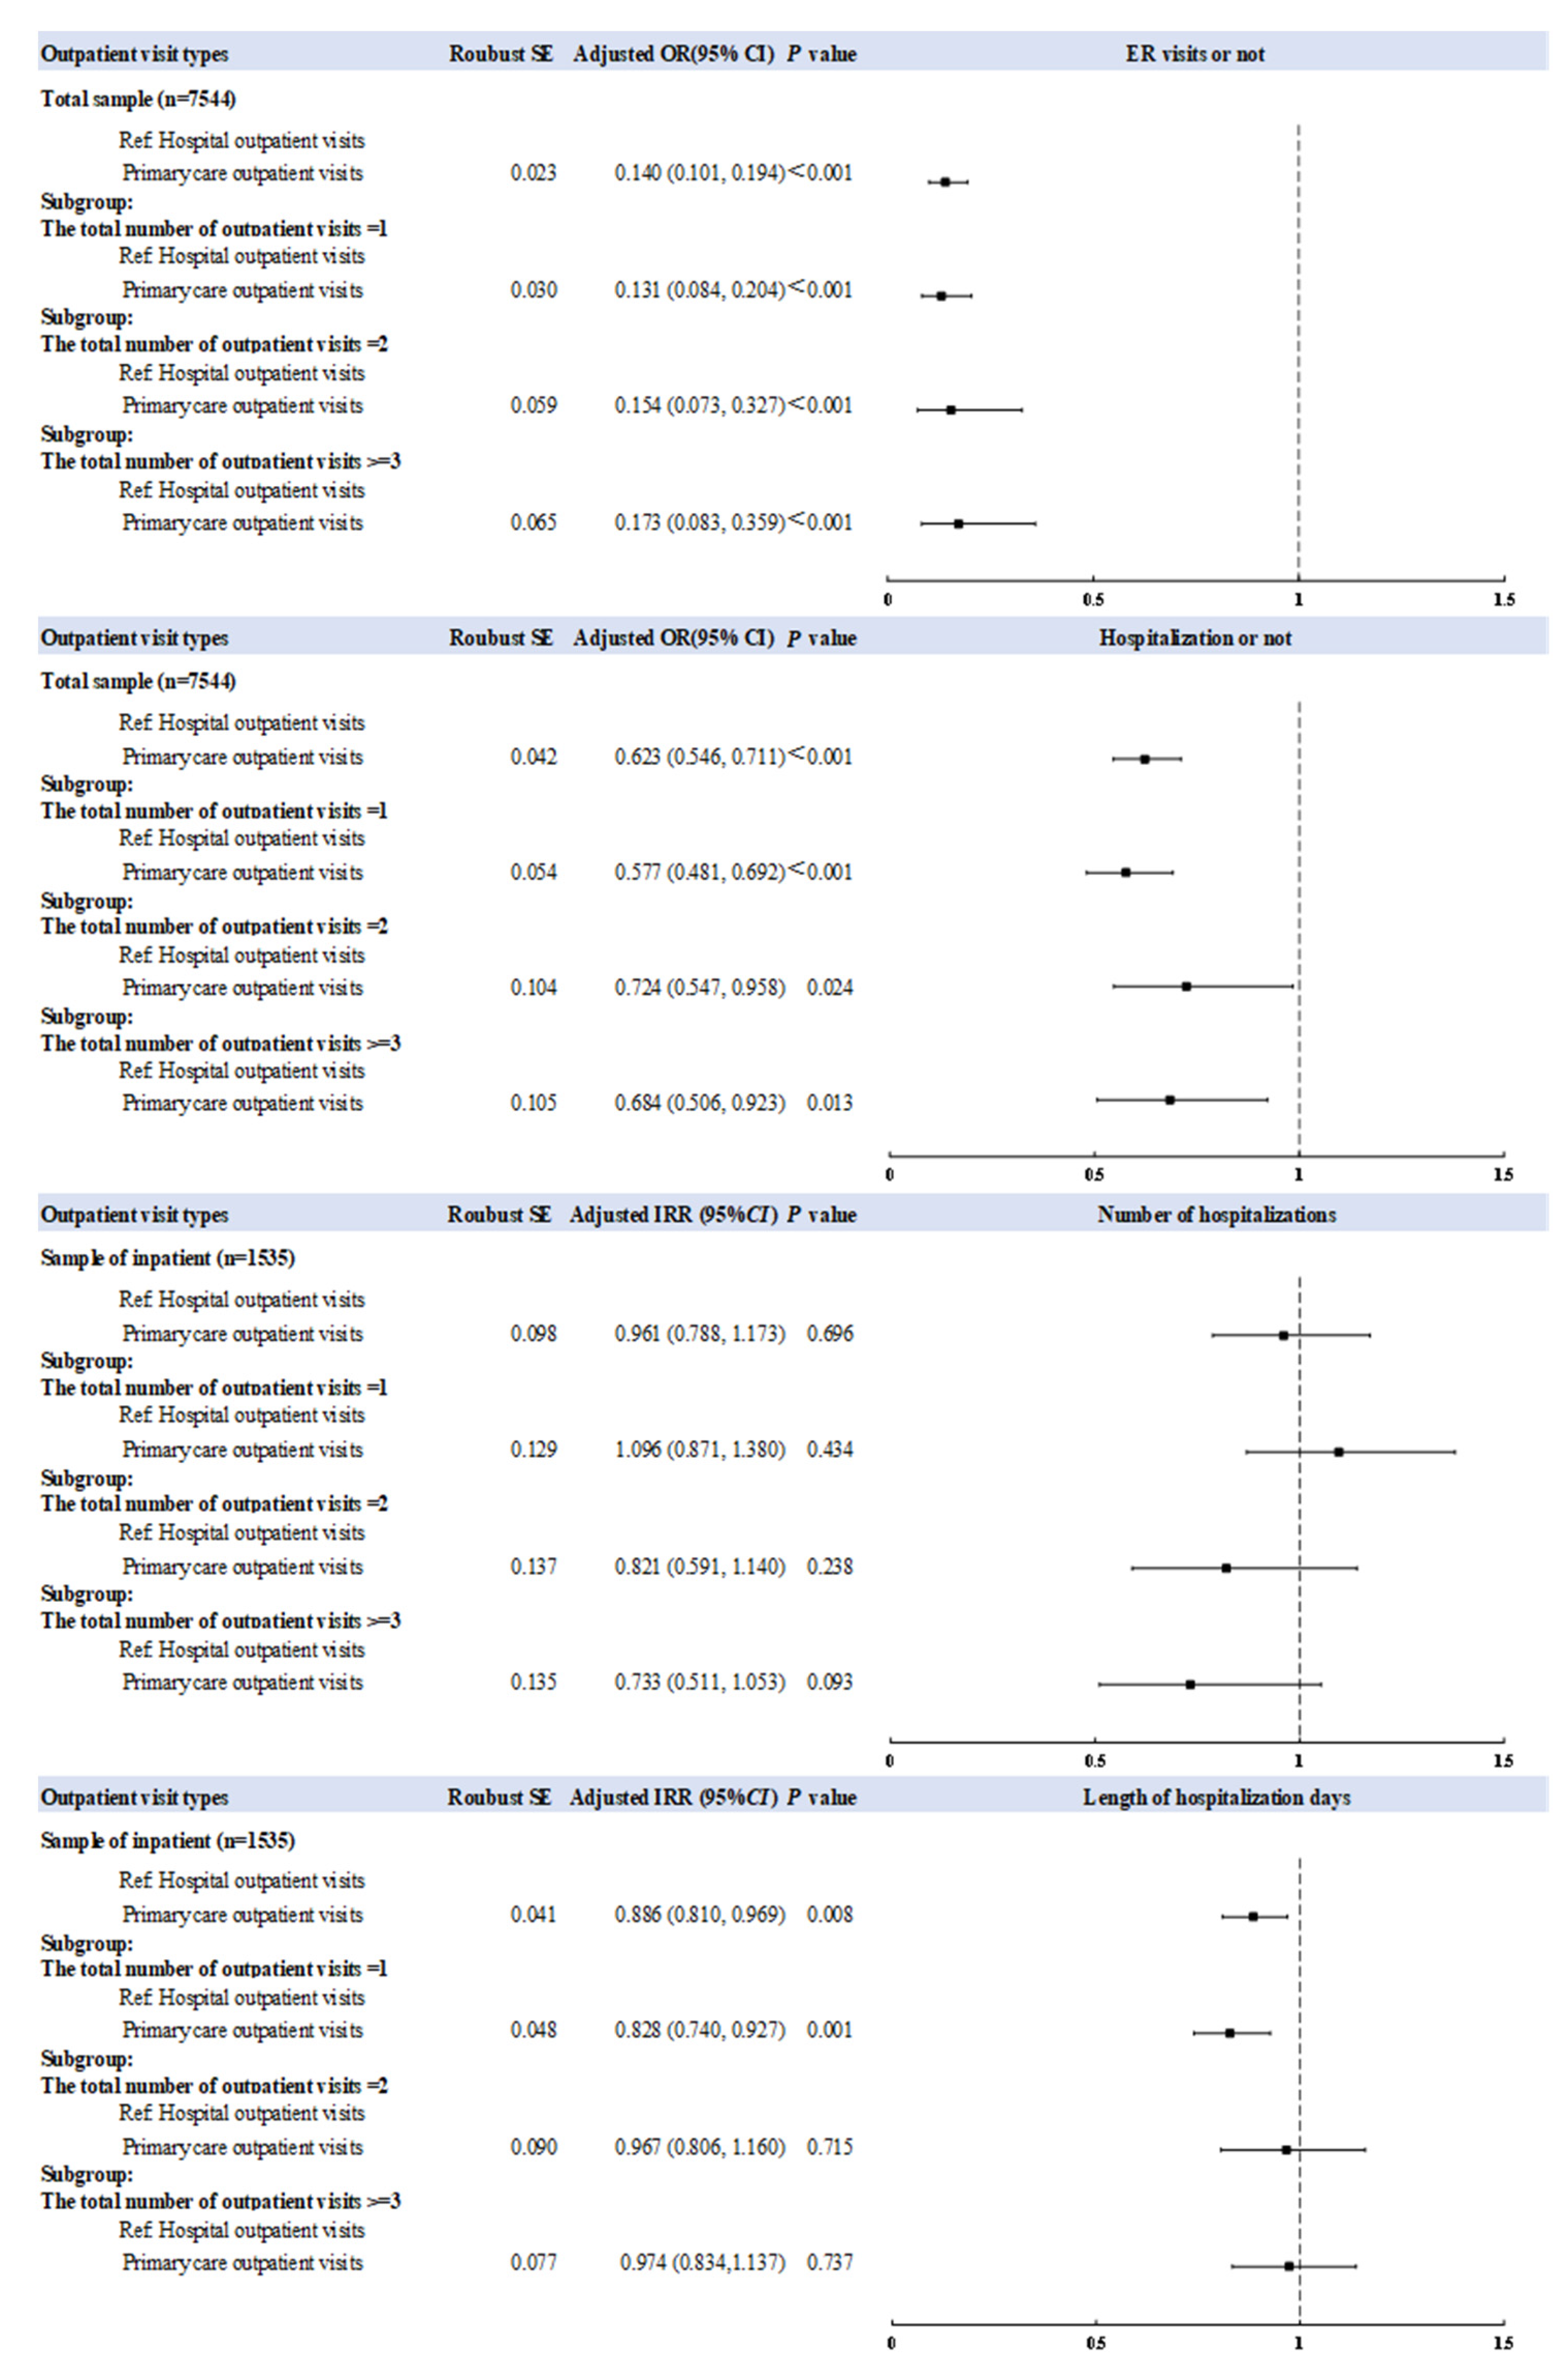
3.2. Association between Outpatient Visits Types and ER or Hospital Inpatient Services Utilization
3.3. Trend Test of Association between Outpatient Visits Types and ER or Hospital Inpatient Services Utilization
4. Discussion
4.1. Main Findings
4.2. Association between Outpatient Visits Types and ER or Hospital Inpatient Services Utilization
4.3. Trend Test of Association between Outpatient Visits Types and ER or Hospital Inpatient Services Utilization
4.4. Study Limitations
5. Conclusions
Author Contributions
Funding
Institutional Review Board Statement
Informed Consent Statement
Data Availability Statement
Conflicts of Interest
Appendix A

| Variables | Indicators | Definition | Assignment |
|---|---|---|---|
| Independent Variables | |||
| Outpatient service utilization | Outpatient visit types | Primary care outpatient visits indicated that the respondent visited a community healthcare center, township hospital, health care post or village clinic/private clinic for outpatient care in the last month. Hospital outpatient visits indicated that the respondent visited a general hospital, specialized hospital and Chinese medicine hospital in the last month. | Hospital outpatient visit = 0, Primary care outpatient visit = 1. |
| Dependent variables | |||
| Hospital inpatient service utilization | Hospitalization or not | Whether the respondent received inpatient care in the past year. | No = 0, Yes = 1. |
| Number of hospitalizations | The number of times the respondent received inpatient care during the past year. | Discrete variable. | |
| Length of hospitalization in days | The number of days the respondent received inpatient care during the past year. | Discrete variable. | |
| ER service utilization | ER visits or not | Whether the respondent received emergency care in the last month. | No = 0, Yes = 1. |
| Covariates | |||
| Availability and characteristic of health resources | Economic region | Whether the respondent’s current address (province-level) is in a west, middle or east area. | West = 0, Middle = 1, East = 2. |
| GDP per capital (PGDP) | Gross domestic product per capita at respondent’s current address; current address refers to the prefecture-level city. | Continuous variable. | |
| Current residence | Whether the respondent’s current address is in a rural or urban area. | Rural = 0, Urban = 1. | |
| Health status | Self-reported health status | Respondent’s own perceptions of his/her own health. | Poor = 0, Fair = 1, Good = 2. |
| ADL limitations | Whether the respondent had any difficulty with dressing, bathing or showering, eating, getting into or out of bed, using the toilet or controlling urination and defecation. Respondents who had difficulty with any one of the six activities listed above were defined as having ADL limitations. | No = 0, Yes = 1. | |
| IADL limitations | Whether respondent had any difficulty with doing household chores, preparing hot meals, shopping for groceries, taking medications or managing your money. Respondents who had difficulty with any one of the five activities listed above were defined as having IADL limitations. | No = 0, Yes = 1. | |
| Depression | Respondent whose CESD ≥10 was defined as having depression. | No = 0, Yes = 1. | |
| Individual demographic characteristic | Age group | Actual date of birth of respondent. | 45–49 years old = 0, 50–59 years old = 1, 60–69 years old = 2, 70–79 years old = 3, ≥80 years old = 4. |
| Sex | Sex of respondent. | Female = 0, Male = 1. | |
| Marital status | Marital status of respondent. With spouse included married and living with spouse, and married but not living with spouse temporarily for reasons, such as work, Without spouse included separated, divorced, widowed, and never married. | Without spouse = 0, With spouse = 1. | |
| Education | The respondent’s highest level of education. | Elementary school and below = 0, Middle school and high school = 1, College and above = 2. | |
| Work status | Whether the respondent has a job and whether the respondent is currently retired. | Unemployed = 0, Employed = 1, Retired = 2. | |
| Health need | Smoking | Whether the respondent has ever smoked or has totally quit. | Never = 0, Used = 1, Now = 2. |
| Drinking | Whether and how often the respondent drank any alcoholic beverages in the past year. | Never = 0, <1 time per month = 1, >=1 times per month = 2. | |
| Number of chronic diseases | The number of chronic diseases of respondent that have been diagnosed by a doctor. Chronic diseases included hypertension, dyslipidemia, diabetes, cancer or malignant tumor, chronic lung diseases, liver disease, heart disease, stroke, kidney disease, stomach or other digestive diseases, emotional or nervous problems, memory-related disease, arthritis or rheumatism, and asthma. | 0 = 0, 1 = 1, more than 2 = 2. | |
| Frequency of social activity | Whether and how often the respondent engaged in any social activities in the past month. | None = 0, Not regular = 1, Almost every week = 2, Almost every day = 3. | |
| Enabling factors | The per capita household consumption expenditure (PCE) | The per capita household consumption expenditure of the respondents’ households in the past year. | Continuous variable Considering the distribution of PCE, we use the natural logarithm of PCE (ln PCE) to measure the economic level of the household. |
| Medical insurance status | The type of medical insurance of the respondent. Urban and rural resident medical insurance integrated urban resident medical insurance and new rural cooperative medical insurance. | None = 0, Urban employee medical insurance = 1, Urban and rural resident medical insurance = 2, Other medical insurance = 3. | |
| Family support | Number of caregivers | The number of people who helped the respondent if the respondent had any difficulty in ADL or IADL. | 0 = 0, 1 = 1, 2–3 = 2, ≥4 = 3. |
| Living arrangement | Household members who lived with the respondent. | Alone = 0, with other relatives = 1, with spouse = 2, with offspring = 3. | |
| Outpatient Visit Types | ER Visits or Not | Hospitalization or Not | Number of Hospitalizations | Length of Hospitalization Days |
|---|---|---|---|---|
| Adjusted OR (95% CI) | Adjusted OR (95% CI) | Adjusted IRR (95% CI) | Adjusted IRR (95% CI) | |
| Self reported health status = poor | ||||
| Ref: Hospital outpatient visits | ||||
| Primary care outpatient visits | 0.156 *** (0.100, 0.243) | 0.646 *** (0.542, 0.771) | 1.087 (0.874,1.352) | 0.857 * (0.761, 0.964) |
| Self reported health status = fair | ||||
| Ref: Hospital outpatient visits | ||||
| Primary care outpatient visits | 0.111 *** (0.051, 0.243) | 0.557 *** (0.426, 0.730) | 0.970 (0.620, 1.518) | 0.948 (0.798, 1.126) |
| Self reported health status = good | ||||
| Ref: Hospital outpatient visits | ||||
| Primary care outpatient visits | 0.114 *** (0.059, 0.220) | 0.636 ** (0.464, 0.870) | 0.718 (0.421,1.227) | 0.815 * (0.692, 0.960) |
References
- WHO. Caring for the Health of the Elderly in China. Available online: https://www.who.int/news-room/feature-stories/detail/caring-for-the-health-of-the-elderly-in-china (accessed on 28 May 2021).
- Starfield, B.; Shi, L.; Macinko, J. Contribution of primary care to health systems and health. Milbank Q. 2005, 83, 457–502. [Google Scholar] [CrossRef]
- Ellner, A.L.; Phillips, R.S. The coming primary care revolution. J. Gen. Intern. Med. 2017, 32, 380–386. [Google Scholar] [CrossRef] [PubMed] [Green Version]
- Van Gool, K.; Mu, C.; Hall, J. Does more investment in primary care improve health system performance? Health Policy 2021, 125, 717–724. [Google Scholar] [CrossRef]
- WHO. Primary Health Care Measurement Framework and Indicators: Monitoring Health Systems through a Primary Health Care Lens; World Health Organization: Geneva, Switzerland, 2022. [Google Scholar]
- National Health Commission. China Health Statistics Yearbook 2010. Available online: http://www.nhc.gov.cn/zwgk/tjnj1/ejlist.shtml (accessed on 8 October 2010).
- National Health Commission. China Health Statistics Yearbook 2021. Available online: http://www.nhc.gov.cn/ (accessed on 8 October 2021).
- Meng, Q.; Xu, L.; Zhang, Y.; Qian, J.; Cai, M.; Xin, Y.; Gao, J.; Xu, K.; Boerma, J.T.; Barber, S.L. Trends in access to health services and financial protection in China between 2003 and 2011: A cross-sectional study. Lancet 2012, 379, 805–814. [Google Scholar] [CrossRef]
- Li, X.; Lu, J.; Hu, S.; Cheng, K.K.; De Maeseneer, J.; Meng, Q.; Mossialos, E.; Xu, D.R.; Yip, W.; Zhang, H.; et al. The primary health-care system in China. Lancet 2017, 390, 2584–2594. [Google Scholar] [CrossRef]
- Liu, G.G.; Vortherms, S.A.; Hong, X. China’s health reform update. Annu. Rev. Public Health 2017, 38, 431–448. [Google Scholar] [CrossRef] [PubMed] [Green Version]
- Zhou, M.; Liao, J.; Hu, N.; Kuang, L. Association between primary healthcare and medical expenditures in a context of hospital-oriented healthcare system in China: A national panel dataset, 2012–2016. Int. J. Environ. Res. Public Health 2020, 17, 6917. [Google Scholar] [CrossRef] [PubMed]
- Ke, N.; Ma, Y.; Luo, Z.; Xu, S.; Kuang, L. Associations between the supply and utilization of primary care and newborn, children and maternal health in rural counties of Guangdong Province, China. Fam. Pract. 2020, 37, 499–506. [Google Scholar] [CrossRef]
- Luo, Z.; Ma, Y.; Ke, N.; Xu, S.; Hu, R.; Hu, N.; Kuang, L. The association between the supply and utilization of community-based primary care and child health in a context of hospital-oriented healthcare system in urban districts of Guangdong, China: A panel dataset, 2014–2016. BMC Health Serv. Res. 2020, 20, 313. [Google Scholar] [CrossRef] [Green Version]
- Zhou, M.; Zhang, L.; Hu, N.; Kuang, L. Association of primary care physician supply with maternal and child health in China: A national panel dataset, 2012–2017. BMC Public Health 2020, 20, 1093. [Google Scholar] [CrossRef]
- National Health Commission. Statistical Bulletin on the Development of Healthcare in China. 2021. Available online: http://www.nhc.gov.cn/guihuaxxs/s3586s/202207/51b55216c2154332a660157abf28b09d.shtml (accessed on 12 July 2022).
- National Health Commission. China Health Statistics Yearbook 2011. Available online: http://www.nhc.gov.cn/mohwsbwstjxxzx/s7967/201301/f34860a7bdb64aad9029eb860a6cf4d2.shtml (accessed on 16 January 2013).
- Moses, M.W.; Pedroza, P.; Baral, R.; Bloom, S.; Brown, J.; Chapin, A.; Compton, K.; Eldrenkamp, E.; Fullman, N.; Mumford, J.E.; et al. Funding and services needed to achieve universal health coverage: Applications of global, regional, and national estimates of utilisation of outpatient visits and inpatient admissions from 1990 to 2016, and unit costs from 1995 to 2016. Lancet Public Health 2019, 4, e49–e73. [Google Scholar] [CrossRef] [Green Version]
- Yip, W.; Fu, H.; Chen, A.T.; Zhai, T.; Jian, W.; Xu, R.; Pan, J.; Hu, M.; Zhou, Z.; Chen, Q.; et al. 10 years of health-care reform in China: Progress and gaps in universal health coverage. Lancet 2019, 394, 1192–1204. [Google Scholar] [CrossRef]
- Hu, R.; Liao, Y.; Du, Z.; Hao, Y.; Liang, H.; Shi, L. Types of health care facilities and the quality of primary care: A study of characteristics and experiences of Chinese patients in Guangdong province, China. BMC Health Serv. Res. 2016, 16, 335. [Google Scholar] [CrossRef] [PubMed] [Green Version]
- Fung, C.S.; Wong, C.K.; Fong, D.Y.; Lee, A.; Lam, C.L. Having a family doctor was associated with lower utilization of hospital-based health services. BMC Health Serv. Res. 2015, 15, 42. [Google Scholar] [CrossRef] [PubMed] [Green Version]
- Huang, P.T.; Kung, P.T.; Kuo, W.Y.; Tsai, W.C. Impact of family physician integrated care program on decreasing utilization of emergency department visit and hospital admission: A population-based retrospective cohort study. BMC Health Serv. Res. 2020, 20, 470. [Google Scholar] [CrossRef]
- Du, Z.; Liao, Y.; Chen, C.C.; Hao, Y.; Hu, R. Usual source of care and the quality of primary care: A survey of patients in Guangdong province, China. Int. J. Equity Health 2015, 14, 60. [Google Scholar] [CrossRef] [Green Version]
- WHO. The World Health Report 2000—Health Systems: Improving Performance; World Health Organization: Geneva, Switzerland, 2000. [Google Scholar]
- Starfield, B. A Framework for Measuring Primary Care. In Primary Care: Balancing Health Needs, Services, and Technology, 2nd ed.; Oxford University Press: New York, NY, USA, 1998; Volume 1, pp. 19–34. [Google Scholar]
- Starfield, B. Primary Care: Concept, Evaluation, and Policy; Oxford University Press: New York, NY, USA, 1992; Volume 1, pp. 9–27. [Google Scholar]
- Starfield, B. Is primary care essential? Lancet 1994, 344, 1129–1133. [Google Scholar] [CrossRef]
- Kelman, H.R.; Thomas, C. Hospital and ambulatory service use by the urban elderly under different health care delivery systems. Med. Care 1988, 26, 739–749. [Google Scholar] [CrossRef]
- Sung, N.J.; Choi, Y.J.; Lee, J.H. Primary care comprehensiveness can reduce emergency department visits and hospitalization in people with hypertension in South Korea. Int. J. Environ. Res. Public Health 2018, 15, 272. [Google Scholar] [CrossRef] [Green Version]
- Greenfield, S.; Nelson, E.C.; Zubkoff, M.; Manning, W.; Rogers, W.; Kravitz, R.L.; Keller, A.; Tarlov, A.R.; Ware, J.E. Variations in resource utilization among medical specialties and systems of care. JAMA 1992, 267, 1624–1630. [Google Scholar] [CrossRef]
- WHO. The World Health Report 2008: Primary Health Care Now More Than Ever; World Health Organization: Geneva, Switzerland, 2012. [Google Scholar]
- Zhao, Y.; John, S.; Chen, X.; Wang, Y.; Gong, J.; Meng, Q.; Qang, G.; Wang, H. China Health and Retirement Longitudinal Study Wave 4 User’s Guide; National School of Development, Peking University: Beijing, China, 2020. [Google Scholar]
- Clancy, C.M.; Franks, P. Utilization of specialty and primary care: The impact of HMO insurance and patient-related factors. J. Fam. Pract. 1997, 45, 500–508. [Google Scholar] [PubMed]
- Lindstrom, K.; Engstrom, S.; Bengtsson, C.; Borgquist, L. Determinants of hospitalisation rates: Does primary health care play a role? Scand. J. Prim. Health Care 2003, 21, 15–20. [Google Scholar] [CrossRef]
- Bertakis, K.D.; Helms, L.J.; Azari, R.; Callahan, E.J.; Robbins, J.A.; Miller, J. Differences between family physicians’ and general internists’ medical charges. Med. Care 1999, 37, 78–82. [Google Scholar] [CrossRef] [PubMed]
- Li, C.; Zhou, R.; Yao, N.; Cornwell, T.; Wang, S. Health care utilization and unmet needs in chinese older adults with multimorbidity and functional impairment. J. Am. Med. Dir. Assoc. 2020, 21, 806–810. [Google Scholar] [CrossRef]
- Li, J.; Shi, L.; Liang, H.; Ma, C.; Xu, L.; Qin, W. Health care utilization and affordability among older people following China’s 2009 health reform — Evidence from CHARLS pilot study. Int. J. Equity Health 2019, 18, 62. [Google Scholar] [CrossRef] [PubMed] [Green Version]
- Fu, X.Z.; Wang, L.K.; Sun, C.Q.; Wang, D.D.; He, J.J.; Tang, Q.X.; Zhou, Q.Y. Inequity in inpatient services utilization: A longitudinal comparative analysis of middle-aged and elderly patients with the chronic non-communicable diseases in China. Int. J. Equity Health 2020, 19, 6. [Google Scholar] [CrossRef]
- Kravitz, R.L.; Greenfield, S.; Rogers, W.; Manning, W.G.; Zubkoff, M.; Nelson, E.C.; Tarlov, A.R.; Ware, J.E. Differences in the mix of patients among medical specialties and systems of care. Results from the medical outcomes study. JAMA 1992, 267, 1617–1623. [Google Scholar] [CrossRef]
- Li, C.; Dou, L.; Wang, H.; Jing, S.; Yin, A. Horizontal inequity in health care utilization among the middle-aged and elderly in China. Int. J. Environ. Res. Public Health 2017, 14, 842. [Google Scholar] [CrossRef] [Green Version]
- Dong, M.; Chen, W. The evolution trank of China economic region and its evaluation. China Soft Sci. 2001, 9, 105–108. [Google Scholar]
- Bertakis, K.D.; Robbins, J.A. Utilization of hospital services. A comparison of internal medicine and family practice. J. Fam. Pract. 1989, 28, 91–96. [Google Scholar]
- Liao, R.; Liu, Y.; Peng, S.; Feng, X.L. Factors affecting health care users’ first contact with primary health care facilities in North Eastern China, 2008–2018. BMJ Glob. Health 2021, 6, e003907. [Google Scholar] [CrossRef] [PubMed]
- Riedl, B.; Kehrer, S.; Werner, C.U.; Schneider, A.; Linde, K. Do general practice patients with and without appointment differ? Cross-sectional study. BMC Fam. Pract. 2018, 19, 101. [Google Scholar] [CrossRef] [PubMed]
- Salisbury, C.; Munro, J. Walk-in centres in primary care: A review of the international literature. Br. J. Gen. Pract. 2003, 53, 53–59. [Google Scholar] [PubMed]
- Rosano, A.; Loha, C.A.; Falvo, R.; van der Zee, J.; Ricciardi, W.; Guasticchi, G.; de Belvis, A.G. The relationship between avoidable hospitalization and accessibility to primary care: A systematic review. Eur. J. Public Health 2013, 23, 356–360. [Google Scholar] [CrossRef] [Green Version]
- Dourado, I.; Oliveira, V.B.; Aquino, R.; Bonolo, P.; Lima-Costa, M.F.; Medina, M.G.; Mota, E.; Turci, M.A.; Macinko, J. Trends in primary health care-sensitive conditions in Brazil: The role of the family health program (Project ICSAP-Brazil). Med. Care 2011, 49, 577–584. [Google Scholar] [CrossRef] [PubMed]
- Engstrom, S.; Foldevi, M.; Borgquist, L. Is general practice effective? A systematic literature review. Scand. J. Prim. Health Care 2001, 19, 131–144. [Google Scholar] [PubMed]
- Friedmann, P.D.; Hendrickson, J.C.; Gerstein, D.R.; Zhang, Z.W.; Stein, M.D. Do mechanisms that link addiction treatment patients to primary care influence subsequent utilization of emergency and hospital care? Med. Care 2006, 44, 8–15. [Google Scholar] [CrossRef]
- Fiscella, K.; Meldrum, S.; Franks, P.; Shields, C.G.; Duberstein, P.; McDaniel, S.H.; Epstein, R.M. Patient trust: Is it related to patient-centered behavior of primary care physicians? Med. Care 2004, 42, 1049–1055. [Google Scholar] [CrossRef]
- Bertakis, K.D.; Azari, R. Patient-centered care is associated with decreased health care utilization. J. Am. Board Fam. Med. 2011, 24, 229–239. [Google Scholar] [CrossRef] [Green Version]
- Kim, S.L.; Tarn, D.M. Effect of primary care involvement on end-of-life care outcomes: A systematic review. J. Am. Geriatr. Soc. 2016, 64, 1968–1974. [Google Scholar] [CrossRef]
- Hjortdahl, P.; Borchgrevink, C.F. Continuity of care: Influence of general practitioners’ knowledge about their patients on use of resources in consultations. BMJ 1991, 303, 1181–1184. [Google Scholar] [CrossRef] [PubMed] [Green Version]
- Bazemore, A.; Petterson, S.; Peterson, L.E.; Bruno, R.; Chung, Y.; Phillips, R.L., Jr. Higher primary care physician continuity is associated with lower costs and hospitalizations. Ann. Fam. Med. 2018, 16, 492–497. [Google Scholar] [CrossRef] [PubMed]
- Pereira Gray, D.J.; Sidaway-Lee, K.; White, E.; Thorne, A.; Evans, P.H. Continuity of care with doctors-a matter of life and death? A systematic review of continuity of care and mortality. BMJ Open 2018, 8, e021161. [Google Scholar] [CrossRef] [PubMed] [Green Version]
- Kao, Y.H.; Lin, W.T.; Chen, W.H.; Wu, S.C.; Tseng, T.S. Continuity of outpatient care and avoidable hospitalization: A systematic review. Am. J. Manag. Care 2019, 25, e126–e134. [Google Scholar]
- Godard-Sebillotte, C.; Strumpf, E.; Sourial, N.; Rochette, L.; Pelletier, E.; Vedel, I. Primary care continuity and potentially avoidable hospitalization in persons with dementia. J. Am. Geriatr. Soc. 2021, 69, 1208–1220. [Google Scholar] [CrossRef]
- Dyer, S.M.; Suen, J.; Williams, H.; Inacio, M.C.; Harvey, G.; Roder, D.; Wesselingh, S.; Kellie, A.; Crotty, M.; Caughey, G.E. Impact of relational continuity of primary care in aged care: A systematic review. BMC Geriatr. 2022, 22, 579. [Google Scholar] [CrossRef]
- Wang, L.; Porter, B.; Maynard, C.; Evans, G.; Bryson, C.; Sun, H.; Gupta, I.; Lowy, E.; McDonell, M.; Frisbee, K.; et al. Predicting risk of hospitalization or death among patients receiving primary care in the veterans health administration. Med. Care 2013, 51, 368–373. [Google Scholar] [CrossRef]
- Barnett, M.L.; Song, Z.; Bitton, A.; Rose, S.; Landon, B.E. Gatekeeping and patterns of outpatient care post healthcare reform. Am. J. Manag. Care 2018, 24, e312–e318. [Google Scholar]
- Darkins, A.; Ryan, P.; Kobb, R.; Foster, L.; Edmonson, E.; Wakefield, B.; Lancaster, A.E. Care coordination/home telehealth: The systematic implementation of health informatics, home telehealth, and disease management to support the care of veteran patients with chronic conditions. Telemed. E-Health 2008, 14, 1118–1126. [Google Scholar] [CrossRef] [Green Version]
- Starfield, B.; Simborg, D.; Johns, C.; Horn, S. Coordination of care and its relationship to continuity and medical records. Med. Care 1977, 15, 929–938. [Google Scholar] [CrossRef]
- Christakis, D.A.; Wright, J.A.; Zimmerman, F.J.; Bassett, A.L.; Connell, F.A. Continuity of care is associated with well-coordinated care. Ambul. Pediatr. 2003, 3, 82–86. [Google Scholar] [CrossRef]
- Blewett, L.A.; Johnson, P.J.; Lee, B.; Scal, P.B. When a usual source of care and usual provider matter: Adult prevention and screening services. J. Gen. Intern. Med. 2008, 23, 1354–1360. [Google Scholar] [CrossRef] [PubMed]

| 2011 (n = 2190) | 2013 (n = 2463) | 2015 (n = 1214) | 2018 (n = 1677) | ||||||
|---|---|---|---|---|---|---|---|---|---|
| Hospital Outpatient | Primary Care Outpatient | Hospital Outpatient | Primary Care Outpatient | Hospital Outpatient | Primary Care Outpatient | Hospital Outpatient | Primary Care Outpatient | ||
| Economic region (%) | West | 187 (28.38) | 498 (32.53) | 252 (27.21) | 556 (36.17) $ | 141 (31.13) | 260 (34.17) | 229 (30.17) | 319 (34.75) |
| Middle | 259 (39.30) | 563 (36.77) | 319 (34.45) | 577 (37.54) | 160 (35.32) | 263 (34.56) | 292 (38.47) | 309 (33.66) | |
| East | 213 (32.32) | 470 (30.70) | 355 (38.34) | 404 (26.28) | 152 (33.55) | 238 (31.27) | 238 (31.36) | 290 (31.59) | |
| PGDP, mean (SD) | 36,982.30 (21,940.17) | 32,471.47 (19,918.12) $ # | 49,101.86 (29,244.55) | 39,804.78 (24,459.99) $ | 51,337.25 (31,650.07) | 45,033.61 (27,548.94) $ | 59,428.61 (34,705.76) | 51,235.13 (29,271.44) $ | |
| Current residence, n (%) | Rural | 341 (51.75) | 1099 (71.78) $ # | 480 (51.84) | 1056 (68.71) $ | 254 (56.07) | 554(72.80) $ | 415 (54.68) | 674 (73.42) $ |
| Urban | 318 (48.25) | 432 (28.22) | 446 (48.16) | 481 (31.29) | 199 (43.93) | 207 (27.20) | 344 (45.32) | 244 (26.58) | |
| Self-reported health status, n (%) | Poor | 313 (47.50) | 717 (46.83) # | 375 (40.50) | 602 (39.17) | 196 (43.27) | 313 (41.13) | 329 (43.4) | 410 (44.66) |
| Fair | 143 (21.70) | 318 (20.77) | 225 (24.30) | 382 (24.85) | 100 (22.08) | 179 (23.52) | 346 (45.65) | 414 (45.10) | |
| Good | 203 (30.80) | 496 (32.40) | 326 (35.21) | 553 (35.98) | 157 (34.66) | 269 (35.35) | 83 (10.95) | 94 (10.24) | |
| ADL limitations, n (%) | No | 516 (78.30) | 1130 (73.81) $ # | 714 (77.11) | 1152 (74.95) | 341 (75.28) | 541(71.09) | 576 (75.89) | 612 (66.67) $ |
| Yes | 143 (21.70) | 401 (26.19) | 212 (22.89) | 385 (25.05) | 112 (24.72) | 220 (28.91) | 183 (24.11) | 306 (33.33) | |
| IADL limitations, n (%) | No | 477 (72.38) | 1067 (69.69) # | 682 (73.65) | 1109 (72.15) | 319 (70.42) | 547 (71.88) | 536 (70.62) | 574 (62.53) $ |
| Yes | 182 (27.62) | 464 (30.31) | 244 (26.35) | 428 (27.85) | 134 (29.58) | 214 (28.12) | 223 (29.38) | 344 (37.47) | |
| Depression, n (%) | No | 347 (52.66) | 681 (44.48) $ # | 560 (60.48) | 871 (56.67) | 269 (59.38) | 403 (52.96) $ | 422 (55.60) | 416 (45.32) $ |
| Yes | 312 (47.34) | 850 (55.52) | 366 (39.52) | 666 (43.33) | 184 (40.62) | 358 (47.04) | 337 (44.40) | 502 (54.68) | |
| Age group, n (%) | 45–49 | 97 (14.72) | 197 (12.87) $ # | 104 (11.23) | 182 (11.84) | 21 (4.64) | 40 (5.26) | 2 (0.26) | 2 (0.22) |
| 50–59 | 249 (37.78) | 494 (32.27) | 345 (37.26) | 505 (32.86) | 157 (34.66) | 247 (32.46) | 281 (37.02) | 288 (31.37) | |
| 60–69 | 207 (31.41) | 527 (34.42) | 293 (31.64) | 541 (35.20) | 169 (37.31) | 286 (37.58) | 250 (32.94) | 355 (38.67) | |
| 70–79 | 86 (13.05) | 247 (16.13) | 145 (15.66) | 244 (15.88) | 89 (19.65) | 139 (18.27) | 182 (23.98) | 209 (22.77) | |
| ≥80 | 20 (3.03) | 66 (4.31) | 39 (4.21) | 65 (4.23) | 17 (3.75) | 49 (6.44) | 44 (5.8) | 64 (6.97) | |
| Sex, n (%) | Female | 372 (56.45) | 923 (60.29) | 563 (60.80) | 914 (59.47) | 228 (50.33) | 454 (59.66) $ | 429 (56.52) | 571 (62.20) $ |
| Male | 287 (43.55) | 608 (39.71) | 363 (39.20) | 623 (40.53) | 225 (49.67) | 307 (40.34) | 330 (43.48) | 347 (37.80) | |
| Marital status, n (%) | Without spouse | 75 (11.38) | 219 (14.30) # | 130 (14.04) | 226 (14.70) | 95 (20.97) | 182 (23.92) | 101 (13.31) | 165 (17.97) $ |
| With spouse | 584 (88.62) | 1312 (85.70) | 796 (85.96) | 1311 (85.30) | 358 (79.03) | 579 (76.08) | 658 (86.69) | 753 (82.03) | |
| Education, n (%) | Elementary school and below | 406 (61.61) | 1208 (78.90) $ # | 536 (57.88) | 1155 (75.15) $ | 254 (56.07) | 572 (75.16) $ | 446 (58.76) | 716 (78.00) $ |
| Secondary school | 230 (34.90) | 313 (20.44) | 347 (37.47) | 370 (24.07) | 175 (38.63) | 186 (24.44) | 290 (38.21) | 198 (21.57) | |
| College and above | 23 (3.49) | 10 (0.65) | 43(4.64) | 12 (0.78) | 24 (5.30) | 3 (0.39) | 23 (3.03) | 4 (0.44) | |
| Work status, n (%) | Unemployed | 303 (45.98) | 594 (38.80) $ # | 382 (41.25) | 508 (33.05) $ | 175 (38.63) | 273 (35.87) $ | 279 (36.76) | 306 (33.33) $ |
| Employed | 227 (34.45) | 870 (56.83) | 335 (36.18) | 913 (59.40) | 160 (35.32) | 432 (56.77) | 281 (37.02) | 543 (59.15) | |
| Retired | 129 (19.58) | 67 (4.38) | 209 (22.57) | 116 (7.55) | 118 (26.05) | 56 (7.36) | 199 (26.22) | 69 (7.52) | |
| Smoking, n (%) | Never | 435 (66.01) | 998 (65.19) $ # | 618 (66.74) | 987 (64.22) $ | 250 (55.19) | 480 (63.07) $ | 469 (61.79) | 570 (62.09) |
| Used to smoke | 94 (14.26) | 138 (9.01) | 111 (11.99) | 132 (8.59) | 99 (21.85) | 110 (14.45) | 146 (19.24) | 146(15.90) | |
| Now | 130 (19.73) | 395 (25.80) | 197 (21.27) | 418 (27.20) | 104 (22.96) | 171 (22.47) | 144 (18.97) | 202 (22.00) | |
| Drinking, n (%) | Never | 488 (74.05) | 1097 (71.65) | 694 (74.95) | 1090 (70.92) $ | 298 (65.78) | 537 (70.57) | 551 (72.60) | 670 (72.98) $ |
| <1 time per month | 40 (6.07) | 118 (7.71) | 74 (7.99) | 120 (7.81) | 42 (9.27) | 56 (7.36) | 63 (8.30) | 49 (5.34) | |
| ≥1 times per month | 131 (19.88) | 316 (20.64) | 158 (17.06) | 327 (21.28) | 113 (24.94) | 168 (22.08) | 145 (19.1) | 199 (21.68) | |
| Number of chronic diseases, n (%) | 0 | 101 (15.33) | 283 (18.48) # | 133 (14.36) | 265 (17.24) | 61 (13.47) | 128 (16.82) $ | 43 (5.67) | 77 (8.39) |
| 1 | 179 (27.16) | 420 (27.43) | 238 (25.70) | 419 (27.26) | 84 (18.54) | 174 (22.86) | 123 (16.21) | 147 (16.01) | |
| ≥2 | 379 (57.51) | 828 (54.08) | 555 (59.94) | 853 (55.50) | 308 (67.99) | 459 (60.32) | 593 (78.13) | 694 (75.6) | |
| Frequency of social activity, n (%) | None | 321 (48.71) | 762 (49.77) # | 366 (39.52) | 625 (40.66) | 172 (37.97) | 317 (41.66) | 305 (40.18) | 422 (45.97) $ |
| Not regular | 89 (13.51) | 224 (14.63) | 129 (13.93) | 238 (15.48) | 74 (16.34) | 130 (17.08) | 117 (15.42) | 144 (15.69) | |
| Almost every week | 70 (10.62) | 180 (11.76) | 108 (11.66) | 191 (12.43) | 61 (13.47) | 93 (12.22) | 88 (11.59) | 112 (12.20) | |
| Almost every day | 179 (27.16) | 365 (23.84) | 323 (34.88) | 483 (31.42) | 146 (32.23) | 221 (29.04) | 249(32.81) | 240 (26.14) | |
| Medical insurance status, n (%) | None | 23 (3.49) | 79 (5.16) $ # | 34 (3.67) | 36 (2.34) $ | 19 (4.19) | 27 (3.55) $ | 11 (1.45) | 18 (1.96) $ |
| Urban Employee Basic Medical Insurance | 112 (17.00) | 56 (3.66) | 198 (21.38) | 91 (5.92) | 98 (21.63) | 57 (7.49) | 154 (20.29) | 49 (5.34) | |
| Urban and rural resident medical insurance | 469 (75.27) | 1379 (90.07) | 664 (71.17) | 1400 (91.09) | 313 (69.09) | 667 (87.65) | 570 (75.10) | 846 (92.16) | |
| other medical insurance | 28 (4.25) | 17 (1.11) | 30 (3.24) | 10 (0.65) | 23 (5.08) | 10 (1.31) | 24 (3.16) | 5 (0.54) | |
| PCE/yuan, mean (SD) | 4070.36 (3010.56) | 2793.09 (2161.98) | 3138.75 (2289.70) | 2222.34 (1665.37) | 6372.15 (5190.50) | 4487.86 (3703.05) | 8878.39 (6564.50) | 5851.12 (4792.40) | |
| ln PCE, mean (SD) | 8.04 (0.77) | 7.67 (0.73) $ # | 7.80 (0.72) | 7.46 (0.72) $ | 8.44 (0.82) | 8.13 (0.74) $ | 8.82 (0.77) | 8.39 (0.76) $ | |
| Number of caregivers, n (%) | 0 | 525 (79.67) | 1245 (81.32) # | 742 (80.13) | 1212 (78.85) | 344 (75.94) | 580 (76.22) | 575 (75.76) | 637 (69.39) $ |
| 1 | 13 (1.97) | 38 (2.48) | 105 (11.34) | 193 (12.56) | 54 (11.92) | 67 (8.80) | 87 (11.46) | 129 (14.05) | |
| 2–3 | 108 (16.39) | 208 (13.59) | 61 (6.59) | 103 (6.70) | 30 (6.62) | 69 (9.07) | 51 (6.72) | 72 (7.84) | |
| ≥4 | 13 (1.97) | 40 (2.61) | 18 (1.94) | 29 (1.89) | 25 (5.52) | 45 (5.91) | 46 (6.06) | 80 (8.71) | |
| Living arrangement, n (%) | Alone | 28 (4.25) | 108 (7.05) $ # | 95 (10.26) | 153 (9.95) | 66 (14.57) | 110 (14.45) | 86 (11.33) | 117 (12.75) |
| With relatives | 32 (4.86) | 118 (7.71) | 48 (5.18) | 120 (7.81) | 31 (6.84) | 78 (10.25) | 48 (6.32) | 34 (3.70) | |
| With spouse | 568 (86.19) | 1218 (79.56) | 768 (82.94) | 1237 (80.48) | 186 (41.06) | 286 (37.58) | 413 (54.41) | 486 (52.94) | |
| With offspring | 31 (4.70) | 87 (5.68) | 15 (1.62) | 27 (1.76) | 170 (37.53) | 287 (37.71) | 212 (27.93) | 281 (30.61) | |
| Hospital Outpatient | Primary Care Outpatient | p Value | Total | ||
|---|---|---|---|---|---|
| Economic region (%) | West | 809 (28.92) | 1633 (34.40) | <0.001 | 2442 (32.37) |
| Middle | 1030 (36.83) | 1712 (36.06) | 2742 (36.35) | ||
| East | 958 (34.25) | 1402 (29.53) | 2360 (31.28) | ||
| PGDP, mean (SD) | 49,410.71 (30,805.59) | 40,488.35 (25,595.87) | <0.001 | 43,796.39 (27,974.17) | |
| Current residence, n (%) | Rural | 1490 (53.27) | 3383 (71.27) | <0.001 | 4873 (64.59) |
| Urban | 1307 (46.73) | 1364 (28.73) | 2671 (35.41) | ||
| Self-reported health status, n (%) | Poor | 1213 (43.38) | 2042 (43.02) | 0.070 | 3256 (43.15) |
| Fair | 814 (29.11) | 1293 (27.24) | 2107 (27.93) | ||
| Good | 769 (27.50) | 1412 (29.75) | 2181 (28.91) | ||
| ADL limitations, n (%) | No | 2147 (76.76) | 3435 (72.36) | <0.001 | 5582 (73.99) |
| Yes | 650 (23.24) | 1312 (27.64) | 1962 (26.01) | ||
| IADL limitations, n (%) | No | 2014 (72.01) | 3297 (69.45) | 0.019 | 5311 (70.40) |
| Yes | 783 (27.99) | 1450 (30.55) | 2233 (29.60) | ||
| Depression, n (%) | No | 1598 (57.13) | 2371 (49.95) | <0.001 | 3969 (52.61) |
| Yes | 1199 (42.87) | 2376 (50.05) | 3575 (47.39) | ||
| Age group, n (%) | 45–49 | 224 (8.01) | 421 (8.87) | <0.001 | 645 (8.55) |
| 50–59 | 1032 (36.90) | 1534 (32.32) | 2566 (34.01) | ||
| 60–69 | 919 (32.86) | 1709 (36.00) | 2628 (34.84) | ||
| 70–79 | 502 (17.95) | 839 (17.67) | 1341 (17.78) | ||
| ≥80 | 120 (4.29) | 244 (5.14) | 364 (4.83) | ||
| Age, mean (SD) | 61.85(9.55) | 62.35(9.56) | 0.029 | 62.17(9.56) | |
| Sex, n (%) | Female | 1592 (56.92) | 2862 (60.29) | 0.004 | 4454 (59.04) |
| Male | 1205 (43.08) | 1885 (39.71) | 3090 (40.96) | ||
| Marital status, n (%) | Without spouse | 401 (14.34) | 792 (16.68) | 0.007 | 1193 (15.81) |
| With spouse | 2396 (85.66) | 3955 (83.32) | 6351 (84.19) | ||
| Education, n (%) | Elementary school and below | 1642 (58.71) | 3651 (76.91) | <0.001 | 5293 (70.16) |
| Secondary school | 1042 (37.25) | 1067 (22.48) | 2109 (27.96) | ||
| College and above | 113 (4.04) | 29 (0.61) | 142 (1.88) | ||
| Work status, n (%) | Unemployed | 1139 (40.72) | 1681 (35.41) | <0.001 | 2820 (37.38) |
| Employed | 1003 (35.86) | 2758 (58.10) | 3761 (49.85) | ||
| Retired | 655 (23.42) | 308 (6.49) | 963 (12.77) | ||
| Smoking, n (%) | Never | 1772 (63.35) | 3035 (63.94) | <0.001 | 4807 (63.72) |
| Used to smoke | 450 (16.09) | 526 (11.08) | 976 (12.94) | ||
| Now | 575 (20.56) | 1186 (24.98) | 1761 (23.34) | ||
| Drinking, n (%) | Never | 2031 (72.61) | 3394 (71.50) | 0.158 | 5425 (71.91) |
| <1 time per month | 219 (7.83) | 343 (7.23) | 562 (7.45) | ||
| ≥1 times per month | 547 (19.56) | 1010 (21.28) | 1557 (20.64) | ||
| Number of chronic diseases, n (%) | 0 | 338 (12.08) | 753 (15.86) | <0.001 | 1091 (14.46) |
| 1 | 624 (22.31) | 1160 (24.44) | 1784 (23.65) | ||
| ≥2 | 1835 (65.61) | 2834 (59.70) | 4669 (61.89) | ||
| Frequency of social activity, n (%) | None | 1164 (41.62) | 2126 (44.79) | 0.001 | 3290 (43.61) |
| Not regular | 409 (14.62) | 736 (15.50) | 1145 (15.18) | ||
| Almost every week | 327 (11.69) | 576 (12.13) | 903 (11.97) | ||
| Almost every day | 897 (32.07) | 1309 (27.58) | 2206 (29.24) | ||
| Medical insurance status, n (%) | None | 87 (3.11) | 160 (3.37) | <0.001 | 247 (3.27) |
| Urban Employee Basic Medical Insurance | 562 (20.09) | 253 (5.33) | 815 (10.80) | ||
| Urban and rural resident medical insurance | 2043 (73.04) | 4292 (90.41) | 6335 (83.97) | ||
| other medical insurance | 105 (3.75) | 42 (0.88) | 147 (1.95) | ||
| PCE/yuan, mean (SD) | 5439.45 (5044.94) | 3471.36 (3309.48) | 4201.05 (4150.81) | ||
| ln PCE, mean (SD) | 8.24 (0.87) | 7.81 (0.82) | <0.001 | 7.97 (0.86) | |
| Number of caregivers, n (%) | 0 | 2186 (78.16) | 3674 (77.40) | 0.620 | 5860 (77.68) |
| 1 | 259 (9.26) | 427 (9.00) | 686 (9.09) | ||
| 2–3 | 250 (8.94) | 452 (9.52) | 702 (9.31) | ||
| ≥4 | 102 (3.65) | 194 (4.09) | 296 (3.92) | ||
| Living arrangement, n (%) | Alone | 275 (9.83) | 488 (10.28) | 0.027 | 763 (10.11) |
| With relatives | 159 (5.68) | 350 (7.37) | 509 (6.75) | ||
| With spouse | 1935 (69.18) | 3227 (67.98) | 5162 (68.43) | ||
| With offspring | 428 (15.30) | 682 (14.37) | 1110 (14.71) | ||
| The Total Number of Outpatient Visits = 1 (n = 3957) | The Total Number of Outpatient Visits = 2 (n = 1706) | The Total Number of Outpatient Visits ≥ 3 (n = 1881) | Overall (n = 7544) | |||||
|---|---|---|---|---|---|---|---|---|
| Hospital Outpatient Visits (n = 1754) | Primary Care Outpatient Visits (n = 2203) | Hospital Outpatient Visits (n = 573) | Primary Care Outpatient Visits (n = 1133) | Hospital Outpatient Visits (n = 470) | Primary Care Outpatient Visits (n = 1411) | Hospital Outpatient Visits (n = 2797) | Primary Care Outpatient Visits (n = 4747) | |
| ER visits, n (%) | 137 *** (7.81) | 24 (1.09) | 31 *** (5.41) | 12 (1.06) | 24 *** (5.11) | 14 (0.99) | 192 *** (6.86) | 50 (1.05) |
| Hospitalization, n (%) | 463 *** (26.40) | 325 (14.75) | 148 *** (25.83) | 187 (16.50) | 142*** (30.21) | 270 (19.14) | 753 *** (26.92) | 782 (16.47) |
| Number of hospitalizations, mean (SD) | 0.41 *** (0.89) | 0.23 (0.68) | 0.47 *** (0.97) | 0.27 (0.76) | 0.56 *** (1.16) | 0.32 (0.86) | 0.45 *** (0.96) | 0.27 (0.76) |
| Length of hospitalization in days, mean (SD) | 3.51 *** (8.96) | 1.52 (5.06) | 3.16 *** (7.20) | 1.70 (6.50) | 4.11 *** (9.61) | 2.01 (6.34) | 3.54 *** (8.75) | 1.73 (5.83) |
| Outpatient Visit Types | ER Visits or Not n = 7544 | Hospitalization or Not n = 7544 | Number of Hospitalizations n = 1535 | Length of Hospitalization Days n = 1535 | ||||
|---|---|---|---|---|---|---|---|---|
| Adjusted OR (95% CI) | Average Marginal Effect (95% CI) | Adjusted OR (95% CI) | Average Marginal Effect (95% CI) | Adjusted IRR (95% CI) | Average Marginal Effect (95% CI) | Adjusted IRR (95% CI) | Average Marginal Effect (95% CI) | |
| Ref: Hospital outpatient visits | ||||||||
| Primary care outpatient visits | 0.141 *** (0.101, 0.194) | −0.058 *** (−0.069, −0.048) | 0.623 *** (0.546, 0.711) | -0.069 *** (−0.089, −0.049) | 0.961 (0.788,1.173) | −0.020 (−0.122, 0.081) | 0.886 ** (0.810, 0.969) | −1.407 ** (−2.450, −0.365) |
| Outpatient Visit Types | ER Visits or Not a n = 7544 | Hospitalization or Not n = 7544 | Number of Hospitalizations b n = 1535 | Length of Hospitalization Days n = 1535 | ||||
|---|---|---|---|---|---|---|---|---|
| Adjusted OR (95% CI) | Average Marginal Effect (95% CI) | Adjusted OR (95% CI) | Average Marginal Effect (95% CI) | Adjusted IRR (95% CI) | Average Marginal Effect (95% CI) | Adjusted IRR (95% CI) | Average Marginal Effect (95% CI) | |
| The total number of outpatient visits = 1 | n = 3957 | n = 788 | ||||||
| Ref: Hospital outpatient visits | ||||||||
| Primary care outpatient visits | 0.131 *** (0.084, 0.204) | −0.065 *** (−0.079, −0.052) | 0.577 *** (0.481, 0.692) | −0.076 *** (−0.101, −0.051) | 1.096 (0.871, 1.380) | 0.086 (−0.132, 0.305) | 0.828 ** (0.740, 0.927) | −2.199 ** (−3.503, −0.896) |
| The total number of outpatient visits = 2 | n = 1706 | n = 335 | ||||||
| Ref: Hospital outpatient visits | ||||||||
| Primary care outpatient visits | 0.154 *** (0.073, 0.327) | −0.048 *** (−0.070, −0.026) | 0.724 * (0.547, 0.958) | −0.046 *** (−0.086, −0.005) | 0.821 (0.591, 1.140) | −0.200 (−0.532, 0.132) | 0.967 (0.806, 1.160) | −0.371 (−2.353, 1.611) |
| The total number of outpatient visits ≥ 3 | n = 1881 | n = 412 | ||||||
| Ref: Hospital outpatient visits | ||||||||
| Primary care outpatient visits | 0.173 *** (0.083, 0.359) | −0.042 *** (−0.063, −0.020) | 0.684 * (0.506, 0.923) | −0.059 *** (−0.107, −0.011) | 0.733 (0.511, 1.053) | −0.263 (−0.595, 0.069) | 0.974 (0.834, 1.137) | −0.312 (−2.140, 1.515) |
Publisher’s Note: MDPI stays neutral with regard to jurisdictional claims in published maps and institutional affiliations. |
© 2022 by the authors. Licensee MDPI, Basel, Switzerland. This article is an open access article distributed under the terms and conditions of the Creative Commons Attribution (CC BY) license (https://creativecommons.org/licenses/by/4.0/).
Share and Cite
Yang, S.; Zhou, M.; Liao, J.; Ding, X.; Hu, N.; Kuang, L. Association between Primary Care Utilization and Emergency Room or Hospital Inpatient Services Utilization among the Middle-Aged and Elderly in a Self-Referral System: Evidence from the China Health and Retirement Longitudinal Study 2011–2018. Int. J. Environ. Res. Public Health 2022, 19, 12979. https://doi.org/10.3390/ijerph191912979
Yang S, Zhou M, Liao J, Ding X, Hu N, Kuang L. Association between Primary Care Utilization and Emergency Room or Hospital Inpatient Services Utilization among the Middle-Aged and Elderly in a Self-Referral System: Evidence from the China Health and Retirement Longitudinal Study 2011–2018. International Journal of Environmental Research and Public Health. 2022; 19(19):12979. https://doi.org/10.3390/ijerph191912979
Chicago/Turabian StyleYang, Siman, Mengping Zhou, Jingyi Liao, Xinxin Ding, Nan Hu, and Li Kuang. 2022. "Association between Primary Care Utilization and Emergency Room or Hospital Inpatient Services Utilization among the Middle-Aged and Elderly in a Self-Referral System: Evidence from the China Health and Retirement Longitudinal Study 2011–2018" International Journal of Environmental Research and Public Health 19, no. 19: 12979. https://doi.org/10.3390/ijerph191912979