
Evaluation Methods for Water Resource Suitability in Territorial Spatial Planning: A Case Study of Baiyin City in a Semi-Arid Region

Abstract
:1. Introduction
2. Materials and Methods
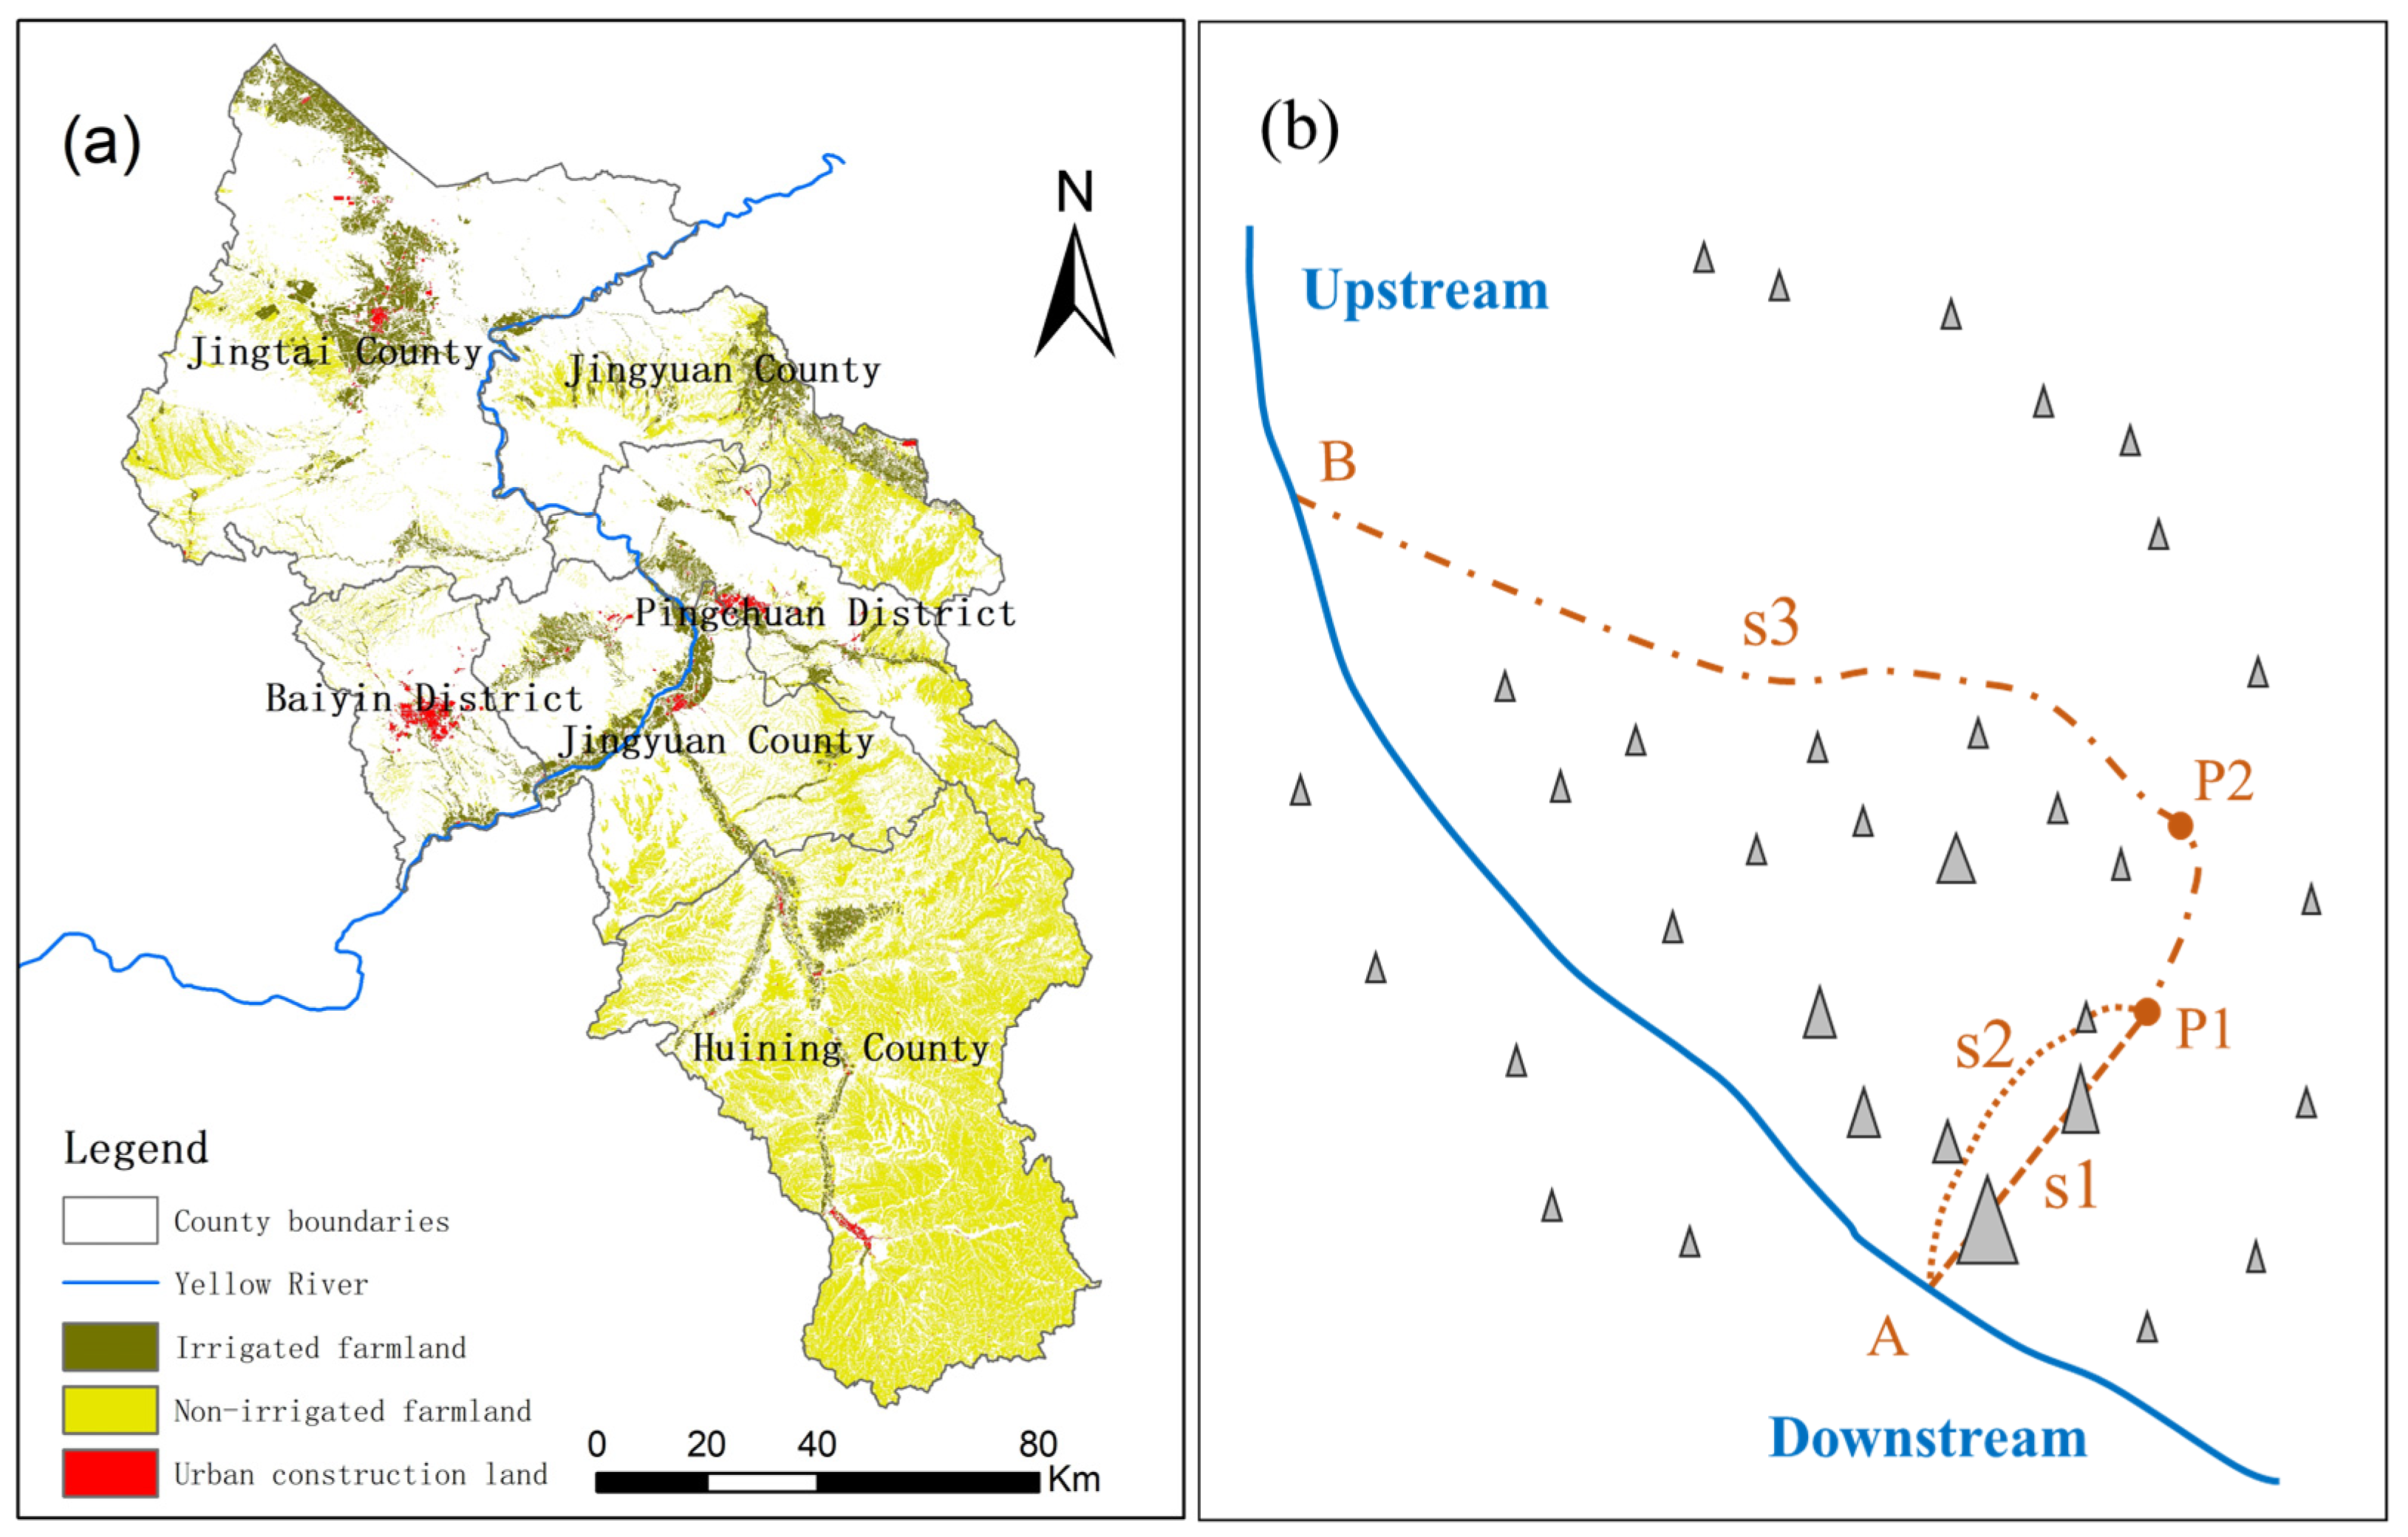
2.1. Study Area
2.2. Data Sources
2.3. Runoff Model Construction and Water Supply Sources Extraction
2.4. Water Resource Suitability Indexes Construction
2.4.1. Suitability of Water Resources for Agricultural Production (WRSA)
2.4.2. Suitability of Water Resources for Urban Construction (WRSU)
2.5. Geodetector
3. Results
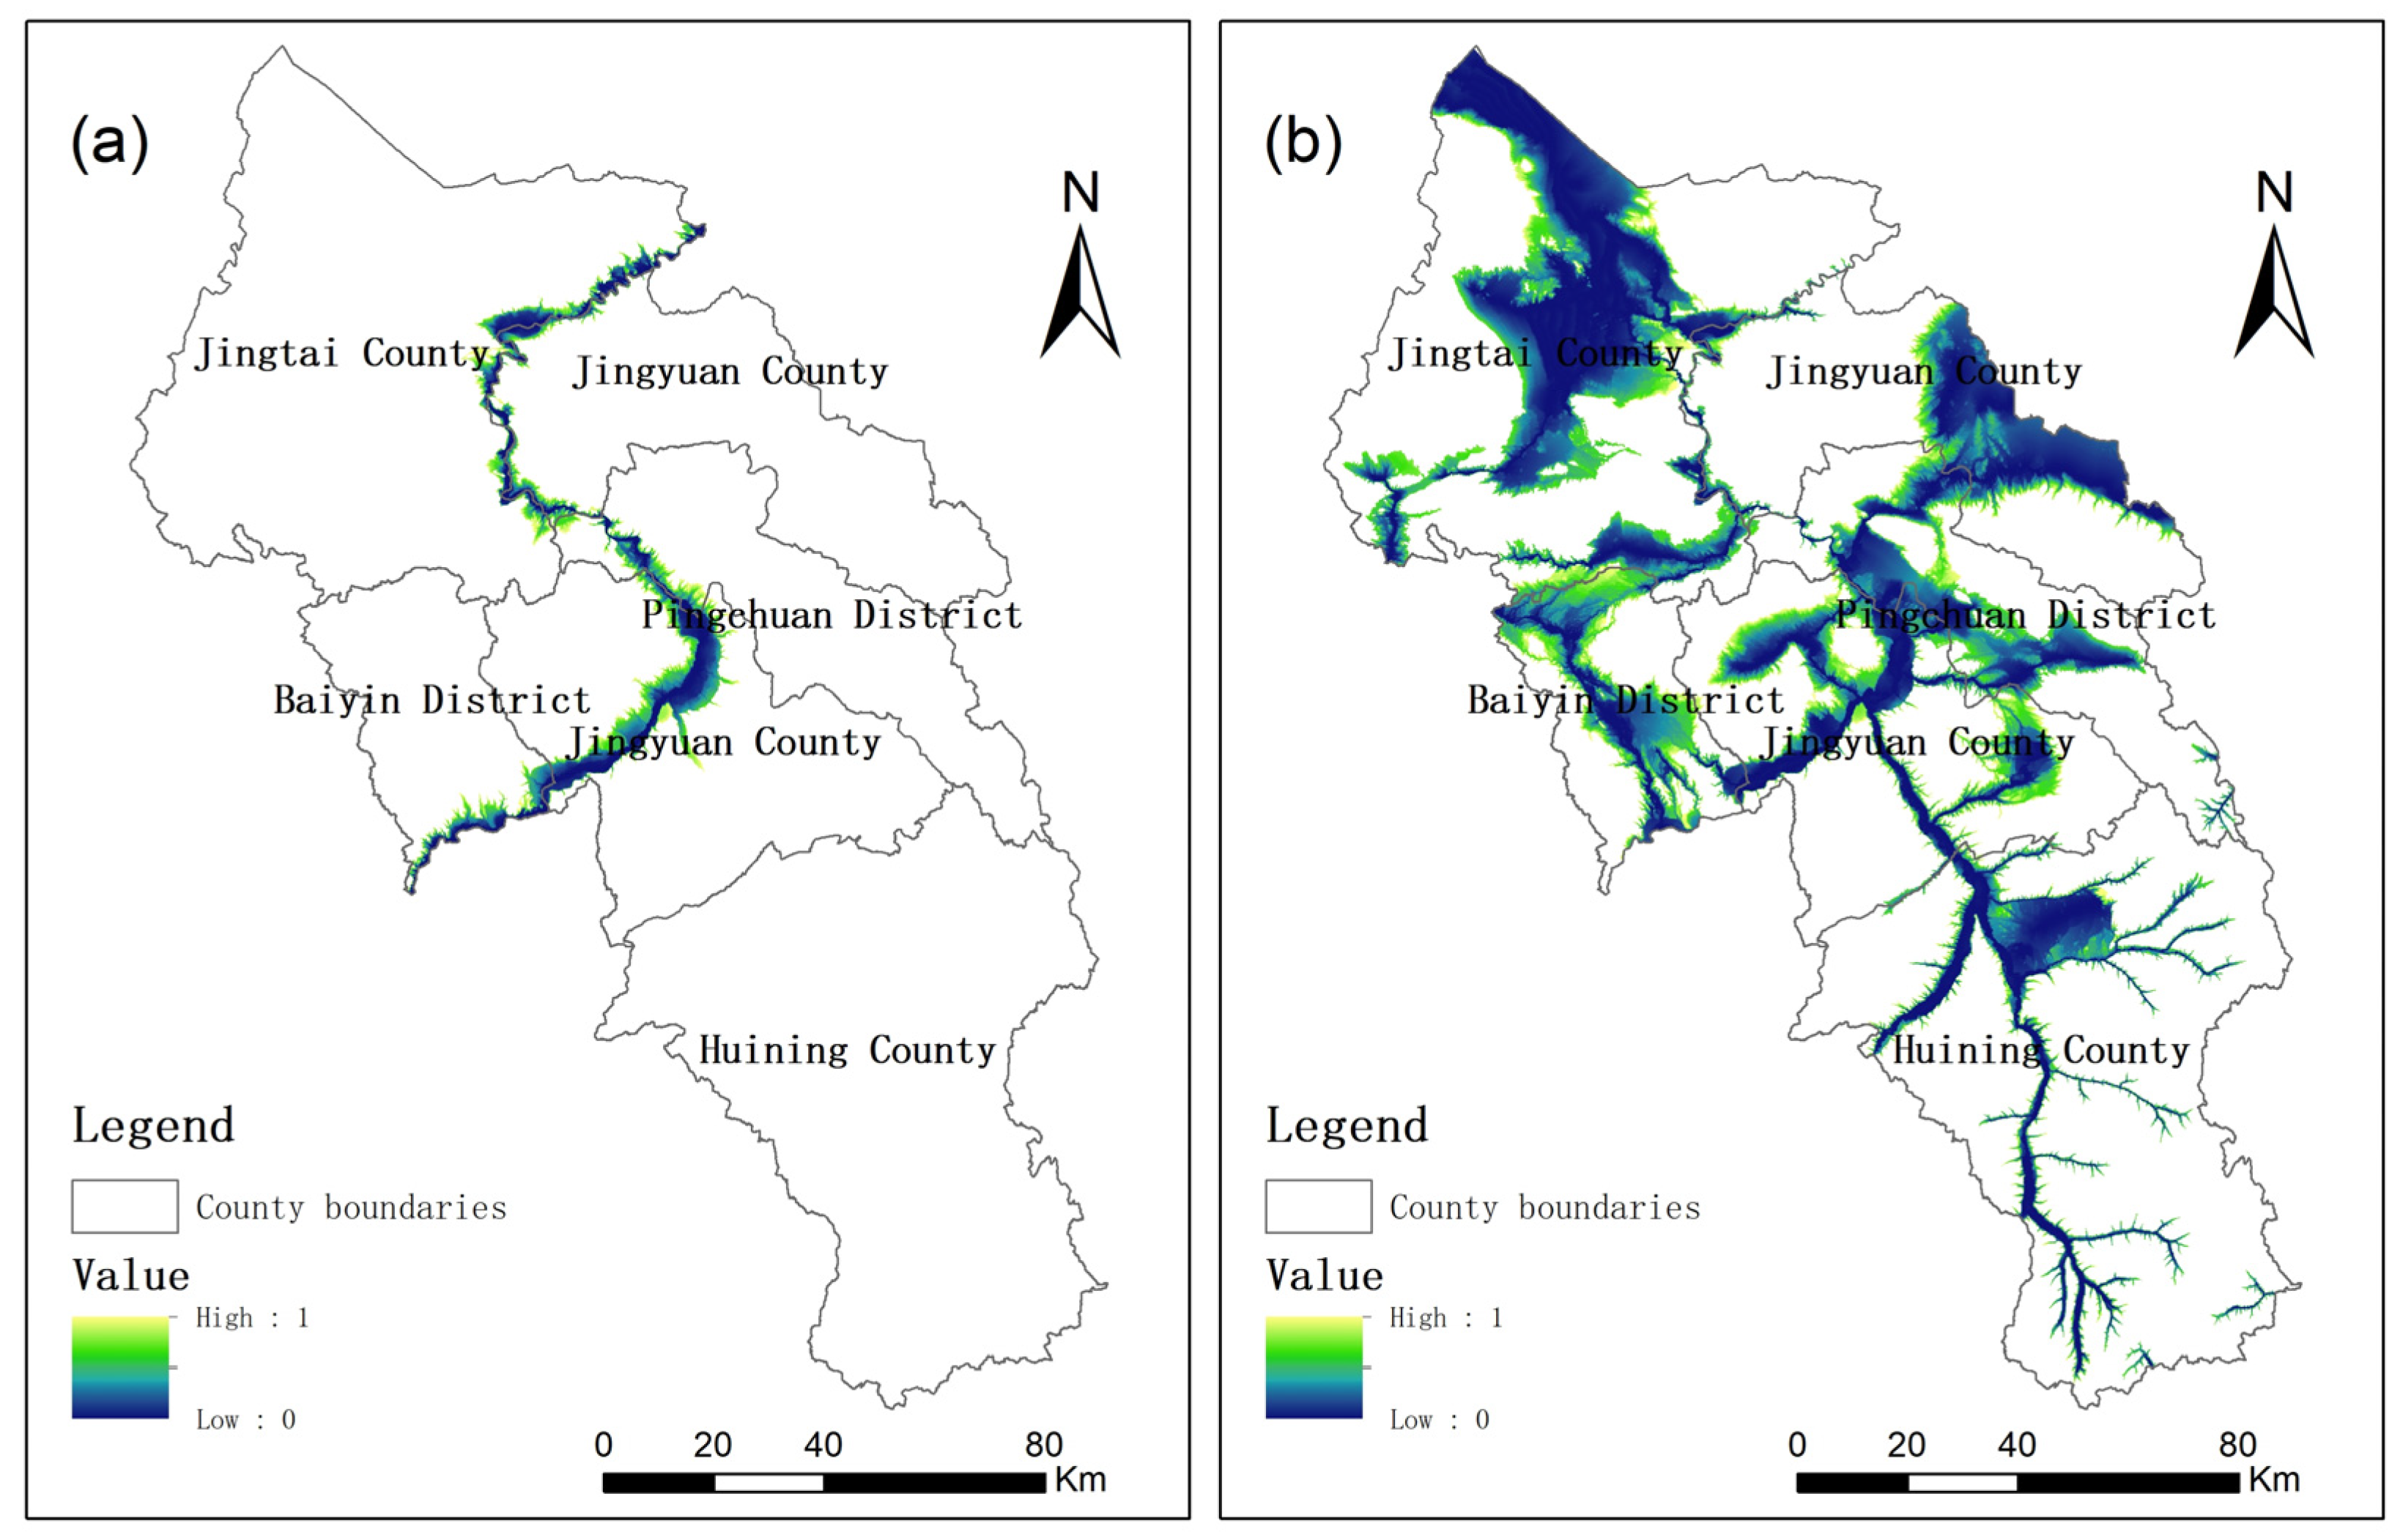
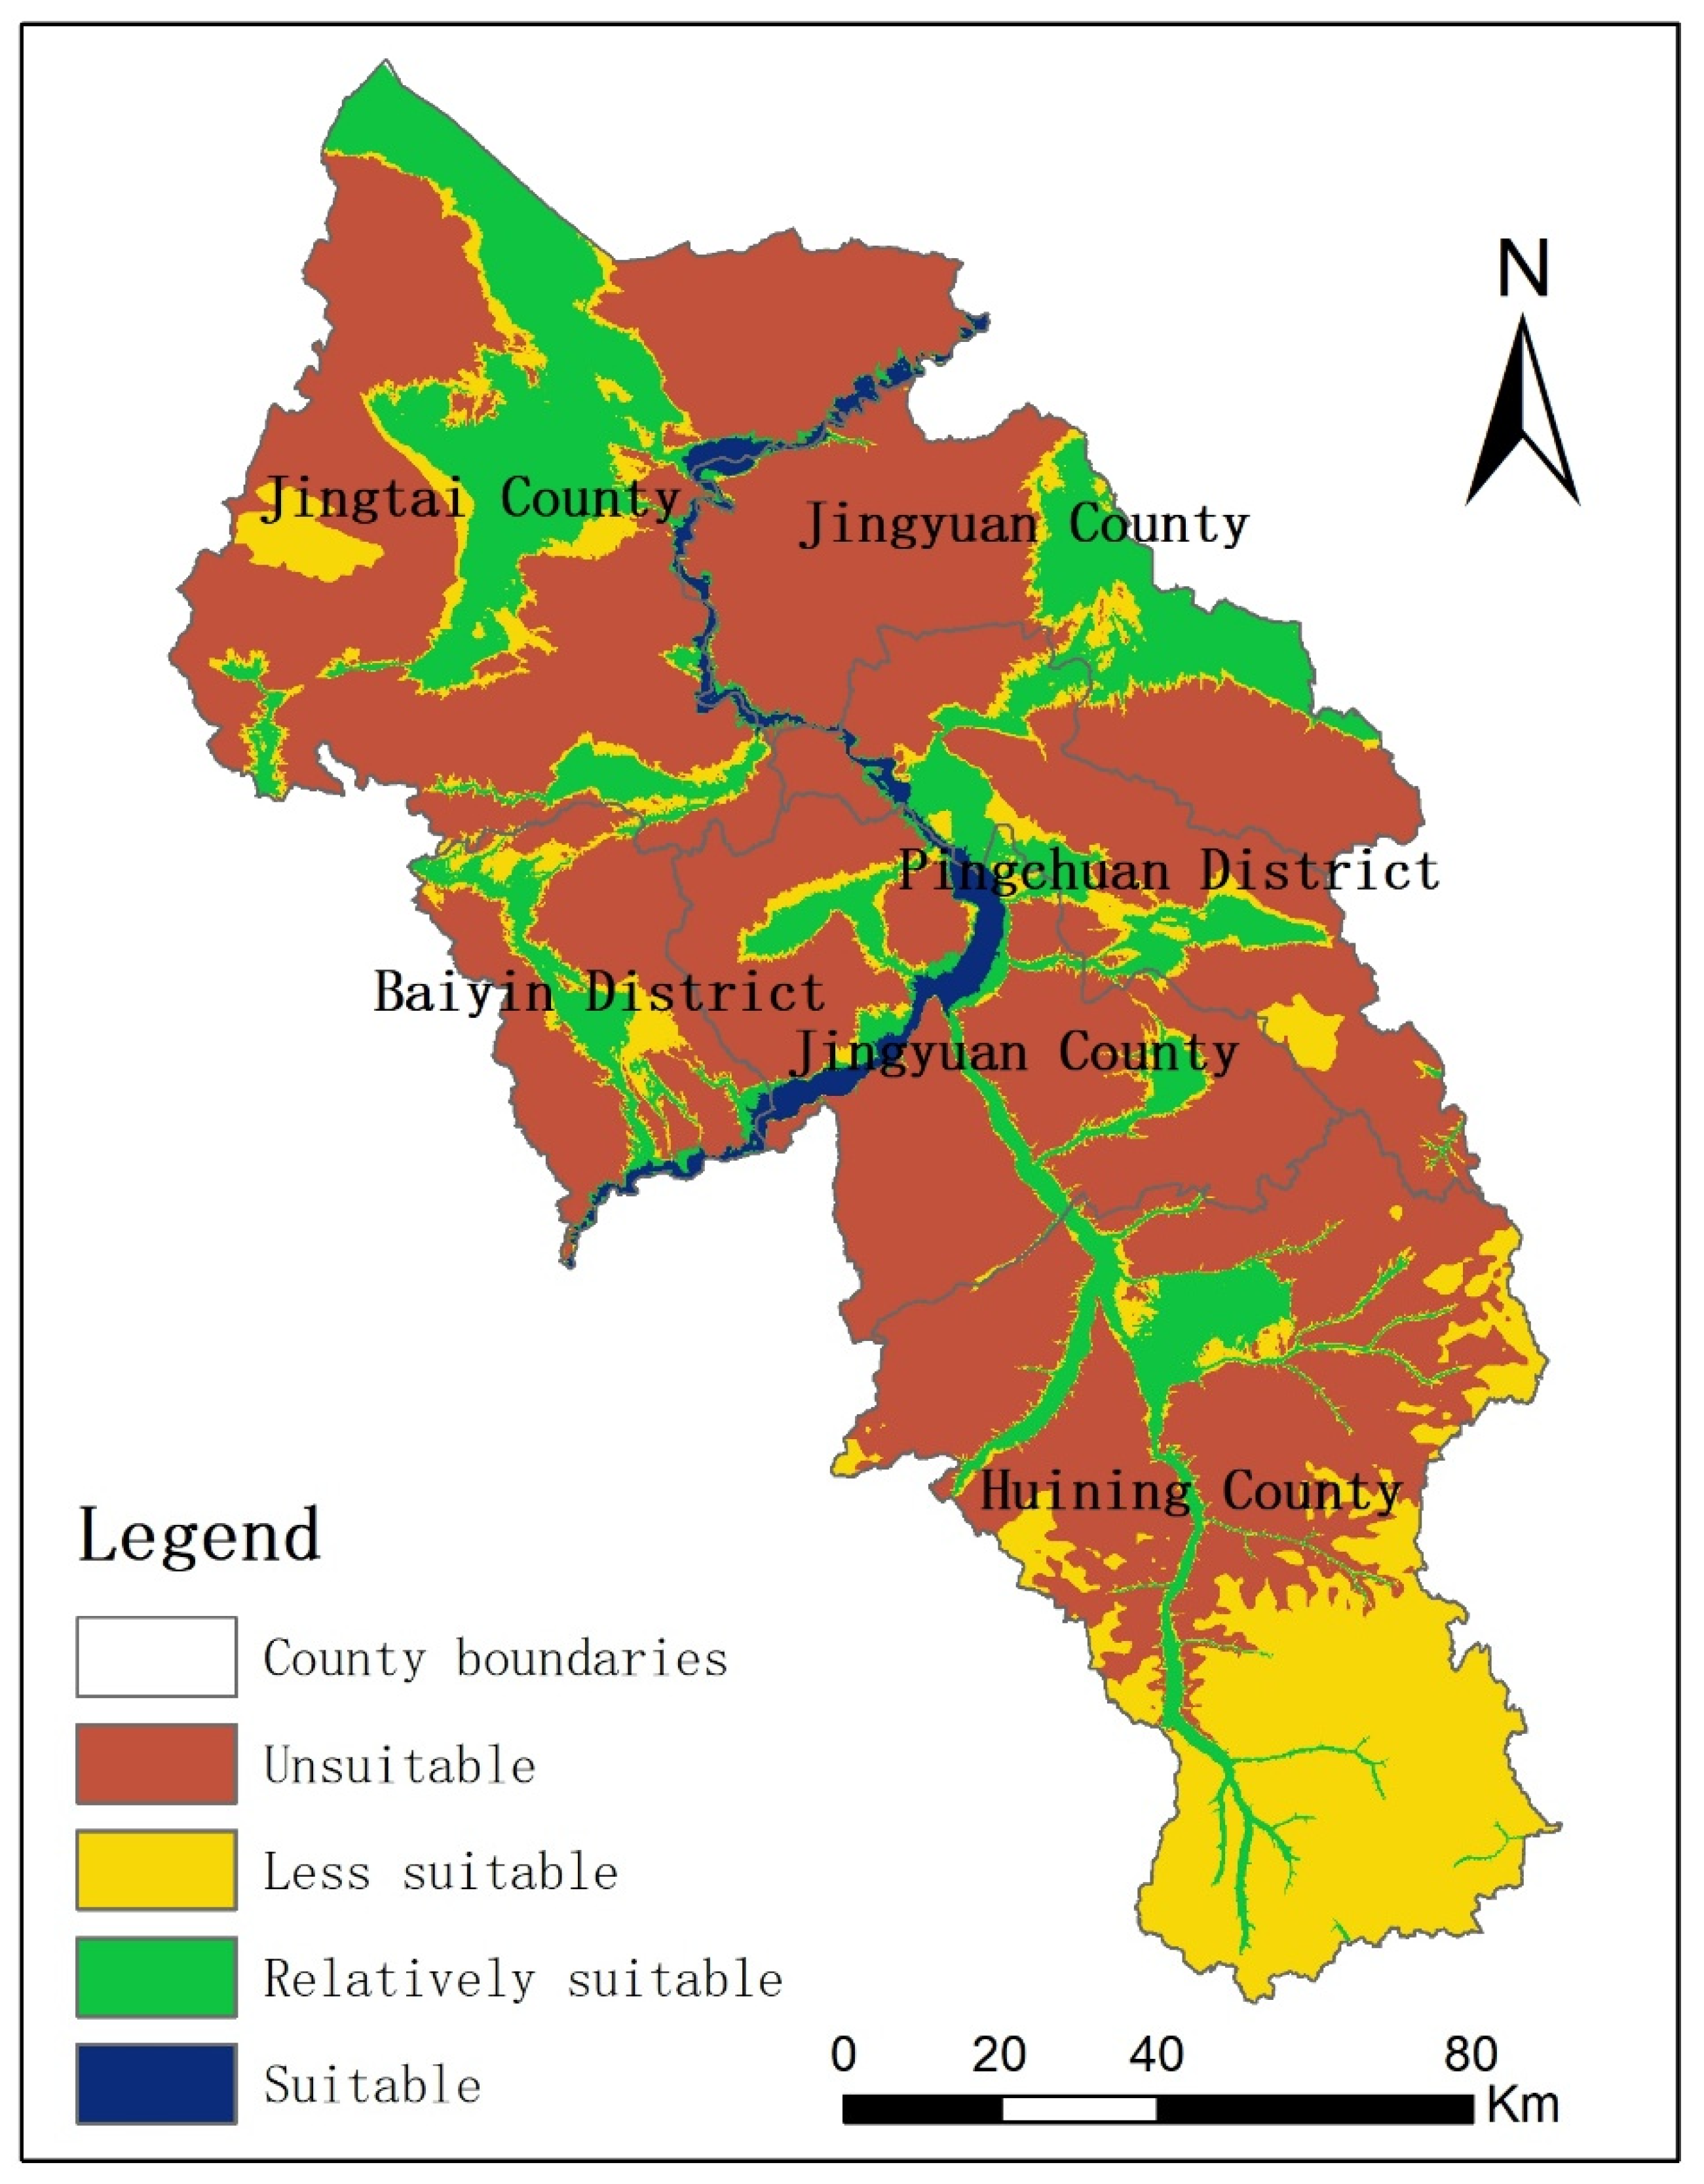
3.1. WRSA
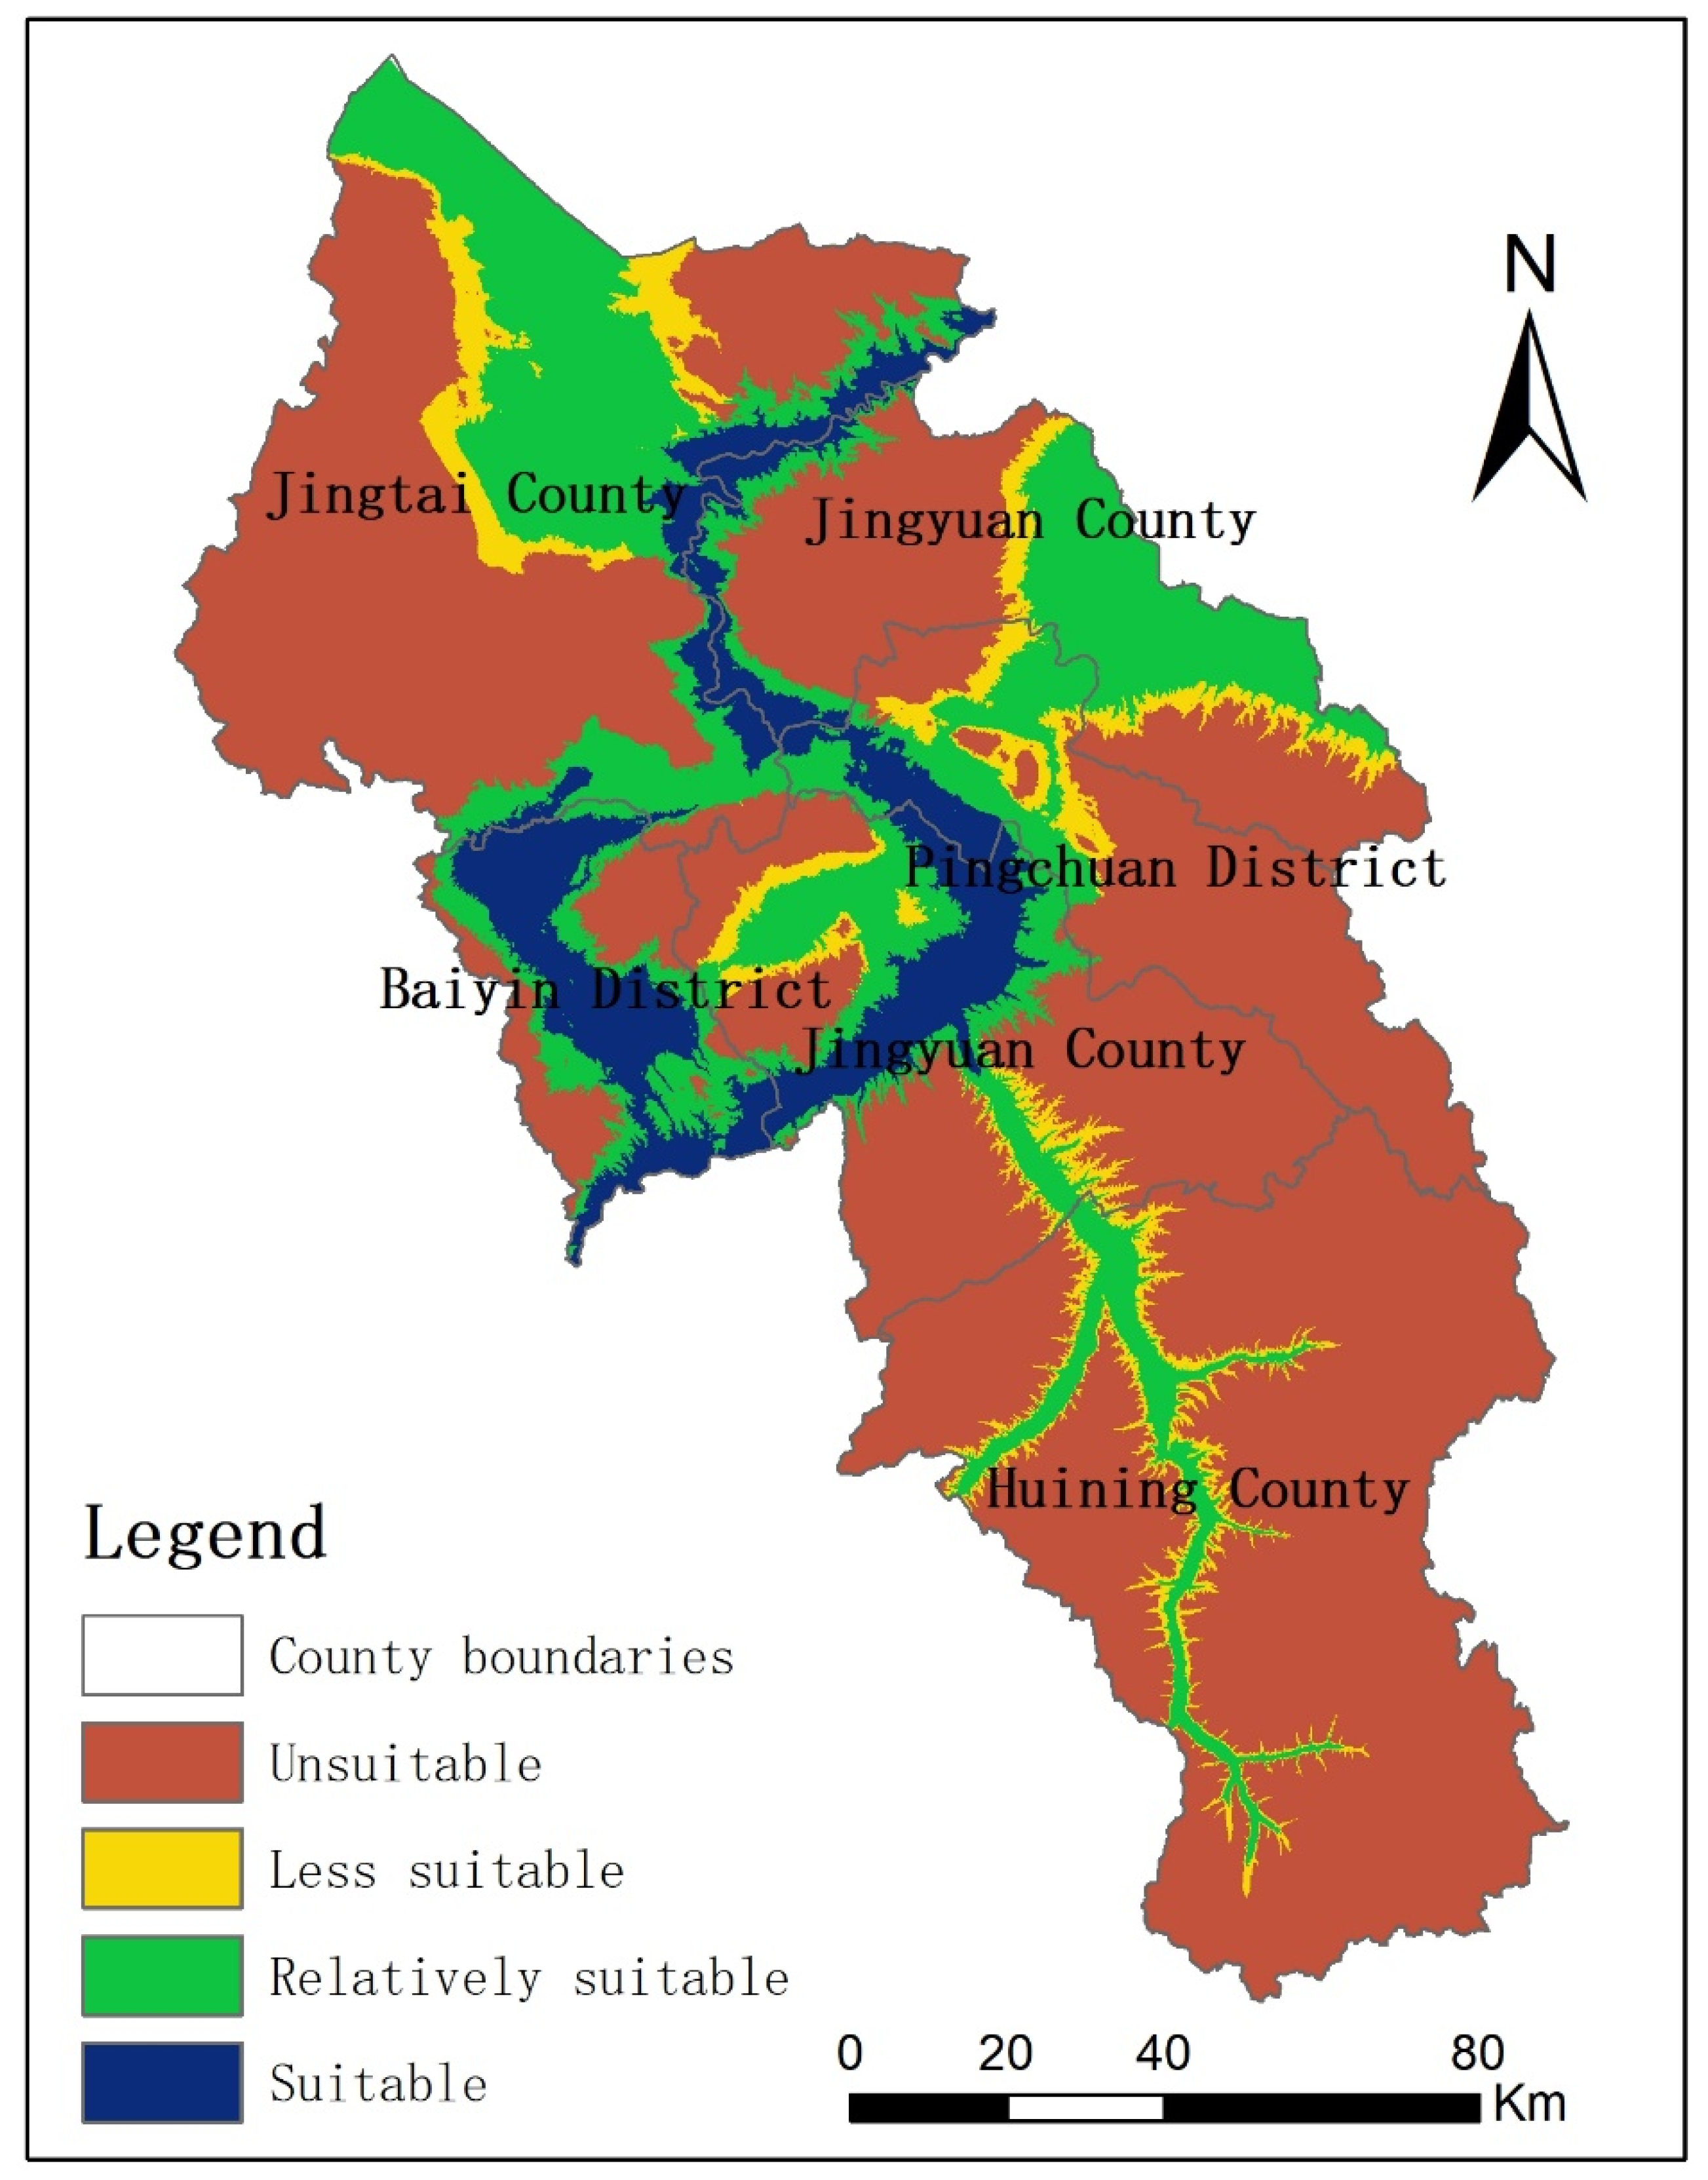
3.2. WRSU
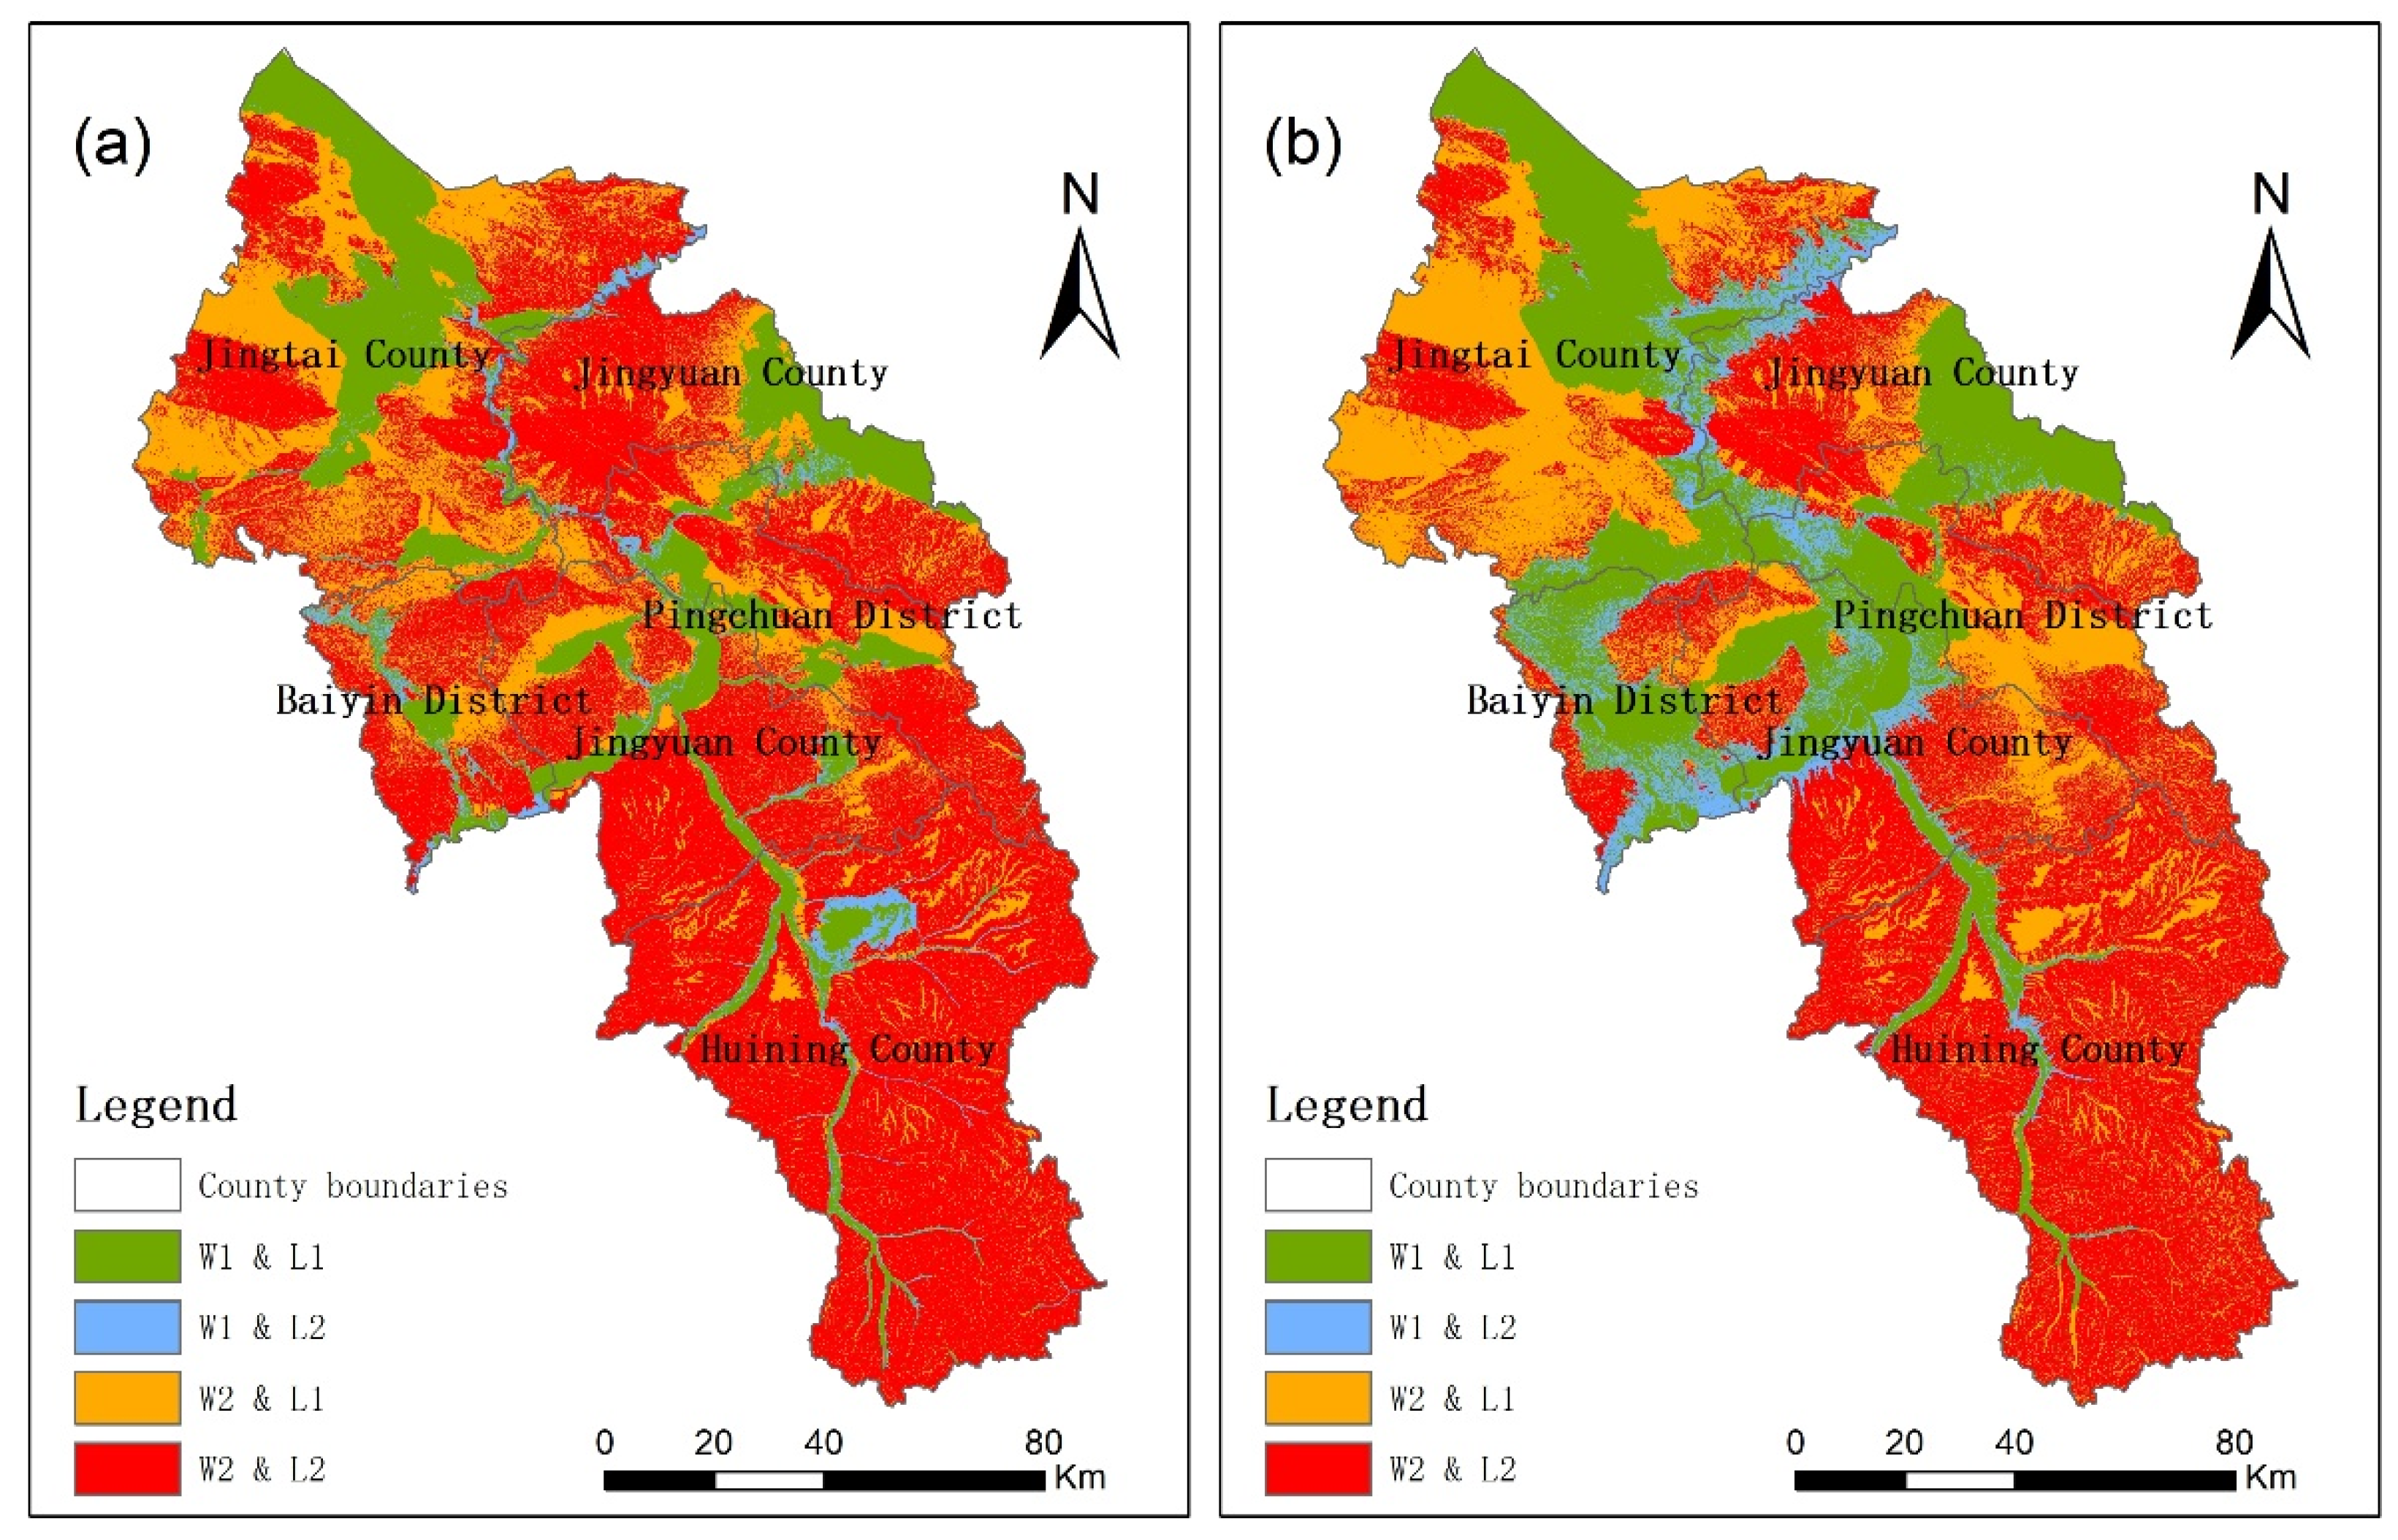
3.3. Coupling Analysis with Suitability of Land Resource
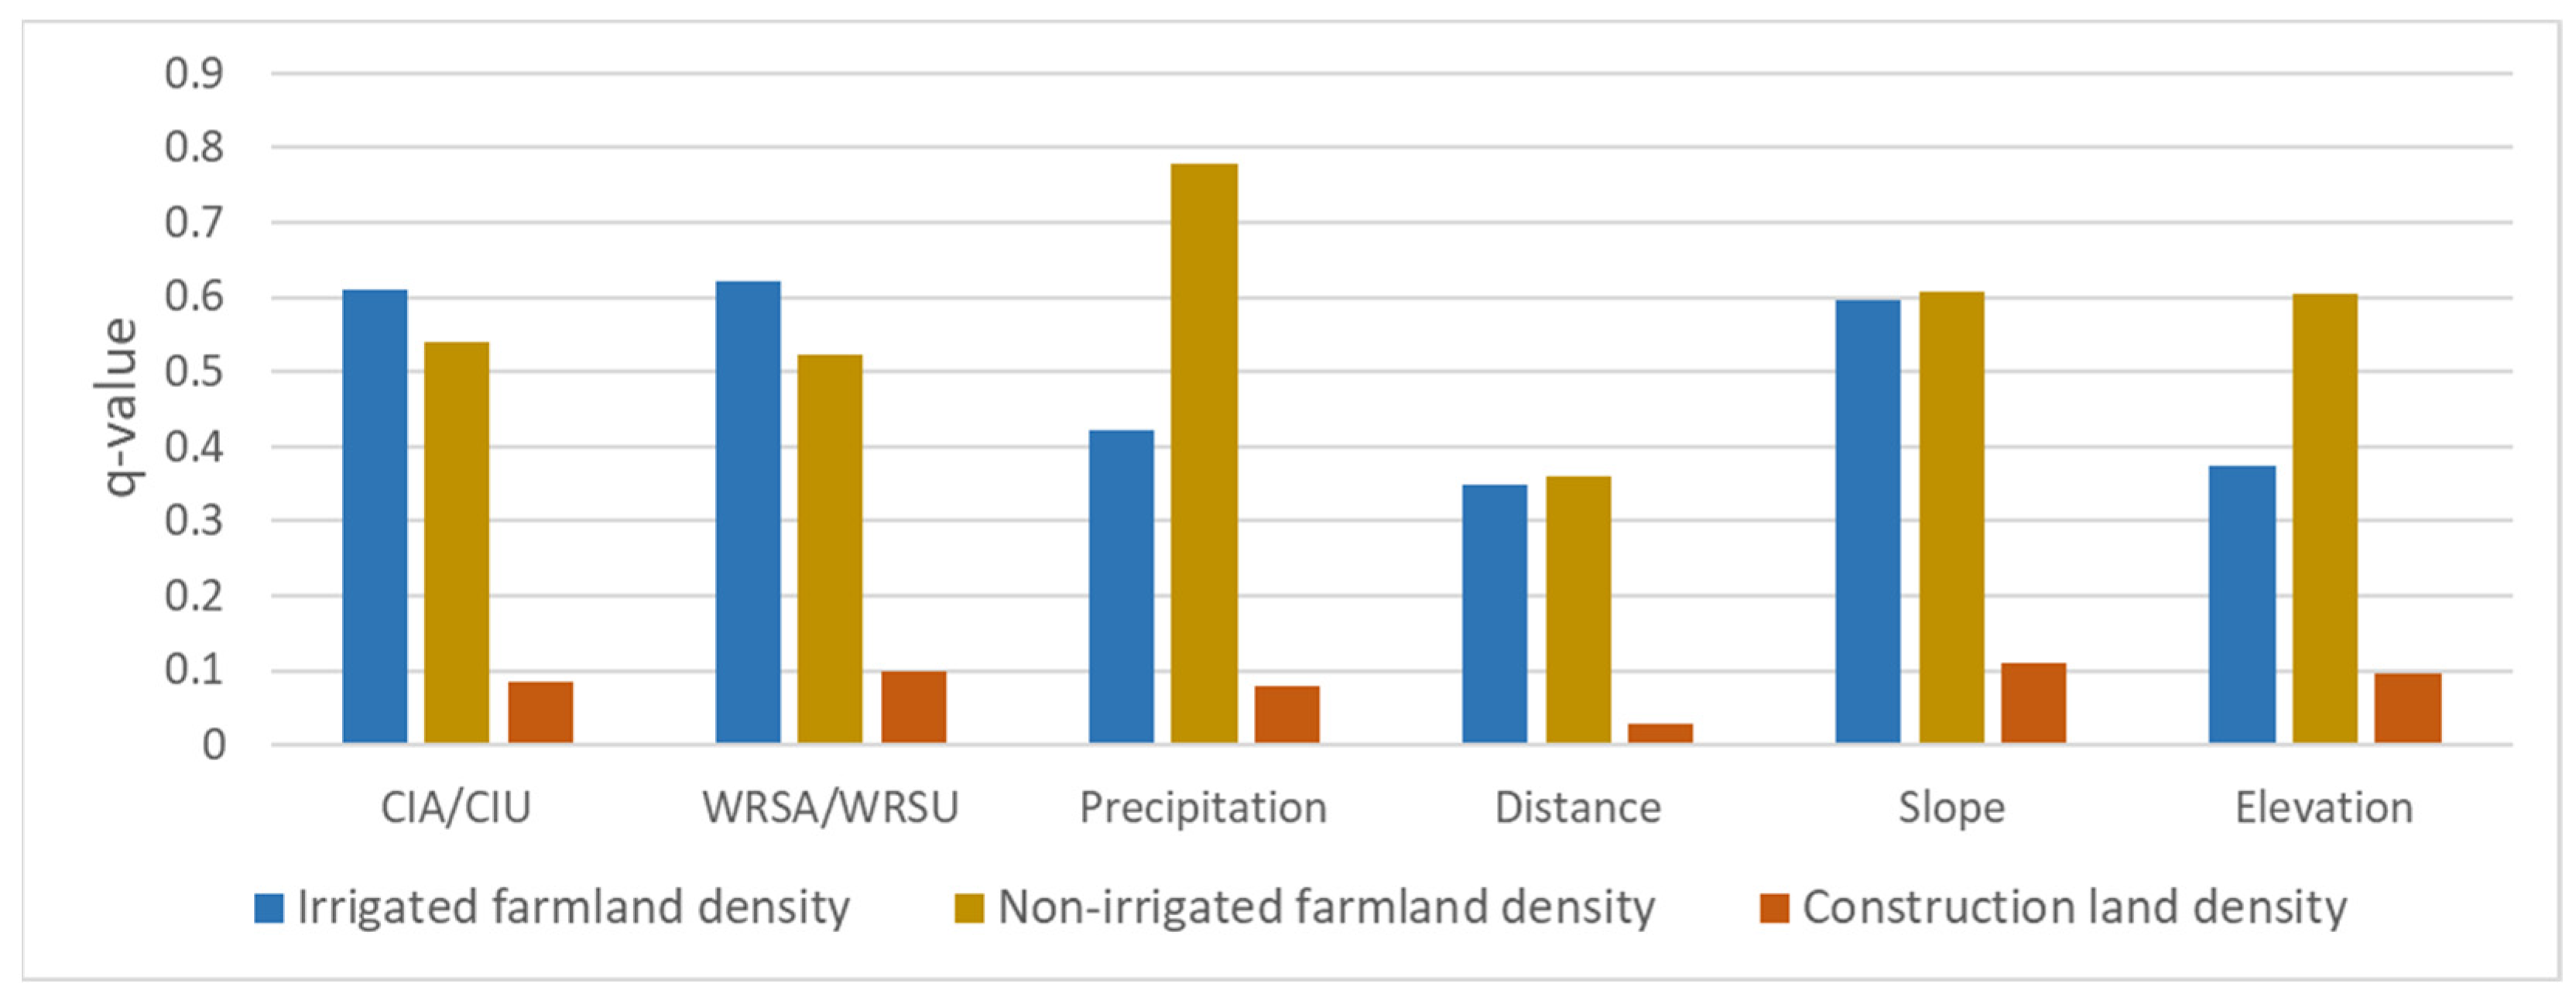
3.4. Interaction Detection Results by Geodetector
4. Discussion
4.1. Advantages of the Indicators
4.2. Applications in Territorial Spatial Planning
4.3. Limitations
5. Conclusions
Funding
Institutional Review Board Statement
Informed Consent Statement
Data Availability Statement
Acknowledgments
Conflicts of Interest
References
- Winpenny, J.T. Managing Water Scarcity for Water Security (Prepared for FAO). 1996. Available online: http://www.fao.org/ag/agl/aglw/webpub/scarcity.htm (accessed on 1 October 2022).
- Gleick, P. The World’s Water 2008–2009: The Biennial Report On Freshwater Resources; Island Press: Washington, DC, USA, 2008. [Google Scholar]
- Falkenmark, M.; Lundqvist, J.; Widstrand, C. Macro-scale water scarcity requires micro-scale approaches. Aspects of vulnerability in semi-arid development. Nat. Resour. Forum. 1989, 13, 258–267. [Google Scholar] [CrossRef] [PubMed]
- Ohlsson, L. Environment, Scarcity and Conflict: A Study of Malthusian Concerns. Department of Peace and Development Research; University of Gothenburg: Gothenburg, Sweden, 1999. [Google Scholar]
- Raskin, P.; Gleick, P.; Kirshen, P.; Pontius, G.; Strzepek, K. Water Futures: Assessment of Long-Range Patterns and Prospects; Stockholm Environment Institute: Stockholm, Sweden, 1997. [Google Scholar]
- Shiklomanov, I.A.; Rodda, J.C. World Water Resources at the Beginning of the Twenty-First Century; University of Cambridge: Cambridge, UK, 2003. [Google Scholar]
- Alcamo, J.; Döll, P.; Henrichs, T.; Kaspar, F.; Lehner, B.; Rösch, T.; Siebert, S. Development and testing of the WaterGAP 2 global model of water use and availability. Hydrol. Sci. J. 2003, 48, 317–337. [Google Scholar] [CrossRef]
- Rijsberman, F.R. Water scarcity: Fact or fiction. Agric. Water Manag. 2006, 80, 5–22. [Google Scholar] [CrossRef] [Green Version]
- Hanasaki, N.; Kanae, S.; Oki, T.; Masuda, K.; Motoya, K.; Shirakawa, N.; Shen, Y.; Tanaka, K. An integrated model for the assessment of global water resources—Part 2: Applications and assessments. Hydrol. Earth Syst. Sci. 2008, 12, 1027–1037. [Google Scholar] [CrossRef] [Green Version]
- Wada, Y.; van Beek, L.P.H.; Bierkens, M.F.P. Modelling global water stress of the recent past: On the relative importance of trends in water demand and climate variability. Hydrol. Earth Syst. Sci. 2011, 15, 3785–3808. [Google Scholar] [CrossRef] [Green Version]
- Schewe, J.; Heinke, J.; Gerten, D.; Haddeland, I.; Arnell, N.W.; Clark, D.B.; Dankers, R.; Eisner, S.; Fekete, B.M.; Colón-González, F.J.; et al. Multimodel assessment of water scarcity under climate change. Proc. Natl. Acad. Sci. USA 2014, 111, 3245–3250. [Google Scholar] [CrossRef] [Green Version]
- Kummu, M.; Guillaume, J.H.A.; de Moel, H.; Eisner, S.; Flörke, M.; Porkka, M.; Siebert, S.; Veldkamp, T.I.E.; Ward, P.J. The world’s road to water scarcity: Shortage and stress in the 20th century and pathways towards sustainability. Sci. Rep. 2016, 6, 38495. [Google Scholar] [CrossRef] [Green Version]
- Munia, H.; Guillaume, J.H.A.; Mirumachi, N.; Porkka, M.; Wada, Y.; Kummu, M. Water stress in global transboundary river basins: Significance of upstream water use on downstream stress. Environ. Res. Lett. 2016, 11, 14002. [Google Scholar] [CrossRef]
- Shi, Y.F.; Qu, Y.G. The Carrying Capacity of Water Resources and Its Reasonable Use of Urumqi River; Science Press: Beijing, China, 1992; pp. 94–111. [Google Scholar]
- Li, L.J.; Guo, H.C.; Chen, B.; Sun, H.L. Water Resource Supporting Capacity of Chaidamu Basin. Environ. Sci. 2000, 2, 20–23+11. [Google Scholar]
- Wang, H.; Chen, M.J.; Qing, D.Y. Research on Reasonable Water Allocation and Bearing Capacity of Water in Northwest Area; The Yellow River Water Conservancy Press: Zhengzhou, China, 2003. [Google Scholar]
- Zhang, Y.Y.; Xia, J.; Wang, Z.G. Research on Regional Water Resources Carrying Capacity Theory and Method. Prog. Geogr. 2007, 2, 126–132. [Google Scholar]
- Duan, C.Q.; Liu, C.M.; Chen, X.N.; Liu, W.H.; Zheng, H.X. Preliminary Research on Regional Water Resources Carrying Capacity Conception and Method. Acta Geogr. Sin. 2010, 65, 82–90. [Google Scholar]
- Dang, L.J.; Xu, Y.; Wang, Z.Q. Study on Population Carrying Capacity of Water Resources in Yulin City, Shanxi Province. Res. Soil Water Conserv. 2014, 21, 90–97. [Google Scholar]
- Wang, J.H.; Jiang, D.C.; Xiao, W.H.; Chen, Y.; Hu, P. Study on theoretical analysis of water resources carrying capacity: Definition and scientific topics. J. Hydraul. Eng. 2017, 48, 1399–1409. [Google Scholar]
- Li, J.Y.; Li, L.J. Water resources supporting capacity to regional socio-economic development of China. Acta Feographica Sin. 2012, 67, 410–419. [Google Scholar]
- Zhou, D.J.; Xu, Y.; Wang, Y.F.; Zhou, K.; Liu, B.Y.; Li, J.Y.; Fan, J. Methodology and role of “Double Evaluation” in optimization of spatial development pattern. Bull. Chin. Acad. Sci. 2020, 35, 814–824. [Google Scholar]
- UNESCO; FAO. Carrying Capacity Assessment with a Pilot Study of Kenya: A Resource Accounting Methodology for Sustainable Development; UNESCO: Paris, France; FAO: Rome, Italy, 1985. [Google Scholar]
- Xu, Y.P. A study of comprehensive evaluation of the water resource carrying capacity in the arid area—A case study in the Hetian river basin of xinjiang water. J. Nat. Resour. 1993, 8, 229–237. [Google Scholar]
- Qu, Y.G.; Fan, S.Y. Water Resources Capacity and Developing Strategies in Heihe River Basin. J. Desert Res. 2000, 20, 2–9. [Google Scholar]
- Zhu, Y.Z.; Xia, J.; Tan, G. Measurement and evaluation of water resource carrying capacity of northwest China. Resour. Sci. 2003, 4, 43–48. [Google Scholar]
- Gao, R.Z.; Li, H.P.; Tong, C.F.; Ge, R.L. Comprehensive Evaluation and Analysis of Water Resources Capacity in Erdos Area. Res. Soil Water Conserv. 2011, 18, 139–142. [Google Scholar]
- Han, Y.; Zhang, S.F.; Lv, A.F. Research of effect on water resources carrying capacity in Beijing-Tianjin-Hebei region by water transfer. Resour. Sci. 2018, 40, 2236–2246. [Google Scholar]
- Working Committee of Natural Regionalization of Chinese Academy of Sciences. First Draft of Comprehensive Natural Regionalization of China; Science Press: Beijing, China, 1959. [Google Scholar]
- Li, S. Agroclimatic Resources and Agroclimatic Regions in China Row; Science Press: Beijing, China, 1988. [Google Scholar]
- Tian, Z.; Zheng, D.; Wang, Y. Discussion on the Evaluation, Development and Utilization of Climate Resources in Beijing Mountainous Area; Meteorological Publishing House: Beijing, China, 2008. [Google Scholar]
- Harris, J.M.; Kennedy, S. Carrying capacity in agriculture: Global and regional issues. Ecol. Econ. 1999, 29, 443–461. [Google Scholar] [CrossRef]
- Rijsberman, M.A.; van de Ven, F.H.M. Different approaches to assessment of design and management of sustainable urban water systems. Environ. Impact Asses. 2000, 20, 333–345. [Google Scholar] [CrossRef]
- Taikan, O.; Shinjiro, K. Global Hydrological Cycles and World Water Resources. Science 2006, 313, 1068–1073. [Google Scholar]
- Zhang, D.; Feng, Z.M.; Liu, D.W. Evaluation of water resource in Third-Order Basins in China based on carrying capacity. Resour. Sci. 2008, 30, 1471–1477. [Google Scholar]
- Falloon, P.; Betts, R. Climate impacts on European agriculture and water management in the context of adaptation and mitigation—The importance of an integrated approach. Sci. Total Environ. 2010, 408, 5667–5687. [Google Scholar] [CrossRef]
- Elliott, J.; Deryng, D.; Müller, C.; Frieler, K.; Konzmann, M.; Gerten, D.; Glotter, M.; Flörke, M.; Wada, Y.; Best, N.; et al. Constraints and potentials of future irrigation water availability on agricultural production under climate change. Proc. Natl. Acad. Sci. USA 2014, 111, 3239–3244. [Google Scholar] [CrossRef] [Green Version]
- Aldababseh, A.; Temimi, M.; Maghelal, P.; Branch, O.; Wulfmeyer, V. Multi-Criteria Evaluation of Irrigated Agriculture Suitability to Achieve Food Security in an Arid Environment. Sustainability 2018, 10, 803. [Google Scholar] [CrossRef] [Green Version]
- Özkan, B.; Dengiz, O.; Turan, İ.D. Site suitability analysis for potential agricultural land with spatial fuzzy multi-criteria decision analysis in regional scale under semi-arid terrestrial ecosystem. Sci. Rep. 2020, 10, 22074. [Google Scholar] [CrossRef] [PubMed]
- Liu, Y.; Zhou, Y. Territory spatial planning and national governance system in China. Land Use Policy 2021, 102, 105288. [Google Scholar] [CrossRef]
- Li, S.; Zhao, X.; Pu, J.; Miao, P.; Wang, Q.; Tan, K. Optimize and control territorial spatial functional areas to improve the ecological stability and total environment in karst areas of Southwest China. Land Use Policy 2021, 100, 104940. [Google Scholar] [CrossRef]
- Lane, M. The carrying capacity imperative: Assessing regional carrying capacity methodologies for sustainable land-use planning. Land Use Policy 2010, 27, 1038–1045. [Google Scholar] [CrossRef] [Green Version]
- Everest, T.; Sungur, A.; Özcan, H. Determination of agricultural land suitability with a multiple-criteria decision-making method in Northwestern Turkey. Int. J. Environ. Sci. Technol. 2021, 18, 1073–1088. [Google Scholar] [CrossRef] [PubMed]
- Joardar, S.D. Carrying capacities and standards as bases towards urban infrastructure planning in India. Habitat Int. 1998, 22, 327–337. [Google Scholar] [CrossRef]
- Joerin, F.; Thériault, M.; Musy, A. Using GIS and outranking multicriteria analysis for land-use suitability assessment. Int. J. Geogr. Inf. Sci. 2001, 15, 153–174. [Google Scholar] [CrossRef]
- Taghizadeh-Mehrjardi, R.; Nabiollahi, K.; Rasoli, L.; Kerry, R.; Scholten, T. Land Suitability Assessment and Agricultural Production Sustainability Using Machine Learning Models. Agronomy 2020, 10, 573. [Google Scholar] [CrossRef]
- Hagos, Y.G.; Mengie, M.A.; Andualem, T.G.; Yibeltal, M.; Linh, N.T.T.; Tenagashaw, D.Y.; Hewa, G. Land suitability assessment for surface irrigation development at Ethiopian highlands using geospatial technology. Appl. Water Sci. 2022, 12, 98. [Google Scholar] [CrossRef]
- Al-Hanbali, A.; Shibuta, K.; Alsaaideh, B.; Tawara, Y. Analysis of the land suitability for paddy fields in Tanzania using a GIS-based analytical hierarchy process. Geo-Spat. Inf. Sci. 2022, 25, 212–228. [Google Scholar] [CrossRef]
- Zhu, G.; Wang, M.; Li, Q.L.; Liu, J.; Zhao, Y.N.; Gao, J.W.; Xu, H.L. Land development suitability analysis for transport planning evaluation and optimization in mountainous ecological region. J. Mt. Sci.-Engl. 2022, 19, 862–873. [Google Scholar] [CrossRef]
- Li, J.Y. Water Resources Suitability Evaluation. In Evaluation of Resource and Environmental Carrying Capacity for Post-Earthquake Restoration and Reconstruction in Lushan, 1st ed.; Fan, J., Ed.; Science Press: Beijing, China, 2014; pp. 139–153. [Google Scholar]
- Valis, D.; Hasilova, K.; Forbelska, M.; Pietrucha-Urbanik, K. Modelling Water Distribution Network Failures and Deterioration. In Proceedings of the 2017 IEEE International Conference on Industrial Engineering and Engineering Management (IEEM), Singapore, 10–13 December 2017. [Google Scholar] [CrossRef]
- Li, L.; Zhu, G.; Wu, D.; Xu, H.; Ma, P.; Liu, J.; Li, Z.; He, Y.; Li, C.; Wu, P. Land suitability assessment for supporting transport planning based on carrying capacity and construction demand. PLoS ONE 2021, 16, e0246374. [Google Scholar] [CrossRef]
- Feng, Z.M.; Sun, T.; Yang, Y.Z.; Yan, H.M. The Progress of Resources and Environment Carrying Capacity: From Single-factor Carrying Capacity Research to Comprehensive Research. J. Resour. Ecol. 2018, 9, 125–134. [Google Scholar] [CrossRef]
- Wang, Z. Land Spatial Development Based on Carrying Capacity, Land Development Potential, and Efficiency of Urban Agglomerations in China. Sustainability 2018, 10, 4701. [Google Scholar] [CrossRef] [Green Version]
- Zhou, K.; Fan, J.; Wang, Y.F.; Li, J.Y. Evaluation of Water Resources Carrying Capacity and Its Guidelines for Spatial Planning in Arid and Semi-Arid Region: A Case in Xiji-Haiyuan-Guyuan Area of Ningxia. Sci. Geogr. Sinca 2019, 39, 232–241. [Google Scholar]
- Wang, Y.F.; Fan, J.; Zhou, K. Territorial function optimization regionalization based on the integration of “Double Evaluation”. Geogr. Res. 2019, 38, 2415–2429. [Google Scholar]
- Shen, L.; Shu, T.; Liao, X.; Yang, N.; Ren, Y.; Zhu, M.; Cheng, G.; Wang, J. A new method to evaluate urban resources environment carrying capacity from the load-and-carrier perspective. Resour. Conserv. Recycl. 2020, 154, 104616. [Google Scholar] [CrossRef]
- Li, P.X.; Zhou, J.; Liu, S.W. Evaluation and integration of natural elements in territorial spatial planning: Progress and prospect. Ecol. Environ. Sci. 2021, 30, 2431–2440. [Google Scholar]
- Zhang, L.; Dawes, W.R.; Walker, G.R. Response of mean annual evapotranspiration to vegetation changes at catchment scale. Water Resour. Res. 2001, 37, 701–708. [Google Scholar] [CrossRef]
- Zhang, L.; Hickel, K.; Dawes, W.R.; Chiew, F.; Briggs, P.R. A Rational Function Approach for Estimating Mean Annual Evapotranspiration. Water Resour. Res. 2004, 40. [Google Scholar] [CrossRef]
- Wang, J.; Li, X.; Christakos, G.; Liao, Y.; Zhang, T.; Gu, X.; Zheng, X. Geographical Detectors-Based Health Risk Assessment and its Application in the Neural Tube Defects Study of the Heshun Region, China. Int. J. Geogr. Inf. Sci. 2010, 24, 107–127. [Google Scholar] [CrossRef]
- Wang, J.F.; Zhang, T.L.; Fu, B.J. A measure of spatial stratified heterogeneity. Ecol. Indic. 2016, 67, 250–256. [Google Scholar] [CrossRef]
- Luo, W.; Jasiewicz, J.; Stepinski, T.; Wang, J.; Xu, C.; Cang, X. Spatial association between dissection density and environmental factors over the entire conterminous United States. Geophys. Res. Lett. 2016, 43, 692–700. [Google Scholar] [CrossRef] [Green Version]
- Yin, Q.; Wang, J.; Ren, Z.; Li, J.; Guo, Y. Mapping the increased minimum mortality temperatures in the context of global climate change. Nat. Commun. 2019, 10, 4640. [Google Scholar] [CrossRef] [Green Version]
- Zhang, L.; Liu, W.; Hou, K.; Lin, J.; Song, C.; Zhou, C.; Huang, B.; Tong, X.; Wang, J.; Rhine, W.; et al. Air pollution exposure associates with increased risk of neonatal jaundice. Nat. Commun. 2019, 10, 3741. [Google Scholar] [CrossRef] [PubMed] [Green Version]
- Feng, R.; Wang, F.; Wang, K.; Wang, H.; Li, L. Urban ecological land and natural-anthropogenic environment interactively drive surface urban heat island: An urban agglomeration-level study in China. Environ. Int. 2021, 157, 106857. [Google Scholar] [CrossRef] [PubMed]
- Hu, M.; Lin, H.; Wang, J.; Xu, C.; Tatem, A.J.; Meng, B.; Zhang, X.; Liu, Y.; Wang, P.; Wu, G.; et al. Risk of Coronavirus Disease 2019 Transmission in Train Passengers: An Epidemiological and Modeling Study. Clin. Infect. Dis. 2021, 72, 604–610. [Google Scholar] [CrossRef]
- Metaxas, D.; Qu, H.; Riedlinger, G.; Wu, P.; Huang, Q.; Yi, J.; De, S. Deep learning-based nuclei segmentation and classification in histopathology images with application to imaging genomics. Comput. Vis. Microsc. Image Anal. 2021, 185–201. [Google Scholar] [CrossRef]
- Xu, B.; Wang, J.; Li, Z.; Xu, C.; Liao, Y.; Hu, M.; Yang, J.; Lai, S.; Wang, L.; Yang, W. Seasonal association between viral causes of hospitalised acute lower respiratory infections and meteorological factors in China: A retrospective study. Lancet Planet Health 2021, 5, E154–E163. [Google Scholar] [CrossRef]
- Chen, J.; Wu, T.; Zou, D.; Liu, L.; Wu, X.; Gong, W.; Zhu, X.; Li, R.; Hao, J.; Hu, G.; et al. Magnitudes and patterns of large-scale permafrost ground deformation revealed by Sentinel-1 InSAR on the central Qinghai-Tibet Plateau. Remote Sens. Environ. 2022, 268, 112778. [Google Scholar] [CrossRef]
- Bao, C.; Zou, J.J. Analysis of spatiotemporal changes of the human-water relationship using water resources constraint intensity index in Northwest China. Ecol. Indic. 2018, 84, 119–129. [Google Scholar] [CrossRef]
- Wang, J.J.; Shi, B.; Bai, T.; Yuan, Q.Y. Spatio-temporal patterns of precipitation and its possible driving factors in the Yellow River Basin. J. Desert Res. 2022, 42, 94–102. [Google Scholar]
- Hou, Q.Q.; Chen, Y.; Pei, T.T.; Ji, Z.X.; Xie, B.P. Analysis of cultivated land’s spatio-temporal changes and influencing factors in Gansu Province in recent 25 years. Arid. Zone Res. 2022, 39, 955–967. [Google Scholar] [CrossRef]
- Zhou, J.J.; Feng, W.; Xiang, J.; Huang, M.H. Analysis of drought characteristics in Gansu Province in recent 58 years based on SPEI index. J. Meteorol. Sci. 2022, 42, 99–107. [Google Scholar]


| Yellow River | Other Rivers and Canals | ||
|---|---|---|---|
| CIA | 0–0.5 | suitable | relatively suitable |
| 0.5–1 | relatively suitable | less suitable | |
| >1 | less suitable (precipitation ≥ 400 mm) | ||
| unsuitable (precipitation < 400 mm) | |||
| CIU | |||
|---|---|---|---|
| 0~0.5 | 0.5~1 | >1 | |
| Yellow River and central city trunk canal | suitable | relatively suitable | unsuitable |
| Other rivers and canals | relatively suitable | less suitable | unsuitable |
| WRSA | Area (km2) | Cultivated Land Area (km2) | Proportion of Cultivated Land (%) | Irrigated Farmland Area (km2) | Proportion of Irrigation (%) |
|---|---|---|---|---|---|
| Suitable | 381.0 | 133.7 | 35.1 | 131.6 | 98.4 |
| Relatively suitable | 3354.7 | 1329.2 | 39.6 | 944.0 | 71.0 |
| Less suitable | 3663.9 | 1718.0 | 46.9 | 83.8 | 4.9 |
| Unsuitable | 12,700.7 | 2570.4 | 20.2 | 135.6 | 5.3 |
| Total | 20,100.4 | 5751.2 | 28.6 | 1294.9 | 22.5 |
| WRSU | Area (km2) | Constructed Land Area (km2) | Proportion of Constructed Land (%) |
|---|---|---|---|
| Suitable | 1657.7 | 55.3 | 3.3 |
| Relatively suitable | 4184.5 | 68.7 | 1.6 |
| Less suitable | 1177.7 | 4.1 | 0.3 |
| Unsuitable | 13,075.7 | 13.7 | 0.1 |
| Total | 20,095.7 | 141.7 | 0.7 |
| Suitability of Land Resources for Agricultural Production | |||||||
|---|---|---|---|---|---|---|---|
| Suitable | Relatively Suitable | Moderately Suitable | Less Suitable | Unsuitable | Total | ||
| WRSA | Suitable | 55.50 | 24.89 | 6.85 | 1.53 | 0.09 | 34.53 |
| Relatively suitable | 41.86 | 19.70 | 4.94 | 0.97 | 0.46 | 28.14 | |
| Less suitable | 16.13 | 4.34 | 0.31 | 0.04 | 0.02 | 2.29 | |
| Unsuitable | 6.55 | 2.29 | 0.26 | 0.06 | 0.01 | 1.07 | |
| Total | 32.32 | 6.75 | 0.58 | 0.08 | 0.02 | 6.44 | |
| Suitability of Land Resources for Urban Construction | ||||||
|---|---|---|---|---|---|---|
| Suitable | Relatively Suitable | Less Suitable | Unsuitable | Total | ||
| WRSU | Suitable | 7.06 | 2.10 | 0.35 | 0.05 | 3.34 |
| Relatively suitable | 2.70 | 0.88 | 0.27 | 0.09 | 1.64 | |
| Less suitable | 0.90 | 0.27 | 0.08 | 0.06 | 0.35 | |
| Unsuitable | 0.44 | 0.14 | 0.04 | 0.01 | 0.10 | |
| Total | 2.39 | 0.51 | 0.08 | 0.01 | 0.71 | |
| CIU | WRSU | Precipitation | Distance | Slope | Elevation | |
|---|---|---|---|---|---|---|
| CIU | 0.084 | |||||
| WRSU | 0.106 | 0.099 | ||||
| Precipitation | 0.289 | 0.322 | 0.079 | |||
| Distance | 0.235 | 0.285 | 0.204 | 0.030 | ||
| Slope | 0.366 | 0.409 | 0.243 | 0.192 | 0.110 | |
| Elevation | 0.249 | 0.313 | 0.312 | 0.254 | 0.174 | 0.097 |
Publisher’s Note: MDPI stays neutral with regard to jurisdictional claims in published maps and institutional affiliations. |
© 2022 by the author. Licensee MDPI, Basel, Switzerland. This article is an open access article distributed under the terms and conditions of the Creative Commons Attribution (CC BY) license (https://creativecommons.org/licenses/by/4.0/).
Share and Cite
Li, J. Evaluation Methods for Water Resource Suitability in Territorial Spatial Planning: A Case Study of Baiyin City in a Semi-Arid Region. Int. J. Environ. Res. Public Health 2022, 19, 12973. https://doi.org/10.3390/ijerph191912973
Li J. Evaluation Methods for Water Resource Suitability in Territorial Spatial Planning: A Case Study of Baiyin City in a Semi-Arid Region. International Journal of Environmental Research and Public Health. 2022; 19(19):12973. https://doi.org/10.3390/ijerph191912973
Chicago/Turabian StyleLi, Jiuyi. 2022. "Evaluation Methods for Water Resource Suitability in Territorial Spatial Planning: A Case Study of Baiyin City in a Semi-Arid Region" International Journal of Environmental Research and Public Health 19, no. 19: 12973. https://doi.org/10.3390/ijerph191912973