Article

Statistical Analysis of Absenteeism in a University Hospital Center between 2007 and 2019

1
Occupational and Environmental Medicine, CHU Clermont-Ferrand, F-63000 Clermont-Ferrand, France
2
Biostatistics Unit, CHU Clermont-Ferrand, F-63000 Clermont-Ferrand, France
3
Blaise Pascal Mathematics Laboratory, Mathematics Department, Université Clermont Auvergne, F-63000 Clermont-Ferrand, France
4
Cikaba—Quality, Health, Safety and Environment Software for Prevention, F-63000 Clermont-Ferrand, France
5
CNRS, LaPSCo, Physiological and Psychosocial Stress, Occupational and Environmental Medicine, CHU Clermont-Ferrand, Université Clermont Auvergne, WittyFit, F-63000 Clermont-Ferrand, France
6
School of Health and Life Sciences, Institute for Clinical Exercise & Health Science, University of the West of Scotland, South Lanarkshire, Scotland G72 0LH, UK
7
CNRS, INSERM, GReD, Ophthalmology, CHU Clermont-Ferrand, University Hospital of Clermont-Ferrand, F-63000 Clermont-Ferrand, France
8
Department of Sport, Physical Education and Health, Centre for Health and Exercise Science Research, Hong Kong Baptist University, Hong Kong, China
*
Author to whom correspondence should be addressed.
Int. J. Environ. Res. Public Health 2022, 19(19), 12966; https://doi.org/10.3390/ijerph191912966
Submission received: 26 September 2022 / Accepted: 7 October 2022 / Published: 10 October 2022
(This article belongs to the Special Issue Quantitative Analysis Using Public Healthcare Data)

Abstract

:
Objectives: To estimate the evolution of compressible absenteeism in a hospital center and identify the professional and sociodemographic factors that influence absenteeism. Method: All hospital center employees have been included over a period of twelve consecutive years (2007 to 2019). Compressible absences and occupational and sociodemographic factors were analyzed using Occupational Health data. Since the distribution of the data did not follow a normal distribution, the number of days of absence was presented as a median (interquartile range (IQR): 1st quartile–3rd quartile), and comparisons were made using non-parametric tests followed by a negative binomial model with zero inflation (ZINB). Results: A total of 16,413 employees were included, for a total of 2,828,599 days of absence, of which 2,081,553 were compressible absences (73.6% of total absences). Overall, 42% of employees have at least one absence per year. Absent employees had a median of 15 (IQR 5–53) days of absence per year, with an increase of a factor of 1.9 (CI95 1.8–2.1) between 2007 and 2019 (p < 0.001). Paramedical staff were most at risk of absence (p < 0.001 vs. all other occupational categories). Between 2007 and 2019, the number of days of absence was multiplied by 2.4 (CI95 1.8–3.1) for administrative staff, 2.1 (CI95 1.9–2.3) for tenured, 1.7 (CI95 1.5–2.0) for those living more than 12 km from the workplace, 1.8 (CI95 1.6–2.0) among women, 2.1 (CI95 1.8–2.6) among those over 50 years of age, 2.4 (CI95 1.8–3.0) among “separated” workers, and 2.0 (CI95 1.8–2.2) among those with at least one child. Conclusions: Paramedical personnel are most at risk of absenteeism. Meanwhile, absenteeism is increasing steadily, and overall, the increase is major for administrative staff. The profile of an employee at risk of absenteeism is a titular employee, living at distance from work, probably female, over 50 years old, separated, and with children. Identifying professionals at risk of absenteeism is essential to propose adapted and personalized preventive measures.

1. Introduction

Absenteeism at work can be defined as “any unexpected absence of an employee from his or her workstation” [1,2,3]. It is a major economic and public health issue in the hospital sector [4]. A hindrance to productivity [5] and a threat to the balance of work teams [6], it is also likely to affect the quality of care [7,8]. Within healthcare facilities, caregivers have been identified as being particularly at risk for absenteeism [9]. However, studies on the subject are limited [9]. Most of the literature on absenteeism in the hospital sector focuses solely on caregivers [10,11,12,13]. Among them, caregivers’ aides are reported to have the highest absenteeism rate [9]. Furthermore, to our knowledge, there is no literature that examines the professional status or home-to-work distance as determinants of absenteeism. A few studies have also looked at the sociodemographic determinants of absenteeism [14,15,16,17,18]. Among the factors that have been widely studied are gender and age: absenteeism is thought to be higher among women [14,15,16] and older individuals [17]. The literature has also identified celibacy as a protective factor in absenteeism [10,18]. On the other hand, the majority of studies that have looked at absenteeism from work have focused on short-term or health-related absences only [9,17]. In addition, publications dealing specifically with absenteeism in healthcare institutions are generally limited to a few years of study only [7,8,9,10]. Thus, there is no literature dealing with a large volume of employees followed over the long term (several consecutive years) and incorporating a minimum of information on occupational characteristics (occupation, status, distance between home and work) and sociodemographic characteristics (age, sex, marital status, children).
The main objective of this study was to study the evolution of absenteeism among staff at a University Hospital Center over a 12-year period. Our secondary objectives were to identify the professional and sociodemographic factors influencing this absenteeism.

2. Method

2.1. Study Design

Using occupational health data in relation with Human Resources, we conducted a longitudinal study on absenteeism among all staff at the Clermont-Ferrand University Hospital. The data analyzed covered a period of twelve consecutive years, from 2007 to 2019. This study was approved by the South-East VI Personal Protection Committee and the French National Commission for Information Technology and Civil Liberties (CNIL). In agreement with the CNIL, a unique 6-digit identifier was assigned to each university hospital center employee to ensure the anonymity of data.

2.2. Study Population: Eligibility Criteria

The criteria for inclusion were to be part of the staff of the University Hospital Center of Clermont-Ferrand between 2007 and 2019, regardless of profession or establishment, and to benefit from annual leave. No exclusion criteria were applied to this study.

2.3. Judging Criteria

2.3.1. Primary Judgement Criteria

So-called “compressible” absences were studied, i.e., those for which mitigation measures could be implemented because they were partly related to working conditions or health status: ordinary sick leave, occupational injury, occupational disease, strike, long-term leave, long-term sick leave, commuting accident and unauthorized absence [19]. Each absence detailed the start date, end date, reason, and duration. Non-compressible absences (annual leave, safety rest, training, union activities, maternity leave, family events, miscellaneous absence authorizations and unpaid absences) were not studied.

2.3.2. Secondary Judgement Criteria

The occupational variables were occupational status (titular, non-titular), home-to-work distance (calculated from each employee’s postal code and place of work), and occupation. Occupations were studied independently and were grouped into caregiver/non-caregiver groups and then into categories (medical, paramedical, administrative, technical).
The sociodemographic variables available for each absence were: gender, age of subject, marital status, parental status, and number of children.

3. Statistics

Statistical analysis of absenteeism data was conducted using Stata software (v16, College Station, TX, USA). The proportions of absent employees were compared for each factor using a Chi-square test. A Shapiro–Wilks test verified that the number of days of absence did not follow a normal distribution (Supplementary Figure S1). Among the absent employees, the number of days of absence was expressed as a median (interquartile range (IQR): 1st quartile–3rd quartile) and compared according to the different variables (professional and sociodemographic) via the non-parametric tests of Mann–Whitney (2 groups: gender, titular/non-titular, caregiver/non-caregiver, home–work distance, parentality) and Kruskal–Wallis (>2 groups: occupation, age, marital status). If there were more than two groups, “multiple pair-wise comparison tests” (paired comparison) were conducted. Effect sizes were also calculated between each group. Age classes were carried out according to quartiles: <30 years, 30–40 years, 40–50 years, and >50 years. Home–work distances were separated into two classes according to the median: less and more than 12 km. The risk of absence as a function of each variable (professional and sociodemographic) was calculated using a negative binomial model with zero inflation (ZINB), considering the high proportion of 0 (zero compressible days of absence for many employees). Vuong and likelihood ratio tests where alpha = 0 were automatically performed after each negative binomial model with zero inflation to determine whether the model was appropriate. Furthermore, a sensitivity analysis was performed excluding people with 365 or 366 days of absence per year. We can therefore rely on the results of our model. The risk calculations were carried out globally (covering the 12 years of the study as a whole) and by period (2007 to 2010, 2011 to 2014, and 2015 to 2019). The three periods were defined statistically based on observed changes in the number of days of absence on the global model. The weight of each factor was studied using multivariate analyses: logistic regressions for the proportions of absentees and the ZINB model for the number of days of absence. The normality of the residuals after the models was checked using qqplot and Shapiro–Wilk tests. Risk calculations were also carried out using classical logistic regression to check the consistency of the results (sensitivity analysis). The results were expressed as: coefficient, 95% confidence interval (95% CI). For all the tests performed, the significance threshold was set at 0.05.

4. Results

4.1. Description of the Population

Over the last 12 years, 16,413 subjects were included: 4385 (26.7%) men and 12,028 (73.3%) women. The mean age was 40.3 ± 11.6 years. Caregivers represented most of the workforce (70.4%). The professional categories were mainly paramedical (43.0%), which was followed by medical (27.4%), technical (15.3%), and administrative (15.3%). More than half of the staff (58.5%) were permanent employees.

4.2. Study of Absenteeism—Overall Model and by Time Period

Out of a total of 2,828,599 days of absence during the twelve years studied, 2,081,553 were compressible absences (73.6% of total absences). Regular sick leave accounted for the largest number of days of absence (52.0%), followed by occupational diseases (20.7%), accidents at work (10.0%), long-term sick leave (9.3%), long-term leave (3.6%), unauthorized absences (2.1%), commuting accidents (1.3%) and strikes (0.9%). Overall, 42% of the University Hospital Center employees had at least one compressible day of absence per year, with a median of 15 (5–53) days of absence/employee/year. The proportion of absent employees remained globally stable over time, and the number of days of absence was multiplied by 1.9 (CI95 1.8–2.1) in twelve years (p < 0.001) (Figure 1, Figure 2 and Figure 3).

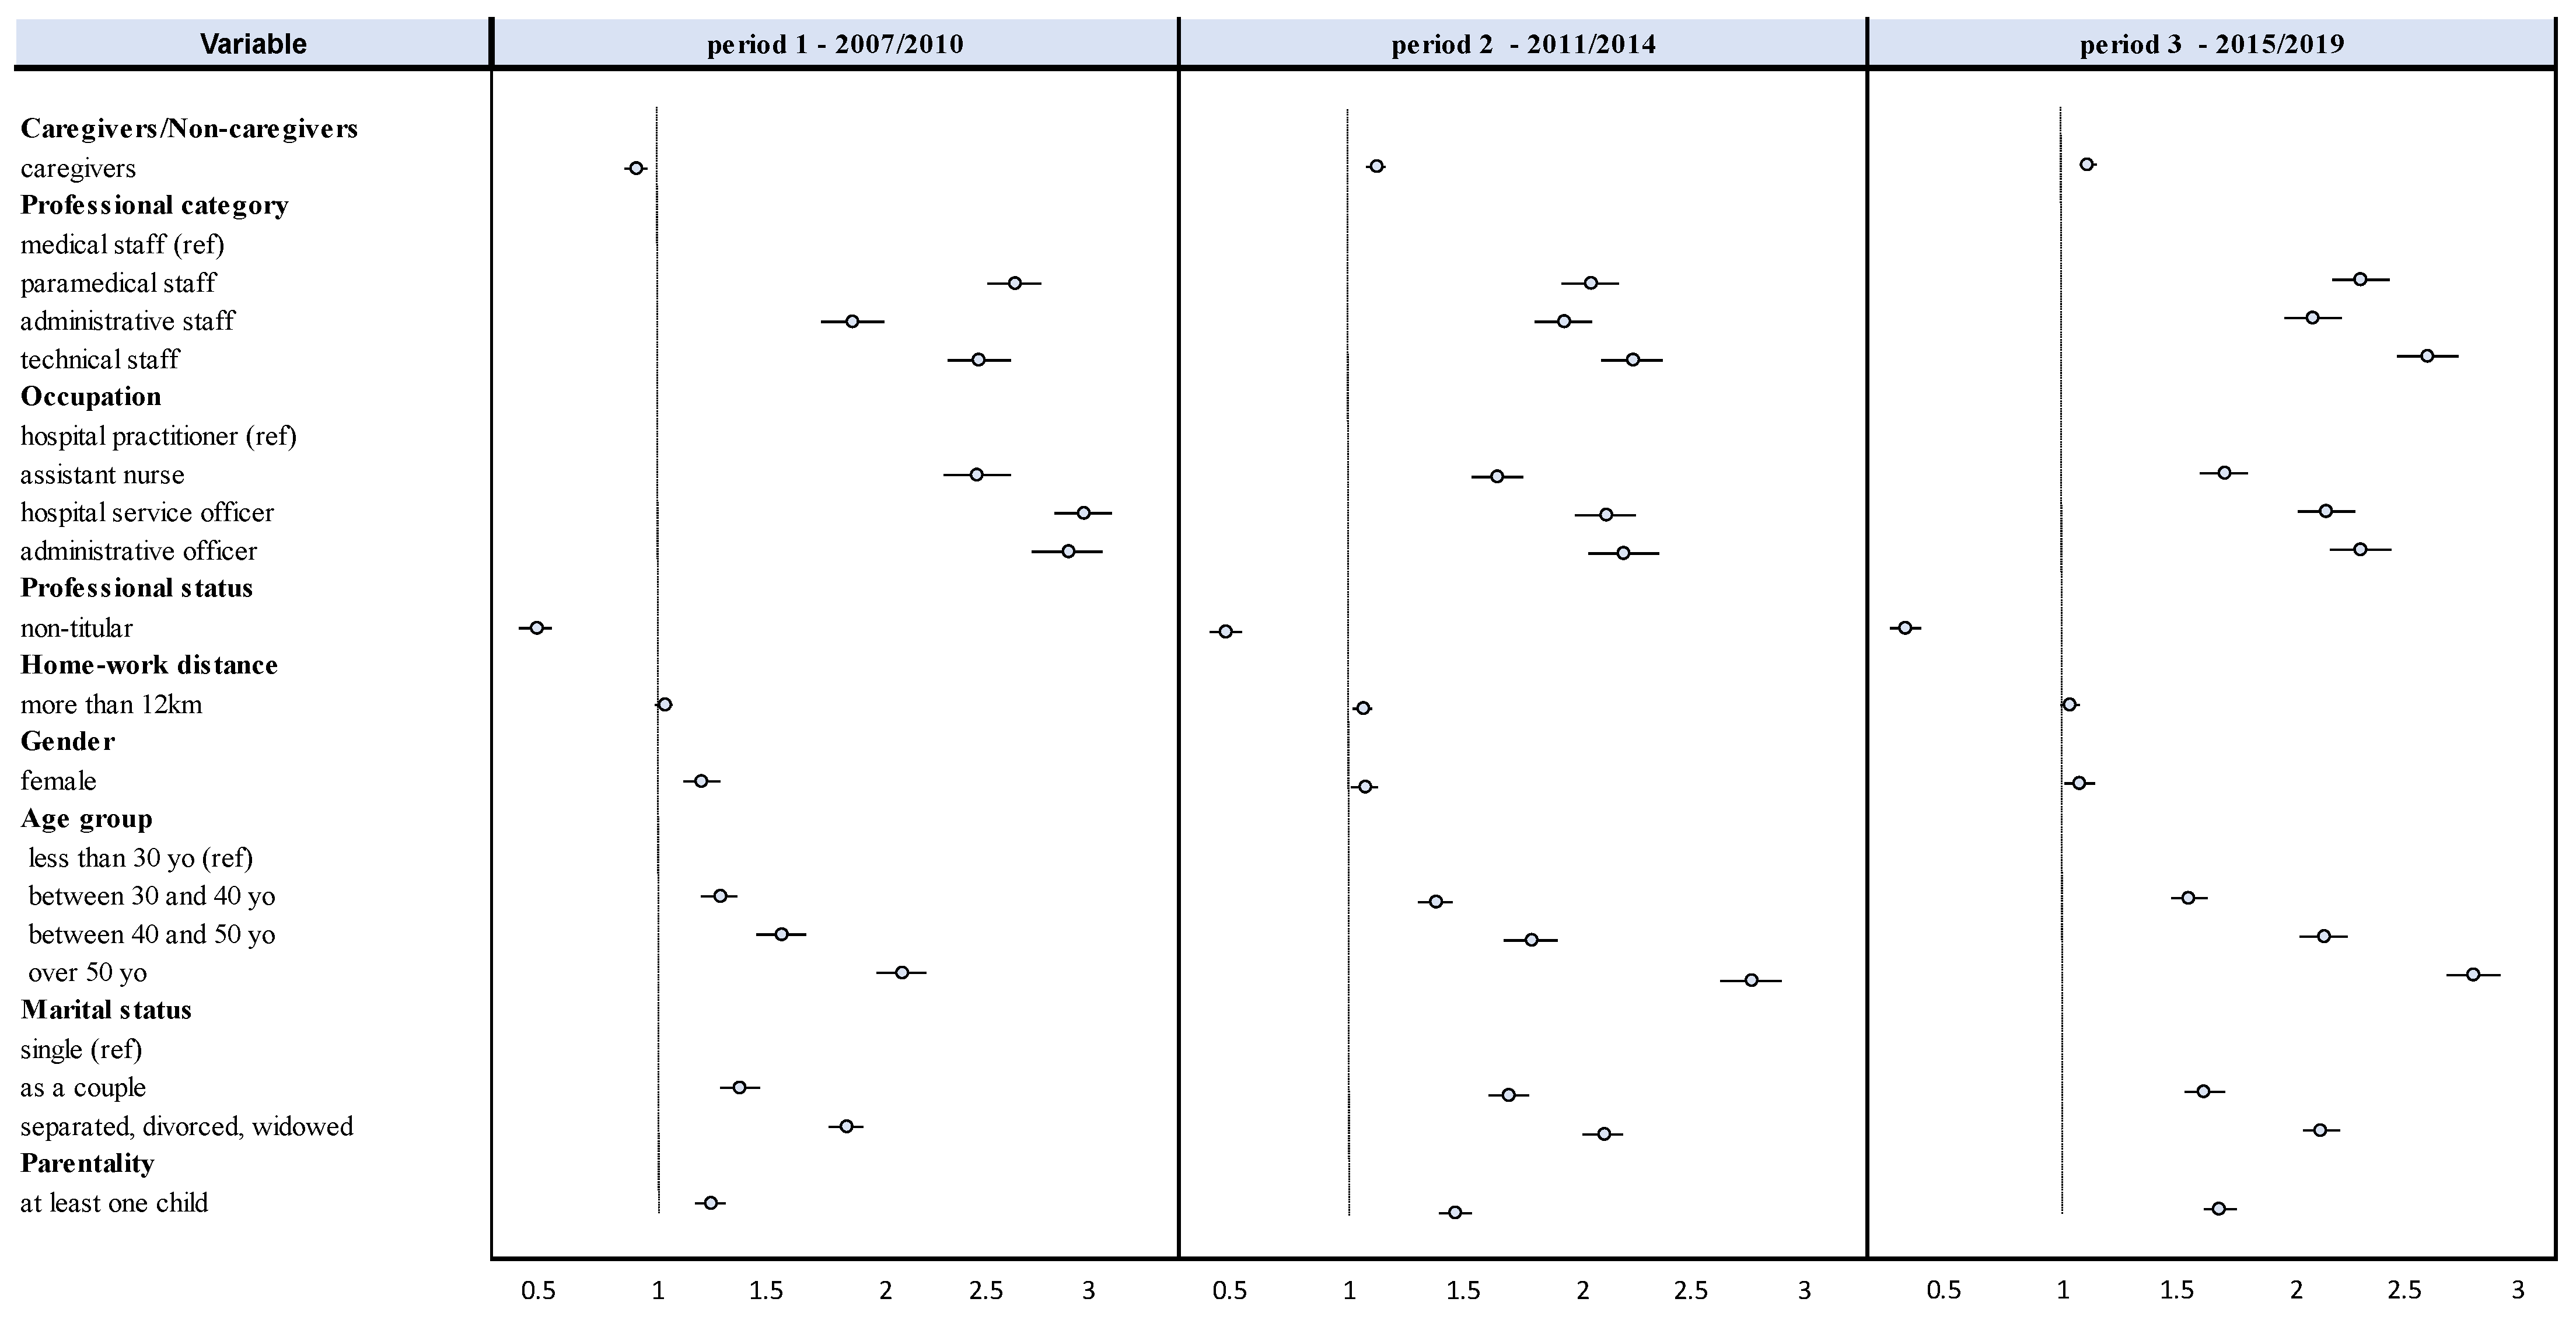
4.3. Professional Characteristics

Caregivers/Non-Caregivers: Caregivers were more likely to have at least one absence (44% vs. 39% for non-caregivers, p < 0.001, effect size 0.03) (Table 1), with an increased risk of absence of 27% (CI95 23–30%) (p < 0.001). Over the whole period 2007–2019, the number of days of absence of a caregiver was 1.19 (CI95 1.14–1.23) times that of a non-caregiver (16, IQR 5–55 vs. 13, IQR 4–47 days/employee/year, p < 0.001) (Table 1). However, the gap between caregivers and non-caregivers was no longer significant after 2015 (Table 2, Figure 2). Between 2007 and 2019, absences were multiplied by 1.8 (CI95 1.6–2.0) among caregivers and 2.4 (2.0–2.9) among non-caregivers (Figure 2).
Professional status: Tenured had a higher proportion of absent employees (27% vs. 23% among non-tenured, p < 0.001, effect size 0.32) (Table 1). The risk of absence was reduced by 56% (CI95 49–62%) among non-tenured and in particular by 69% over the last period (Figure 4). The number of days of absence for a titular was 2.76 (CI95 2.65–2.87) times that of a non-titular (19, 5–66 days/employee/year vs. 8, 3–24 days/employee/year for non-titular patients, p < 0.001) (Table 1). Between 2007 and 2019, the number of days of absence was multiplied by 2.1 (CI95 1.9–2.3) for tenured (Figure 2). The gap between tenured and non-tenured increased over time (p < 0.001) (Table 2, Figure 2 and Figure 4).
Occupational category: Paramedical staff had the highest proportion of absent employees (46% vs. 35% for medical staff, 37% for administrative staff, and 42% for technical staff, p < 0.001) (Table 1). The risk of absence was increased by 36% (CI95 32–40%) compared to medical staff. Paramedics were absent longer than other professional categories (19, 6–64 vs. 8, 2–24 days/employee/year for medical staff, 12, 3–42 for administrative staff, and 15, 5–53 for technical staff, p < 0.001). The number of days of absence for paramedical staff was 2.31 (CI95 2.18–2.44) times that of medical staff (p < 0.001) (Table 1). Between 2007 and 2019, the number of days of absence was multiplied by 1.7 (CI95 1.6–1.9) for paramedical staff, 2.4 (1.8–3.0) for administrative staff and 2.1 (1.9–2.4) for technical staff. The number of days absent increased significantly for administrative staff over time (Table 2, Figure 2 and Figure 4).
Occupation: Hospital services officers was the occupation with the highest number of absent employees (54% vs. 50% for assistant nurses, 46% for administrative officers, or 31% for hospital practitioners, for example, p < 0.001) (Table 1). For example, the risk of absence was increased by 67% (CI95 62–72%) compared to a hospital practitioner. Assistant nurses and hospital services officers were the two professions with the longest absences (20, 7–64 days/employee/year and 20, 7–68 days/employee/year, respectively; p < 0.001 vs. all other professions). For example, the number of compressible absence days for a hospital services officer was 2.44 (CI95 2.11–2.81) times that of a hospital practitioner (p < 0.001) (Table 1). Between 2007 and 2019, hospital services officers increased their number of days of absence by a factor of 1.9 (CI95 1.4–2.3) and assistant nurses 1.8 (1.5–2.2) (Table 2, Figure 2). The first period stands out with higher risks of absence for all occupational categories (Figure 4).
Home–work distance: This variable was reported for 1,497,957 absences (87%). Employees living more than 12 km from work were the most absent (44% vs. 40% of employees living less than 12 km from work, p < 0.001, effect size 0.05) (Table 1), with an increased risk of absence of 24% (CI95 20–28%). The number of days of absence of an employee living more than 12 km away from work was 1.04 (1.00–1.09) times that of an employee living less than 12 km away (17.5–57 vs. 14.4–45 days/employee/year, p < 0.001) (Table 1). Between 2007 and 2019, the number of days of absence was multiplied by 1.7 (CI95 1.5–2.0) among employees living more than 12 km from their place of work (Table 2, Figure 2).

Sociodemographic Characteristics

Gender: Women were the highest proportion of employees absent (43% vs. 36% of men, p < 0.001, effect size 0.09) (Table 1). Being a woman increased the risk of absence by 34% (31–38%). The number of days of absence for women was 1.12 (1.07–1.17) times that of men (15, 5–52 d/employee/year for women vs. 11, 3–38 d/employee/year for men) (p < 0.001) (Table 1). In particular, over the first period, it was 1.20 times higher (Figure 4, Supplementary Table S1). Between 2007 and 2019, absences were multiplied by 1.8 (CI95 1.6–2.0) for women (p < 0.001) (Figure 2).
Age: Those over 50 years of age had a higher proportion of absent employees than those under 30 years of age (44% vs. 40%, p < 0.001) (Table 1), with an increased risk of absence of 13% (CI95 8–18%, p < 0.001). Those over 50 years of age were absent the longest (18, 5–66 vs. 10, 3–35 for those under 30, 15, 5–48 days/employee/year for the other two age groups, p < 0.001), with the number of days absent 2.60 (2.48–2.74) times that of those under 30 (p < 0.001) (Table 1). Over the period 2007–2019, the number of days of absence was multiplied by 2.1 (CI95 1.8–2.6) among those over 50 years of age, with a widening over time of the gap between the youngest and oldest employees (Table 2, Figure 3 and Figure 4), reaching a number of days of absence 2.89 times higher over the last period (Supplementary Table S1).
Marital status: Separated employees (separated, divorced, or widowed) had the highest proportion of absent employees (29% vs. 24% for singles and 26% for couples, p < 0.001) (Table 1), with an increased risk of absence of 39% (CI95 35–44%) compared to singles. The number of days of absence for a separated employee was 1.28 (1.22–1.36) times that of an employee in a couple and 2.03 (1.91–2.16) times that of a single employee (20, 7–69 vs. 17, 5–59 days/employee/year for employees in a couple and 10, 3–31 days/employee/year for singles (p < 0.001) (Table 1). While overall between 2007 and 2019, the absences of separated employees were multiplied by 2.4 (CI95 1.8–3.0), the gap with singles increased over time (Table 2, Figure 3 and Figure 4).
Parenting: Employees with at least one child had the highest proportion of absent employees (44% vs. 39% among employees without children, p < 0.001, effect size 0.16) (Table 1), with an increased risk of absence of 18% (CI95 14–22%). The study results by time period were similar to these only between 2007 and 2010. After that, there was no difference between the two groups (Figure 3). The number of days of absence of an employee with at least one child was 1.48 (CI95 1.43–1.54) times that of an employee without children (16, 5–52 vs. 12, 4–38 d/employee/year) (p < 0.001) (Table 1). Between 2007 and 2019, the number of days of absence for employees with children was multiplied by 2.0 (CI95 1.8–2.2), with an increase in the gap with employees without children over time (Table 2, Figure 3 and Figure 4), reaching 1.74 times higher in the latter period (Supplementary Table S1).
A sensitivity analysis conducted without those with 365 or 366 days of absence showed that the significance of the factors in the ZINB models did not change except for being a caregiver or not and for the distance variable. Indeed, being a caregiver becomes a protective factor in the second period, whereas it was a risk factor before, and living more than 12 km away remains protective but becomes very significant in the overall period as well as in the third period. These are the only variables impacted during this sensitive analysis; all others show similar results.

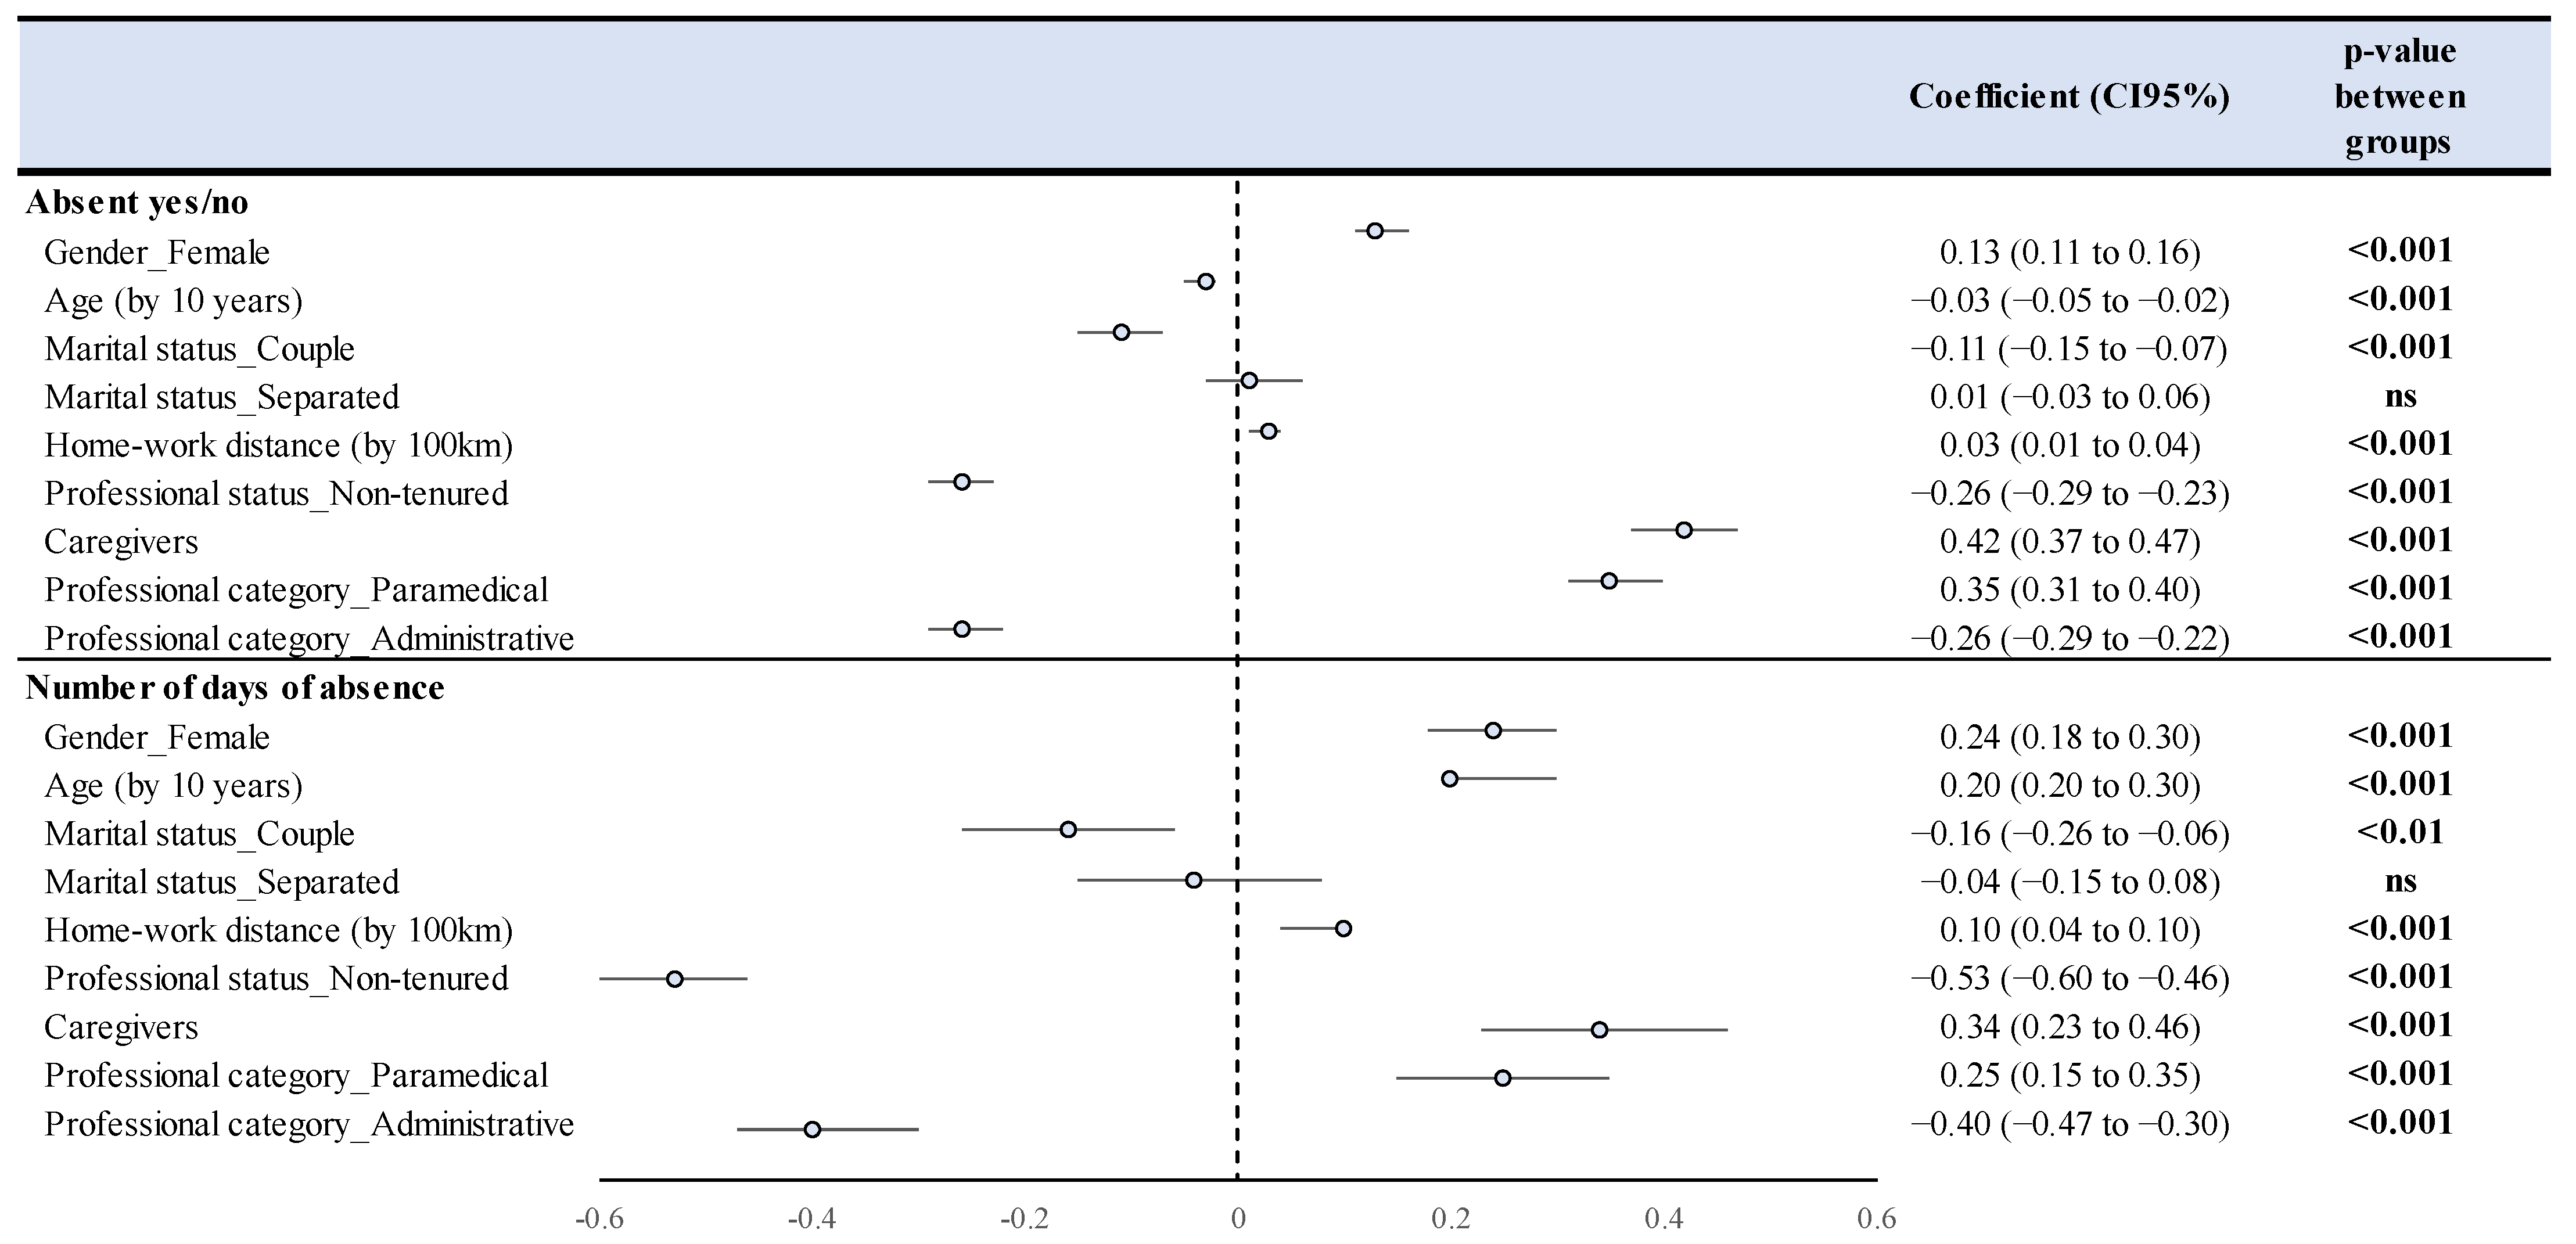
4.4. Study of Compressible Absenteeism—Multivariate Analyses

Proportion of employees with at least one absence: Risk factors for absence were being a caregiver (coefficient = 0.42, CI95 0.37–0.47), paramedical (0.35, 0.31–0.40), female (0.13, 0.11–0.16), and distance to work (0.03, 0.01–0.04) (p < 0.001). Protective factors were being non-titular (−0.26, −0.29–−0.23) and administrative (−0.26, −0.29 −0.22), age (−0.03, −0.05–−0.02), and being in a couple (−0.11, −0.15–−0.07) (p < 0.001) (Figure 5).
Number of compressible absence days: Risk factors for high absence duration were being a caregiver (coefficient = 0.33, CI95 0.22–0.45), paramedical (0.25, 0.15–0.35), female (0.24, 0.18–0.30), age (0.20, 0.20–0.30), and home-to-work distance (0.10, 0.04–0.10) (p < 0.001). Protective factors were non-titular (−0.54, −0.61–−0.47), administrative (−0.37, −0.46–−0.29), and being in a couple (−0.16, −0.27–−0.06) (p < 0.001) (Figure 5).
Study of compressible absenteeism—sensitivity analyses: The results were broadly similar using a classical logistic regression model. The risk of absence increased for caregivers by 11% (CI95 10–13%), paramedics by 10% (7–14%), Hospital Services Officers by 77% (65–90%), and tenured by 33% (31–35%), employees living more than 12 km from work by 11% (9–13%), women by 19% (17–21%), over-50s by 9% (7–11%), separated employees by 18% (13–23%), and employees with at least one child by 14% (12–16%) (Supplementary Figure S2). The results of period logistic regressions were also similar to the results obtained by the ZINB model (Supplementary Table S2).

5. Discussion

The main results showed:
A high prevalence of absences and an increase in absenteeism over time for most of the groups studied.
Paramedical personnel remain particularly at risk of absences even if new absentees emerge (administrative staff).
The involvement of sociodemographic factors in the occurrence of compressible absences.

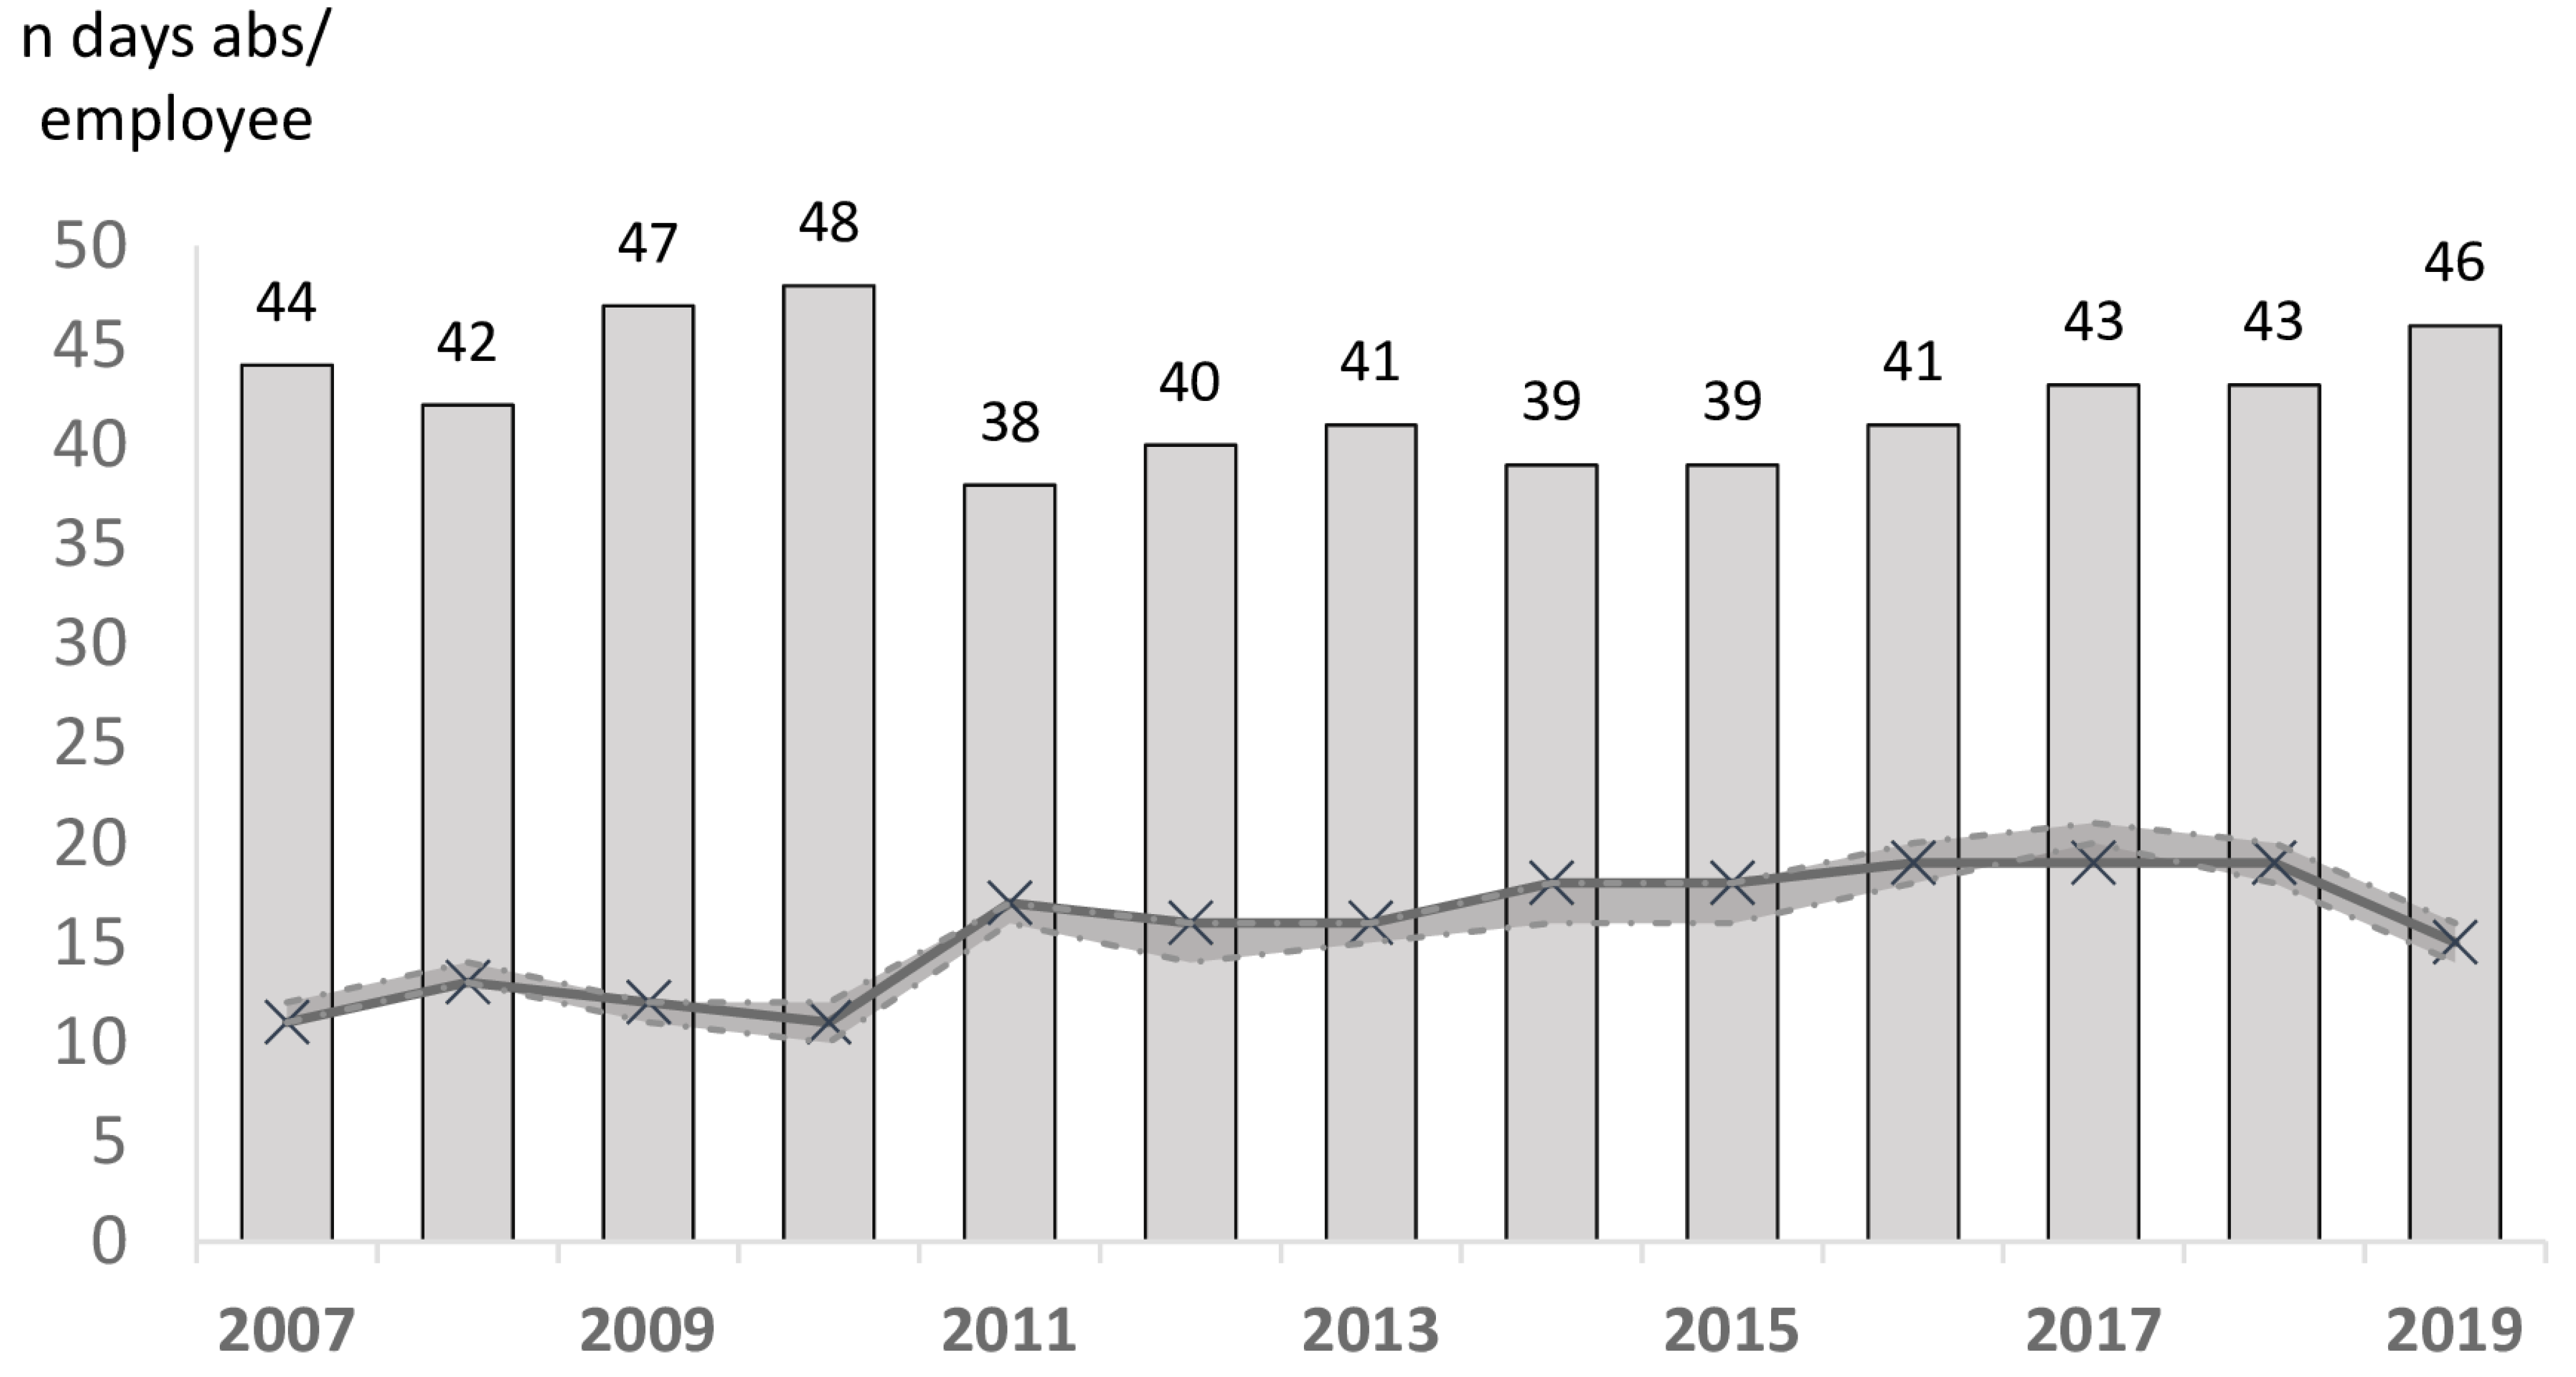
5.1. Prevalence of Absences and Evolution

We found that over the last 12 years, the proportion of employees absent at least once a year for a compressible reason was 42%. The median duration of absence was 15, 5 to 53 days/employee/year. In addition, we found a 1.9-fold increase (CI95 1.8–2.1) in the number of days of compressible absence between 2007 and 2019. To our knowledge, and as mentioned in the introduction, no publication to date has focused on compressible absences from work, making it impossible to compare our results with data from the literature. In fact, most of the available studies on the subject have focused on short-term absences or absences for health reasons only and have taken place over short periods of time [10,13,18]. In recent years, hospital reforms have multiplied [4]. From activity-based pricing to internal hospital changes, these reforms have contributed to the deterioration of working conditions [4]. In addition, job dissatisfaction, low decision latitude, or lack of time and resources to perform the tasks required have been associated with a high risk of absence [20,21,22]. All these factors could partly explain the observed increase in compressible absenteeism. In addition, absenteeism is associated with a significant loss of resources within healthcare institutions [4], which is itself partly responsible for the lack of available human and material resources. It can then lead to an overload of work and subsequently to new absences [21].

5.2. Occupational Risk Factors

We identified paramedical staff as having the highest number of compressible days of absence for the entire study period, with a median of 19, 6 to 64 days of absence per employee per year. These results are consistent with those in the literature [9,23]. It is important to note, however, that the available studies cover all reasons for absence and not just compressible absenteeism. These results can be explained in part by the high rate of job dissatisfaction [24,25,26,27,28,29]. A 2008 survey of job satisfaction among caregivers in various countries, including France, revealed that more than 40% of those surveyed were dissatisfied with their physical working conditions and psychological support [25]. At the beginning of our study period, administrative staff were at low risk of absence. We then noted an alarming increase in compressible absence days within this occupational category. Since this appears to be a new phenomenon, we did not identify any available data on the subject. We can, however, try to explain this phenomenon by the growing job dissatisfaction of all hospital staff due to the successive reforms of recent years [4]. Caregivers, in particular, are at very high risk of job stress and burnout [30,31,32,33]. Burnout is indeed increasingly present in hospitals and can even lead to suicide among some professionals [34]. The last major occupational risk factor was living far from the workplace. Repetitive commuting can in fact contribute to increasing fatigue and stress levels. In addition, most trips are made by car, which increases sedentariness and has been identified as one of the factors reducing work capacity [35,36].

5.3. Sociodemographic Factors and Absenteeism

We first identified women as having a higher number of compressible days of absence per year. This finding is consistent with the data in the literature [37,38]. Some publications have attempted to find an explanation for this discrepancy and in particular have shown that women have more difficulty balancing work and private life [16]. Another explanation would lie in the health status and personality differences between men and women [38]. Then, we determined that employees in the oldest age group had the highest number of days of absence per year. These results are consistent with those in the literature [17,39]. This finding seems easily explained insofar as the state of health of the individual, identified as a determinant of absenteeism, is closely linked to age. We were able to identify that being single was a protective factor for compressible absences. On the other hand, having at least one child was identified as a risk factor for compressible absences. These results are again similar to the data in the literature [10,16,18]. All of these results can be explained in part by the difficulty of reconciling work and family life [16].

6. Limitations

The main limitation of our study was the use of imperfect statistical models. Indeed, we used a negative binomial model with zero inflation, which is usually used to process count data with a high proportion of zeros. However, our data did indeed present a high proportion of employees without compressible absences but also employees with many days of absence (365 days in the year). However, these individuals were too few in number for the model to give false results (Supplementary Figure S1). Indeed, a sensitivity analysis was performed without those individuals with a peak of 365 or 366 days of absence. The results were not different from those found previously. The models used also did not allow the study of absence kinetics. The second limitation of our work was the missing data. However, these only concerned the variable “working distance” and represented only 10% of the data. Thus, we still had access to data on more than one million absences, which underlines the quality of the database on which our work is based. For reasons of anonymity, we were unable to access each employee’s work service and details of the reasons for absence. Access to these data as well as to activity indicators (such as patient data) could be relevant for future studies on the subject. Indeed, an increase in the volume of activity grouped with a lack of staff (linked to reforms and budget restrictions) could be one of the explanations for the increase in absenteeism in hospitals. Finally, compressible absences are by definition absences for which mitigation measures can be put in place [40,41,42,43,44,45,46]. It would be relevant to cross-reference the results obtained in our study with information on the preventive measures already adopted by the hospital center to assess their effectiveness. Finally, our study was retrospective, and it was therefore impossible to take into account certain professional subjective variables such as job satisfaction, social support or psychological load.

7. Conclusions

Absenteeism in healthcare institutions is a public health issue insofar as it can lead to an alteration in the quality of care. Compressible absenteeism, which accounts for more than 2/3 of absences from the university hospital center, has been on the rise for several years. While compressible absenteeism affects all the professions at the university hospital center, some remain more at risk than others, particularly hospital services officers and assistant nurses. Some professionals are more exposed to the risk of absenteeism (paramedical and technical fields), while others, who seemed protected ten years ago, are experiencing a worrying increase in the prevalence of absenteeism (administrative staff). Conversely, non-tenured staff are experiencing a decrease in risk compared to tenured staff. While professional characteristics seem to play a major role in the occurrence of absences, particularly in relation to working conditions, it is important to highlight the importance of sociodemographic factors. Indeed, we found that being a woman, being a parent, being elderly or being separated significantly increases the risk of absenteeism. Reducing compressible absences is now a major challenge for human resources and actions exist to achieve this. Among the means explored are health promotion actions (physical activity and nutrition) or actions to improve the work environment (communication, conflict management) [42,43,44,45,46]. These measures seem to show promising results and could make it possible to limit absences and the associated costs.

Supplementary Materials

The following supporting information can be downloaded at: https://www.mdpi.com/article/10.3390/ijerph191912966/s1, Supplementary Figure S1. Distribution of the number of days of absence per ID per year. Supplementary Figure S2. Quantification of the risk of compressible absence by professional and sociodemographic factors obtained by logistic regressions. Supplementary Figure S3. Forest plot of the risks of absence compressible by occupational and sociodemographic factors over the entire study period (negative binomial model inflated to zero (ZINB)). Supplementary Table S1. Quantification of the risk of compressible absence by professional and sociodemographic factors and by period obtained by zero inflated negative binomial model (ZINB). Supplementary Table S2. Quantification of the risk of compressible absence by professional and sociodemographic factors and by period obtained by logistic regressions.

Author Contributions

Conceptualization, F.D.; Methodology, C.M., B.P., S.M., V.N., J.-B.B.-M. and F.D.; Software, C.M., B.P., S.M. and A.G.; Validation, B.P., U.C.U., J.S.B. and F.D.; Formal Analysis, C.M., B.P., L.V. and A.G.; Investigation, J.-B.B.-M.; Resources, M.C. and F.D.; Data Curation, Y.B. and U.C.U.; Writing—Original Draft Preparation, C.M., L.V. and F.D.; Writing—Review and Editing, B.P., S.M., M.C., A.G., Y.B., U.C.U., V.N., J.S.B. and J.-B.B.-M.; Visualization; Supervision, B.P. and F.D.; Project Administration, M.C., J.-B.B.-M. and F.D. All authors have read and agreed to the published version of the manuscript.

Funding

This research received no external funding.

Institutional Review Board Statement

This study was approved by the South-East VI Personal Protection Committee and the French National Commission for Information Technology and Civil Liberties (CNIL). The ethical agreement number is 2022/CE 41.

Informed Consent Statement

Informed consent was obtained from all subjects involved in the study.

Data Availability Statement

Data cannot be shared publicly due to confidentiality. Data are available from the Institutional Data Access/Ethics Committee of the Clermont-Ferrand University Hospital (contact via the Human Resources Department) for researchers who meet the criteria for access to confidential data.

Conflicts of Interest

The authors have declared that no competing interests exist. The company had no role in the design of the study; in the collection, analyses, or interpretation of data; in the writing of the manuscript, or in the decision to publish the results.

References

  1. Howard, K.J.; Howard, J.T.; Smyth, A.F. The Problem of Absenteeism and Presenteeism in the Workplace. In Handbook of Occupational Health and Wellness; Gatchel, R.J., Schultz, I.Z., Eds.; Springer: Boston, MA, USA, 2012; pp. 151–179. [Google Scholar] [CrossRef]
  2. Halbesleben, J.; Whitman, M.V.; Crawford, W.S. A dialectical theory of the decision to go to work: Bringing together absenteeism and presenteeism. Hum. Resour. Manag. Rev. 2014, 24, 177–192. [Google Scholar] [CrossRef]
  3. Patton, E. The devil is in the details: Judgments of responsibility and absenteeism from work. J. Occup. Organ. Psychol. 2011, 84, 759–779. [Google Scholar] [CrossRef]
  4. Brami, L.; Damart, S.; Kletz, F. Réformes de l’hôpital, crise à l’hôpital: Une étude des liens entre réformes hospitalières et absentéisme des personnels soignants. Polit. Manag. Public 2012, 29, 541–561. [Google Scholar]
  5. Strömberg, C.; Aboagye, E.; Hagberg, J.; Bergström, G.; Lohela-Karlsson, M. Estimating the Effect and Economic Impact of Absenteeism, Presenteeism, and Work Environment–Related Problems on Reductions in Productivity from a Managerial Perspective. Value Health 2017, 20, 1058–1064. [Google Scholar]
  6. Brami, L.; Damart, S.; Kletz, F. Santé au travail et travail en santé. La performance des établissements de santé face à l’absentéisme et au bien-être des personnels soignants. Manag. Avenir. 2013, 61, 168–189. [Google Scholar]
  7. Duclay, E.; Hardouin, J.; Sébille, V.; Anthoine, E.; Moret, L. Exploring the impact of staff absenteeism on patient satisfaction using routine databases in a university hospital. J. Nurs. Manag. 2014, 23, 833–841. [Google Scholar] [CrossRef]
  8. Moret, L.; Anthoine, E.; Paillé, C.; Tricaud-Vialle, S.; Gerbaud, L.; Giraud-Roufast, A.; Michel, P.; Lombrail, P. Relationship between inpatient satisfaction and nurse absenteeism: An exploratory study using WHO-PATH performance indicators in France. BMC Res. Notes 2012, 5, 83–87. [Google Scholar] [CrossRef] [Green Version]
  9. Pollak, C.; Ricroch, L. Les disparités d’absentéisme à l’hôpital sont-elles associées à des différences de conditions de travail? Rev. Francaise Econ. 2016, 4, 181–220. [Google Scholar]
  10. Al, S.S.; Haxhe, J.J. A study on absenteeism among hospital personnel.—Abstract—Europe PMC. Acta Hosp. 1987, 27, 31–39. [Google Scholar]
  11. Brborović, H.; Daka, Q.; Dakaj, K.; Brborović, O. Antecedents and associations of sickness presenteeism and sickness absenteeism in nurses: A systematic review. Int. J. Nurs. Pract. 2017, 23, e12598. [Google Scholar] [CrossRef]
  12. Burmeister, E.A.; Kalisch, B.J.; Xie, B.; Doumit, M.A.A.; Lee, E.; Ferraresion, A.; Terzioglu, F.; Bragadóttir, H. Determinants of nurse absenteeism and intent to leave: An international study. J. Nurs. Manag. 2018, 27, 143–153. [Google Scholar] [CrossRef] [Green Version]
  13. Davey, M.M.; Cummings, G.; Newburn-Cook, C.V.; Lo, E.A. Predictors of nurse absenteeism in hospitals: A systematic review. J. Nurs. Manag. 2009, 17, 312–330. [Google Scholar]
  14. Bouville, G. Absentéisme et conditions de travail au féminin: Une frontière méconnue au sein des organisations. RIMHE Rev. Interdiscip. Manag. Homme Entrep. 2014, 11, 3–22. [Google Scholar]
  15. VandenHeuvel, A.; Wooden, M. Do Explanations of Absenteeism Differ for Men and Women? Hum. Relat. 1995, 48, 1309–1329. [Google Scholar]
  16. Chaupain-Guillot, S.; Guillot, O. Les déterminants individuels de l’absentéisme au travail. Rev. Econ. 2011, 62, 419–427. [Google Scholar]
  17. Huver, B.; Richard, S.; Vaneecloo, N.; Bierla, I. Âge, absence-maladie et présentéisme au travail: Le cas d’un établissement de santé régional. Manag. Avenir. 2014, 70, 97–114. [Google Scholar]
  18. Dolan, S.; Arsenault, A.; Lizotte, J.-P.; Abenhaim, L. L’absentéisme hospitalier au Québec: Aspects culturels et socio-démographiques. Relat. Ind. Ind. Relat. 1983, 38, 45–57. [Google Scholar]
  19. Bouville, G. La Progression de l’Absentéisme: Nouveaux Comportements des Salariés ou Nouvelles Contraintes Organisationnelles? Université de Rennes 1: Rennes, France, 2010. [Google Scholar]
  20. Charles-Pauvers, B.; Comeiras, N.; Peyrat-Guillard, D.; Roussel, P. Les Déterminants Psychologiques de la Performance au Travail. Un Bilan des Connaissances et Proposition de Voies de Recherche. 2006. Available online: https://halshs.archives-ouvertes.fr/halshs-00096949 (accessed on 16 January 2021).
  21. Bouville, G. L’Influence de l’Organisation et des Conditions de Travail sur l’Absentéisme. Analyse Quantitative et Étude de cas [Internet]. Post-Print. HAL; nov. (Post-Print). Report No.: hal-00653592. 2009. Available online: https://ideas.repec.org/p/hal/journl/hal-00653592.html (accessed on 16 January 2021).
  22. Kottwitz, M.U.; Schade, V.; Burger, C.; Radlinger, L.; Elfering, A. Time Pressure, Time Autonomy, and Sickness Absenteeism in Hospital Employees: A Longitudinal Study on Organizational Absenteeism Records. Saf. Health Work 2017, 9, 109–114. [Google Scholar] [CrossRef]
  23. Lipszyc, B.; Laurent, S. L’absentéisme dans une institution hospitalière: Les facteurs déterminants. Bruss Econ. Rev. 2021, 166, 131–170. [Google Scholar]
  24. Vandenberghe, C.; Stordeur, S.; d’Hoore, W. Une analyse des effets de la latitude de décision, de l’épuisement émotionnel et de la satisfaction au travail sur l’absentéisme au sein des unités de soins infirmiers. Trav. Hum. 2009, 72, 209–228. [Google Scholar]
  25. Estryn-Béhar, M. Santé et Satisfaction des Soignants au Travail en France et en Europe. Presses de l’EHESP. 2008. Available online: http://www.cairn.info/sante-et-satisfaction-des-soignants-au-travail--9782859529468.htm (accessed on 16 January 2021).
  26. Brami, L.; Damart, S.; Detchessahar, M.; Devigne, M.; Habib, J.; Kletz, F.; Krohmer, C. L’Absentéisme des Personnels Soignants à l’Hôpital. 2014. Available online: https://hal-upec-upem.archives-ouvertes.fr/hal-01130767 (accessed on 16 January 2021).
  27. Colombat, P.; Altmeyer, A.; Barruel, F.; Bauchetet, C.; Blanchard, P.; Colombat, P.; Copel, L.; Ganem, G.; Rodrigues, M.; Ruszniewski, M. Syndrome d’épuisement professionnel des soignants. Oncologie 2011, 13, 845–863. [Google Scholar]
  28. Ticharwa, M.; Cope, V.; Murray, M. Nurse absenteeism: An analysis of trends and perceptions of nurse unit managers. J. Nurs. Manag. 2018, 27, 109–116. [Google Scholar] [CrossRef]
  29. Mudaly, P.; Nkosi, Z.Z. Factors influencing nurse absenteeism in a general hospital in Durban, South Africa. J. Nurs. Manag. 2013, 23, 623–631. [Google Scholar] [CrossRef]
  30. Stordeur, S.; Vandenberghe, C.; D’hoore, W. Predicteurs de l’epuisementprofessionnel des infirmières: Une etude dans un hopital universitaire. Rech. Soins Infirm. 1999, 59, 57–66. [Google Scholar]
  31. Garrosa, E.; Moreno-Jiménez, B.; Liang, Y.; González, J.L. The relationship between socio-demographic variables, job stressors, burnout, and hardy personality in nurses: An exploratory study. Int. J. Nurs. Stud. 2008, 45, 418–427. [Google Scholar] [CrossRef]
  32. Loriol, M. La construction sociale de la fatigue au travail. St. Conjug. 2005, 32, 52–62. [Google Scholar]
  33. Dutheil, F.; Trousselard, M.; Perrier, C.; Lac, G.; Chamoux, A.; Duclos, M.; Naughton, G.; Mnatzaganian, G.; Schmidt, J. Urinary Interleukin-8 Is a Biomarker of Stress in Emergency Physicians, Especially with Advancing Age—The JOBSTRESS* Randomized Trial. PLoS ONE 2013, 8, e71658. [Google Scholar] [CrossRef]
  34. Dutheil, F.; Aubert, C.; Pereira, B.; Dambrun, M.; Moustafa, F.; Mermillod, M.; Baker, J.S.; Trousselard, M.; Lesage, F.-X.; Navel, V. Suicide among physicians and health-care workers: A systematic review and meta-analysis. PLoS ONE 2019, 14, e0226361. [Google Scholar] [CrossRef] [Green Version]
  35. Pronk, N.P.; Martinson, B.; Kessler, R.C.; Beck, A.L.; Simon, G.E.; Wang, P. The Association Between Work Performance and Physical Activity, Cardiorespiratory Fitness, and Obesity. J. Occup. Environ. Med. 2004, 46, 19–25. [Google Scholar] [CrossRef]
  36. Merrill, R.M.; Aldana, S.G.; Pope, J.E.; Anderson, D.R.; Coberley, C.R.; Grossmeier, J.J.; Whitmer, R.W. Self-Rated Job Performance and Absenteeism According to Employee Engagement, Health Behaviors, and Physical Health. J. Occup. Environ. Med. 2013, 55, 10–18. [Google Scholar] [CrossRef] [Green Version]
  37. Côté, D.; Haccoun, R.R. L’absentéisme des femmes et des hommes: Une méta-analyse. Can. J. Adm. Sci. Rev. Can. Sci. Adm. 1991, 8, 130–139. [Google Scholar]
  38. Mastekaasa, A.; Olsen, K.M. Gender, Absenteeism, and Job Characteristics: A Fixed Effects Approach. Work Occup. 1998, 25, 195–228. [Google Scholar]
  39. Barmby, T.A.; Ercolani, M.G.; Treble, J.G. Sickness Absence: An International Comparison. Econ. J. 2002, 112, F315–F331. [Google Scholar] [CrossRef]
  40. El Khamali, R.; Mouaci, A.; Valera, S.; Cano-Chervel, M.; Pinglis, C.; Sanz, C. Effects of a Multimodal Program Including Simulation on Job Strain Among Nurses Working in Intensive Care Units: A Randomized Clinical Trial. JAMA 2018, 320, 1988–1997. [Google Scholar]
  41. Linton, S.J.; Boersma, K.; Traczyk, M.; Shaw, W.; Nicholas, M. Early Workplace Communication and Problem Solving to Prevent Back Disability: Results of a Randomized Controlled Trial Among High-Risk Workers and Their Supervisors. J. Occup. Rehabil. 2015, 26, 150–159. [Google Scholar] [CrossRef] [Green Version]
  42. Brox, J.I.; Frøystein, O. Health-related quality of life and sickness absence in community nursing home employees: Randomized controlled trial of physical exercise. Occup. Med. 2005, 55, 558–563. [Google Scholar] [CrossRef] [Green Version]
  43. Christensen, J.R.; Overgaard, K.; Hansen, K.; Søgaard, K.; Holtermann, A. Effects on Presenteeism and Absenteeism From a 1-Year Workplace Randomized Controlled Trial Among Health Care Workers. J. Occup. Environ. Med. 2013, 55, 1186–1190. [Google Scholar]
  44. Jakobsen, M.D.; Sundstrup, E.; Brandt, M.; Jay, K.; Aagaard, P.; Andersen, L.L. Physical exercise at the workplace prevents deterioration of work ability among healthcare workers: Cluster randomized controlled trial. BMC Public Health 2015, 15, 1174. [Google Scholar] [CrossRef] [Green Version]
  45. Andersen, L.N.; Juul-Kristensen, B.; Roessler, K.K.; Herborg, L.G.; Sørensen, T.L.; Søgaard, K. Efficacy of ‘Tailored Physical Activity’ on reducing sickness absence among health care workers: A 3-months randomised controlled trial. Man. Ther. 2015, 20, 666–671. [Google Scholar] [CrossRef]
  46. Svensson, A.L.; Strøyer, J.; Ebbehøj, N.E.; Schultz-Larsen, K.; Marott, J.L.; Mortensen, O.S.; Suadicani, P. Multidimensional intervention and sickness absence in assistant nursing students. Occup. Med. 2009, 59, 563–569. [Google Scholar] [CrossRef]
Figure 1. Evolution in the proportion of absentees (the crosses) and the number of days of absence (the bars) per absent employee (expressed in median ± one centile).
Ijerph 19 12966 g001
Figure 2. Evolution in the proportion of absentees and the number of days of absence per absent agent by occupational factor (expressed in median (C49–C51)).
Ijerph 19 12966 g002
Figure 3. Evolution of the proportion of absentees and the number of days of absence per absent agent by sociodemographic factor (expressed in median (C49–C51)).
Ijerph 19 12966 g003
Figure 4. Forest plot of the incidence rate ratio of compressible absence risk as a function of occupational and sociodemographic factors by period (zero inflated negative binomial model (ZINB)).
Ijerph 19 12966 g004
Figure 5. Multivariate analyses of factors influencing the occurrence of absences and the number of days of absence.
Ijerph 19 12966 g005
Table 1. Study of compressible absences by professional and sociodemographic factors.
Agents with ≥1 Absence/Yearp-Value
between
Groups
Effect Size
between Groups
with CI
Zero Inflated Negative Binomial (ZINB)
Variablesnn Agents n Days of AbsenceIncidence Risk Ratio (IRR)
(%)Median (Range)Count ModelInflation Model
Caregivers/non-caregivers
Caregivers4310(39%)13 (4 to 47)<0.001ref.ref.
Non-caregivers12103(44%)16 (5 to 55)0.03 [0.01;0.04]1.19 ***0.73 ***
Professional category
Medical4861(35%)8 (2 to 24)<0.001ref.ref.
Paramedical7640(46%)19 (6 to 64)0.27 [0.25;0.29]2.31 ***0.64 ***
Administrative2542(37%)12 (3 to 42)0.17 [0.15;0.19]1.96 ***1.08 *
Technical2713(42%)15 (5 to 53)0.28 [0.25;0.30]2.29 ***0.82 ***
Occupation
Hospital practitioner443(31%)8 (1 to 29)<0.001ref.ref.
Assistant nurse2263(50%)20 (7 to 64)0.23 [0.18;0.27]1.89 ***0.40 ***
Cleaners1324(54%)20 (7 to 68)0.33 [0.28;0.37]2.36 ***0.33 ***
Administrative officer870(46%)13 (4 to 42)0.38 [0.33;0.43]2.44 ***0.50 ***
Professional status
Tenured8338(27%)19 (5 to 66)<0.001ref.ref.
Non-tenured11739(23%)8 (3 to 24)0.32 [0.30;0.33]0.36 ***1.56 ***
Home-work distance
<12 km9040(40%)14 (4 to 45)<0.001ref.ref.
>12 km6558(44%)17 (5 to 57)0.05 [0.04;0.06]1.04 *0.76 ***
Gender
Male4382(36%)11 (3 to 38)<0.001ref.ref.
Female12031(43%)15 (5 to 52)0.09 [0.07;0.1]1.12 ***0.66 ***
Age
<30 years old8655(40%)10 (3 to 35)<0.001ref.ref.
30–40 years old5506(44%)15 (5 to 48)0.15 [0.13;0.17]1.43 ***1.01
40–50 year old4705(43%)15 (5 to 48)0.21 [0.19;0.23]1.87 ***1.00
>50 years old4298(44%)18 (5 to 66)0.32 [0.30;0.34]2.60 ***0.87 ***
Marital status
Single8592(24%)10 (3 to 31)<0.001ref.ref.
Couple8415(26%)17 (5 to 59)0.18 [0.17;0.19]1.58 ***0.74 ***
Separated/widowed1859(29%)20 (7 to 69)0.35 [0.33;0.37]2.03 ***0.61 ***
Parentality
No children9498(39%)12 (4 to 38)<0.001ref.ref.
≥1 children8890(44%)16 (5 to 52)0.16 [0.15;0;17]1.48 ***0.82 ***
* p value < 0.05, *** p value < 0.001.
Table 2. Study of compressible absences by period and by professional and sociodemographic factors.
Period 1—2007/2010 Period 2—2011/2014 Period 3—2015/2019
nn(%) Agents with ≥1 Absence/YearMedian
(Range)
nn(%) Agents with ≥1 Absence/YearMedian
(Range)
nn(%) Agents with ≥1 Absence/YearMedian
(Range)
Caregivers/non-caregivers
  Caregivers 68294513 (4–43) 70514118 (5–62) 84624518 (5–61)
  Non-caregivers2808468 (2–32) 25833614 (4–49) 26553619 (6–63)
Professional category
  Medical1987348 (4–17) 20002910 (3–29) 2916408 (1–25)
  Paramedical48424714 (4–49) 50514420 (6–68) 55464621 (7–73)
  Administrative1484446 (2–28) 14383313 (4–46) 15043418 (5–57)
  Technical13244811 (3–38) 11454015 (5–54) 11513920 (6–75)
Occupation
  Hospital practitioner247337 (2–25) 2702313.5 (6–33) 318346 (1–31)
  Assistant nurse14375117 (5–55) 14884922 (7–79) 16025123 (8–79)
  Cleaners6495318 (7–57) 6845221 (7–80) 7355625 (8–88)
  Administrative officer499537 (2–27) 4614114 (4–44) 4204421 (7–64)
Professional status
  Tenured57192913 (3–46) 60832520 (6–71) 64332625 (8–81)
  Non-tenured3918238 (3–22) 3551209 (3–29) 4684257 (2–22)
Home-work distance
  <12 km43684611 (3–39) 50873715 (5–55) 63614016 (5–55)
  >12 km36054812 (3–46) 41394218 (5–61) 46434521 (6–69)
Gender
  Male2414429 (2–31) 23243413 (4–47) 28783614 (4–48)
  Female72234612 (4–42) 73104118 (5–61) 82394419 (6–64)
Age
  <30 years old35663910 (4–31) 35203811 (3–43) 46734210 (3–33)
  30–40 years old21334612 (3–41) 21584116 (5–53) 23724418 (5–58)
  40–50 year old21214711 (3–39) 20173917 (6–56) 20464221 (7–69)
  >50 years old18175013 (3–50) 19394122 (7–96) 20264228 (9–94)
Marital status
  Single3735259 (3–25) 36762110.5 (3–33) 49332611 (3–33)
  Couple50182812 (3–43) 50542519 (6–65) 52982621 (6–70)
  Separated/widowed8553114 (5–50) 8592821 (7–73) 8122925 (9–84)
Parentality
  No children42372710 (4–34) 42222414 (4–48) 54522712 (3–39)
  ≥1 children54002912 (3–42) 54122518 (5–62) 56652622 (7–71)
Publisher’s Note: MDPI stays neutral with regard to jurisdictional claims in published maps and institutional affiliations.

