

High-Level Mobility of Trans-Tibial Prosthesis Users Wearing Commercial and sPace Energy-Storing Prosthetic Feet
 , ,
, ,
Abstract
:1. Introduction
2. Materials and Methods
2.1. Participants
2.2. Prosthetic Foot Provision
2.3. Outcome Measurement
2.4. Statistical Analysis
3. Results
3.1. MWT, 20MWT and 2-MWT
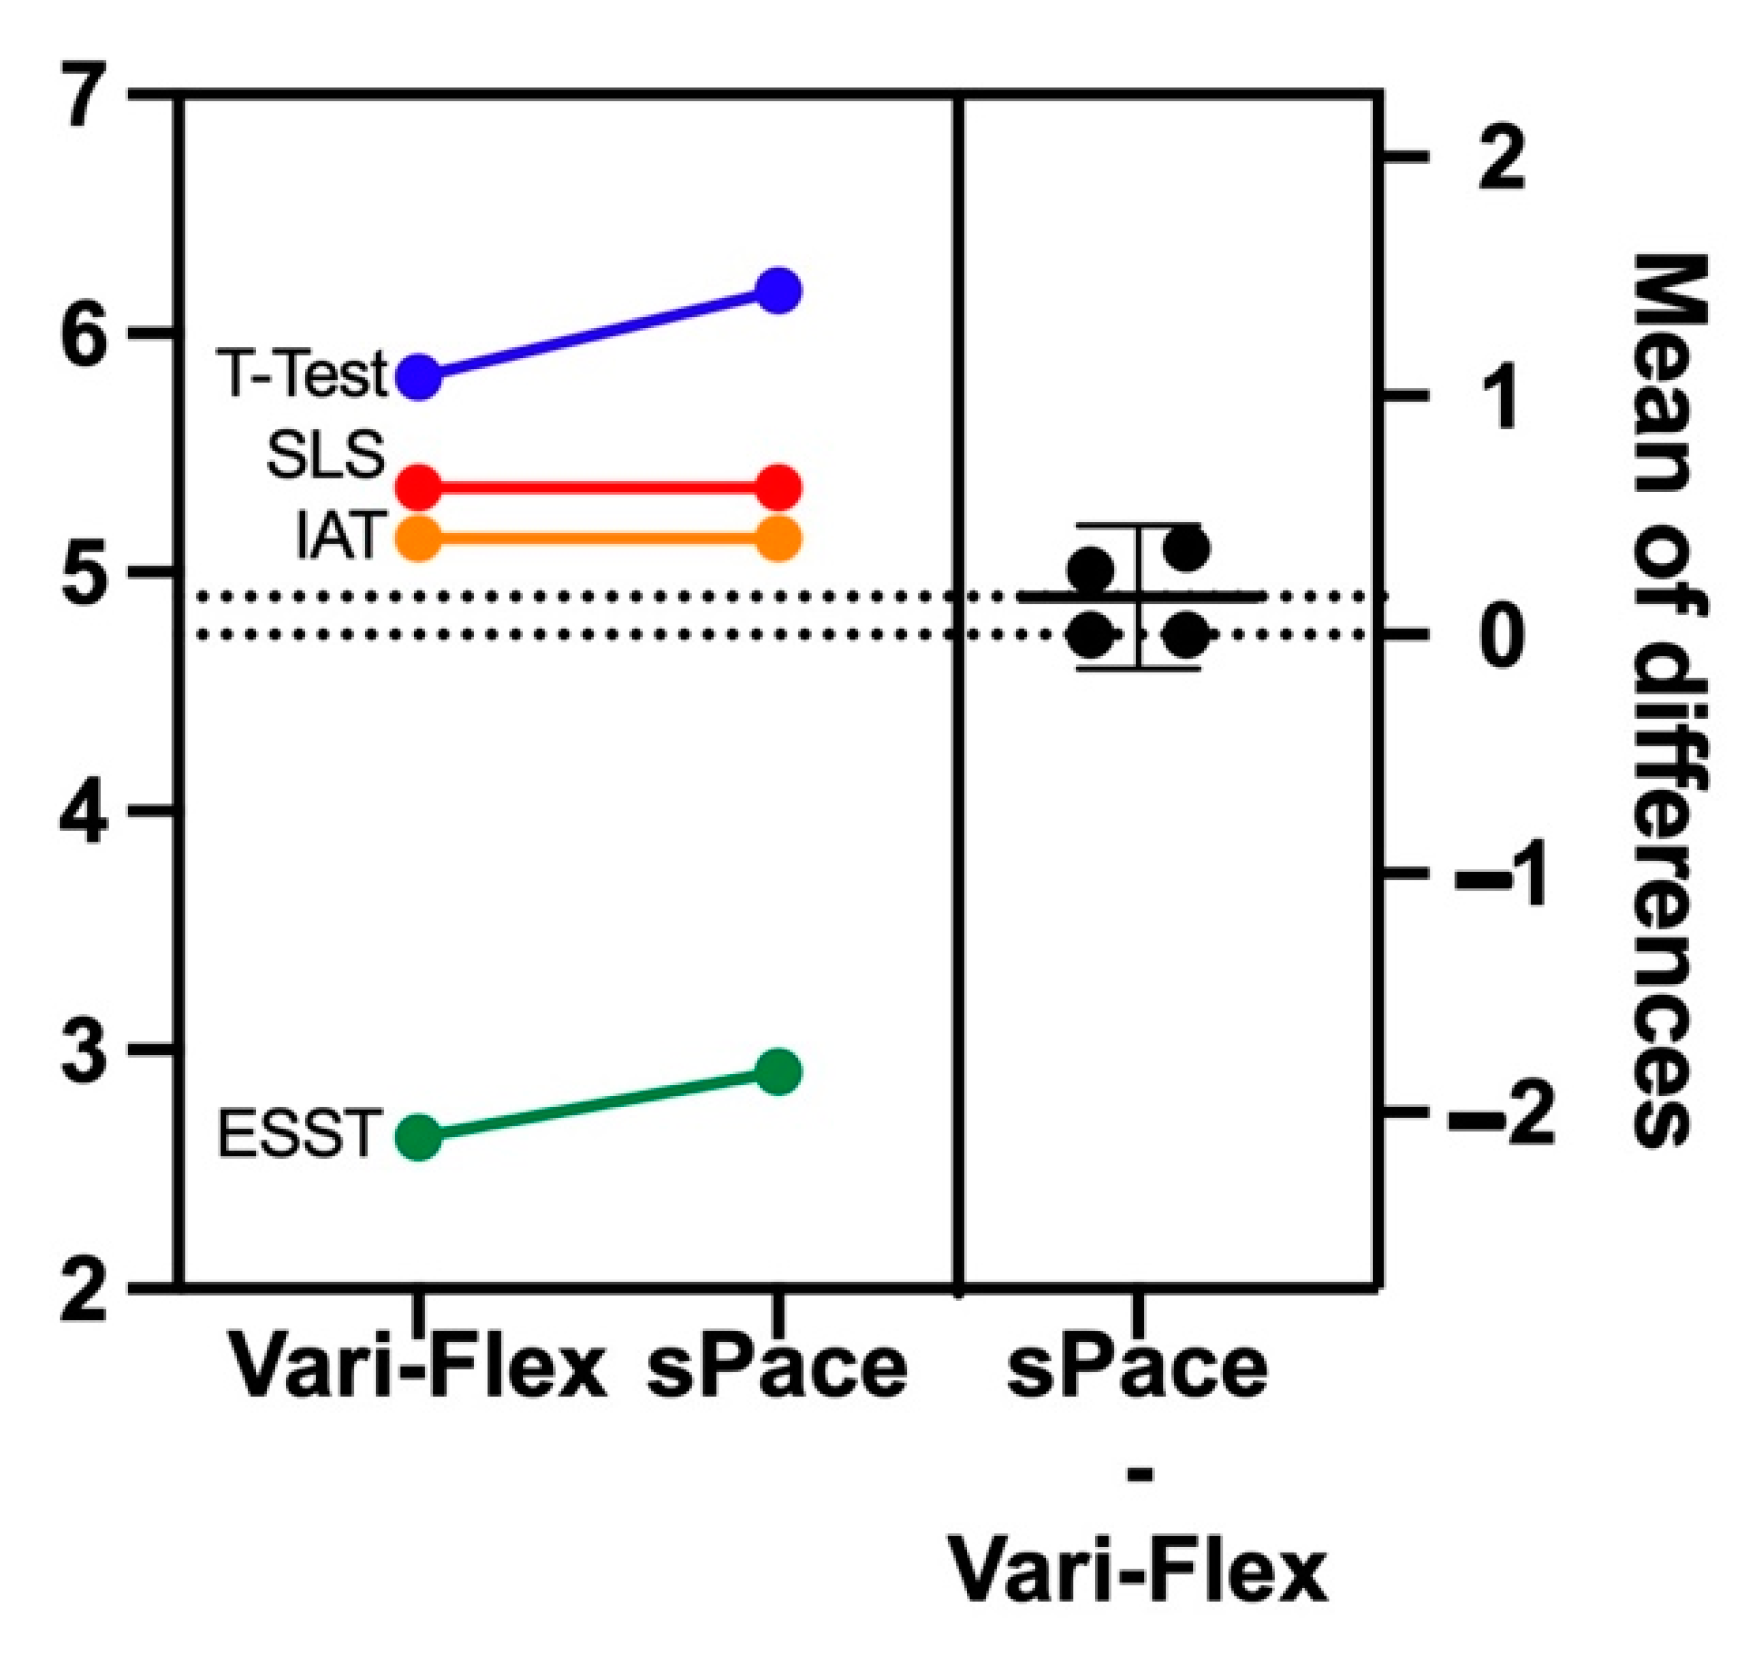
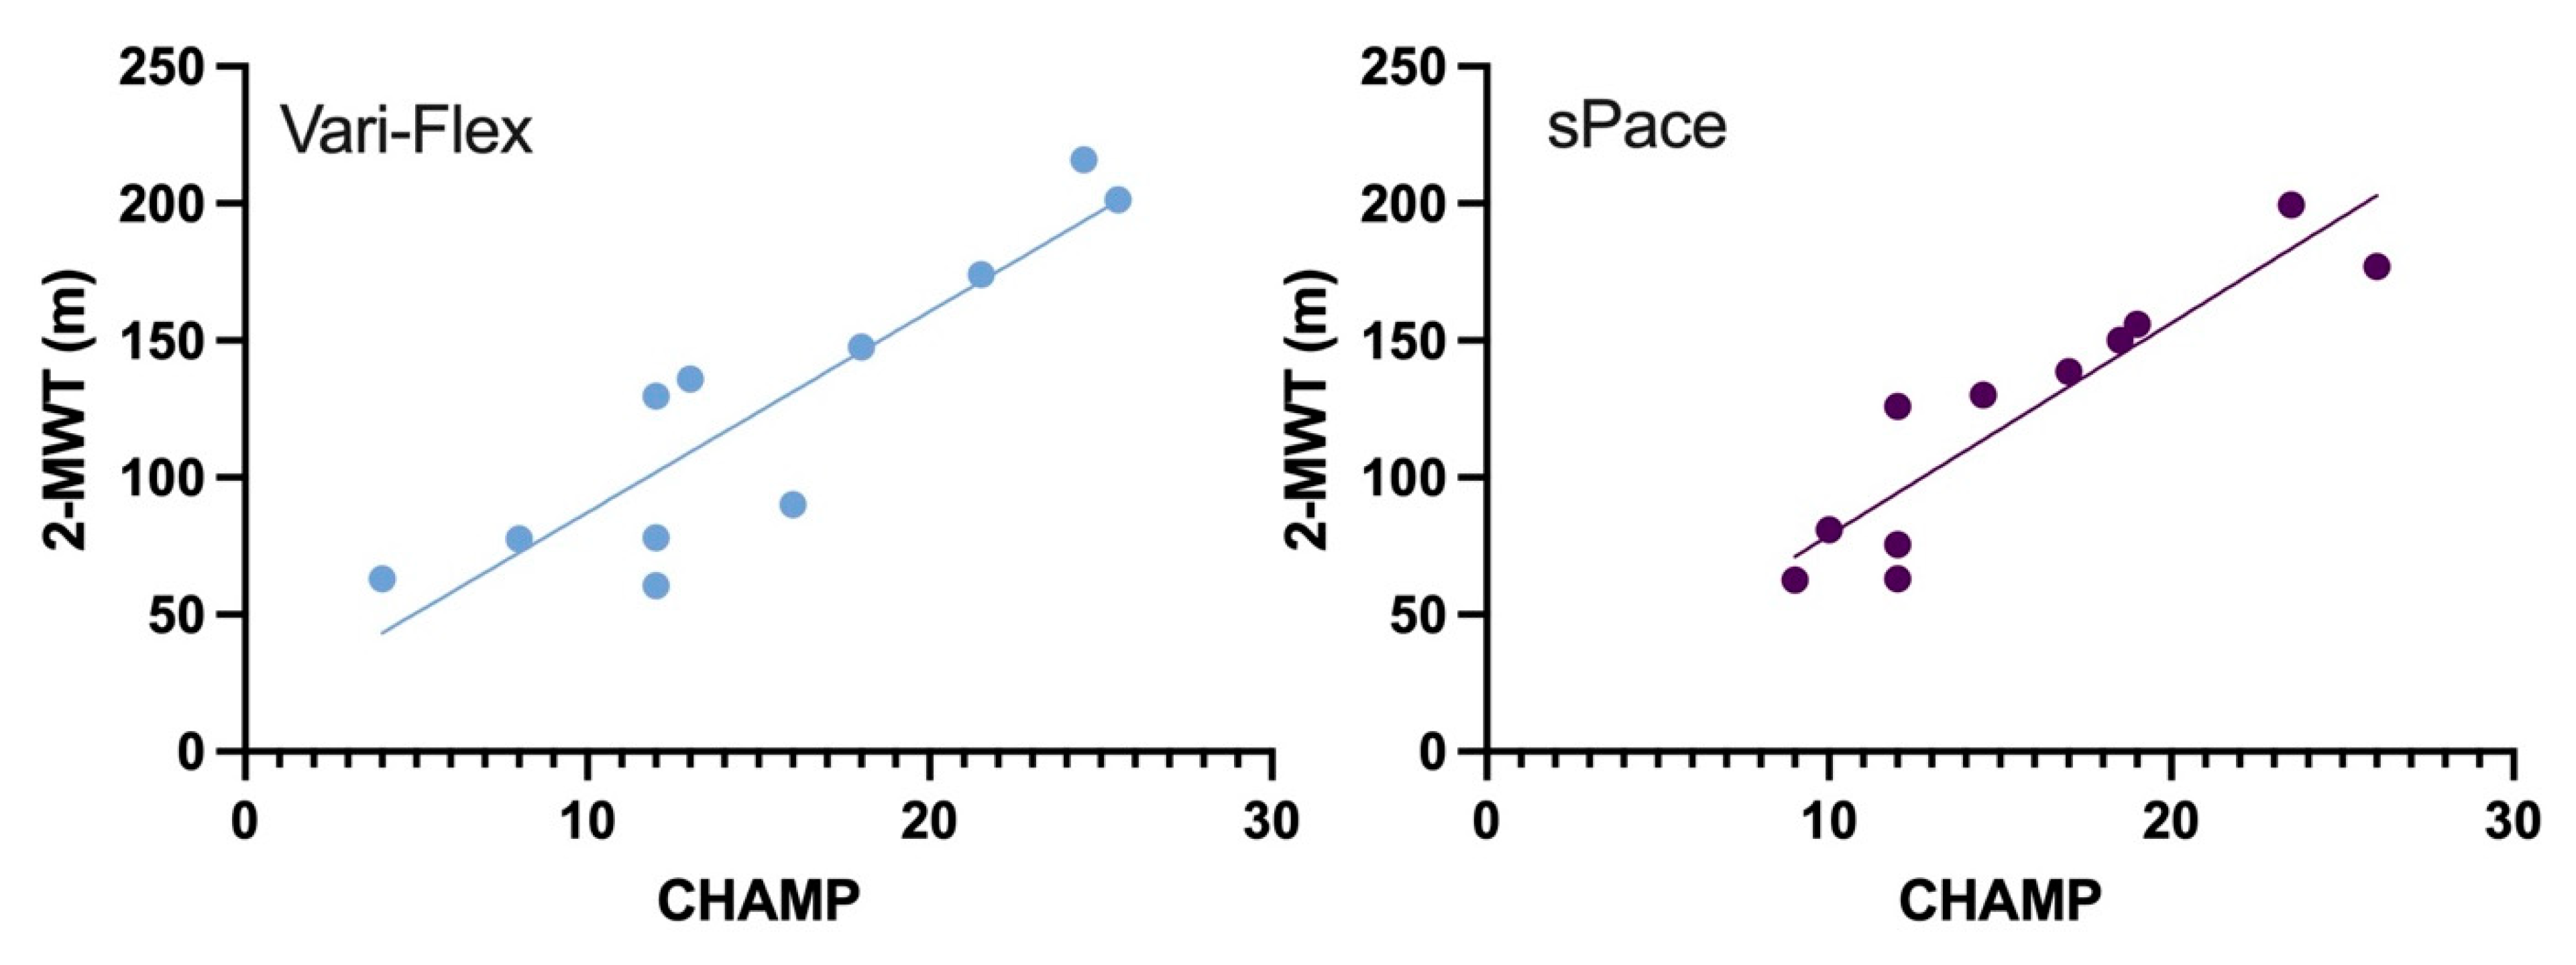
3.2. CHAMP
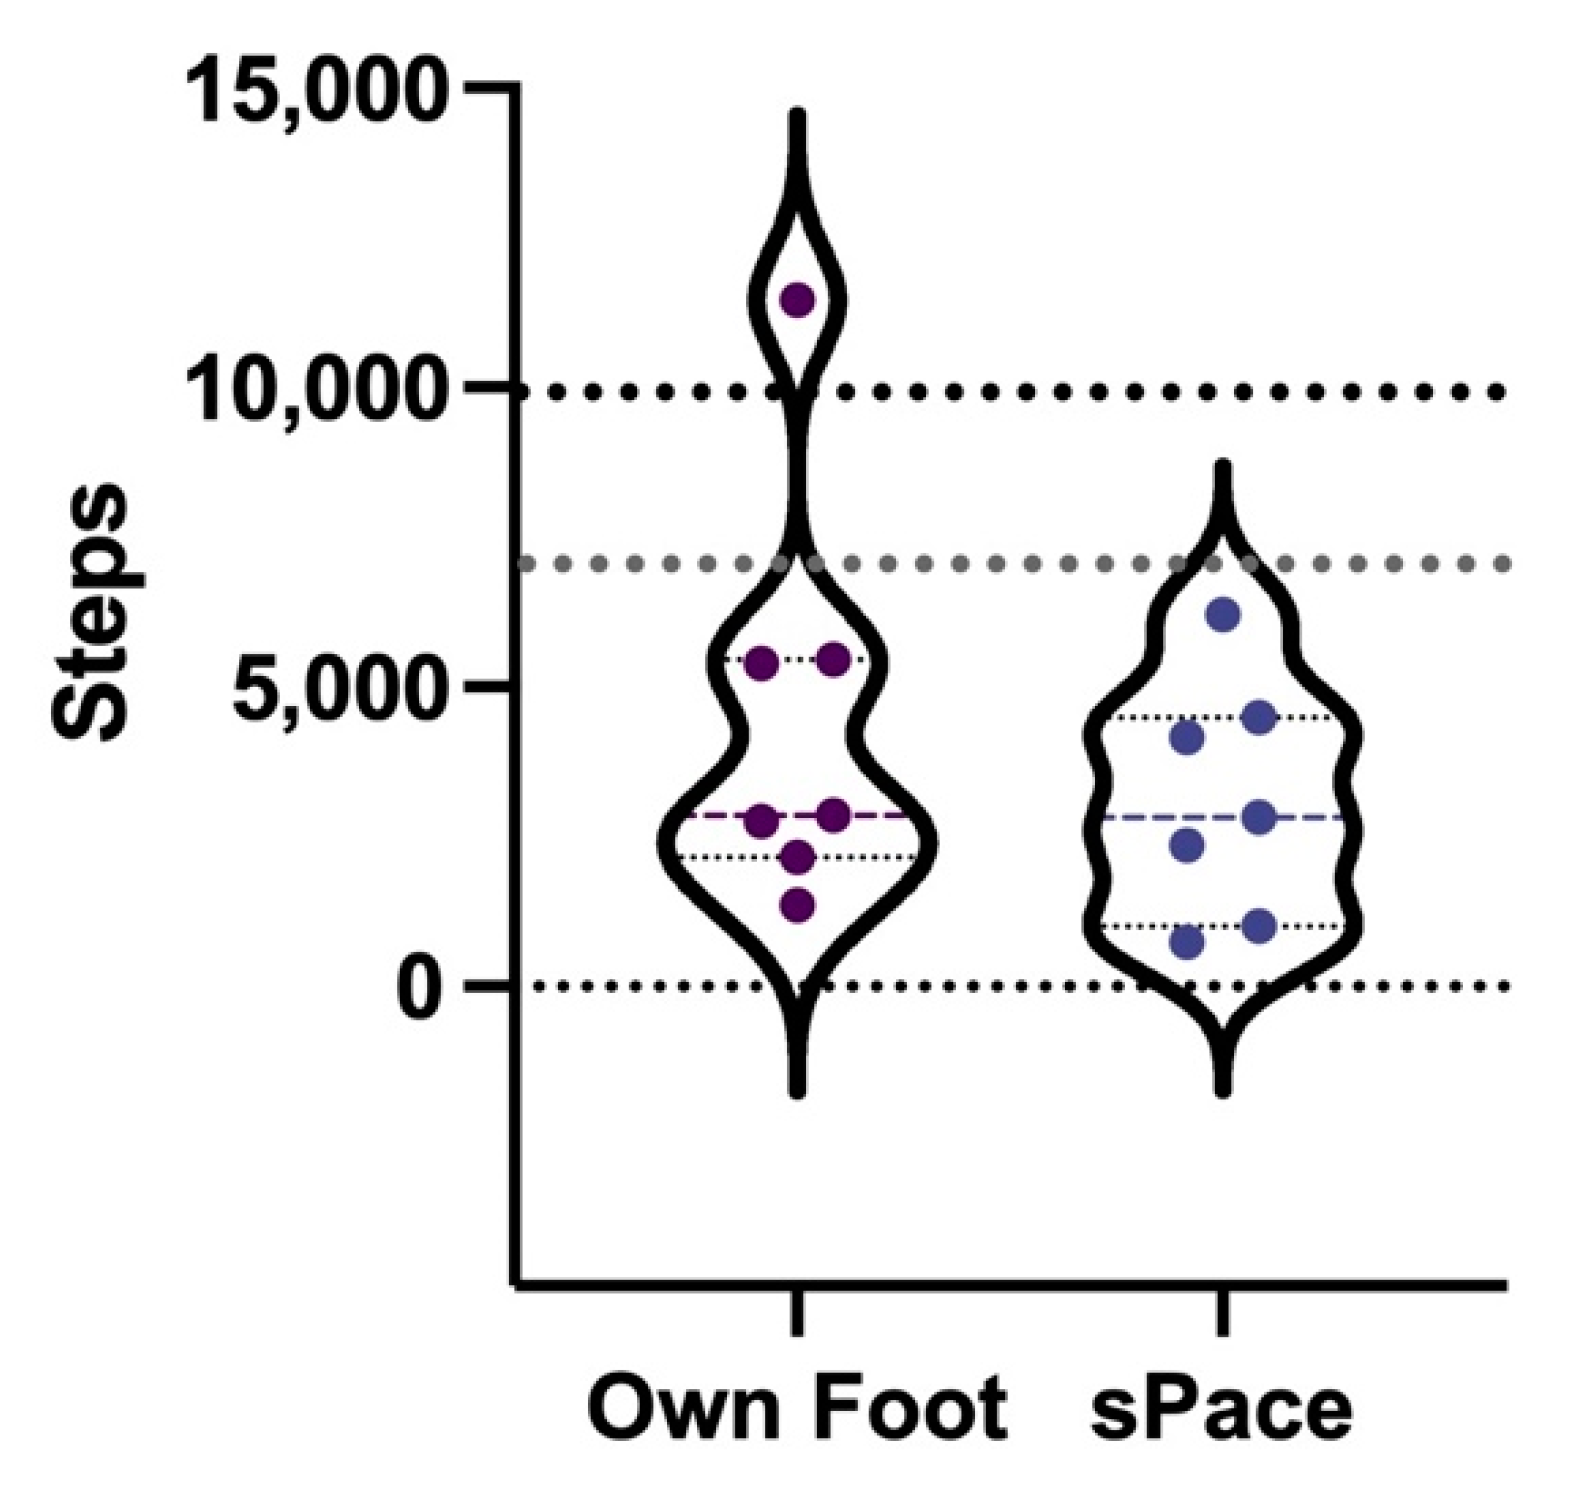
3.3. Step Activity
4. Discussion
5. Conclusions
Author Contributions
Funding
Institutional Review Board Statement
Informed Consent Statement
Data Availability Statement
Acknowledgments
Conflicts of Interest
References
- McDonald, C.L.; Westcott-McCoy, S.; Weaver, M.R.; Haagsma, J.; Kartin, D. Global Prevalence of Traumatic Non-Fatal Limb Amputation. Prosthet. Orthot. Int. 2021, 45, 105–114. [Google Scholar] [CrossRef] [PubMed]
- USAID; WHO. Standards for Prosthetics and Orthotics; WHO: Geneva, Switzerland, 2017. [Google Scholar]
- Sinha, R.; van den Heuvel, W.J.; Arokiasamy, P. Factors Affecting Quality of Life in Lower Limb Amputees. Prosthet. Orthot. Int. 2011, 35, 90–96. [Google Scholar] [CrossRef] [PubMed]
- McDonald, C.L.; Kramer, P.A.; Morgan, S.J.; Halsne, E.G.; Cheever, S.M.; Hafner, B.J. Energy Expenditure in People with Transtibial Amputation Walking with Crossover and Energy Storing Prosthetic Feet: A Randomized within-Subject Study. Gait Posture 2018, 62, 349–354. [Google Scholar] [CrossRef] [PubMed]
- Hafner, B.J.; Sanders, J.E.; Czerniecki, J.M.; Fergason, J. Transtibial Energy-Storage-and-Return Prosthetic Devices: A Review of Energy Concepts and a Proposed Nomenclature. J. Rehabil. Res. Dev. 2002, 39, 1–11. [Google Scholar] [PubMed]
- Houdijk, H.; Wezenberg, D.; Hak, L.; Cutti, A.G. Energy Storing and Return Prosthetic Feet Improve Step Length Symmetry While Preserving Margins of Stability in Persons with Transtibial Amputation. J. Neuroeng. Rehabil. 2018, 15, 76. [Google Scholar] [CrossRef] [PubMed]
- Ernst, M.; Altenburg, B.; Schmalz, T. Characterizing Adaptations of Prosthetic Feet in the Frontal Plane. Prosthet. Orthot. Int. 2020, 44, 225–233. [Google Scholar] [CrossRef]
- Laferrier, J.Z.; Groff, A.; Hale, S.; Sprunger, N.A. A Review of Commonly Used Prosthetic Feet for Developing Countries: A Call for Research and Development. J. Nov. Physiother. 2018, 8, 1–10. [Google Scholar] [CrossRef] [Green Version]
- Tebbutt, E.; Brodmann, R.; Borg, J.; MacLachlan, M.; Khasnabis, C.; Horvath, R. Assistive Products and the Sustainable Development Goals (SDGs). Glob. Health 2016, 12, 79. [Google Scholar] [CrossRef] [Green Version]
- Rakbangboon, T.; Guerra, G.; Sasaki, K.; Tangpornprasert, P.; Virulsri, C.; Phaipool, S.; Hodges, J.; Putra, A.D.; Yunihanawati, R.; Arunsaengsin, N.; et al. Affordable Energy Storage and Return Prosthesis: Functional Comparisons of the S-Pace and Ossur Vari-Flex Feet. Arch. Phys. Med. Rehabil. 2018, 99, e97. [Google Scholar] [CrossRef]
- Gailey, R.S.; Roach, K.E.; Applegate, E.B.; Cho, B.; Cunniffe, B.; Licht, S.; Maguire, M.; Nash, M.S. The Amputee Mobility Predictor: An Instrument to Assess Determinants of the Lower-Limb Amputee’s Ability to Ambulate. Arch. Phys. Med. Rehabil. 2002, 83, 613–627. [Google Scholar] [CrossRef]
- Agrawal, V.; Gaunaurd, I.; Kim, K.J.; Bennett, C.; Gailey, R. A Comparison of the Center of Pressure Trajectory Between Dynamic Response Prosthetic Feet Having Different Ankle Designs. JPO J. Prosthet. Orthot. 2022, 34, 44–51. [Google Scholar] [CrossRef]
- Miller, T.A.; Campbell, J.H.; England, D.L.; Stevens, P.M.; Wurdeman, S.R. OASIS 2: Mobility Differences with Specific Prosthetic Feet across Procedure Codes. J. Rehabil. Assist. Technol. Eng. 2022, 9, 205566832211016. [Google Scholar] [CrossRef] [PubMed]
- Gailey, R.; Clark, R. Physical Therapy Management of Adult Lower-Limb Amputees. In Atlas of Limb Prosthetics: Surgical, Prosthetic, and Rehabilitation Principles; Bowker, H.K., Michael, J.W., Eds.; American Academy of Orthopedic Surgeon: Rosemont, IL, USA, 2004. [Google Scholar]
- Klodd, E.; Hansen, A.; Fatone, S.; Edwards, M. Effects of Prosthetic Foot Forefoot Flexibility on Gait of Unilateral Transtibial Prosthesis Users. J. Rehabil. Res. Dev. 2010, 47, 899. [Google Scholar] [CrossRef] [PubMed]
- Rimmer, J.H.; Riley, B.; Wang, E.; Rauworth, A.; Jurkowski, J. Physical Activity Participation among Persons with Disabilities: Barriers and Facilitators. Am. J. Prev. Med. 2004, 26, 419–425. [Google Scholar] [CrossRef] [PubMed]
- Brooks, D.; Parsons, J.; Hunter, J.P.; Devlin, M.; Walker, J. The 2-Minute Walk Test as a Measure of Functional Improvement in Persons with Lower Limb Amputation. Arch. Phys. Med. Rehabil. 2001, 82, 1478–1483. [Google Scholar] [CrossRef] [PubMed]
- Bohannon, R.W. Normative Reference Values for the Two-Minute Walk Test Derived by Meta-Analysis. J. Phys. Ther. Sci. 2017, 29, 2224–2227. [Google Scholar] [CrossRef] [Green Version]
- Sions, J.M.; Beisheim, E.H.; Manal, T.J.; Smith, S.C.; Horne, J.R.; Sarlo, F.B. Differences in Physical Performance Measures Among Patients With Unilateral Lower-Limb Amputations Classified as Functional Level K3 Versus K4. Arch. Phys. Med. Rehabil. 2018, 99, 1333–1341. [Google Scholar] [CrossRef]
- Gailey, R.S.; Gaunaurd, I.A.; Raya, M.A.; Roach, K.E.; Linberg, A.A.; Campbell, S.M.; Jayne, D.M.; Scoville, C. Development and Reliability Testing of the Comprehensive High-Level Activity Mobility Predictor (CHAMP) in Male Servicemembers with Traumatic Lower-Limb Loss. J. Rehabil. Res. Dev. 2013, 50, 905–918. [Google Scholar] [CrossRef]
- Gailey, R.S.; Gaunaurd, I.; Morgan, S.J.; Kristal, A.; Balkman, G.S.; Newton, E.M.; Palomo, J.J.; Shay, K.M.; Salem, R.; Hafner, B.J. A Comparison of the Two-Minute Walk Test (2MWT) and Comprehensive High-Level Activity Mobility Predictor (CHAMP) in People with a Leg Prosthesis. Clin. Rehabil. 2022, 36, 703–712. [Google Scholar] [CrossRef]
- Smith, J.D.; Guerra, G.; Burkholder, B.G. The Validity and Accuracy of Wrist-Worn Activity Monitors in Lower-Limb Prosthesis Users. Disabil. Rehabil. 2020, 42, 3182–3188. [Google Scholar] [CrossRef]
- Miyata, Y.; Sasaki, K.; Guerra, G.; Rattanakoch, J. Sustainable, Affordable and Functional: Reimagining Prosthetic Liners in Resource Limited Environments. Disabil. Rehabil. 2022, 44, 2941–2947. [Google Scholar] [CrossRef] [PubMed]
- Hou, Y.; Wu, X.; Li, K. Issues on the Selection of Non-Inferiority Margin in Clinical Trials. Chin. Med. J. 2009, 122, 466–470. [Google Scholar] [PubMed]
- Flight, L.; Julious, S.A. Practical Guide to Sample Size Calculations: Non-Inferiority and Equivalence Trials. Pharm. Stat. 2016, 15, 80–89. [Google Scholar] [CrossRef] [PubMed]
- Resnik, L.; Borgia, M. Reliability of Outcome Measures for People With Lower-Limb Amputations: Distinguishing True Change From Statistical Error. Phys. Ther. 2011, 91, 555–565. [Google Scholar] [CrossRef]
- Gaunaurd, I.A. The Comprehensive High-Level Activity Mobility Predictor (CHAMP): A Performance-Based Assessment Instrument to Quantify High-Level Mobility in Service Members with Traumatic Lower Limb Loss. Ph.D. Thesis, University of Miami, Coral Gables, FL, USA, 2012. [Google Scholar]
- Schack, J.; Mirtaheri, P.; Steen, H.; Gjøvaag, T. Assessing Mobility for Persons with Lower Limb Amputation: The Figure-of-Eight Walk Test with the Inclusion of Two Novel Conditions. Disabil. Rehabil. 2021, 43, 1323–1332. [Google Scholar] [CrossRef]
- Järnhammer, A.; Andersson, B.; Wagle, P.R.; Magnusson, L. Living as a Person Using a Lower-Limb Prosthesis in Nepal. Disabil. Rehabil. 2018, 40, 1426–1433. [Google Scholar] [CrossRef] [Green Version]
- Master, H.; Neogi, T.; LaValley, M.; Thoma, L.M.; Zhang, Y.; Voinier, D.; Christiansen, M.B.; White, D.K. Does the 1-Year Decline in Walking Speed Predict Mortality Risk Beyond Current Walking Speed in Adults With Knee Osteoarthritis? J. Rheumatol. 2021, 48, 279–285. [Google Scholar] [CrossRef]
- Zhang, J.; Chen, X.; Huang, S.; Wang, Y.; Lin, W.; Zhou, R.; Zou, H. Two-Minute Walk Test: Reference Equations for Healthy Adults in China. PLoS ONE 2018, 13, e0201988. [Google Scholar] [CrossRef] [Green Version]
- Gaunaurd, I.; Kristal, A.; Horn, A.; Krueger, C.; Muro, O.; Rosenberg, A.; Gruben, K.; Kirk-Sanchez, N.; Pasquina, P.; Gailey, R. The Utility of the 2-Minute Walk Test as a Measure of Mobility in People With Lower Limb Amputation. Arch. Phys. Med. Rehabil. 2020, 101, 1183–1189. [Google Scholar] [CrossRef]
- Smith, J.D.; Guerra, G. Quantifying Step Count and Oxygen Consumption with Portable Technology during the 2-Min Walk Test in People with Lower Limb Amputation. Sensors 2021, 21, 2080. [Google Scholar] [CrossRef]
- Gremeaux, V.; Damak, S.; Troisgros, O.; Feki, A.; Laroche, D.; Perennou, D.; Benaim, C.; Casillas, J.-M. Selecting a Test for the Clinical Assessment of Balance and Walking Capacity at the Definitive Fitting State after Unilateral Amputation: A Comparative Study. Prosthet. Orthot. Int. 2012, 36, 415–422. [Google Scholar] [CrossRef] [PubMed]
- Hachana, Y.; Chaabène, H.; Nabli, M.A.; Attia, A.; Moualhi, J.; Farhat, N.; Elloumi, M. Test-Retest Reliability, Criterion-Related Validity, and Minimal Detectable Change of the Illinois Agility Test in Male Team Sport Athletes. J. Strength Cond. Res. 2013, 27, 2752–2759. [Google Scholar] [CrossRef] [PubMed]
- Salimi, Z.; Ferguson-Pell, M.W. Investigating the Test-Retest Reliability of Illinois Agility Test for Wheelchair Users. PLoS ONE 2020, 15, e0241412. [Google Scholar] [CrossRef]
- Wasserman, K.; Hansen, J.; Sue, D.; Stringer, W.; Sietsema, K.; Sun, X.; Whipp, B. Principles of Exercise Testing and Interpretation: Including Pathophysiology and Clinical Applications, 5th ed.; Lippincott Williams and Wilkins: Philadelphia, PA, USA, 2012; ISBN 1609138996. [Google Scholar]
- Vestering, M.M.; Schoppen, T.; Dekker, R.; Wempe, J.; Geertzen, J.H.B. Development of an Exercise Testing Protocol for Patients with a Lower Limb Amputation: Results of a Pilot Study. Int. J. Rehabil. Res. 2005, 28, 237–244. [Google Scholar] [CrossRef] [Green Version]
- Guerra, G.; Smith, J.D. Correlates of Balance and Aerobic Indices in Lower-Limb Prostheses Users on Arm Crank Exercise. Sensors 2021, 21, 6917. [Google Scholar] [CrossRef] [PubMed]
- Chin, T.; Sawamura, S.; Fujita, H.; Nakajima, S.; Oyabu, H.; Nagakura, Y.; Ojima, I.; Otsuka, H.; Nakagawa, A. Physical Fitness of Lower Limb Amputees. Am. J. Phys. Med. Rehabil. 2002, 81, 321–325. [Google Scholar] [CrossRef]
- Singh, M.A.F. Exercise to Prevent and Treat Functional Disability. Clin. Geriatr. Med. 2002, 18, 431–462. [Google Scholar] [CrossRef]
- Lin, S.-J.; Winston, K.D.; Mitchell, J.; Girlinghouse, J.; Crochet, K. Physical Activity, Functional Capacity, and Step Variability during Walking in People with Lower-Limb Amputation. Gait Posture 2014, 40, 140–144. [Google Scholar] [CrossRef]
- Kraus, W.E.; Janz, K.F.; Powell, K.E.; Campbell, W.W.; Jakicic, J.M.; Troiano, R.P.; Sprow, K.; Torres, A.; Piercy, K.L. Daily Step Counts for Measuring Physical Activity Exposure and Its Relation to Health. Med. Sci. Sport. Exerc. 2019, 51, 1206–1212. [Google Scholar] [CrossRef]
- Chadwell, A.; Diment, L.; Micó-Amigo, M.; Morgado Ramírez, D.Z.; Dickinson, A.; Granat, M.; Kenney, L.; Kheng, S.; Sobuh, M.; Ssekitoleko, R.; et al. Technology for Monitoring Everyday Prosthesis Use: A Systematic Review. J. Neuroeng. Rehabil. 2020, 17, 93. [Google Scholar] [CrossRef]
- Wong, C.K.; Rissland, M.S.; Madagan, D.M.; Jones, K.N. A Scoping Review of Physical Activity in People With Lower-Limb Loss: 10,000 Steps Per Day? Phys. Ther. 2021, 101, pzab115. [Google Scholar] [CrossRef] [PubMed]
- Schmalz, T.; Bellmann, M.; Proebsting, E.; Blumentritt, S. Effects of Adaptation to a Functionally New Prosthetic Lower-Limb Component. JPO J. Prosthet. Orthot. 2014, 26, 134–143. [Google Scholar] [CrossRef]
- Wanamaker, A.B.; Andridge, R.R.; Chaudhari, A.M. When to Biomechanically Examine a Lower-Limb Amputee: A Systematic Review of Accommodation Times. Prosthet. Orthot. Int. 2017, 41, 431–445. [Google Scholar] [CrossRef] [PubMed]


| Tests | sPace | Vari-Flex | Mean Difference ± SD | Treatment Effect (95%CI) | p-Value |
|---|---|---|---|---|---|
| Walk Tests (m/s) | |||||
| 10MWT Even Terrain | |||||
| CWS | 1.25 ± 0.22 | 1.26 ± 0.18 | 0.01 ± 0.20 | 0.00 (−0.14–0.14) | 0.015 |
| FWS | 1.66 ± 0.28 | 1.25 ± 0.45 | 0.40 ± 0.25 | 0.40 (0.18–0.61) | 0.00042 |
| 10MWT Uneven Terrain | |||||
| CWS | 1.14 ± 0.35 | 1.18 ± 0.34 | 0.03 ± 0.08 | −0.03 (−0.08–0.02) | 0.031 |
| FWS | 1.51 ± 0.46 | 1.56 ± 0.49 | 0.05 ± 0.10 | −0.05 (−0.13–0.03) | 0.099 |
| 20MWT Even Terrain | |||||
| CWS | 1.28 ± 0.15 | 1.26 ± 0.09 | 0.01 ± 0.12 | 0.02 (−0.08–0.12) | 0.013 |
| FWS | 1.68 ± 0.27 | 1.65 ± 0.20 | 0.02 ± 0.19 | 0.03 (−0.10–0.17) | 0.03 |
| 20MWT Uneven Terrain | |||||
| CWS | 0.87 ± 0.20 | 0.88 ± 0.22 | 0.008 ± 0.04 | −0.008 (−0.06–0.05) | 0.05 |
| FWS | 1.01 ± 0.23 | 1.05 ± 0.25 | 0.04 ± 0.08 | −0.04 (−0.14–0.06) | 0.10 |
| 2-MWT (m) | 137.08 ± 40.50 | 138.90 ± 51.31 | 1.82 ± 23.05 | −1.40 (−20.68–17.85) | 0.33 |
| CHAMP | 16.94 ± 5.41 | 16.72 ± 6.09 | 0.22 ± 1.56 | 0.31 (−0.79–1.42) | 0.116 |
| Edgren Side-Step Test | 2.77 ± 0.97 | 2.66 ± 1.11 | 0.11 ± 0.60 | 0.12 (−0.37–0.62) | 0.049 |
| Illinois Agility Test | 5.14 ± 1.57 | 5.14 ± 2.03 | 0.00 ± 0.57 | 0.04 (−0.48–0.56) | 0.097 |
| t-test | 6.00 ± 2.29 | 5.88 ± 2.02 | 0.11 ± 0.78 | 0.15 (−0.43–0.73) | 0.12 |
| Single-Limb Stance | 5.35 ± 0.37 | 5.35 ± 0.55 | 0.00 ± 0.70 | 0.02 (−0.71–0.76) | 0.18 |
Publisher’s Note: MDPI stays neutral with regard to jurisdictional claims in published maps and institutional affiliations. |
© 2022 by the authors. Licensee MDPI, Basel, Switzerland. This article is an open access article distributed under the terms and conditions of the Creative Commons Attribution (CC BY) license (https://creativecommons.org/licenses/by/4.0/).
Share and Cite
Rakbangboon, T.; Guerra, G.; Kla-arsa, S.; Padungjaroen, U.; Tangpornprasert, P.; Virulsri, C.; Sasaki, K. High-Level Mobility of Trans-Tibial Prosthesis Users Wearing Commercial and sPace Energy-Storing Prosthetic Feet. Int. J. Environ. Res. Public Health 2022, 19, 12606. https://doi.org/10.3390/ijerph191912606
Rakbangboon T, Guerra G, Kla-arsa S, Padungjaroen U, Tangpornprasert P, Virulsri C, Sasaki K. High-Level Mobility of Trans-Tibial Prosthesis Users Wearing Commercial and sPace Energy-Storing Prosthetic Feet. International Journal of Environmental Research and Public Health. 2022; 19(19):12606. https://doi.org/10.3390/ijerph191912606
Chicago/Turabian StyleRakbangboon, Thanyaporn, Gary Guerra, Saloottra Kla-arsa, Uthumporn Padungjaroen, Pairat Tangpornprasert, Chanyaphan Virulsri, and Kazuhiko Sasaki. 2022. "High-Level Mobility of Trans-Tibial Prosthesis Users Wearing Commercial and sPace Energy-Storing Prosthetic Feet" International Journal of Environmental Research and Public Health 19, no. 19: 12606. https://doi.org/10.3390/ijerph191912606