Article

Does Industrial Transfer Change the Spatial Structure of CO2 Emissions?—Evidence from Beijing-Tianjin-Hebei Region in China

School of Geography, Faculty of Geographical Science, Beijing Normal University, Beijing 100875, China
*
Author to whom correspondence should be addressed.
Int. J. Environ. Res. Public Health 2022, 19(1), 322; https://doi.org/10.3390/ijerph19010322
Submission received: 4 December 2021 / Revised: 20 December 2021 / Accepted: 27 December 2021 / Published: 29 December 2021
(This article belongs to the Special Issue Green Development and Carbon Neutralization)

Abstract

:
As an important cause of global warming, CO2 emissions have become a research hotspot in recent years. Industrial transfer impacts regional CO2 emissions and is related to the low-carbon development of regional industries. Taking the Beijing-Tianjin-Hebei region (BTH region) as an example, this study analysed industrial transfer’s direct and indirect impacts on CO2 emissions based on a mediating model and two-way fixed effect panel regression. The results obtained indicate that industrial transfer-in has promoted CO2 emissions to a small extent, and the positive impact of industrial transfer-in on CO2 emissions wanes over time. Industrial transfer affects CO2 emissions by acting on the economic level, on population size, and on urbanisation level, but the indirect effect is weaker than the direct effect. Industrial transfer does not lead to technological upgrading, but the latter is an effective means of carbon emission reduction. Industrial transfer-in has shown a positive effect on CO2 emissions for most cities, but there are exceptions, such as Cangzhou. In the future, the BTH region should maintain coordinated development among cities and improve the cooperative innovation mechanism for energy conservation and emission reduction.

1. Introduction

The latest Greenhouse Gas Bulletin issued by the World Meteorological Organization (WMO) stated that atmospheric CO2 concentration in 2019 was approximately 148% of preindustrial levels, mainly due to the burning of fossil fuels [1]. Carbon dioxide emissions are the main cause of global warming and are closely related to human activities, so reducing or mitigating CO2 emissions has become a global concern [2]. The Paris Agreement adopted at the 21st session of the Conference of the Parties (COP 21) is an effort by countries to jointly address climate change. It calls for eliminating carbon leakage between countries [3], that is, reducing emissions in one region increasing emissions in other countries through industrial transfer and other means [4]. In the context of economic globalisation, relying on technological superiority, developed countries tend to transfer high-carbon emission sectors in the production process to developing countries [5]. Developing countries at the low end of the global value chain have to bear corresponding ecological, environmental pressure. Industrial transfer puts environmental pressure on the receiving location [6] and increases CO2 emissions [7,8]. In around 2000, commodity trade between developed countries and developing countries presented the characteristics of carbon emission transfer [9,10,11], which to some extent reflects the consequences of industrial transfer because trade causes some countries to specialise in pollution-intensive industries [12]. However, another view holds that countries at the low end of the industrial chain can reduce the CO2 emissions caused by industrial transfer through improving energy efficiency and technical level to emerge from the predicament of “pollution heaven” [13]. Within a country, the transfer of industries between different regions can also cause changes in CO2 emissions. The economic structure of the area of transfer-out will be optimised, promoting carbon emission reduction, while the area of transfer-in will present high emission characteristics [14,15]. However, there is also a point of view that industrial transfer is not the main premise of carbon emission transfer, and environmental regulation, industry type and technology also play a large role [16,17].
Therefore, there is still no clear conclusion about the impact of industrial transfer on CO2 emissions. In the context of international and domestic industrial transfer continuing to increase [14,17,18], this issue deserves further study. In addition, most of the existing studies related to industrial transfer have explored the rationality of the international ‘pollution heaven’ hypothesis [19,20,21,22]. They measured international industrial transfer through a country’s trade openness, FDI, trade comparative advantage index, export/import value and other indicators to judge the relationship between international trade and environmental pollution [9,20,23]. There are relatively few studies on the impact of industrial transfer on CO2 emissions within a country, especially at the city level. There are few studies on the mechanism between industrial transfer and CO2 emissions. However, industrial transfer between different regions or cities within a country may have different effects than international industrial transfer.
On the one hand, there may be differences in the mechanism between international industrial transfer and domestic industrial transfer. Industrial transfer between regions within a country is based not only on the labour cost advantage of underdeveloped regions but also on their land quantity advantage [24]. The development of construction land in receiving locations may become an important source of increasing CO2 emissions [25], which can be seen as an indirect influence. On the other hand, the effect of “pollution heaven” between regions may not be as strong as that of international industrial transfer because environmental policies within a country often differ little among regions. The introduction of high-carbon industries with loose environmental policies may not be so common (In a unitary country, this is evident. In a federal country, different states have different environmental policies, but states are also influenced by the policy preferences of the federal government). Therefore, the relationship between industrial transfer and CO2 emissions among different cities within a country is also worth studying.
Meanwhile, most previous studies on the environmental effects of industrial transfer have only clarified the direction of its effect and the time trend, or explored the direct impact and indirect spill-over effects from the perspective of spatial regression [7,15,17,21,26,27,28,29,30,31]. There are few studies on the internal mechanism. However, as seen from the relevant studies on the influencing factors on CO2 emissions, economic, population, urbanisation, technology and other factors have been widely discussed [32]. There is a certain correlation between industrial transfer and these factors (see Section 2 for a specific analysis framework) [33,34,35,36]. Therefore, it is worth discussing further whether industrial transfer will indirectly affect CO2 emissions by influencing the above social and economic factors in addition to its direct effects. Research on the mechanism is helpful to better implement the supporting measures for industrial transfer and avoid a possible negative chain effect.
As the largest developing country in the world, China has experienced rapid industrialisation and urbanisation since reform and opening up. Economic development inevitably has led to the continuous growth of energy consumption, which has led to high CO2 emissions [37]. Specifically, China’s total CO2 emissions reached 9.92 billion tons in 2019, accounting for 29.03% of the world total [38]. At the 75th Session of the United Nations General Assembly, China announced to the world the goal of achieving a carbon peak by 2030 and achieving carbon neutrality by 2060 in response to global warming caused by greenhouse gas emissions [39]. In its written address to the 26th World Leaders’ Summit of the Conference of the Parties (COP26) of the United Nations Framework Convention on Climate Change (UNFCCC), China also mentioned the establishment of a carbon peak and carbon neutral policy system [40]. Against the background of energy conservation and emission reduction policies, ecological civilisation construction and CO2 emission reduction targets are proposed. A series of measures have been implemented from the national level to the city level. At the same time, regional sustainable development and coordinated governance in response to CO2 emissions reduction have become the focus of research [41]. Under the guidance of China’s gradient development strategy, the energy-intensive and labour-intensive industries in the more developed eastern regions are transferring to the central and western regions [42]. Industrial transfers between provinces and cities within urban agglomerations have become more frequent. It is worth studying the role of industrial transfer between cities, which is of great practical significance for the rational formulation of CO2 emission reduction policies, the promotion of urban CO2 emission equity, and the establishment of a regional low-carbon economic system and collaborative development system.
The Beijing-Tianjin-Hebei (BTH) region is China’s capital economic circle. The integration trend of the BTH region is mainly driven by policy (Table 1). In particular, the Outline of Coordinated Development of the Beijing-Tianjin-Hebei Region in 2015 put forward new demands regarding the industrial layout of Beijing, Tianjin and Hebei. The Outline explicitly mentions: “relieve Beijing’s noncapital functions, accelerating industrial transfer and the construction of receiving platforms”. According to government documents, industrial transfer is an important part of the coordinated development of the BTH region, but whether it will affect changes in CO2 emissions is worth exploring. This study explores the impact of industrial transfer between cities in the BTH region on the CO2 emissions of the whole region and each city. The direct and indirect effects of industrial transfer on CO2 emissions are considered in order to make cities improve the coordination of their development of CO2 reduction.

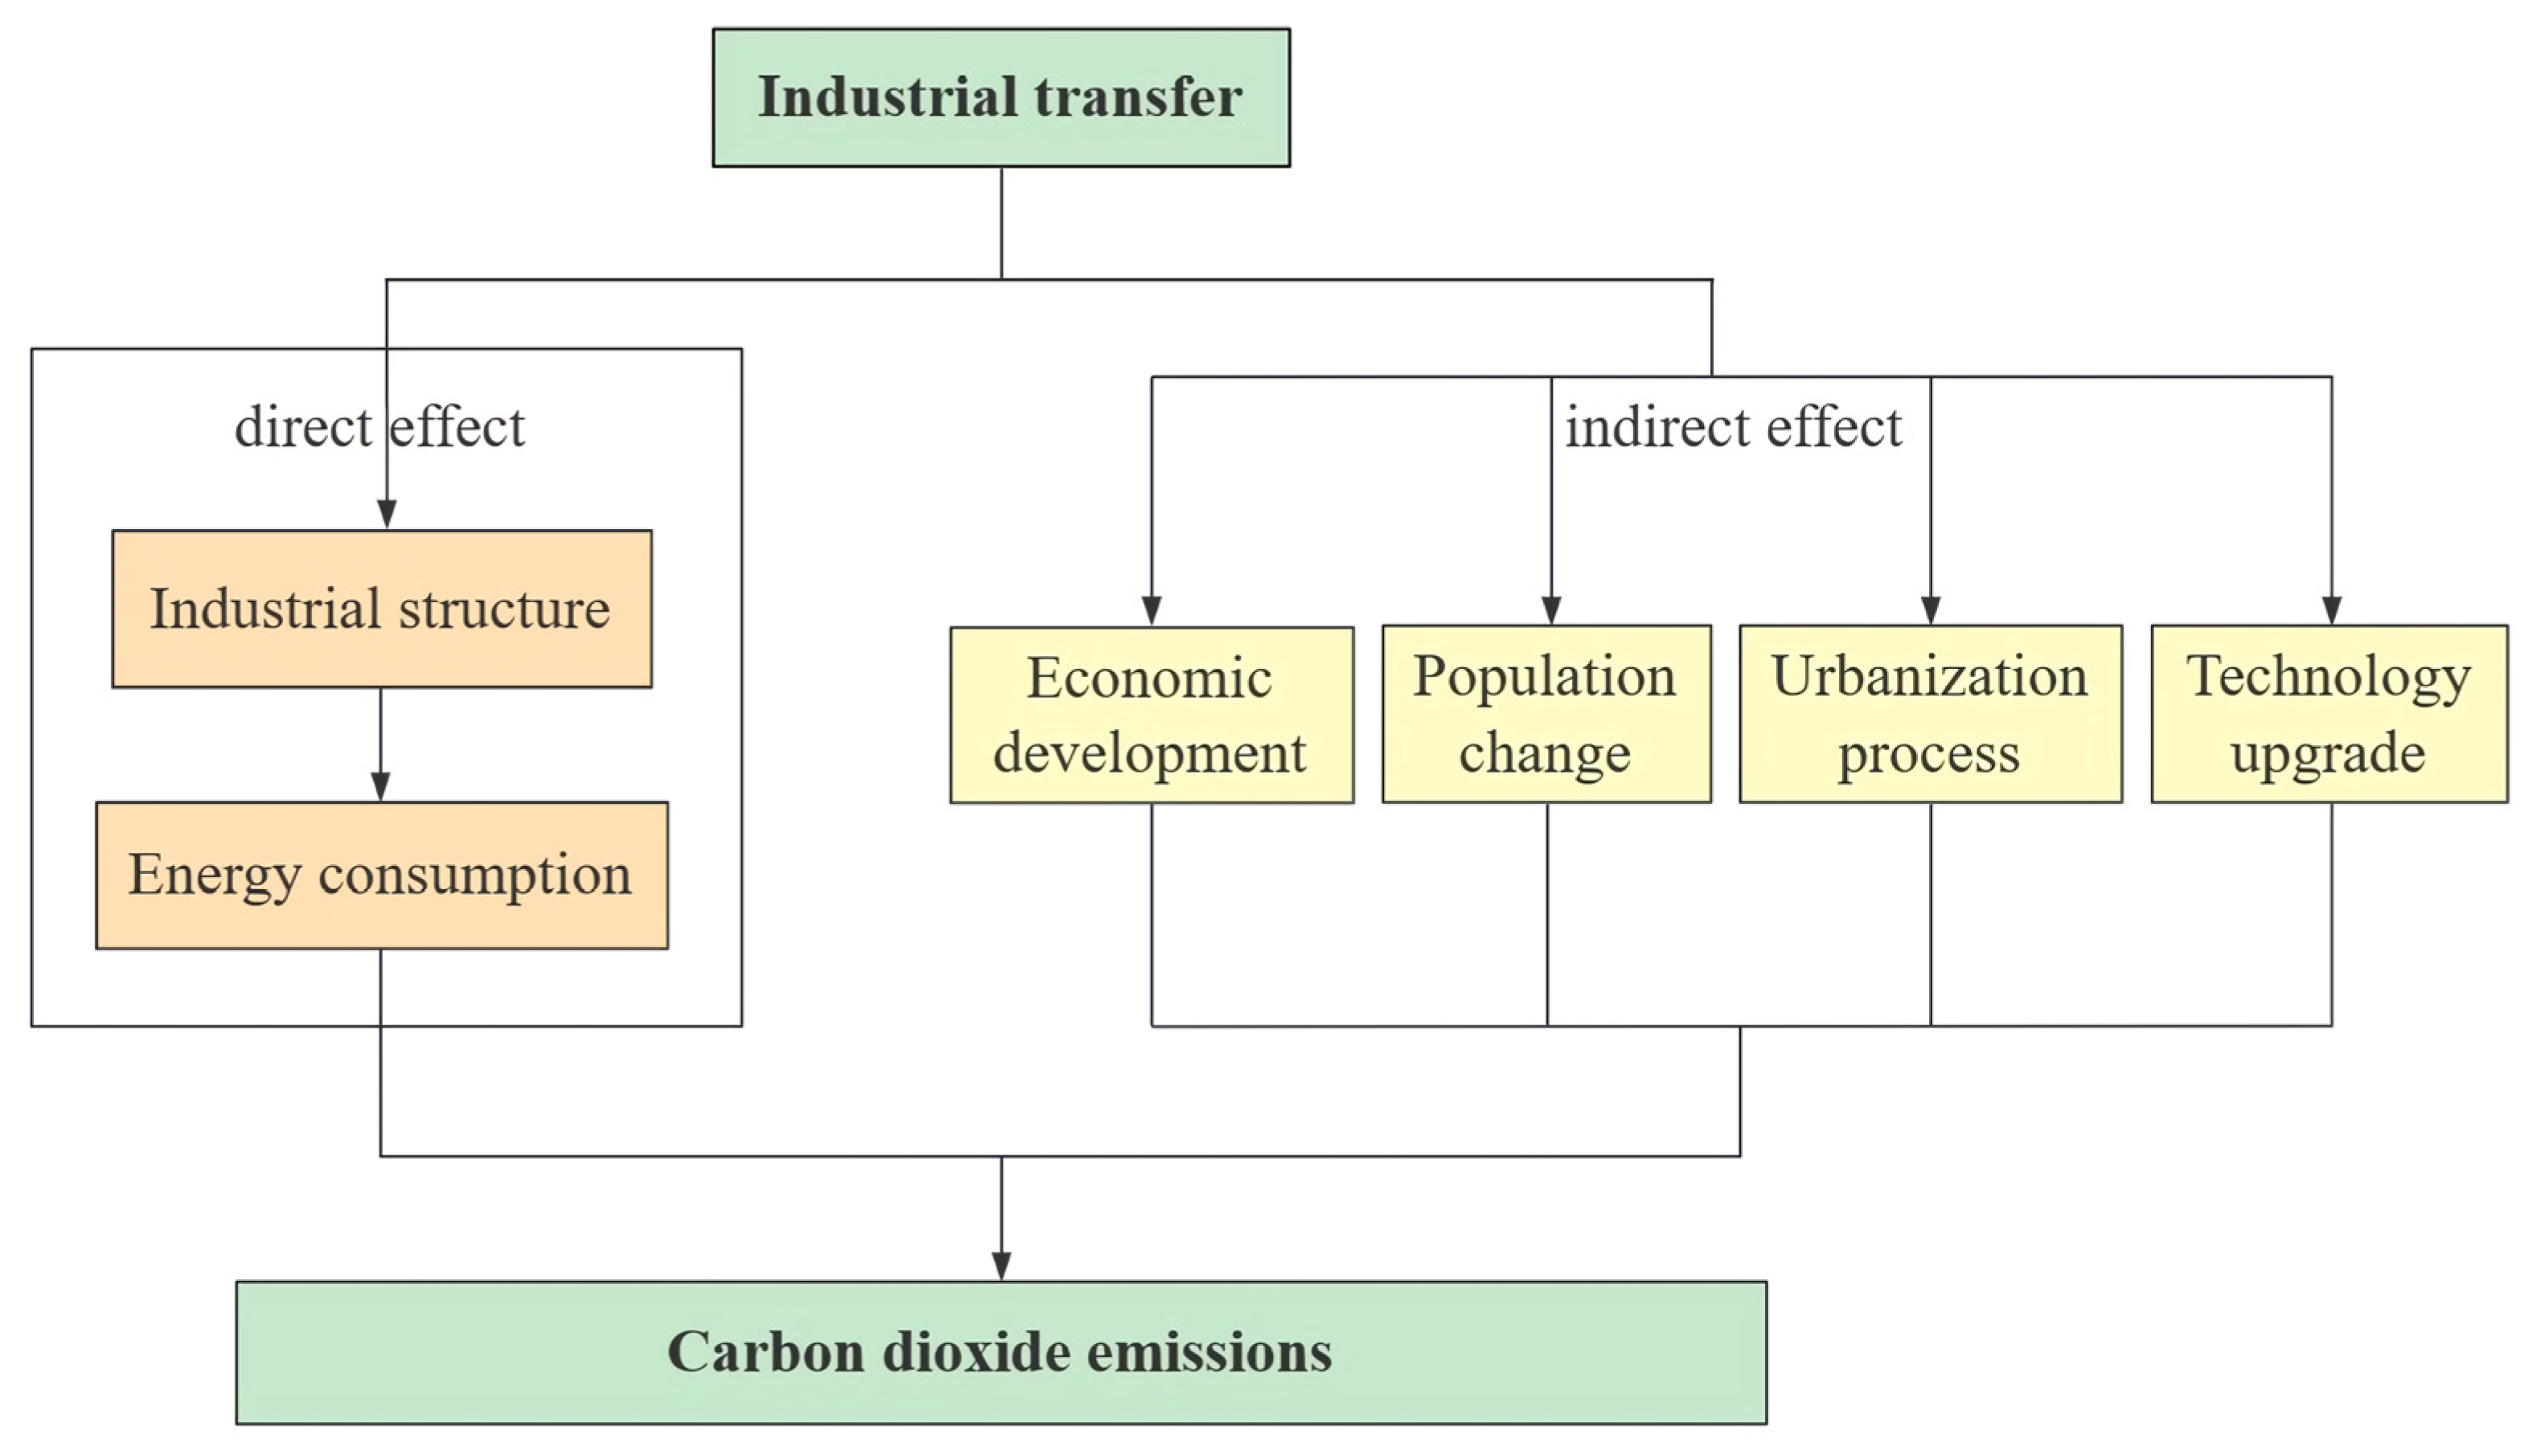
2. Industrial Transfer and CO2 Emissions: Literature Review and Analysis Framework

In recent years, scholars in different fields have conducted in-depth studies of the influencing factors of CO2 emissions, but few studies have focused on industrial transfer. Several studies confirm that CO2 emissions are affected by economic development, population size, urbanisation, technical level, etc. Economic growth is considered the most important driving force [44] because large amounts of fossil energy need to be consumed during this process, which greatly promotes CO2 emissions [45]. Industrial transfer is one of the means of regional economic development, so it may impact CO2 emissions. The change in industrial structure caused by industrial transfer affects the process or method of regional economic development [33]. Therefore, industrial transfer may indirectly affect CO2 emissions by acting on economic development. With the development of China’s economy and the improvement of people’s living standards, residents’ household consumption has become an important source of energy consumption [46], and the increase in population has proven to be one of the main factors that promote CO2 emissions [47,48].To some extent, industrial transfer means labour force transfer because upgrading the regional industrial structure may become the pull force of population migration [34]. Therefore, industrial transfer may have a significant impact on CO2 emissions through its impact on the population. The aggregation of the population to cities also improves the level of regional urbanisation. Population urbanisation is accompanied by changes in people’s production and lifestyle [32], impacting CO2 emissions [49]. Especially in developing countries, there is a long-term causal relationship between urbanisation and CO2 emissions [50]. Industrial transfer promotes the development of industrialisation, which is the basis of urbanisation [35]. Industrial transfer may promote the infrastructure construction of the receiving area, thus promoting the development of urbanisation. Therefore, industrial transfer may also have an indirect impact on CO2 emissions through its impact on urbanisation.
However, industrial transfer also means regional industrial adjustment and upgrading because relatively developed areas transfer their eliminated industries to relatively undeveloped areas [51]. Industrial transfer can promote the upgrading and optimisation of the economic structure in developed areas and accelerate industrialisation in underdeveloped areas. In this process, industrial receiving areas may introduce advanced technologies and other production factors [36]. The spill-over effect of technology promotes the technological progress of the receiving area and the transformation of traditional industries to advanced ones [52]. Therefore, some industries have achieved technological upgrading in the transfer process; that is, industrial transfer may contribute to carbon reduction in the receiving region by helping to improve the technological level.
In addition to influencing CO2 emissions through economic development, population, urbanisation, and technological levels, industrial transfer also directly impacts CO2 emissions. Industrial transfer refers to the phenomenon or process of industrial change in space, which is a dynamic manifestation of industrial spatial patterns [53]. In a narrow sense, industrial transfer is the relocation of enterprises under the combined effect of resource supply and market demand. In a broad sense, industrial transfer also includes invisible transfer, that is, the change of industrial input or output scale caused by the change in the final demand for a product in other regions [54]. Industrial structural change is often accompanied by the phenomenon of industrial transfer, which promotes industrial upgrading and balanced regional development [55] and impacts CO2 emissions [21,26]. In other words, industrial transfer means adjusting the regional industrial structure, and the latter can lead to changes in energy consumption, which is directly related to CO2 emissions. As the world’s largest energy consumer, China consumes vast amounts of fossil fuels every year. Fossil fuels, with coal and oil as the largest proportion, still play a dominant role in energy consumption, accounting for 76.6% of the total in 2019. Secondary industry is a major energy consumption sector and a high CO2 emission sector [56], so industrial transfer and industrial structure are closely related to CO2 emissions. Khan et al. found that industrial growth contributed to the long-term rise in CO2 emissions in seven South Asian countries [57]. Dong et al. found that for both Regional Comprehensive Economic Partnership (RECP) countries and non-RECP countries, the upgrading of industrial structure would help reduce CO2 emissions [58]. Liu et al. have shown that secondary industry is the main source of CO2 emissions in Beijing. A 1% increase in the proportion of the secondary industry’s added value leads to a 0.51% increase in CO2 emissions. A 1% increase in the proportion of employed people in the secondary industry leads to a 0.21% increase in CO2 emissions [59]. Yu et al. used the STIRPAT model, which has been widely used in research on the impact of social and economic driving forces on the ecological environment [60,61], to analyse the influencing factors of CO2 emissions in 20 low-carbon industrial parks in China and found that the increase in the proportion of tertiary industry had a significant impact on the reduction of CO2 emissions [62]. Chen et al. found that the industrial structure optimisation of developed cities in the Pearl River Delta positively impacted CO2 mitigation. Still, it would lead to an increase in CO2 emissions in less-developed cities dominated by capital-intensive industries and thus it was concluded that developed cities would transfer energy-intensive industries to less-developed cities and increase the latter’s CO2 emissions [26]. The research of Wang et al. on industrial transfer in the cities of Guangdong Province also confirmed a similar view [15]. Qi et al. found that when a region focuses on developing tertiary industries, high-carbon industries will be transferred to other regions, thus leading to the transfer of CO2 emissions [63]. Therefore, the transfer-in of high-carbon industries may increase energy consumption and thus increase the CO2 emissions of the receiving regions.
In summary, industrial transfer may directly impact CO2 emissions because the industrial structure is closely related to energy consumption. It may also indirectly impact CO2 emissions by affecting economic development, population, urbanisation, and technological levels. The direction of both direct and indirect effects deserves further investigation. In addition, energy intensity and fixed asset investment also affect CO2 emissions. In recent years, the global low-carbon economy has gradually developed, which makes the marginal emission tendency of CO2 gradually decrease [64]. The reduction in energy intensity positively impacts the realisation of CO2 emission reduction targets [65]. Fixed asset investment is also considered to be one of the influencing factors on CO2 emissions, but there are two opposing views on the direction of this effect [66,67].
This study uses the extended STIRPAT (Stochastic Impacts by Regression on Population, Affluence and Technology) model to analyse the influencing factors of CO2 emissions in order to determine the direct and indirect impact of industrial transfer [68]. Economic development, population, urbanisation, and technological level are the main mediating variables of indirect impact studies. Energy utilisation and fixed asset investment will also be considered as control variables (Figure 1). The contribution of this paper is to study the impact of industrial transfer between cities on CO2 emissions at the regional and prefecture levels and to explore the internal mechanism from two perspectives. The combination of economic development and ecological/environmental problems provides theoretical support and suggestions for implementing low-carbon industrial policies and helps to optimise the industrial spatial pattern and low-carbon development path of the BTH region.

3. Study Area, Methodology and Data

3.1. Study Area

The Beijing-Tianjin-Hebei (BTH) region is located in the eastern part of the North China Plain, and it is also the core of the Bohai rim area. The administrative regions include Beijing, Tianjin and Hebei Province. Relying on the advantages of the capital and its superior geographical location near the sea, the BTH region has become the largest urban agglomeration in northern China. In 2019, the GDP of the BTH region was 84,580.08 trillion yuan, accounting for 8.53% of the national GDP. The total industrial added value was 30.36 trillion yuan, accounting for 9.57% of the national industrial added value. High CO2 emissions accompany rapid economic development. In 2015, the CO2 emissions in the BTH region accounted for approximately 10.03% of the national total, with Hebei contributing the largest amount. From 2002 to 2016, the proportion of Hebei’s CO2 emissions in the BTH region rose from 72% to 86.2%, while Beijing and Tianjin’s share declined [69].
Since the concept of “capital circle” was put forwards in 1982, Beijing, Tianjin and Hebei have shown trends of complementary advantages and coordinated development, and regional cooperation has become one of the important features of the development of the BTH region. The coordinated development of the BTH region is one of China’s three national strategies, and the upgrading of industrial structure, interregional industrial transfer and environmental protection are the key goals. In 2019, secondary industry’s added value in Beijing, Tianjin and Hebei accounted for 16.20%, 35.20% and 38.73% of the GDP, respectively. The economic development and industrialisation of the three provinces are at different stages, and individual cities also have different levels of CO2 emissions. Whether industrial transfer causes a greater degree of CO2 emission imbalance is a problem that needs to be considered in this region. Thirteen cities in the BTH region were studied, including two municipalities (Beijing and Tianjin) and 11 prefecture-level cities (Shijiazhuang, Tangshan, Qinhuangdao, Handan, Xingtai, Langfang, Baoding, Hengshui, Zhangjiakou, Chengde and Cangzhou).

3.2. Research Methods

3.2.1. Shift-Share Method

At present, the methods and models for quantitatively studying the trend and scale of industrial transfer are mainly shift-share analysis [27], the spatial Gini coefficient method [70], and the interregional input-output model [54]. This study uses the shift-share method to measure the scale of industrial transfer. The principle of the shift-share method is to regard the whole region as a reference system and decompose the economic development of the research object in a period into the national growth effect, the industrial mix effect, and the competitive effect. This quantitatively explores the position and competitiveness of the economic sector of the object in the whole region [27]. X i 0 and X i T represent the initial and final industrial added value of city i , respectively; r i and r represent the growth rate of the industrial added value of city i and the BTH region in the study period, respectively; and r g is the growth rate of GDP of the BTH region. The change in the industrial added value of city i in period 0 to T can be expressed as:
Δ X i = X i T X i 0 = X i 0 r i = X i 0 r g + X i 0 ( r r g ) + X i 0 ( r i r )
where X i 0 r g , X i 0 ( r r g ) and X i 0 ( r i r ) represent the national growth effect, the sectoral structure effect and the industrial transfer effect, respectively. This study mainly calculates the industrial transfer effect, indicating the scale of industrial transfer between cities, and positive or negative values represent the transfer in or out, respectively. Based on this method, the industrial transfer scale is the industrial transfer-in scale.
To complete the statistical results, referring to previous studies, this article also takes industrial structure ( N ) as another proxy variable of industrial transfer [26,27], that is, the proportion of industrial added value in GDP.

3.2.2. Estimation of CO2 Emissions

Industrial energy consumption is the most important source of CO2 emissions, followed by residents’ daily energy consumption. In this study, industrial energy consumption data, household energy consumption data and electricity consumption data of all 13 cities were combined to estimate the total amount of CO2 emissions.
This study calculates the CO2 emissions of cities in the BTH region based on the carbon emission coefficient method. According to the Guidelines for National Greenhouse Gas Inventories of the Intergovernmental Panel on Climate Change (IPCC) [71], the CO2 emissions caused by energy consumption can be measured by the sum of each category’s product of energy consumption and its carbon emission coefficient. In this study, coal, coke, natural gas, crude oil, gasoline, kerosene, diesel and fuel oil are selected as the sources of industrial CO2 emissions. Coal gas and liquefied petroleum gas are selected as the sources of household CO2 emissions. The CO2 emissions from electricity are calculated based on the data of the whole society’s electricity consumption. The carbon emission coefficient is the weight of CO2 produced by the complete combustion of energy per unit weight or unit volume, and its calculation method is as follows:
C F j = C L j × C C j × C O j × 44 12
where C F j represents the carbon emission coefficient (kg/kg or kg/m3) of type j energy; C L j , C C j , and C O j represent the average low calorific value (10−6 kJ/kg or 10−6 kJ/m3), carbon content per calorific value (t/TJ) and carbon oxidation rate, respectively. 44/12 is the conversion coefficient of carbon-to-carbon dioxide. The industrial CO2 emissions or household CO2 emissions of city i can be calculated by Equation (3):
C i = j E i j × C F j
j = 1, 2, …, 8. E i j represents the consumption of energy j in city i .
Due to the lack of 23.55% of the industrial energy consumption data in 13 cities from 2002 to 2017 in the statistical yearbook, this study uses the linear fitting method to supplement the missing data by using the city’s annual comprehensive energy consumption data. Comprehensive energy consumption and industrial energy CO2 emissions data have a good linear fitting relationship, significantly correlated at the 0.01 level, and R2 is 0.7873. The linear formula is as follows:
C N = 3.4307 × E
where C N represents industrial energy CO2 emissions, and E is comprehensive energy consumption.
In addition to the total amount of CO2 emissions (CE), CO2 emission intensity (CEI, the ratio of the total amount of CO2 emissions to GDP) and per capita CO2 emissions (PCE) are also used to characterise the spatial and temporal characteristics of CO2 emissions in the BTH region. Based on multiple indicators, CO2 emissions in the BTH region are fully characterised.

3.2.3. Mediating Effect Model

A mediation effect model is adopted to understand industrial transfer’s direct and indirect effects on CO2 emissions. The formula is constructed as follows:
C E = a 1 + b 1 R + j = 1 n d j X j + q 1
M = a 2 + b 2 R + k = 1 m d k X k + q 2
C E = a 3 + b 3 R + c M + l = 1 m d l X l + q 3
where C E is the total amount of CO2 emissions; R represents the industrial transfer scale; M represents the mediating variable; X represents the control variable; b and d respectively represent the regression coefficient of corresponding variables; a represents a constant term, and q is the error term. The mediating variables include per capita GDP ( A ), population ( P ), population urbanisation rate ( U ) and the number of authorised inventions ( T ). The control variables include industrial energy intensity ( E ), fixed asset investment ( F ) and mediators that have not been studied in one specific model.
Equations (5)–(7) represent the total effect of industrial transfer on CO2 emissions, the impact of industrial transfer on mediating variables, and the impact of industrial transfer and mediating variables on CO2 emissions, respectively. b 1 ,   b 3 and b 2 c are the total impact, direct impact and indirect impact of industrial transfer on CO2 emissions, respectively.

3.2.4. Two-Way Fixed Effect Panel Regression

In selecting statistical methods, this study analyses the relationship between industrial transfer and CO2 emissions or mediating variables of the BTH region based on a panel regression model. The panel model can cover both city and time dimensions, including the fixed effect model (FE), the random model (RE) and the pooled regression model (POOL). Before establishing the model, the F test, BP test and Hausman test were used to select the appropriate regression model (Appendix A Table A1). Finally, the FE model was selected for regression. In addition, since most of the explanatory variables and control variables are indicators reflecting social and economic development and have obvious time trends, a time effect is added into the model to control this influence. Finally, a two-way fixed effect panel model including both time and individual is established:
Y i t = β x i t + γ w i t + α i + λ t + ε i t
where i represents the city; t represents the year; x i t , w i t and Y i t represent the explanatory variable, control variable and explained variable, respectively; α i represents the individual effect that does not change with time; λ t represents the time effect that does not change with individuals; and ε i t is the random error term.

3.3. Data Source

The data in this study come from the statistical yearbook of 13 cities, the Hebei Economic Yearbook, China City Statistical Yearbook, and each city’s statistical bulletin. The average low calorific value data are derived from General Rules for Calculation of the Comprehensive Energy Consumption (GB/T 2589–2008). Carbon content per calorific value and carbon oxidation rate data are derived from Provincial Greenhouse Gas Inventory Guidelines (NDRC Climate [2011] No.1041). Appendix B Table A2 presents the descriptive statistics of all variables. Due to space limitations, only 5 years of statistics are listed.

4. Results and Discussion

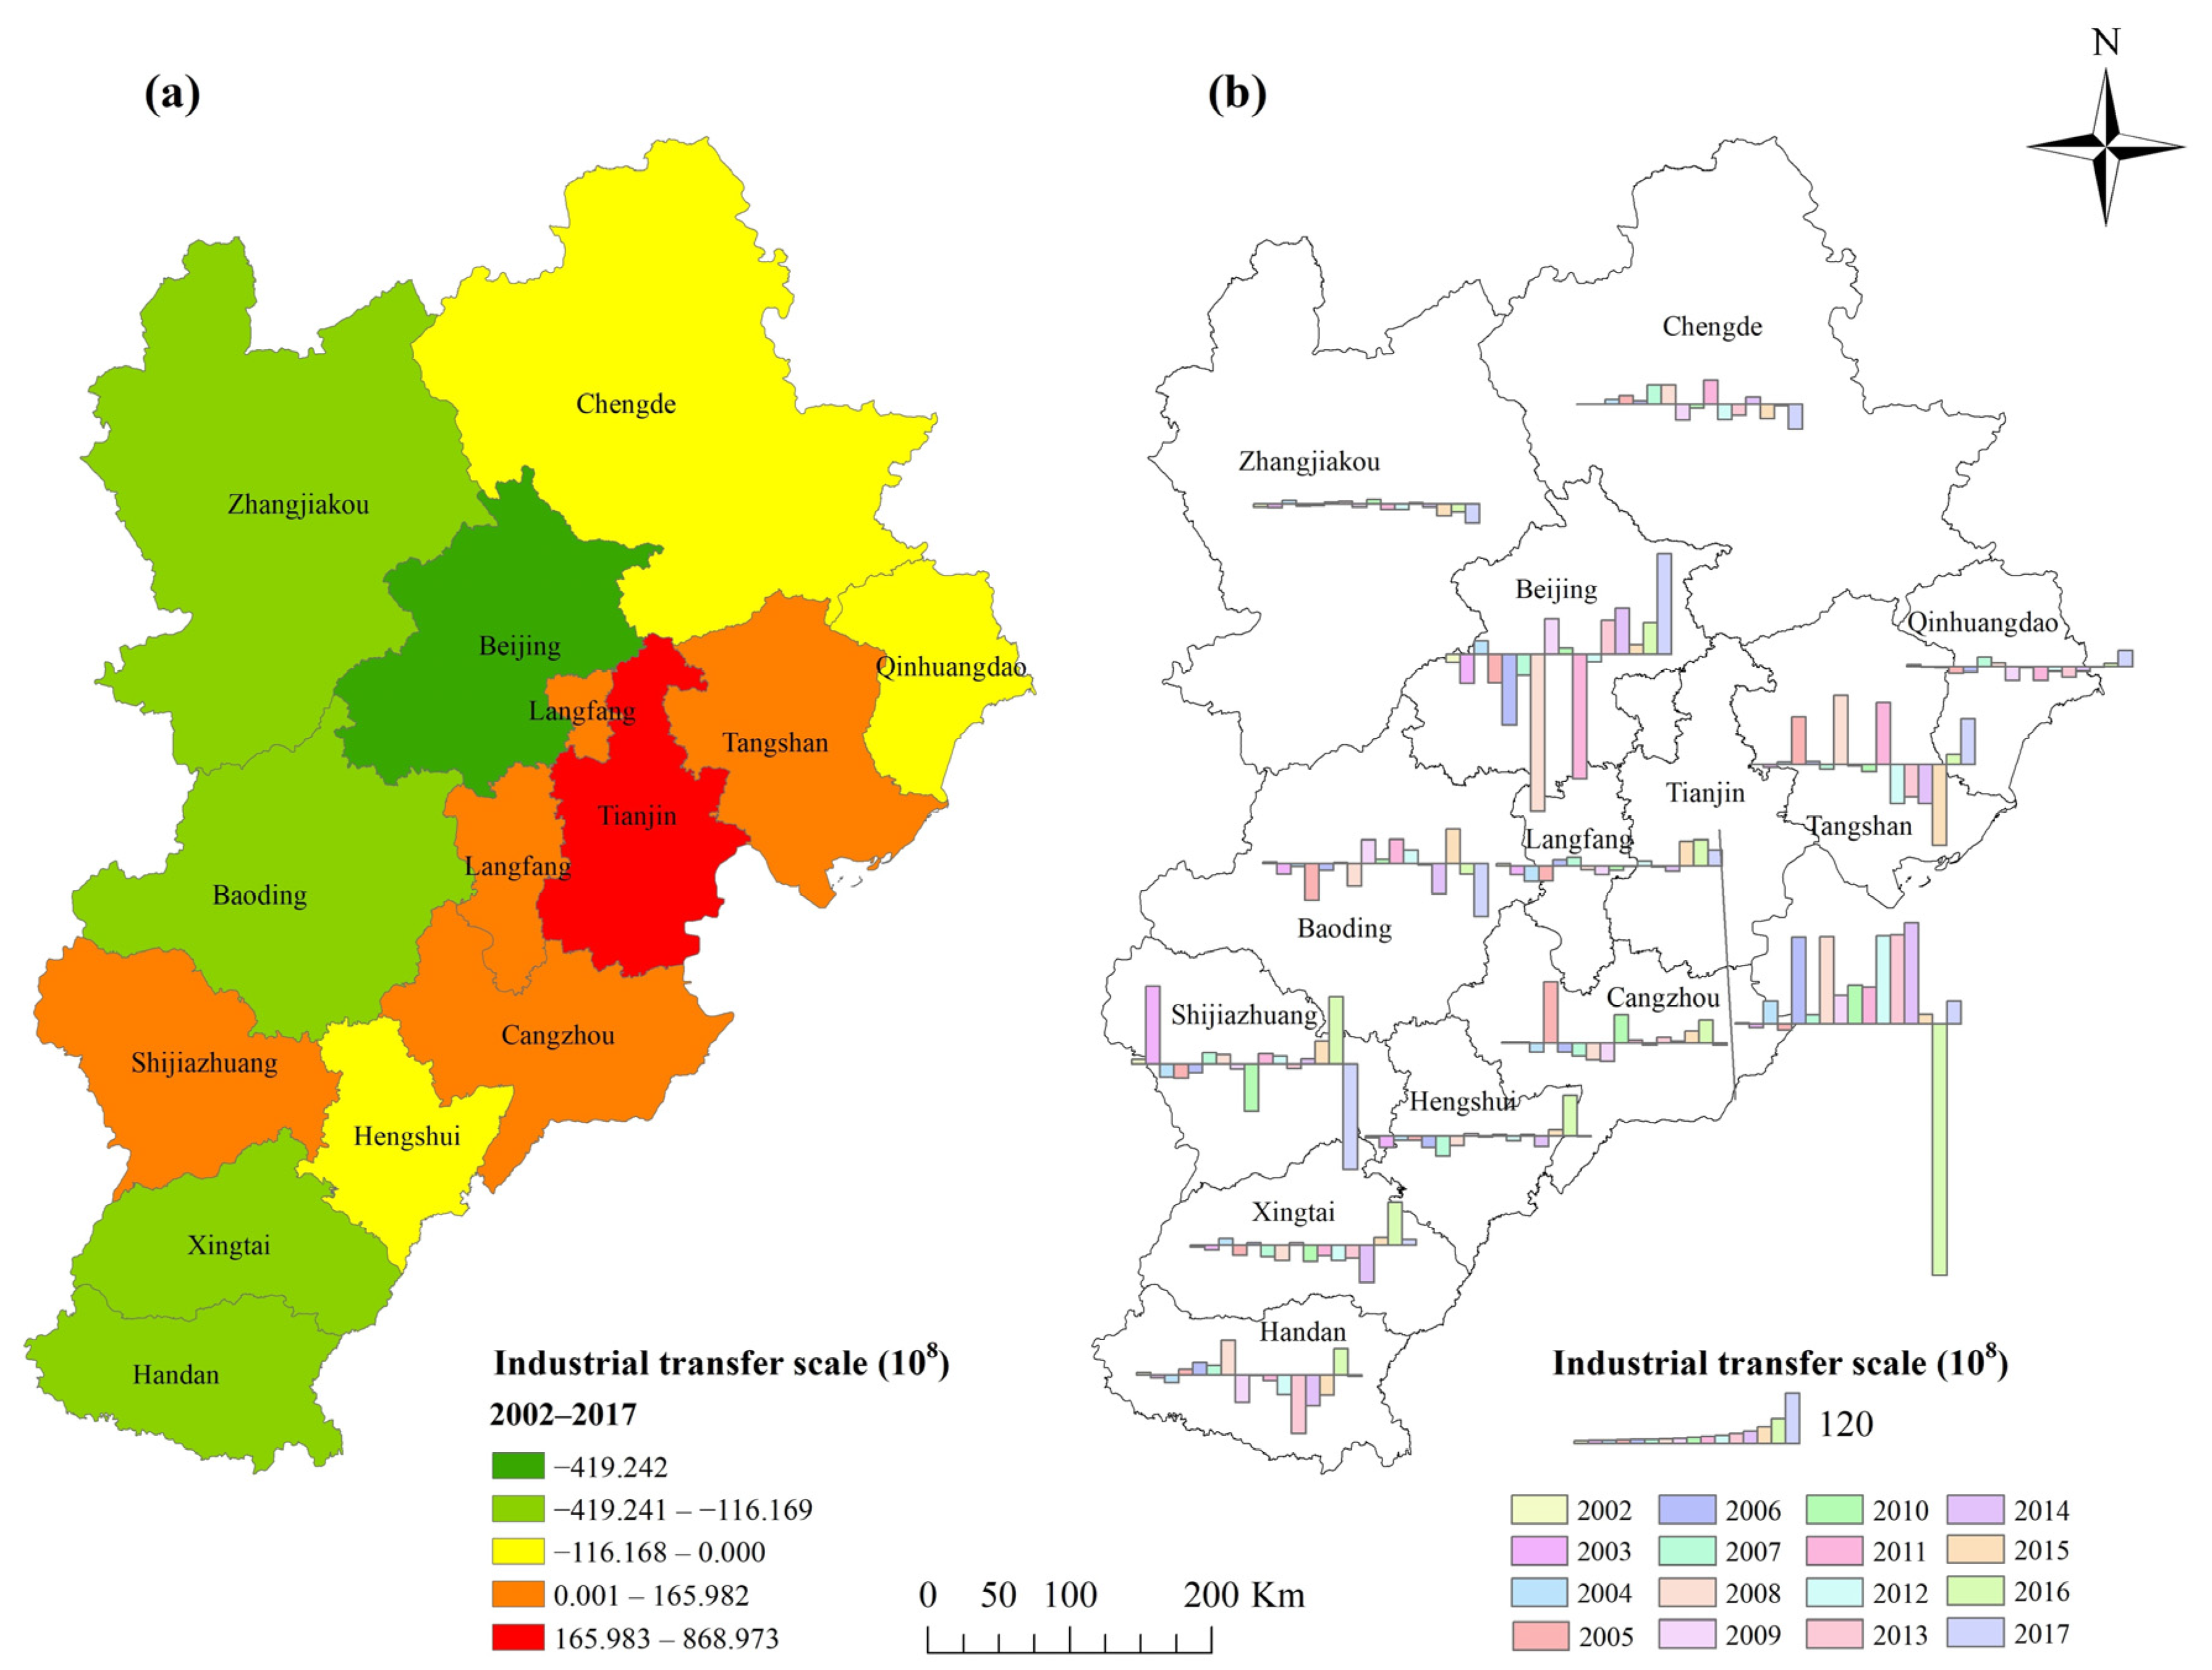
4.1. Spatial and Temporal Characteristics of Industrial Transfer

From 2002 to 2017, the transfer-in cities of the BTH region were Tianjin, Cangzhou, Tangshan, Langfang and Shijiazhuang. The transfer-out cities are Beijing, Handan, Baoding, Xingtai, Zhangjiakou, Qinhuangdao, Hengshui and Chengde (Figure 2a, detailed results are listed in Appendix C Table A3). There is a general tendency for industry to move from the west to the east. Tianjin has the largest scale of industrial transfer-in (86.973 billion yuan), and Beijing has the largest scale of industrial transfer-out (41.242 billion yuan). Opinions on strengthening the construction of key platforms for the industrial transfer of the Beijing-Tianjin-Hebei region propose the establishment of 46 specialised and characteristic industrial receiving platforms, of which 12 are located in Tianjin. Advantages in Tianjin’s natural resources, labour, transportation, investment environment, and technological innovation make it a good candidate to undertake industrial transfer from Beijing [55]. The concentrated period of Beijing’s industrial transfer-out was from 2005 to 2008, and the scale in 2008 rose to 38.324 billion yuan (Figure 2b). The relocation of the Shougang Group became an important reason for the industrial transfer from Beijing to Tangshan from 2005 to 2008. The industrial transfer-in of Beijing and the industrial transfer-out of Tianjin and Tangshan after 2013 may be due to the relative agglomeration of high-tech manufacturing and strategic emerging industries in Beijing.

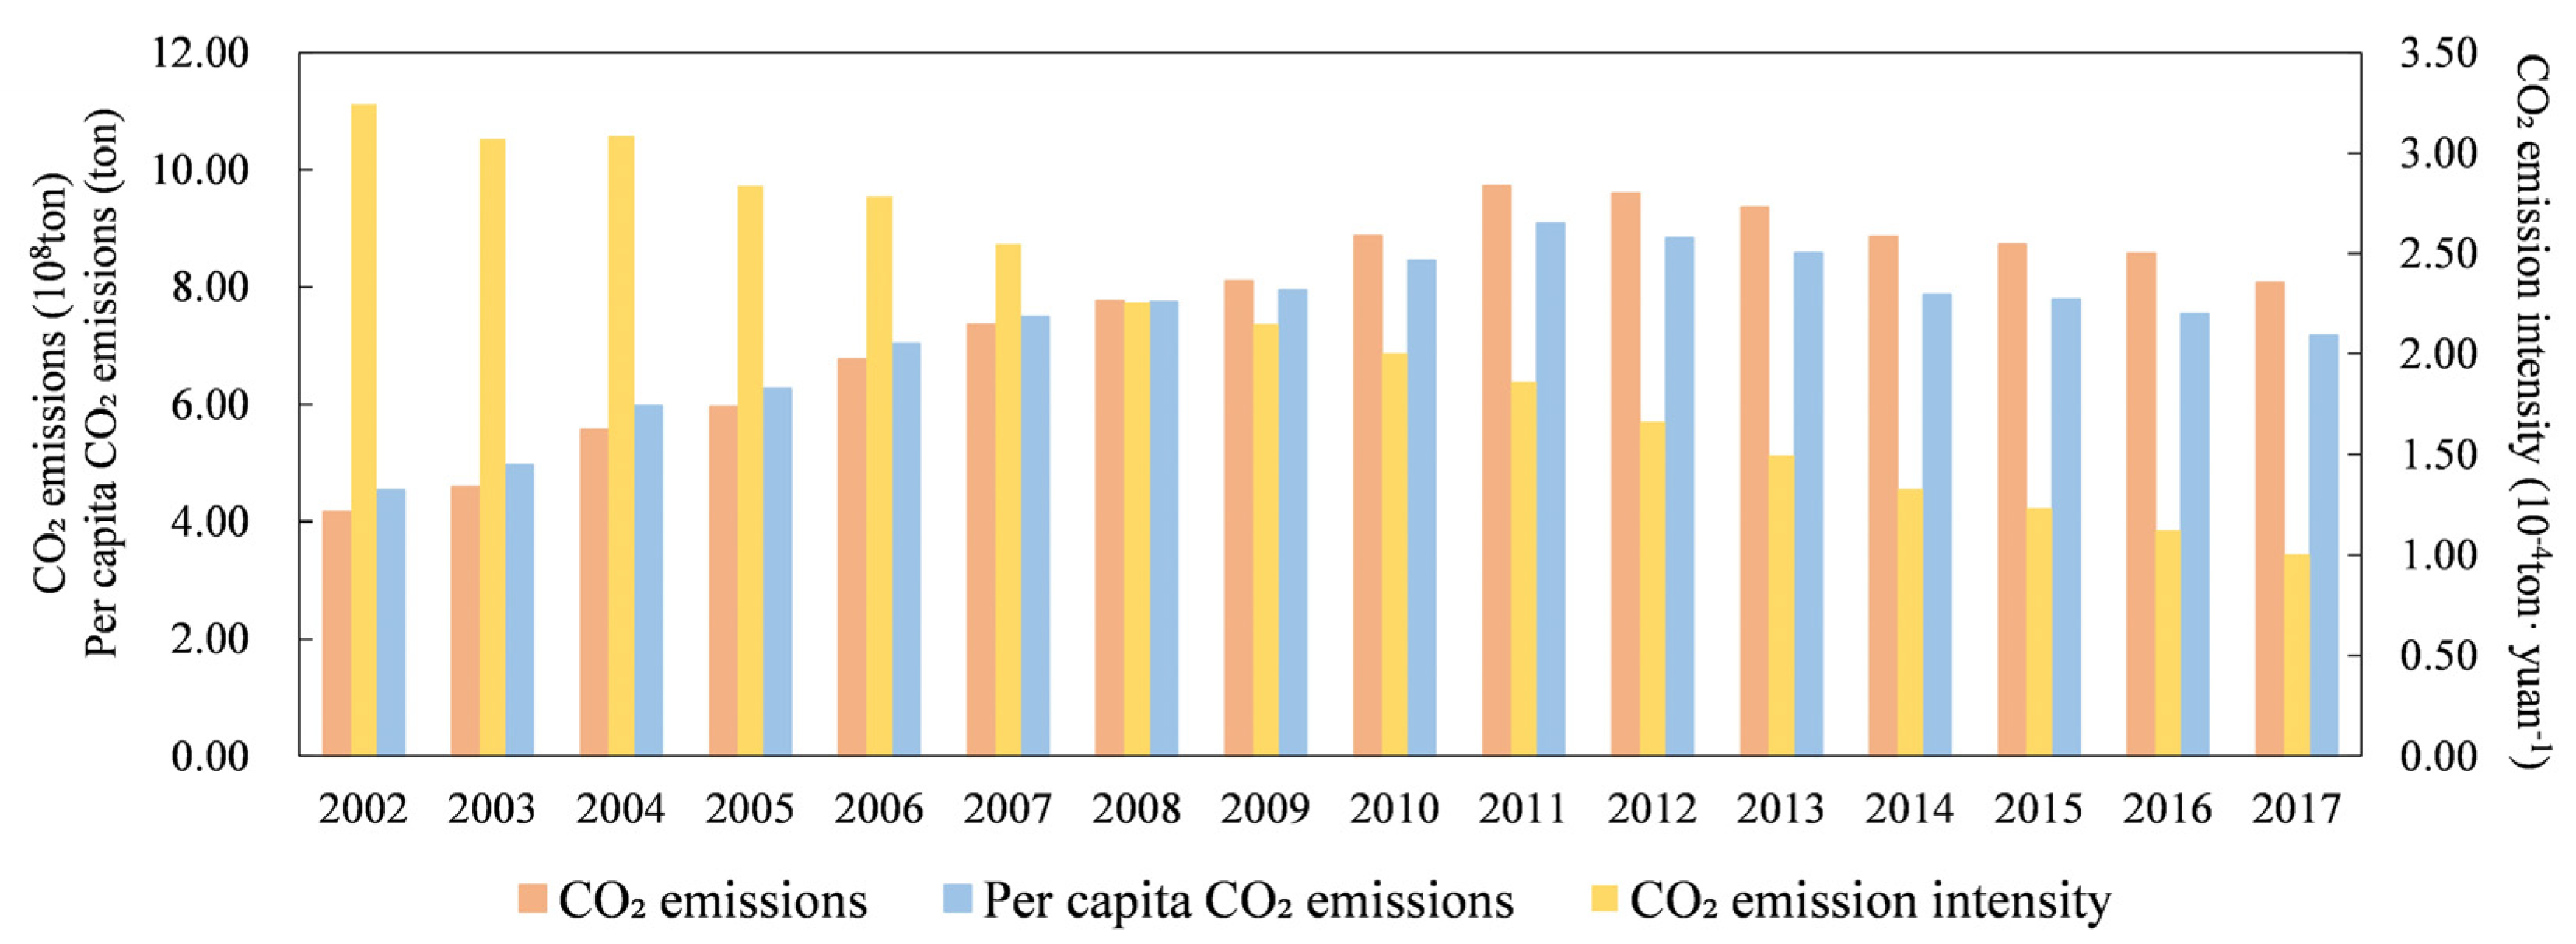
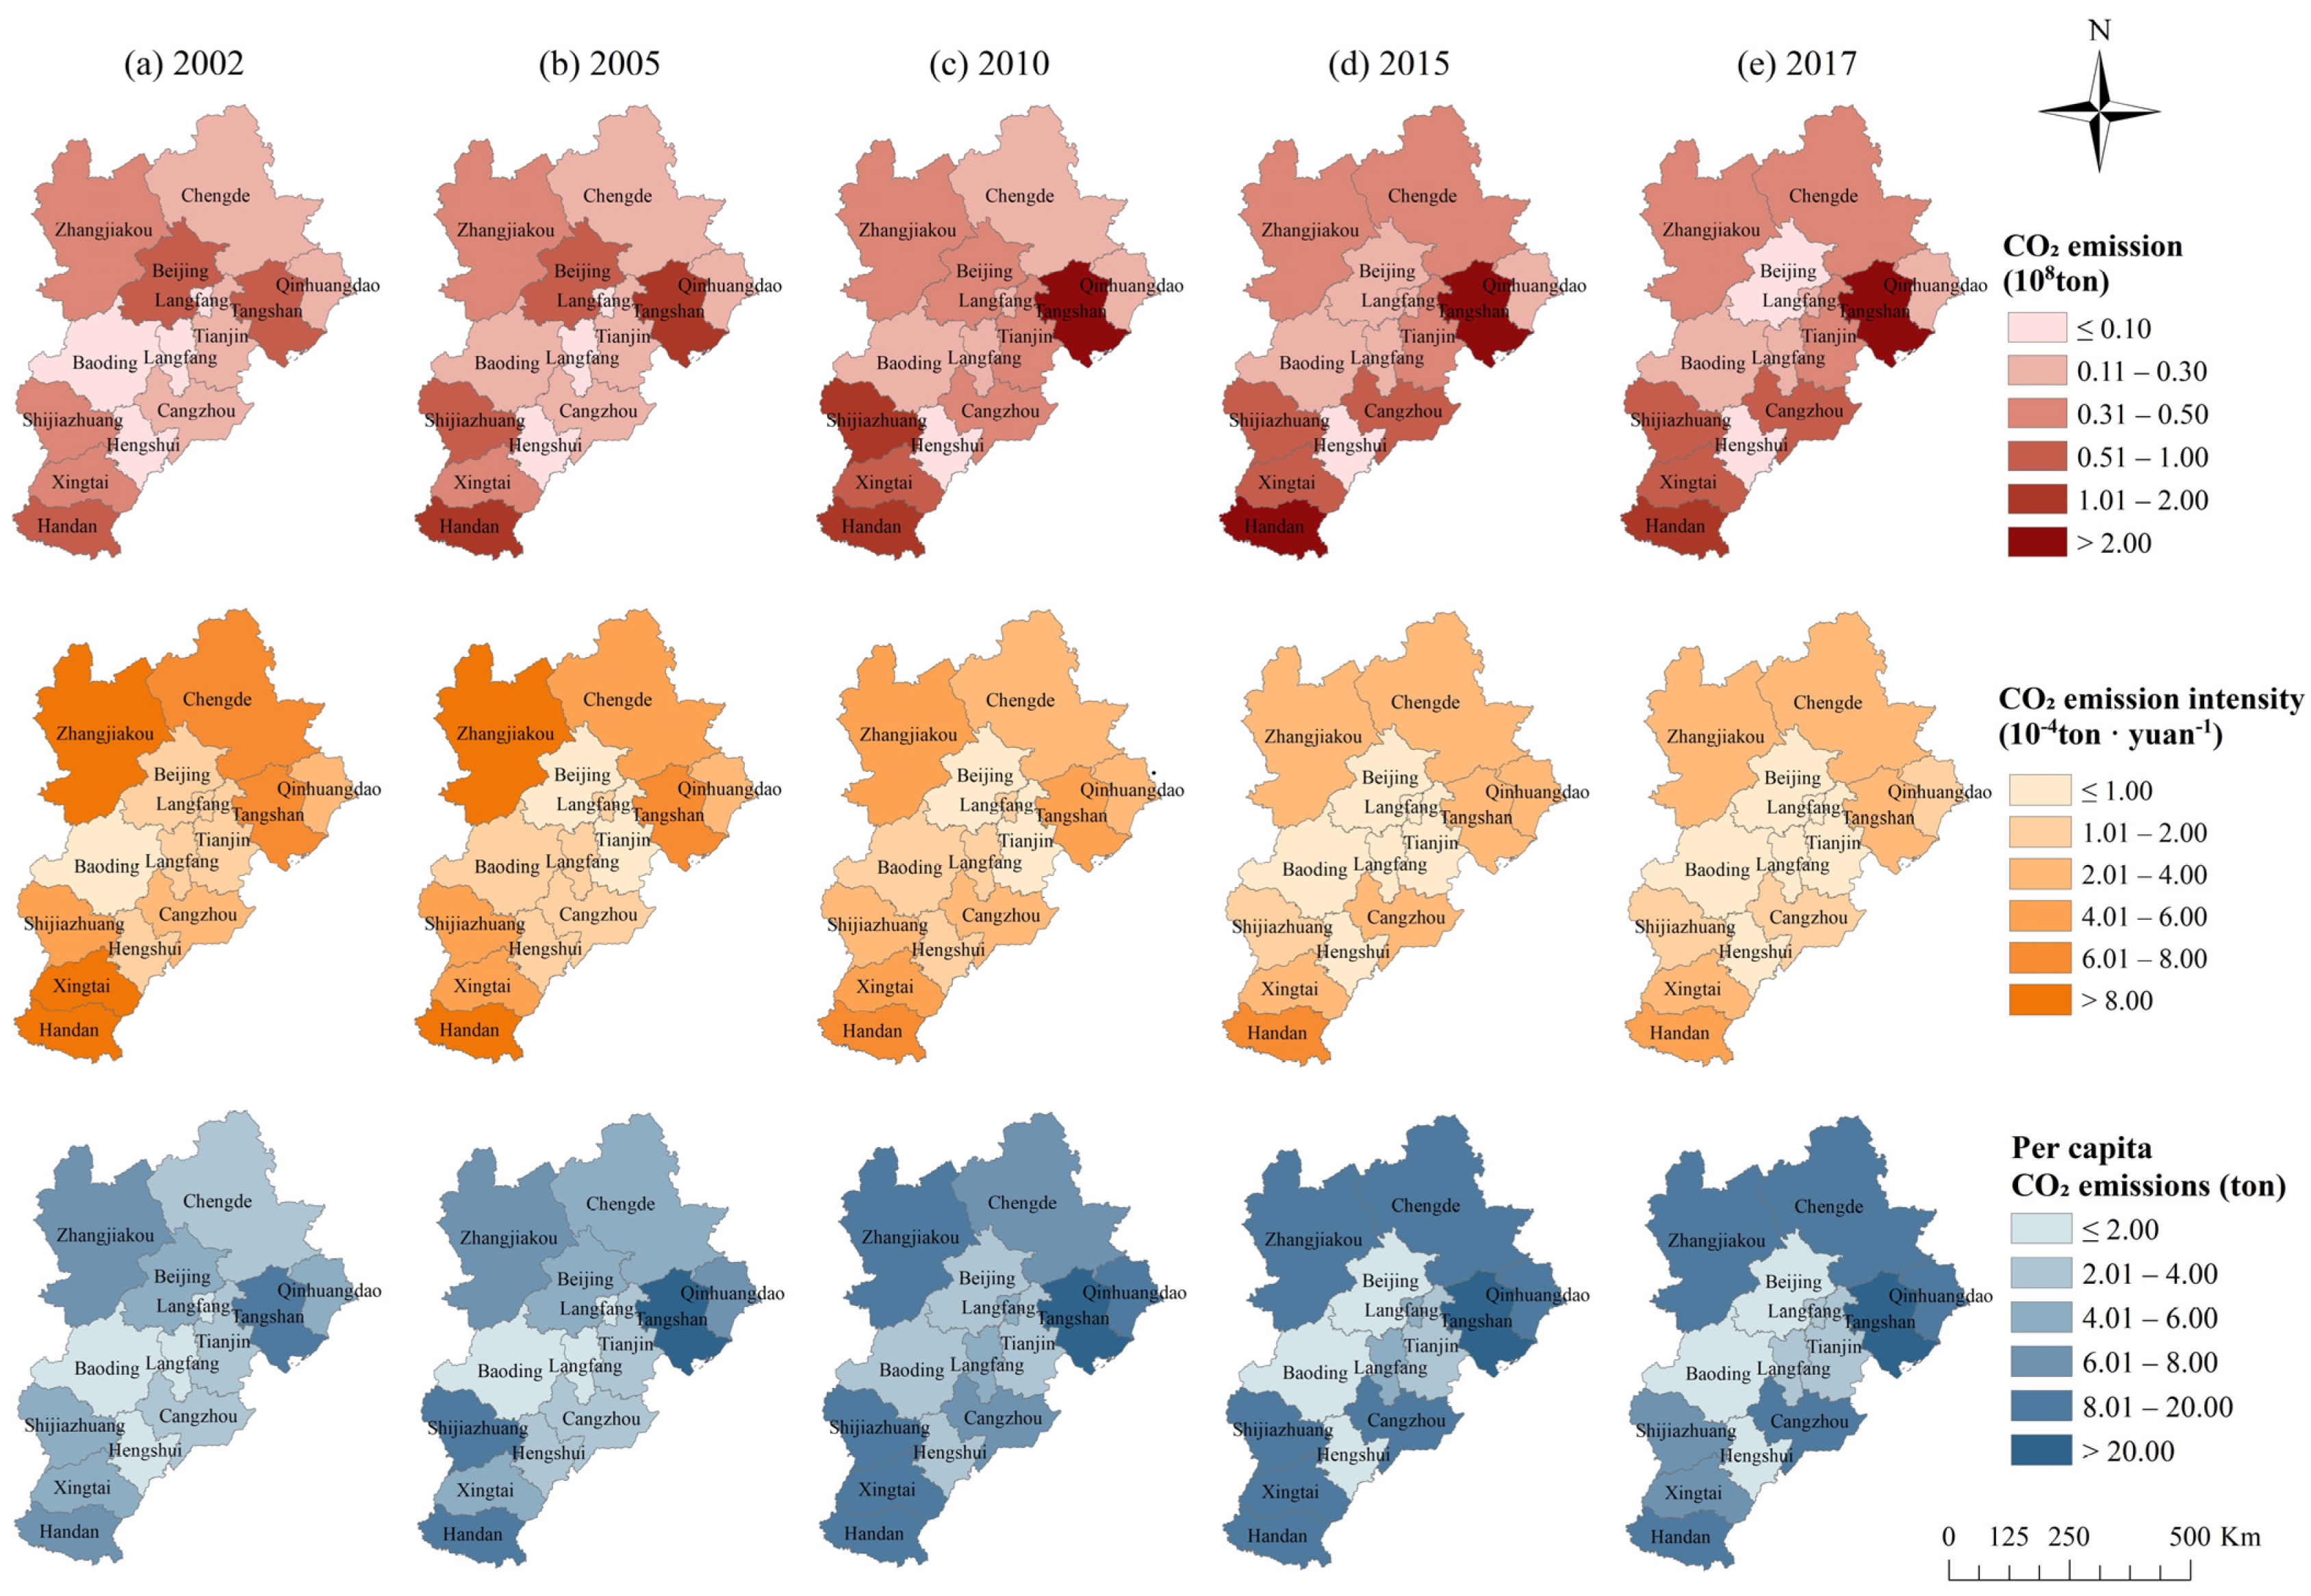
4.2. Spatial and Temporal Characteristics of CO2 Emissions

From 2002–2017, the BTH region achieved remarkable CO2 emission reduction results. The CE and PCE of the BTH region first increased and then decreased during 2002–2017, and both peaked in 2011. CEI shows a downwards trend, indicating that economic growth is faster than CO2 emission growth (Figure 3). The lowest CE was 416 million tons in 2002. The highest was 972 million tons in 2011, which was 2.34 times that in 2002. Since 2011, CE has decreased year by year, dropping to 807 million tons in 2017, 83.02% of the highest value in 2011. CE’s average annual growth rates in the BTH region during 2002–2011, 2011–2017 and 2002–2017 were 8.24%, −3.09% and 4.52%, respectively. The PCE peaked at 9.08 tons/person in 2011 and then declined year by year until 2017 to 7.17 tons/person. The average annual growth rate of the PCE from 2002 to 2017 was 3.10%, which was lower than that of CE. From 2002 to 2017, the CEI in the BTH region decreased from 32,400 tons/100 million yuan to 10,000 tons/100 million yuan, with an overall decrease of 69.14% and an average annual growth rate of −8.15%. The decrease of CEI in the BTH region is similar to that in the Yangtze River Delta, another large urban agglomeration in China [72]. However, compared with the latter, the BTH region has a better emission trend, that is, the CE and PCE both declined after 2011.
Although the overall CO2 emissions of the BTH region are developing towards a better trend, there are still great differences between cities. From 2002 to 2017, CE and PCE showed a decrease in the centre (Beijing) and an increase in the periphery. CEI of 13 cities decreased. The three variables in 2015 and 2017 show the characteristics of a low centre and a high periphery (Figure 4).
The high-value area of CE in the BTH region shifted to Tangshan in the east, Cangzhou in the southeast and Shijiazhuang, Xingtai and Handan in the south, and the gap between cities gradually increased. The CE of Tangshan, Handan and Shijiazhuang have been in the top three of all cities since 2005; in particular, the CE of Tangshan exceeded 250 million tons in 2011–2013, peaking at 269 million tons in 2013. More than half of the cities in the BTH region reached their carbon peak between 2011 and 2014. Beijing, however, had already achieved that goal in 2004. In addition, the difference in CE in each city has gradually increased.
The variation coefficient increased from 78.67% to 105.44% from 2002 to 2017. This is different from the Yangtze River Delta, where the gap in CO2 emissions between different cities narrowed from 2006 to 2016 [73].
The CEI of each city in the BTH region decreased year by year but still showed a pattern of being low in the centre and high in the periphery. The annual CEIs of Zhangjiakou, Chengde, Tangshan, Qinhuangdao in the north and Handan and Xingtai in the south are more than 18,000 tons/billion yuan. The CEIs of Beijing and Baoding, Langfang, Tianjin and Hengshui in the south are lower than those of other cities. The CEIs of Beijing and Tianjin decreased to less than 10,000 tons/million yuan in 2005 and 2003, respectively, and Beijing and Tianjin were the two cities with the lowest CEIs in the BTH region since 2005.
PCEs are low in the centre and high in the periphery, and the gap between the centre and the periphery gradually increases. The variation coefficient of PCE increased from 61.18% to 91.41% in 2002–2017. The PCEs of Tangshan and Handan always ranked first and second among all cities during the study period. In 2013, Tangshan’s PCE was as high as 36.35 tons per person. Beijing, Baoding and Hengshui have been the three cities with the lowest PCE in the BTH region since 2010. Beijing’s PCE in 2017 was only 0.44 tons per person.

4.3. Impact of Industrial Transfer on CO2 Emissions

4.3.1. Result of Unit Root Test

Since this study adopted the panel data of 13 cities for 16 years, the unit root test was carried out on the data before the regression to verify its stability in order to prevent the occurrence of spurious regression. Two unit root tests, the Levin-Lin-Chu (LLC) test based on the common root hypothesis and the augmented Dickey-Fuller (ADF) test based on different root hypotheses, are adopted. Table 2 shows that the adjusted statistics of each variable are significant at the 0.05 and 0.01 levels when the intercept term is set. Each variable rejects the original assumption that there is a unit root; that is, the original data are stable, and regression can be carried out.

4.3.2. Direct and Indirect Impacts of Industrial Transfer on CO2 Emissions

The data are long panel data, so we need to test the intraclass autocorrelation, interclass heteroscedasticity, and cross-sectional correlation for the disturbance items of the model (Appendix D Table A4, the nine models are the same as Models 1 to 9 in Table 3). The P-values of these three statistics are all 0.000, which confirms the existence of intraclass autocorrelation, interclass heteroscedasticity, and cross-sectional correlation. In this study, the feasible generalised least squares method (FGLS) is used to estimate the two-way fixed effect model and to address the three problems.
In general, industrial transfer in the BTH region has a significant positive direct impact on CO2 emissions; that is, transfer-in cities need to bear the CO2 emission pressure of transfer-out cities. Even if this impact is relatively small compared with other control variables (the regression coefficient is only 0.017 (Table 3, Model 9)), the negative effect of industrial transfer cannot be ignored. From a cross-national perspective, Germany’s industrial transfer to emerging countries brings CO2 emission transfer [31]. From a regional perspective, the industrial transfer from eastern China to central and western China also has high embodied CO2 emissions [7].In addition, the promotion effect of the industrial transfer scale on CO2 emissions has weakened over time (Table 4). The influence coefficient of industrial transfer on CO2 emissions is significantly positive in the 2002–2009 period but not significant in the latter period, reflecting the decoupling trend between industrial transfer and CO2 emissions.
Industrial transfer affects CO2 emissions by affecting the economic level, population size, and urbanisation level, but the indirect effect only supplements the dominant direct effect. The direct effect coefficient of industrial transfer on CO2 emissions is 0.017. The indirect effect coefficients of industrial transfer on CO2 emissions by affecting economic development, population size, and urbanisation level are 0.006, −0.002, and 0.002, respectively. Industrial transfer-in can promote the growth of the economy and population, economic growth aggravates CO2 emissions, and population increases curb CO2 emissions. The latter is contrary to the conclusion of most previous studies [47,66]. The impact of industrial transfer-in on urbanisation is significantly negative. This may be due to the insufficient construction of social welfare and facilities in the process of industrial transfer, which failed to attract non-agricultural population transfer [74]. The impact of urbanisation on CO2 emissions is also significantly negative. As a result, the indirect effect of industrial transfer on CO2 emissions is positive, using its influence on urbanisation. The negative impact of population and urbanisation on CO2 emissions shows that urban development’s “quality effect” in the BTH region gradually occupies a dominant position [75]. The floating population floods into the municipal districts of Beijing, Tianjin and Hebei, with obvious agglomeration characteristics [76]. The increase in urban population brings an agglomeration effect and improves production efficiency and energy utilisation efficiency, which helps reduce CO2 emissions. Similar results have been found in case studies of China [77,78], while in some other countries, in South America and South Asia in particular, urbanisation brings about an increase in CO2 emissions [79,80]. How to coordinate the relationship between industrial transfer and population urbanisation is worth further discussion in the future.
Although the technological level has a significant restraining effect on CO2 emissions, it does not serve as a mediating variable between industrial transfer and CO2 emissions; that is, industrial transfer between cities does not improve the technological level. The Guidelines for Industrial Transfer in Beijing, Tianjin and Hebei particularly emphasise the combination of industrial transfer and industrial upgrading and the improvement of innovation capabilities [81]. Still, the statistical results show that the effect of technological upgrading and innovation improvement in the process of industrial transfer is not obvious, and the technology spill-over effect implied by industrial transfer needs to be further explored. This is not consistent with the findings of Dogan et al. that higher levels of industry share in European countries contribute to carbon reduction through access to clean and efficient technologies [82]. In addition, energy intensity and fixed asset investment are also important factors that promote an increase in CO2 emissions.

4.3.3. Impact of Industrial Transfer on CO2 Emissions in Each City

According to the regression results of each city, the proportion of industrial added value in GDP (N), a secondary proxy variable of industrial transfer, has a significant positive impact on the CO2 emissions of more than half of the cities to varying degrees. These cities include Tangshan, Handan, Shijiazhuang, Beijing, Tianjin, Hengshui and Qinhuangdao. Conversely, it has a significant negative impact on Cangzhou’s CO2 emissions (Figure 5). Tangshan is the third-largest industrial transfer-in city in the BTH region and the city with the highest positive impact coefficient of industrial transfer on CO2 emissions. In 2017, Tangshan had the highest proportion of secondary industry, 53.54%, of all cities. Compared with other control variables, industrial transfer has the greatest positive impact on CO2 emissions; that is, large-scale industrial transfer-in is the most important driving force for Tangshan’s CO2 emissions. From 2005 to 2010, the Shougang Group moved from Beijing to the Caofeidian district in Tangshan, increasing Tangshan’s industry volume. In 2005, Tangshan’s steel output was 37,221,200 tons, and in 2010, the figure rose to 68,315,900 tons. The transfer-in of a heavy industry may be an important reason for the increase in CO2 emissions.
Similarly, Tianjin and Shijiazhuang are industrial transfer-in cities, and industrial transfer also positively impacts CO2 emissions. Tianjin is an advanced manufacturing base in China. The large-scale industrial transfer-in promoted an increase in Tianjin’s CO2 emissions. Wang et al. found that Tianjin’s manufacturing industry still relies heavily on resource-intensive industries with high pollution and energy consumption, which restricts industrial transformation to green and low-carbon development [83]. Shijiazhuang is the capital of Hebei Province and received on new energy vehicle and high-end equipment manufacturing industries from Beijing and Tianjin, promoting an increase in CO2 emissions [84].
Among the cities where industrial transfer positively impacts CO2 emissions, Beijing, Handan, Hengshui, and Qinhuangdao are those from which industries transferred out in 2002–2017. Carbon emission reduction has achieved certain results under the status quo of the industrial transfer out from these cities. Beijing is the most developed city in the BTH region, with the lowest CO2 emissions among the 13 cities in recent years. From 2002 to 2017, the proportion of tertiary industry in Beijing was above 70%, increasing year by year, and reached 80.56% in 2017, while the proportion of secondary industry decreased to 19.01%. The transfer-out of Beijing’s industry has contributed to the mitigation of CO2 emissions. As a city with a long history of steel and coal industry, Handan has achieved good results in cutting overcapacity in recent years. In the future, it should maintain this trend and promote the city’s low-carbon development. Compared with Beijing and Handan, the impact coefficient of industrial transfer on Hengshui and Qinhuangdao is smaller.
Cangzhou shows a trend of industrial transfer-in, but it is the only city where industrial transfer suppresses CO2 emissions, which shows that Cangzhou attaches importance to low-carbon and sustainable development in the process of receiving industries. According to the Annual Report on Beijing-Tianjin-Hebei Metropolitan Region Development (2021), the industrial policy advantage of Cangzhou plays an obvious role in promoting the development of key nodes in its industrial chain [85]. This may also include contributions to environmental protection and CO2 emission reduction. In industrial transfer, the two largest projects in Cangzhou are Biomedicine Industrial Park in Bohai New Area and Cangzhou Factory of Beijing-Hyundai Auto, which have received biomedical and automobile industries from Beijing, respectively. Cangzhou pioneered a cross-regional management model in China. The companies that moved from Beijing to Cangzhou only changed their production addresses, but the registered place and supervisor were still Beijing. This allows the transferred industries to maintain a high-level management model, which greatly avoids trading environmental costs for economic benefits [86].
Moreover, the biomedical industry is not a high-carbon industry. The Cangzhou Factory of Beijing-Hyundai Auto is the highest quality and largest industrial collaboration project introduced by Hebei Province since implementing the BTH coordinated development strategy. Cangzhou has strict environmental and technical requirements for the receiving industries. The project builds green factories and logistics, implements green emissions and recycling, and minimises negative impact on the environment [87]. Cangzhou won the award for the “Innovative Case of Beijing-Tianjin-Hebei Coordinated Development” in the BTH Coordinated Development Forum, and the practice of receiving industry was praised as a “Cangzhou phenomenon” by the Evaluation Group of the China Centre for International Economic Exchanges [88]. The case of Cangzhou shows that proactive government policies are beneficial in weakening the negative environmental effects of industrial transfer and facilitating green industrial transformation in China [28].
In addition, economic development positively impacts the CO2 emissions of most cities in the BTH region, among which Tangshan and Xingtai are the most prominent. Population size significantly and positively affects CO2 emissions in Handan, Langfang, Tianjin, Hengshui, and Qinhuangdao. Urbanisation plays a significant role in promoting CO2 emissions in Handan, Hengshui and Zhangjiakou. The technological level promotes CO2 emissions in Tianjin but effectively curbs those in Langfang. Energy intensity has a significant positive impact on CO2 emissions in Tianjin, Beijing, Qinhuangdao and Hengshui, but it negatively impacts Zhangjiakou. Fixed asset investment significantly promotes CO2 emissions in most BTH cities.

5. Conclusions

Whether industrial transfer can promote CO2 emissions has been controversial in previous studies [7,17,20], and more attention has been given to international industrial transfer than to industrial transfer between cities within a country [17]. Different cities in metropolitan areas have similar policy backgrounds and great opportunities for industrial transfer, so the impact of industrial transfer on CO2 emissions needs more academic attention [15]. Previous literature has paid attention to the change in CO2 emissions among regions within a country under the background of industrial transfer, but the relationship between the two has not been quantitatively studied [14,26]. Some literature has studied the relationship between them quantitatively, but there is no more detailed analysis of the mechanism [15,17]. The contribution of this article is to analyse such a relationship at the regional and prefecture levels and to explain the mechanism from the perspective of direct effects and indirect effects. This paper explains the law and mechanism and analyses the heterogeneity of different cities, providing a reference for cities in similar development stages. Specifically, the main conclusions are as follows:
(1) It has been proven that industrial transfer-in positively impacts CO2 emissions, even if this impact is relatively small compared with other social and economic factors. This means that industrial transfer brings carbon emission pressure to receiving locations, while transfer-out locations release such pressure. Similar conclusions have been confirmed in previous studies [7,31]. However, the positive impact of industrial transfer-in on CO2 emissions will gradually decrease over time. In this case, the change in the spatial pattern of CO2 emissions in the BTH region is partly due to industrial transfer between cities, though industrial transfer and CO2 emissions also show a gradual decoupling trend. The positive impact of industrial transfer-in on CO2 emissions in the BTH region was greater in the first eight years than that in the latter eight years.
(2) Industrial transfer indirectly affects CO2 emissions by acting on economic level, population size, and urbanisation level, but the indirect effect only supplements the dominantly direct effect. Economic development plays a positive mediating role between industrial transfer and CO2 emissions. Industrial transfer-in can promote the growth of the economy, thus aggravating CO2 emissions in receiving locations. Industrial transfer-in can also help to increase the populations of receiving places, which leads to a reduction in CO2 emissions probably because of the agglomeration effect. Industrial transfer-in inhibits urbanisation, but the urbanisation rate significantly reduces CO2 emissions. Through urbanisation, the indirect effect of industrial transfer on CO2 emissions is positive. In addition, technological upgrading is a key factor contributing to carbon reduction, but this article did not demonstrate the benefits of industrial transfer-in to technological upgrading. Technological upgrading is not a mediator of industrial transfer in reducing CO2 emissions.
(3) For most cities, industrial transfer-in has a positive effect on CO2 emissions, and industrial transfer-out has a negative one. In this case, Tangshan, Tianjin and Shijiazhuang are industrial transfer-in cities, and Beijing, Handan, Hengshui, and Qinhuangdao are industrial transfer-out cities. Industrial transfer promoted the increase of CO2 emissions in the former and the decrease of CO2 emissions in the latter. However, Cangzhou is an exception, where industrial transfer-in has suppressed CO2 emissions. Actually, Cangzhou provides evidence that a reasonable policy system helps reduce CO2 emissions in the process of industrial transfer-in, and this confirms the effectiveness of environmental regulation [17].
However, this article paid little attention to the possible impacts of industrial heterogeneity due to data limitations, especially differences among different manufacturing sectors. The impacts of the transfer of specific industrial sectors between cities on CO2 emissions is worth further exploration in the future.

6. Implications

The findings have some implications as follows. First, it is good to encourage local firms to upgrade to green technology in the process of industrial transfer-in to alleviate the negative impact of received industries on CO2 emissions. Second, due to the carbon reduction effects of population agglomeration and high-quality urbanisation, it is necessary to encourage industrial and population agglomeration under the situation of industrial transfer-in for a city. Third, it suggests attention must be paid to the construction of public facilities and welfare guarantees during industrial transfer, which are beneficial for carbon emission reduction.

Author Contributions

Conceptualization, J.Y., H.Z. and F.Y.; methodology, data curation and formal analysis, J.Y.; writing—original draft preparation, J.Y.; writing—review and editing, H.Z., J.Y. and F.Y.; visualization, J.Y.; supervision, H.Z.; project administration, H.Z.; funding acquisition, H.Z. All authors have read and agreed to the published version of the manuscript.

Funding

This research was funded by the National Key R&D Program of China, grant number 2017YFA0603602.

Data Availability Statement

We got the energy and economic data from the statistical yearbook of 13 cities, the Hebei Economic Yearbook, China City Statistical Yearbook, and each city’s statistical bulletin.

Acknowledgments

We appreciate the three anonymous reviewers for their valuable comments and to the editors for their help during the process of reviewing and publishing.

Conflicts of Interest

The authors declare no conflict of interest.

Appendix A

Table A1. Results of panel model test.
Test TypeModels of ComparisonTest ValueType of ModelTest ValueType of ModelTest ValueType of Model
Model 1Model 2Model 3
F testFE and POOLF (12,189) = 86.023 ***FEF (12,189) = 60.058 ***FEF (12,189) = 45.743 ***FE
BP testRE and POOLχ2(1) = 876.000 ***REχ2(1) = 852.082 ***REχ2(1) = 492.444 ***RE
Hausman testFE and REχ2(6) = 48.287 ***FEχ2(6) = 18.402 ***FEχ2(6) = 6.117 ***RE
Model 4Model 5Model 6
F testFE and POOLF (12,189) = 269.779 ***FEF (12,189) = 105.734 ***FEF (12,189) = 281.541 ***FE
BP testRE and POOLχ2(1) = 677.717 ***REχ2(1) = 929.896 ***REχ2(1) = 619.571 ***RE
Hausman testFE and REχ2(6) = 21.644 ***FEχ2(6) = 13.881 **FEχ2(6) = 324.899 ***FE
Model 7Model 8Model 9
F testFE and POOLF (12,189) = 51.025 ***FEF (12,189) = 1.988 **FEF (12,188) = 50.624 ***FE
BP testRE and POOLχ2(1) = 400.080 ***REχ2(1) = 1.974POOLχ2(1) = 408.581 ***RE
Hausman testFE and REχ2(6) = 50.658 ***FEχ2(6) = 24.193 ***FEχ2(7) = 42.454 ***FE
Note: Detailed variables of each model are shown in Table 3; ** Denotes significance at the level of 5%; *** Denotes significance at the level of 1%.

Appendix B

Table A2. Descriptive statistics of variables.
VariableMeaningUnitYearMinMedianMaxMeanStd. Dev.
CCO2 emissions100 million ton20020.050.230.800.320.25
20050.080.301.540.460.43
20100.090.412.260.680.65
20150.080.392.440.670.71
20170.080.412.320.620.65
CEICarbon emission intensity10−4 ton·yuan−120020.943.3612.264.733.60
20050.773.959.954.022.90
20100.352.637.872.982.15
20150.072.046.472.101.75
20170.031.835.261.811.47
PCEPer capita carbon emissionston20020.724.1710.174.432.71
20051.864.6021.256.265.30
20102.126.7529.808.977.58
20150.818.4332.298.848.27
20170.447.8229.348.407.67
RScale of industrial transfer100 million yuan2002−20.432.5110.430.007.46
2005−90.26−15.27150.070.0064.11
2010−116.15−2.3294.120.0047.82
2015−196.0919.6683.240.0067.51
2017−257.89−0.33245.150.00113.67
NProportion of industrial added value in GDP%200223.4943.8749.1239.848.32
200523.8845.7953.0744.757.86
201019.5145.4753.5943.238.57
201515.6740.3350.7538.518.39
201715.2636.9151.0236.188.50
TNumber of authorised inventions/20027.0019.00933.0094.46252.98
20056.0037.003279.00334.46904.06
20104.0072.0010,393.001004.002860.75
201557.00290.0032,765.003134.858973.60
201781.00432.0045,970.004377.2312,589.13
PPopulation104 person2002270.00677.421423.00705.52324.26
2005279.00684.751538.00731.15349.04
2010299.01714.331961.00807.38447.38
2015295.60755.002171.00861.05511.13
2017311.08755.492171.00865.19514.42
Aper capita GDPyuan20020.540.853.091.190.70
20050.951.544.641.841.12
20101.703.087.363.501.91
20152.424.2310.915.112.86
20172.684.8212.905.723.22
UUrbanisation rate%200224.3732.2278.5639.0816.39
200531.8337.7783.6244.3215.52
201038.1945.1785.9650.0214.68
201546.6452.2086.5156.4812.62
201750.6055.9286.4559.6811.30
FInvestment in fixed assets100 million yuan200284.09173.861814.30346.82460.97
2005165.00354.522595.41640.82645.42
2010476.411448.096252.222022.131760.84
2015892.402754.0011,814.573708.102977.15
2017890.502663.9211,274.694009.612950.20
EIndustrial energy intensity10−4 tce·yuan−120020.183.1710.053.902.72
20050.872.655.422.581.53
20100.581.842.761.580.79
20150.351.202.601.330.77
20170.391.112.471.270.78

Appendix C

Table A3. Industrial transfer scale of 13 cities in 2002–2017.
YearBeijingTianjinShijiazhuangTangshanQinhuangdaoHandanXingtaiBaodingZhangjiakouChengdeCangzhouLangfangHengshui
2002−20.432.5910.430.454.135.73−4.053.07−6.94−0.782.516.88−3.59
2003−71.25−9.36189.33−6.80−1.61−7.80−11.67−26.65−7.44−0.742.64−20.37−28.28
200432.7654.96−31.745.71−3.18−18.7916.56−6.878.9211.75−22.90−37.25−9.93
2005−70.30−15.74−33.81116.30−15.2714.11−24.63−90.26−4.6620.70150.07−36.21−10.31
2006−173.10210.98−21.847.34−12.7429.956.80−17.28−2.787.38−22.4315.79−28.08
2007−50.9022.5526.42−11.1123.4123.56−27.221.883.9545.33−31.3721.90−48.40
2008−383.24211.6822.52168.499.2084.15−37.17−55.526.7545.92−40.96−9.19−22.64
200986.4569.25−12.29−3.30−33.67−65.626.1557.65−6.13−39.75−44.16−20.565.99
201014.5194.12−116.15−16.77−3.19−1.92−39.059.9511.41−10.4669.97−10.09−2.32
2011−304.3889.0424.51150.59−33.50−13.83−25.7858.36−12.3657.577.15−0.973.61
2012−19.66213.6218.66−95.19−10.80−48.86−37.3933.28−11.82−37.80−4.1411.74−11.62
201382.75215.83−10.32−78.00−24.93−143.01−31.38−3.412.90−27.1914.12−1.444.07
2014111.74245.3211.94−95.15−10.49−74.38−91.68−74.83−5.9617.044.54−12.72−25.38
201523.3123.2354.72−196.09−1.79−50.1819.6683.24−27.45−35.5329.7561.0516.10
201677.34−614.32162.9025.627.6464.22105.59−26.13−18.72−4.2756.1564.3499.64
2017245.1555.24−257.89110.7839.39−4.3215.04−129.38−45.84−62.05−4.9739.19−0.33
2002–2017−409.76874.6539.7591.00−72.50−205.41−158.21−195.19−114.94−16.03149.1881.57−64.11
Unit: 100 million yuan.

Appendix D

Table A4. Results of the autocorrelation test, heteroscedasticity test and cross-sectional correlation test.
F Statistic of
Autocorrelation Test
Chi-Square Statistics of
Heteroscedasticity Test
Chi-Square Statistics of
Cross-Sectional Correlation Test
Model 142.516 ***3503.130 ***192.204 ***
Model 282.642 ***749.36 ***287.809 ***
Model 359.170 ***2183.24 ***342.574 ***
Model 414.799 ***1793.75 ***534.864 ***
Model 559.263 ***1098.61 ***254.078 ***
Model 656.522 ***251.98 ***234.195 ***
Model 750.920 ***1168.08 ***227.528 ***
Model 8174.901 ***6339.56 ***133.724 ***
Model 950.955 ***1122.05 ***217.174 ***
Note: *** Denotes significance at the level of 1%.

References

  1. World Meteorological Organization (WMO). WMO Greenhouse Gas Bulletin (GHG Bulletin)-No. 16: The State of Greenhouse Gases in the Atmosphere Based on Global Observations through 2019; WMO: Geneva, Switzerland, 2020. [Google Scholar]
  2. Zhang, N.; Yu, K.; Chen, Z. How Does Urbanization Affect Carbon Dioxide Emissions? A Cross-Country Panel Data Analysis. Energy Policy 2017, 107, 678–687. [Google Scholar] [CrossRef]
  3. The Paris Agreement. Available online: https://unfccc.int/process-and-meetings/the-paris-agreement/the-paris-agreement (accessed on 16 December 2021).
  4. Böhringer, C.; Rosendahl, K.E.; Storrøsten, H.B. Robust Policies to Mitigate Carbon Leakage. J. Public Econ. 2017, 149, 35–46. [Google Scholar] [CrossRef]
  5. Fei, R.; Pan, A.; Wu, X.; Xie, Q. How GVC Division Affects Embodied Carbon Emissions in China’s Exports? Environ. Sci. Pollut. Res. 2020, 27, 36605–36620. [Google Scholar] [CrossRef]
  6. Akbostanci, E.; Tunç, G.İ.; Türüt-Aşik, S. Pollution Haven Hypothesis and the Role of Dirty Industries in Turkey’s Exports. Environ. Dev. Econ. 2007, 12, 297–322. [Google Scholar] [CrossRef] [Green Version]
  7. Li, Y.-Y.; Li, H. China’s Inter-Regional Embodied Carbon Emissions: An Industrial Transfer Perspective. Environ. Sci. Pollut. Res. 2021, 2021, 1–14. [Google Scholar] [CrossRef] [PubMed]
  8. Zhang, K.; Wang, X. Pollution Haven Hypothesis of Global CO2, SO2, NOx—Evidence from 43 Economies and 56 Sectors. Int. J. Environ. Res. Public Health 2021, 18, 6552. [Google Scholar] [CrossRef] [PubMed]
  9. Li, Y.; Hewitt, C.N. The Effect of Trade between China and the UK on National and Global Carbon Dioxide Emissions. Energy Policy 2008, 36, 1907–1914. [Google Scholar] [CrossRef]
  10. Shui, B.; Harriss, R.C. The Role of CO2 Embodiment in US–China Trade. Energy Policy 2006, 34, 4063–4068. [Google Scholar] [CrossRef]
  11. Huichao, Y.; Limao, W. Carbon Emission Transfer by International Trade: Taking the Case of Sino—U.S. Merchandise Trade as an Example. J. Resour. Ecol. 2010, 1, 155–163. [Google Scholar] [CrossRef]
  12. Peters, G.P.; Hertwich, E.G. CO2 Embodied in International Trade with Implications for Global Climate Policy. Environ. Sci. Technol. 2008, 42, 1401–1407. [Google Scholar] [CrossRef] [Green Version]
  13. Eskeland, G.S.; Harrison, A.E. Moving to Greener Pastures? Multinationals and the Pollution Haven Hypothesis. J. Dev. Econ. 2003, 70, 1–23. [Google Scholar] [CrossRef] [Green Version]
  14. Zhang, T.; Chen, L.Q.; Wang, R.; Wang, B.Y.; Liu, Y.Q.; Liu, W.Q.; Wang, J.; Wen, M.X. The Influencing Factors of Industrial Carbon Emissions in the Context of Undertaking Industrial Transfer in Anhui Province, China. Appl. Ecol. Environ. Res. 2019, 17, 4205–4227. [Google Scholar] [CrossRef]
  15. Wang, S.; Tian, S.; Cai, Q.; Wu, H.; Wu, C. Driving factors and carbon transfer of industrial carbon emissions in Guangdong province under the background of industrial transfer. Geogr. Res. 2021, 40, 2606–2622. (In Chinese) [Google Scholar]
  16. Xiao, Y.; Wan, Z.; Liu, H. An Empirical Study of Carbon Emission Transfer and Carbon Leakage in Regional Industrial Transfer in China: Analysis Based on Inter-regional Input-output Model in 2002 and 2007. J. Financ. Econ. 2014, 40, 75–84. (In Chinese) [Google Scholar] [CrossRef]
  17. Wang, Y.; Wang, X.; Chen, W.; Qiu, L.; Wang, B.; Niu, W. Exploring the Path of Inter-Provincial Industrial Transfer and Carbon Transfer in China via Combination of Multi-Regional Input–Output and Geographically Weighted Regression Model. Ecol. Indic. 2021, 125, 107547. [Google Scholar] [CrossRef]
  18. Yue, S. China and Southeast Asia in the Fifth International Industrial Transfer: Comparative Advantages and Policy Options. Southeast Asian Stud. 2021, 4, 1–26. (In Chinese) [Google Scholar] [CrossRef]
  19. Antweiler, W.; Copeland, B.R.; Taylor, M.S. Is Free Trade Good for the Environment? Am. Econ. Rev. 2001, 91, 877–908. [Google Scholar] [CrossRef] [Green Version]
  20. Chen, L.; Li, Y. Pollution Transfer in the International Trade: A Case Study. Fresenius Environ. Bull. 2020, 29, 364–369. [Google Scholar]
  21. Wu, J.; Cui, C.; Mei, X.; Xu, Q.; Zhang, P. Migration of Manufacturing Industries and Transfer of Carbon Emissions Embodied in Trade: Empirical Evidence from China and Thailand. Environ. Sci. Pollut. Res. 2021, 2021, 1–13. [Google Scholar] [CrossRef] [PubMed]
  22. Zhong, Z.; Guo, Z.; Zhang, J. Does the Participation in Global Value Chains Promote Interregional Carbon Emissions Transferring via Trade? Evidence from 39 Major Economies. Technol. Forecast. Soc. Chang. 2021, 169, 120806. [Google Scholar] [CrossRef]
  23. Han, M.; Yao, Q.; Liu, W.; Dunford, M. Tracking Embodied Carbon Flows in the Belt and Road Regions. J. Geogr. Sci. 2018, 28, 1263–1274. [Google Scholar] [CrossRef] [Green Version]
  24. Xiang, J.; Chen, L. Coupling Mechanism and Coordinated Development of Industrial Transfer and Intensive Land Use: Taking Wanjiang Demonstration Area as an Example. Issues Agric. Econ. 2012, 33, 61–65. (In Chinese) [Google Scholar] [CrossRef]
  25. Zhang, W.; Xu, H. Effects of Land Urbanization and Land Finance on Carbon Emissions: A Panel Data Analysis for Chinese Provinces. Land Use Policy 2017, 63, 493–500. [Google Scholar] [CrossRef] [Green Version]
  26. Chen, L.; Xu, L.; Yang, Z. Accounting Carbon Emission Changes under Regional Industrial Transfer in an Urban Agglomeration in China’s Pearl River Delta. J. Clean. Prod. 2017, 167, 110–119. [Google Scholar] [CrossRef]
  27. Liu, Y.; Dong, F. How Industrial Transfer Processes Impact on Haze Pollution in China: An Analysis from the Perspective of Spatial Effects. Int. J. Environ. Res. Public Health 2019, 16, 423. [Google Scholar] [CrossRef] [PubMed] [Green Version]
  28. Deng, B.; Affolderbach, J.; Deutz, P. Industrial Restructuring through Eco-Transformation: Green Industrial Transfer in Changsha–Zhuzhou–Xiangtan, Hunan Province. Sustainability 2020, 12, 6945. [Google Scholar] [CrossRef]
  29. Fu, S.; Ma, Z.; Ni, B.; Peng, J.; Zhang, L.; Fu, Q. Research on the Spatial Differences of Pollution-Intensive Industry Transfer under the Environmental Regulation in China. Ecol. Indic. 2021, 129, 107921. [Google Scholar] [CrossRef]
  30. Mao, G.; Jin, W.; Zhu, Y.; Mao, Y.; Hsu, W.-L.; Liu, H.-L. Environmental Pollution Effects of Regional Industrial Transfer Illustrated with Jiangsu, China. Sustainability 2021, 13, 12128. [Google Scholar] [CrossRef]
  31. Li, R.; Wang, Q.; Liu, Y.; Yang, X. How Can Germany Reduce Production-Based and Consumption-Based Carbon Emissions? A Decomposition Analysis. Carbon Manag. 2021, 12, 335–357. [Google Scholar] [CrossRef]
  32. Shi, K.; Yu, B.; Zhou, Y.; Chen, Y.; Yang, C.; Chen, Z.; Wu, J. Spatiotemporal Variations of CO2 Emissions and Their Impact Factors in China: A Comparative Analysis between the Provincial and Prefectural Levels. Appl. Energy 2019, 233–234, 170–181. [Google Scholar] [CrossRef]
  33. Dong, B.; Xu, Y.; Fan, X. How to Achieve a Win-Win Situation between Economic Growth and Carbon Emission Reduction: Empirical Evidence from the Perspective of Industrial Structure Upgrading. Environ. Sci. Pollut. Res. 2020, 27, 43829–43844. [Google Scholar] [CrossRef]
  34. Lee, E.S. A Theory of Migration. Demography 1966, 3, 47–57. [Google Scholar] [CrossRef]
  35. Zhang, Q.; An, Z.; An, P. Analysis on the Development Path of China’s Urbanization Based on Industrial Transfer and Industrial Clusters. In Proceedings of the 2017 International Conference on Information, Computer and Education Engineering (ICICEE 2017), Beihua University, Jilin, China, 11–12 November 2017; DEStech: Lancaster, CA, USA, 2017; pp. 572–576. [Google Scholar] [CrossRef] [Green Version]
  36. Chen, H.; Pan, J.; Xiao, W. Chinese Outward Foreign Direct Investment and Industrial Upgrading from the Perspective of Differences among Countries. China World Econ. 2020, 28, 1–28. [Google Scholar] [CrossRef]
  37. Zhang, Y.-J.; Da, Y.-B. The Decomposition of Energy-Related Carbon Emission and Its Decoupling with Economic Growth in China. Renew. Sustain. Energy Rev. 2015, 41, 1255–1266. [Google Scholar] [CrossRef]
  38. CO2 Emissions|Energy Economics|Home. Available online: https://www.bp.com/en/global/corporate/energy-economics/statistical-review-of-world-energy/co2-emissions.html (accessed on 16 June 2021).
  39. Xi Jinping Delivers an Important Speech at the General Debate of the 75th UN General Assembly. Available online: http://www.gov.cn/xinwen/2020-09/22/content_5546168.htm (accessed on 16 December 2021).
  40. Xi jinping Delivered a Written Speech at the 26th World Leaders’ Summit of the Conference of the Parties (COP26) of the United Nations Framework Convention on Climate Change. Available online: http://www.cppcc.gov.cn/zxww/2021/11/02/ARTI1635812919222103.shtml (accessed on 16 December 2021).
  41. Liu, Z.; Guan, D.; Moore, S.; Lee, H.; Su, J.; Zhang, Q. Steps to China’s Carbon Peak. Nature 2015, 522, 279–281. [Google Scholar] [CrossRef] [Green Version]
  42. Xin-gang, Z.; Fan, L. Spatial Distribution Characteristics and Convergence of China’s Regional Energy Intensity: An Industrial Transfer Perspective. J. Clean. Prod. 2019, 233, 903–917. [Google Scholar] [CrossRef]
  43. The Coordinated Development of Beijing, Tianjin and Hebei (1986–2018). Available online: http://www.hebeidangshi.gov.cn/article/20190311/2-2019-11482.html (accessed on 16 November 2021).
  44. Simbi, C.H.; Lin, J.; Yang, D.; Ndayishimiye, J.C.; Liu, Y.; Li, H.; Xu, L.; Ma, W. Decomposition and Decoupling Analysis of Carbon Dioxide Emissions in African Countries during 1984–2014. J. Environ. Sci. 2021, 102, 85–98. [Google Scholar] [CrossRef]
  45. Zeng, C.; Stringer, L.C.; Lv, T. The Spatial Spillover Effect of Fossil Fuel Energy Trade on CO2 Emissions. Energy 2021, 223, 120038. [Google Scholar] [CrossRef]
  46. Shigetomi, Y.; Kanemoto, K.; Yamamoto, Y.; Kondo, Y. Quantifying the Carbon Footprint Reduction Potential of Lifestyle Choices in Japan. Environ. Res. Lett. 2021, 16, 064022. [Google Scholar] [CrossRef]
  47. Fatima, T.; Xia, E.; Cao, Z.; Khan, D.; Fan, J.-L. Decomposition Analysis of Energy-Related CO2 Emission in the Industrial Sector of China: Evidence from the LMDI Approach. Environ. Sci. Pollut. Res. 2019, 26, 21736–21749. [Google Scholar] [CrossRef] [PubMed]
  48. Namahoro, J.P.; Wu, Q.; Xiao, H.; Zhou, N. The Impact of Renewable Energy, Economic and Population Growth on CO2 Emissions in the East African Region: Evidence from Common Correlated Effect Means Group and Asymmetric Analysis. Energies 2021, 14, 312. [Google Scholar] [CrossRef]
  49. Li, J.; Zhang, D.; Su, B. The Impact of Social Awareness and Lifestyles on Household Carbon Emissions in China. Ecol. Econ. 2019, 160, 145–155. [Google Scholar] [CrossRef]
  50. Nosheen, M.; Abbasi, M.A.; Iqbal, J. Analyzing Extended STIRPAT Model of Urbanization and CO2 Emissions in Asian Countries. Environ. Sci. Pollut. Res. 2020, 27, 45911–45924. [Google Scholar] [CrossRef] [PubMed]
  51. Zhao, H.; Liu, Y.; Lindley, S.; Meng, F.; Niu, M. Change, Mechanism, and Response of Pollutant Discharge Pattern Resulting from Manufacturing Industrial Transfer: A Case Study of the Pan-Yangtze River Delta, China. J. Clean. Prod. 2020, 244, 118587. [Google Scholar] [CrossRef]
  52. Hean, O.; Partridge, M.D. The Impact of Metropolitan Technology on the Non-Metropolitan Labour Market: Evidence from US Patents. Reg. Stud. 2021, 2021, 1–13. [Google Scholar] [CrossRef]
  53. Li, Y.; Sun, L.; Zhang, H.; Liu, T.; Fang, K. Does Industrial Transfer within Urban Agglomerations Promote Dual Control of Total Energy Consumption and Energy Intensity? J. Clean. Prod. 2018, 204, 607–617. [Google Scholar] [CrossRef]
  54. Yin, J.; Zheng, M.; Li, X. Interregional Transfer of Polluting Industries: A Consumption Responsibility Perspective. J. Clean. Prod. 2016, 112, 4318–4328. [Google Scholar] [CrossRef]
  55. Tian, Y.; Jiang, G.; Zhou, D.; Ding, K.; Su, S.; Zhou, T.; Chen, D. Regional Industrial Transfer in the Jingjinji Urban Agglomeration, China: An Analysis Based on a New “Transferring Area-Undertaking Area-Dynamic Process” Model. J. Clean. Prod. 2019, 235, 751–766. [Google Scholar] [CrossRef]
  56. Fan, J.-L.; Wang, J.-D.; Kong, L.-S.; Zhang, X. The Carbon Footprints of Secondary Industry in China: An Input–Output Subsystem Analysis. Nat. Hazards 2018, 91, 635–657. [Google Scholar] [CrossRef]
  57. Khan, A.; Sicen, L.; Khan, B.; Salman, N. On the Influence of Demographic Structure and Industrial Growth on Environmental Quality. J. Environ. Manag. 2021, 288, 112453. [Google Scholar] [CrossRef]
  58. Dong, J.; Dou, Y.; Jiang, Q.; Zhao, J. How Does Industrial Structure Upgrading Affect the Global Greenhouse Effect? Evidence From RCEP and Non-RCEP Countries. Front. Energy Res. 2021, 9, 683166. [Google Scholar] [CrossRef]
  59. Liu, Z.; Wang, F.; Tang, Z.; Tang, J. Predictions and Driving Factors of Production-Based CO2 Emissions in Beijing, China. Sustain. Cities Soc. 2020, 53, 101909. [Google Scholar] [CrossRef]
  60. Dietz, T.; Rosa, E.A. Effects of Population and Affluence on CO2 Emissions. Proc. Natl. Acad. Sci. USA 1997, 94, 175–179. [Google Scholar] [CrossRef] [PubMed] [Green Version]
  61. Ahmad, M.; Rehman, A.; Shah, S.A.A.; Solangi, Y.A.; Chandio, A.A.; Jabeen, G. Stylized Heterogeneous Dynamic Links among Healthcare Expenditures, Land Urbanization, and CO2 Emissions across Economic Development Levels. Sci. Total Environ. 2021, 753, 142228. [Google Scholar] [CrossRef] [PubMed]
  62. Yu, X.; Chen, H.; Wang, B.; Wang, R.; Shan, Y. Driving Forces of CO2 Emissions and Mitigation Strategies of China’s National Low Carbon Pilot Industrial Parks. Appl. Energy 2018, 212, 1553–1562. [Google Scholar] [CrossRef]
  63. Qi, Y.; Peng, W. Effects of China’s Regional Industrial Structure Adjustment on Carbon Emission Transfer Based on Gravity Model. Environ. Eng. Manag. J. EEMJ 2019, 18, 2475–2490. [Google Scholar] [CrossRef]
  64. Dinda, S. Environmental Kuznets Curve Hypothesis: A Survey. Ecol. Econ. 2004, 49, 431–455. [Google Scholar] [CrossRef] [Green Version]
  65. Wang, Z.; Yang, L. Delinking Indicators on Regional Industry Development and Carbon Emissions: Beijing–Tianjin–Hebei Economic Band Case. Ecol. Indic. 2015, 48, 41–48. [Google Scholar] [CrossRef]
  66. Wang, S.; Wang, J.; Li, S.; Fang, C.; Feng, K. Socioeconomic Driving Forces and Scenario Simulation of CO2 Emissions for a Fast-Developing Region in China. J. Clean. Prod. 2019, 216, 217–229. [Google Scholar] [CrossRef]
  67. Wang, R.; Qi, Z.; Shu, Y. Research on Multiple Effects of Fixed-Asset Investment on Energy Consumption——by Three Strata of Industry in China. Environ. Sci. Pollut. Res. 2020, 27, 41299–41313. [Google Scholar] [CrossRef]
  68. Dietz, T.; Rosa, E.A. Rethinking the Environmental Impacts of Population, Affluence and Technology. Hum. Ecol. Rev. 1994, 1, 277–300. [Google Scholar]
  69. Yu, X.; Liang, Z.; Fan, J.; Zhang, J.; Luo, Y.; Zhu, X. Spatial Decomposition of City-Level CO2 Emission Changes in Beijing-Tianjin-Hebei. J. Clean. Prod. 2021, 296, 126613. [Google Scholar] [CrossRef]
  70. Liu, Y.; Wen, Y. Transfer and spatial structure change of producer services in Beijing-Tianjin-Hebei Region. Inq. Econ. Issues 2017, 9, 69–77. (In Chinese) [Google Scholar]
  71. Van Amstel, A. IPCC 2006 Guidelines for National Greenhouse Gas Inventories; Institute for Global Environmental Strategies: Hayama, Japan, 2006; ISBN 978-4-88788-032-0. [Google Scholar]
  72. Shao, S.; Chen, Y.; Li, K.; Yang, L. Market Segmentation and Urban CO2 Emissions in China: Evidence from the Yangtze River Delta Region. J. Environ. Manag. 2019, 248, 109324. [Google Scholar] [CrossRef] [PubMed]
  73. Ma, M.; Rozema, J.; Gianoli, A.; Zhang, W. The Impacts of City Size and Density on CO2 Emissions: Evidence from the Yangtze River Delta Urban Agglomeration. Appl. Spat. Anal. Policy 2021, 2021, 1–27. [Google Scholar] [CrossRef]
  74. Chen, M.; Liu, W.; Lu, D. Challenges and the Way Forward in China’s New-Type Urbanization. Land Use Policy 2016, 55, 334–339. [Google Scholar] [CrossRef]
  75. Sun, Y.; Zhou, M. Impact of urbanization and higher performance industrial structure on CO2 emissions in China: Independent and coupling effects. Resour. Sci. 2016, 38, 1846–1860. (In Chinese) [Google Scholar] [CrossRef]
  76. Wang, J.; Liu, B.; Li, Y. Spatial-temporal characteristics and influencing factors of population distribution and floating changes in Beijing-Tianjin-Hebei region. Geogr. Res. 2018, 37, 1802–1817. (In Chinese) [Google Scholar]
  77. Kongkuah, M.; Yao, H.; Yilanci, V. The Relationship between Energy Consumption, Economic Growth, and CO2 Emissions in China: The Role of Urbanisation and International Trade. Environ. Dev. Sustain. 2021, 2021, 1–25. [Google Scholar] [CrossRef]
  78. Guo, S.; Zhang, Y.; Qian, X.; Ming, Z.; Nie, R. Urbanization and CO2 Emissions in Resource-Exhausted Cities: Evidence from Xuzhou City, China. Nat. Hazards 2019, 99, 807–826. [Google Scholar] [CrossRef]
  79. Koengkan, M.; Fuinhas, J.A.; Santiago, R. The Relationship between CO2 Emissions, Renewable and Non-Renewable Energy Consumption, Economic Growth, and Urbanisation in the Southern Common Market. J. Environ. Econ. Policy 2020, 9, 383–401. [Google Scholar] [CrossRef]
  80. Amin, S.B.; Atique, M.A. The Nexus among Tourism, Urbanisation and CO2 Emissions in South Asia: A Panel Analysis. Tour. Hosp. Manag. 2021, 27, 63–82. [Google Scholar] [CrossRef]
  81. Beijing-Tianjin-Hebei Industrial Transfer Guidelines Released. Available online: http://www.gov.cn/xinwen/2016-06/29/content_5086837.htm (accessed on 21 June 2021).
  82. Dogan, E.; Inglesi-Lotz, R. The Impact of Economic Structure to the Environmental Kuznets Curve (EKC) Hypothesis: Evidence from European Countries. Environ. Sci. Pollut. Res. 2020, 27, 12717–12724. [Google Scholar] [CrossRef]
  83. Wang, J.; Wang, Q.; Liu, J.; Li, B. Transfer and Cooperation Mechanism of Manufacturing Industry in Beijing, Tianjin and Hebei under the Synergetic Perspective. Econ. Geogr. 2018, 38, 90–99. (In Chinese) [Google Scholar] [CrossRef]
  84. Shijiazhuang Has Actively Undertaken the Relocation of Non-Capital Functions from Beijing and Industrial Transfer from Beijing and Tianjin. Available online: http://www.sjz.gov.cn/col/1546231082146/2019/02/24/1550965783119.html (accessed on 27 June 2021).
  85. Annual Report on Beijing-Tianjin-Hebei Metropolitan Region Development. Available online: https://www.jingjinjicn.com/skwx_3j/bookdetail?SiteID=46&ID=6272256 (accessed on 13 August 2021).
  86. Cangzhou, Hebei: Strive to Build a Highland for the Coordinated Development of Beijing, Tianjin and Hebei. Available online: http://www-gov-cn.vpn.sdnu.edu.cn/xinwen/2018-12/14/content_5348632.htm (accessed on 17 November 2021).
  87. Cangzhou Factory of Beijing-Hyundai Auto. Available online: http://www.cedz.gov.cn/achievement/show-1481.aspx (accessed on 17 November 2021).
  88. Analysis on “Cangzhou Phenomenon” of Beijing and Tianjin Industrial Transfer. Available online: http://www.hebei.gov.cn/hebei/14462058/14471802/14471750/14696183aa/index.html (accessed on 17 November 2021).
Figure 1. Mechanism paths of industrial transfer on carbon dioxide emissions.
Ijerph 19 00322 g001
Figure 2. Industrial transfer scale of the BTH region. (a) shows the total scale of industrial transfer from 2002 to 2017, and (b) shows the annual industrial transfer scale from 2002 to 2017.
Ijerph 19 00322 g002
Figure 3. CE, CEI and PCE of BTH region.
Ijerph 19 00322 g003
Figure 4. Spatial distribution of CE, CEI and PCE in 2002 (a), 2005 (b), 2010 (c), 2015 (d) and 2017 (e).
Ijerph 19 00322 g004
Figure 5. Spatial distribution of regression coefficients for influencing factors in 2002–2017. (ah) respectively show the regression coefficients of industrial transfer scale (R), industrial structure (N), per capita GDP (A), population (P), population urbanisation rate (U), number of authorised inventions (T), industrial energy intensity (E) and fixed asset investment (F).
Ijerph 19 00322 g005
Table 1. Policies on BTH industrial transfer and cooperation [43].
YearPolicy DocumentMain Contents
2004Bohai Rim Regional Cooperation Framework AgreementStrengthen the strategic cooperation between Beijing, Tianjin and Hebei, and promote industrial dislocation development.
2008Opinions on the Establishment of “Coordination and Communication Mechanism for Promoting the Development of BTH Metropolitan Area” by Beijing, Tianjin and Hebei Development and Reform CommissionEstablish a joint meeting and liaison system to develop regional cooperation, and strengthen the communication of planning, industry, policy and other information among the three provinces.
2010Implementation Opinions on Accelerating the Industrial Development of Economic Circle Surrounding the Capital in Hebei ProvinceLaunch the “docking project” between Hebei and Beijing with six systems: planning, transportation, communication, information, finance and service guarantee.
2011The Twelfth Five-Year Plan for National Economic and Social Development of the People’s Republic of China Put forward the idea of “building the Capital Economic Circle” for the first time and incorporating it into the overall strategy of national and regional development.
2015Outline of Coordinated Development of the Beijing-Tianjin-Hebei RegionDisperse Beijing’s noncapital functions (especially high-consumption industries) to the surrounding areas, promote industrial transfer, accelerate the construction of the Tianjin-Hebei receiving platforms, and strengthen BTH industrial cooperation.
2016The Beijing-Tianjin-Hebei National Economic and Social Development Plan during the 13th Five-Year PlanPromote the construction of the BTH comprehensive innovation and reform experimental zone and build a modern industrial development system.
2017Opinions on Strengthening the Construction of Key Platforms for the Industrial Transfer of the Beijing-Tianjin-Hebei RegionPut forwards a list of receiving platforms based on the list of noncapital functional industries. Open up channels for industrial transfer and receiving, identifying 46 specialised receiving platforms. Move forwards in parallel with industrial transfer and innovation capacity improvement.
Table 2. Results of the panel data unit root test for all variables.
VariablesLevin-Lin-Chu
(Assumes Common Root)
ADF-Fisher Chi-Square
(Assumes Individual Root)
Intercept and TrendInterceptIntercept and TrendIntercept
Total amount of CO2 emissions (CE)1.606−3.958 ***7.08681.871 ***
Industrial transfer scale (R)−7.404 ***−5.870 ***96.987 ***128.413 ***
Industrial structure (N)−0.993−0.012 ***28.34772.148 ***
Per capita GDP (A)−1.516 *−4.046 ***31.39492.373 ***
Population (P)1.291−2.939 ***9.92062.652 ***
Population urbanisation rate (U)−5.750 ***−2.283 **38.038 *66.277 ***
Number of authorised inventions (T)−10.3448 ***−4.039 ***91.314 ***99.474 ***
Industrial energy intensity (E)−6.238 ***−4.981 ***83.074 ***106.403 ***
Fixed asset investment (F)−2.882 ***−2.589 ***15.68563.922 ***
Note: * Denotes significance at the level of 10%; ** Denotes significance at the level of 5%; *** Denotes significance at the level of 1%.
Table 3. Direct and indirect impacts of industrial transfer on CO2 emissions.
VariablesModel 1Model 2Model 3Model 4Model 5Model 6Model 7Model 8Model 9
CEACEPCEUCETCE
Industrial transfer scale (R)0.022 ***0.010 ***0.012 *0.001 **0.018 ***−0.004 ***0.019 ***−0.0010.017 **
Per capita GDP (A) 0.543 ***−0.026 ***0.470 ***0.0180.490 ***0.020 **0.567 ***
Population (P)−1.695 ***−0.034 −1.704 ***−0.062 ***−1.459 ***−0.013−1.773 ***
Population urbanisation rate (U)−0.2840.119 ***−0.360 *−0.064 *** −0.193−0.080 ***−0.619 **
Number of authorised inventions (T)−0.5590.521 ***−0.287−0.122 **−0.537−0.459 *** −0.912 **
Industrial energy intensity (E)0.557 ***−0.0080.506 ***0.0030.567 ***−0.009 *0.527 ***−0.006 **0.551 ***
Fixed asset investment (F)0.836 ***0.324 ***0.676 ***−0.014 **0.653 ***0.019 **0.594 ***−0.0070.651 ***
Constant2.156 ***0.100−0.2101.271 ***1.5471.503 ***0.976 ***1.078 ***2.531 ***
Chi-square statistics 42,096.938264,212.03256,815.938950,786.55770,504.859247,940.02961,733.508872,782.32836,580.120
p value
(Chi-square
statistics)
0.0000.0000.0000.0000.0000.0000.0000.0000.000
Note: * Denotes significance at the level of 10%; ** Denotes significance at the level of 5%; *** Denotes significance at the level of 1%.
Table 4. The impact of industrial transfer on CO2 emissions in two periods.
VariablesModel 1Model 2
2002–20092010–20172002–20092010–2017
Industrial transfer scale (R)0.021 **0.0220.034 *0.007
Per capita GDP (A) −0.3880.702 ***
Population (P) −1.396 ***0.573
Population urbanisation rate (U) 0.552−1.030
Number of authorised inventions (T) −0.349−3.238
Industrial energy intensity (E)0.397 ***0.881 ***0.223 **0.857 ***
Fixed asset investment (F)0.720 ***−0.0240.575 ***0.126
Constant−0.2310.2231.5313.120
Chi-square statistics3497.9272527.0536744.6974847.163
Note: * Denotes significance at the level of 10%; ** Denotes significance at the level of 5%; *** Denotes significance at the level of 1%.
Publisher’s Note: MDPI stays neutral with regard to jurisdictional claims in published maps and institutional affiliations.

