Article

Estimation of Polycyclic Aromatic Hydrocarbons Pollution in Mediterranean Sea from Volturno River, Southern Italy: Distribution, Risk Assessment and Loads

by
Paolo Montuori
1,*,
Elvira De Rosa
1,
Fabiana Di Duca
1,
Donatella Paola Provvisiero
1,
Pasquale Sarnacchiaro
2,
Antonio Nardone
1 and
Maria Triassi
1
1
Department of Public Health, “Federico II” University, Via Sergio Pansini 5, 80131 Naples, Italy
2
Department of Law and Economics, University of Roma “Unitelma Sapienza”, Viale Regina Elena 295, 00161 Rome, Italy
*
Author to whom correspondence should be addressed.
Int. J. Environ. Res. Public Health 2021, 18(4), 1383; https://doi.org/10.3390/ijerph18041383
Submission received: 22 December 2020 / Revised: 26 January 2021 / Accepted: 28 January 2021 / Published: 3 February 2021
(This article belongs to the Special Issue Occurrence, Distribution and Ecological Risk of Contaminants in River)

Abstract

:
This study reports the data on the contamination caused by polycyclic aromatic hydrocarbons (PAHs) drained from the Volturno River. The seasonal and spatial distribution of PAHs in water and sediment samples was assessed. The 16 PAHs were determined in the water dissolved phase (DP), suspended particulate matter (SPM), and sediments. A multidimensional statistical approach was used to identify three pollution composite indicators. Contaminant discharges of PAHs into the sea were calculated in about 3158.2 kg/year. Total concentrations of PAHs varied in ranges 434.8 to 872.1 ng g−1 and 256.7 to 1686.3 ng L−1 in sediment samples and in water (DP + SPM), respectively. The statistical results indicated that the PAHs mainly had a pyrolytic source. Considering the sediment quality guidelines (SQGs), the water environmental quality standards (USEPA EQS), and risk quotient (RQ), the Volturno River would be considered as an area in which the environmental integrity is possibly at risk.

1. Introduction

PAHs are environmental pollutants commonly distributed in the ecosystem [1,2]. Their diffusion in the environment caused much concern due to the toxic and carcinogenic properties of these compounds for human health [3,4,5]. The PAHs release into the aquatic system is caused by both natural and human sources. Natural sources of PAHs include volcanic emissions, forest fires, natural oil, and certain biological (biogenic) processes. Anthropogenic sources of PAHs in aquatic environments are divided into pyrogenic and petrogenic groups. Pyrogenic sources include incomplete combustion, domestic and industrial wastewater discharges, oil spills and waste incinerators, etc. Petrogenic sources include crude oil and petrochemicals products such as kerosene, petrol, diesel, lubricating oil, and asphalt [6,7,8]. All of the aforementioned sources (i.e., pyrolytic, petrogenic and diagenetic) bring about distinctive PAHs patterns.
Combustion products are composed of two or more fused aromatic rings. In most cases, high molecular weight PAHs (HMW-PAHs) are dangerous and havethe tendency to bio-accumulate in the human body and different aquatic organisms, whereas low molecular weight compounds (LMW-PAHs)—such as those with bi- and tricyclic aromatic rings—are normally produced during low temperature diagenesis, which is in the process of oil production (i.e., petrogenic sources) [9,10,11]. Using specific chemicals analysis, identifying the generating processes of the sample is achievable [12,13].
Since 1980, waste disposal in Campania region is a relevant problem. This waste problem in the Campania region caused a considerable discharge of illegal urban, toxic, and industrial waste [14,15]. In recent years, the Campania region was involved in some environmental emergencies: Illegal dumping and burning of toxic waste. Due to these events, this area has been renamed as “Land of Fire” (Figure 1). Frequently, extensive quantities of accumulated waste are illegally burned in the countryside and on the road, and the smoke released contains many PAHs [14,16].
Illegal waste disposal caused a significant environmental impact on water, air, and soil quality. In fact, it led to the deterioration of land and especially ground and surface water. The “Land of Fire”, also called “Triangle of Death” by Senior and Mazza in the journal The Lancet Oncology, is crossed by the Volturno River, which is the main basin of Southern Italy for length and water flow. Therefore, PAHs present in the toxic fumes from waste illegal fires, can deposit on the surface waters of the Volturno River which, consequently, can cause pollution of the Mediterranean Sea where Volturno River flows [17,18,19].
Estuarine and coastal marine environments receive a substantial input of PAHs due to having served as major depositories for the disposal of industrial and domestic effluents, sewage sludge, and dredged material with considerable loads contaminants. Water could represent a direct measure of the degree of aquatic environment. Sediments are natural sinks and environmental reservoirs for PAHs in the aquatic system and they provide an irreplaceable aid in reconstructing the input and contamination of PAHs.Due to their high persistence in the environment, PAHs accumulate in the sediment for a long time and may be a source of contamination for aquatic biota. This makes the PAHs presence in the water and sediment matrices a paramount issue with utmost attention for the aquatic environment, fishing, and seafood producing industries [20,21].
The purpose of this study is to report data concerning PAHs drainage contamination from the Volturno River and its impact on the Tyrrhenian Sea (Central Mediterranean Sea). Moreover, the ecosystem risk and the PAHs spatial and seasonal distribution in samples of water and sediment was evaluated in this river. One of the key aims of this study is to estimate the PAHs as indicators of contamination, by determining the main sources from which these pollutants originate. To the best of our knowledge, no previous studies estimate the PAHs input into the Central Mediterranean Sea from Volturno River.

2. Materials and Methods
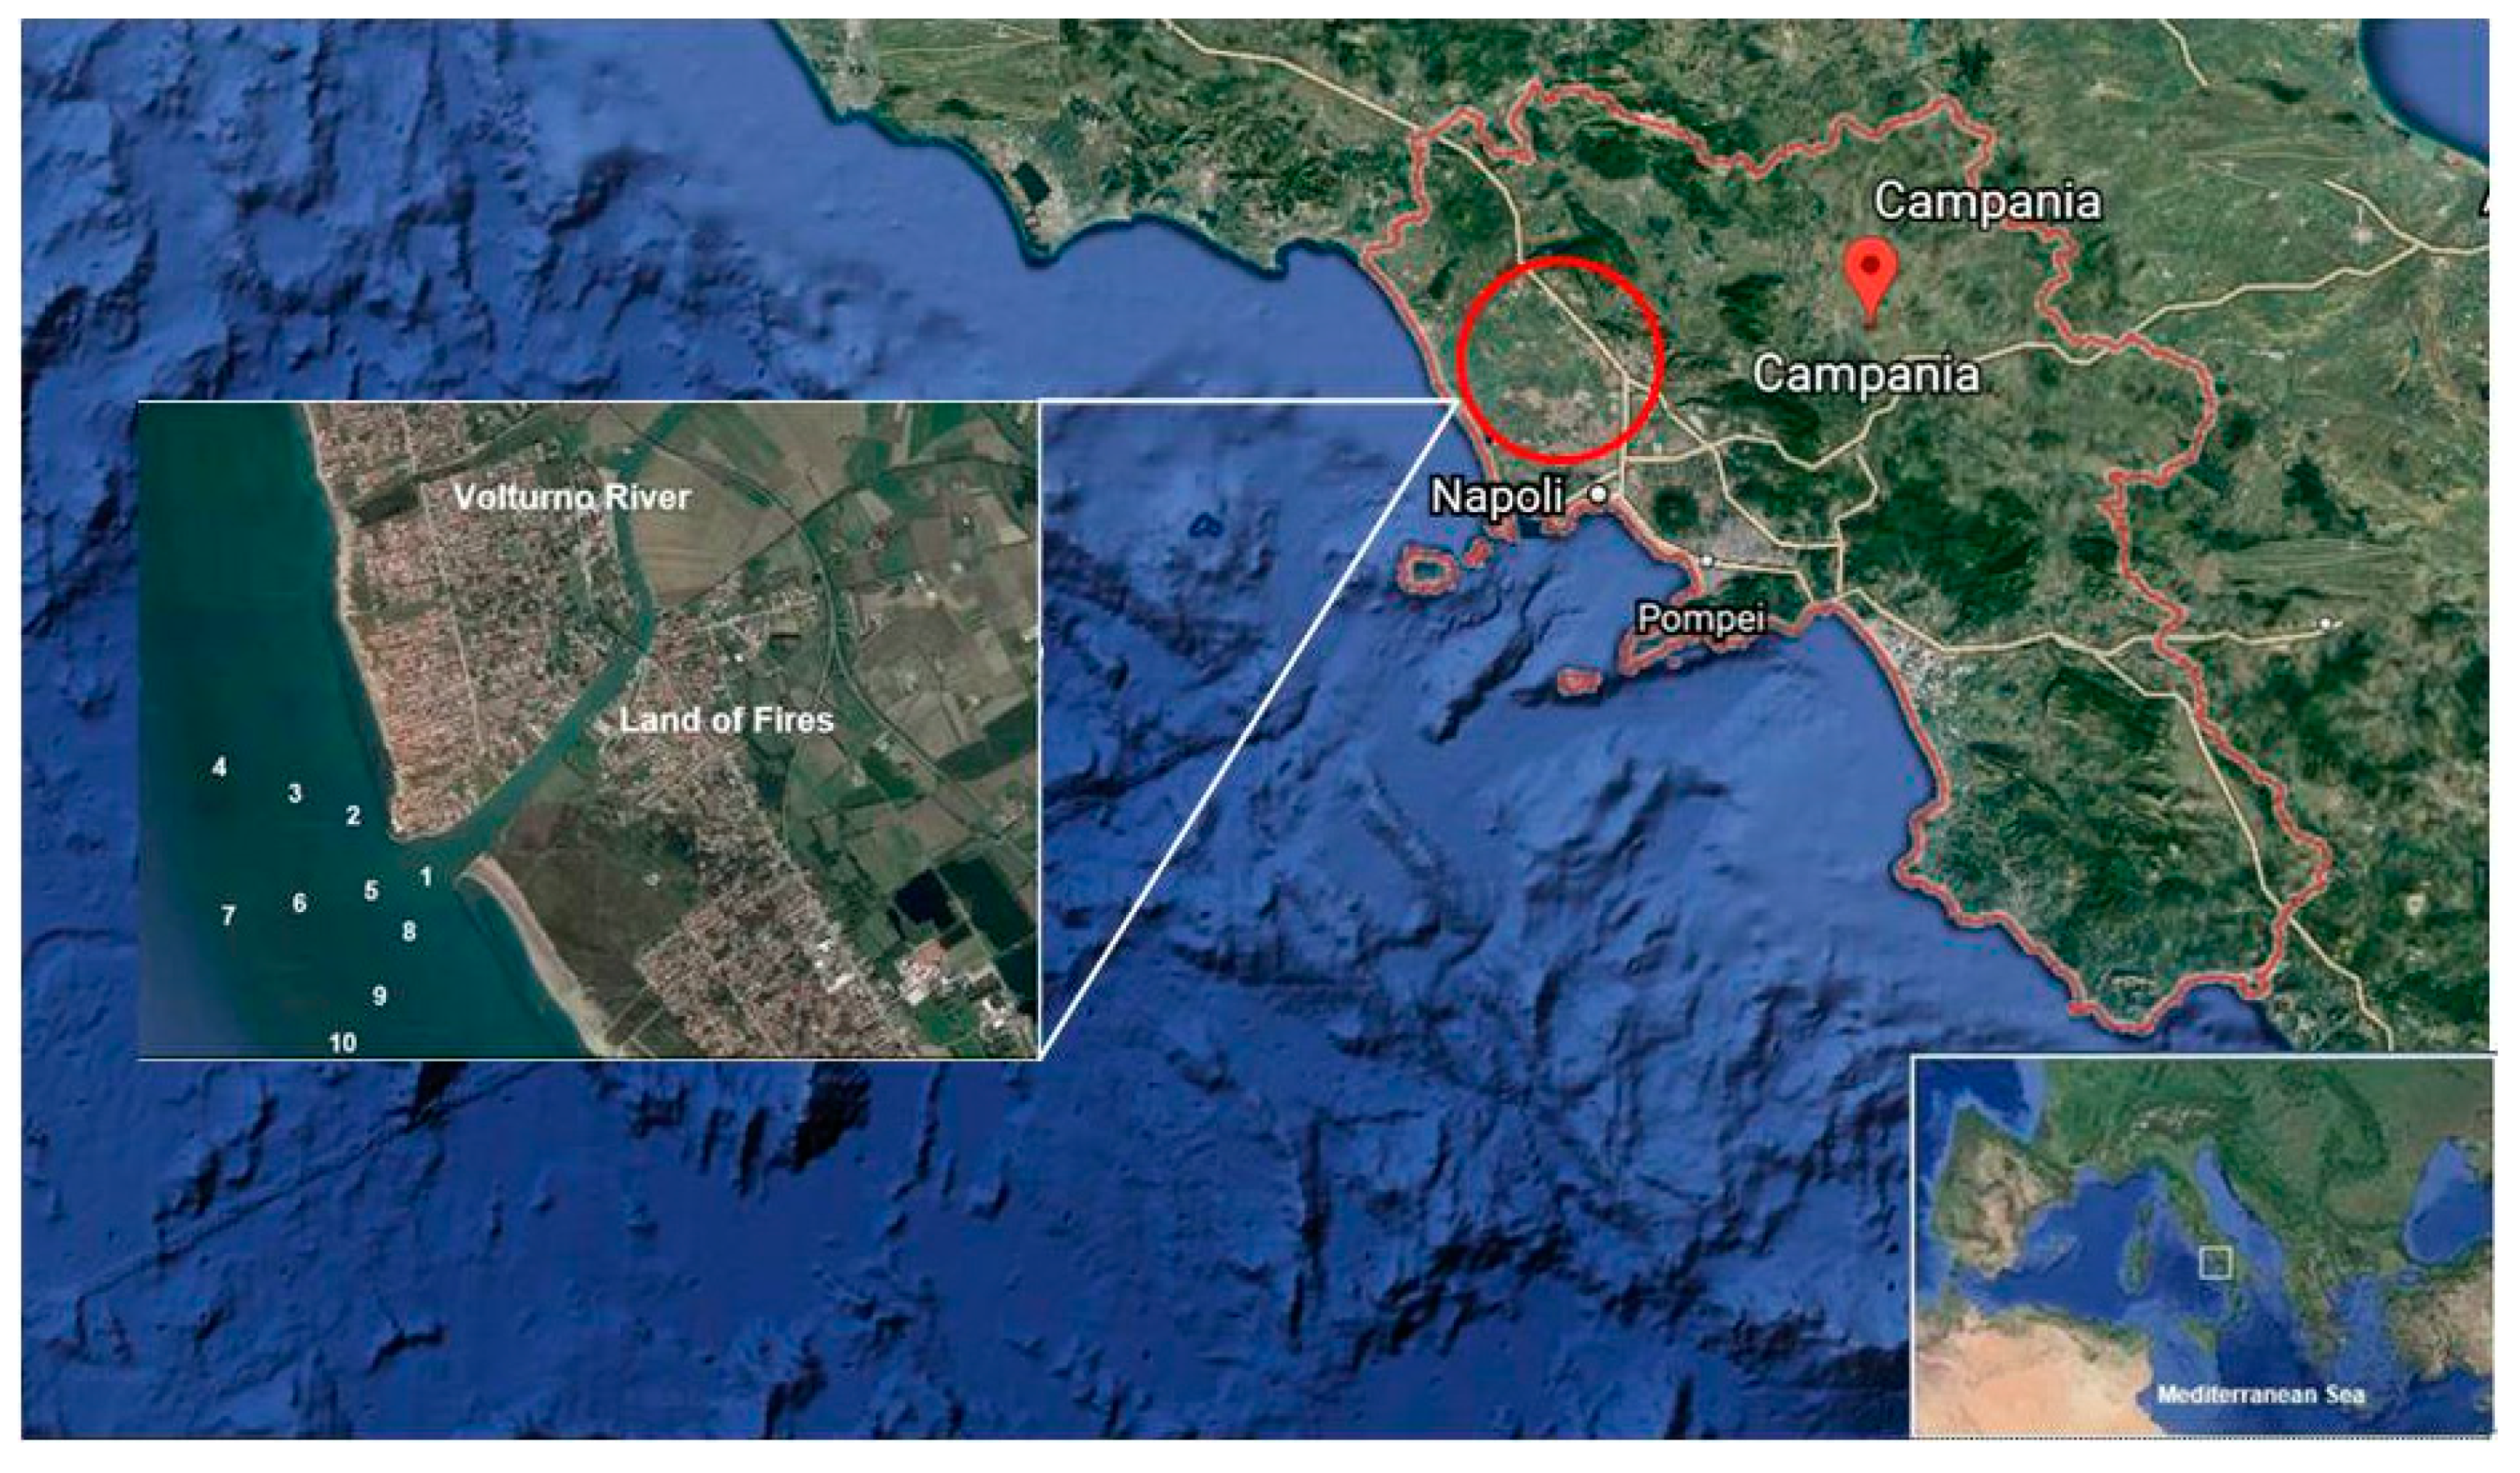
2.1. Sampling

Four sampling campaigns, each of which in 10 sites, were performed from November 2017 to July 2018, to evaluate the changing trends of PAHs in time. In Table 1, information about sampling sites are shown. Throughout sampling, a global positioning system (GPS) was used to locate the sampling positions and environmental data such as temperature, pH, and conducibility were measured in situ with a portable instrument (Mettler Toledo—SevenExcellence pH/Conductivity BenchtopMeter S470-Std-K) (Table S1).Site 1 was at the Volturno River mouth, while the other sites were at 500, 1000, and 1500 mt away from the Volturno Estuary, in order to assess the levels of the PAHs contamination and to estimate the impact of the river contamination on the Mediterranean Sea.
Water samples (2.5 L) were collected from the surface layer at the depth of 0–50 cm from the sampling locations using amber glass bottles directly and taken to the laboratory for analysis. Superficial sediments (at the depth of 0–5 cm) were collected in April with a handheld Van Veen Grab sampler, placed in aluminum containers and kept frozen (−20 °C) until further analysis.

2.2. Sample Cleanup and Analysis

Water samples were filtered through GF/F glass fiber filters (0.7 μm pore size, Whatman, United Kingdom; baked at 450 °C overnight), then the filters (suspended particulate matter, SPM) were preserved at −20 °C until analysis.
In the dissolved phase (DP), PAHs were extracted with a solid phase extraction (SPE) by the Oasis HLB cartridge (6 mL, 500 mg; Waters, Milford, MA, USA), according to the method proposed by Zhou et al. [22]. Before extraction, benzo[a]pyrene-d12 and indeno[1,2,3-cd]pyrene-d12 were added as surrogate solutions (10 ng L−1). Methylene chloride (5 mL), methanol (5 mL), and ultra-pure water (5 mL) were used to condition and wash the cartridge, then the water sample (2 L) was eluted with a flow rate of 10 mL min−1. Therefore, the cartridge was eluted with methylene chloride (10 mL) and the extract was concentrated to 500 µL in hexane for the GC-MS analysis. Finally, chrysene-d12 was added to the sample as an internal standard.
The sediment was air-dried, pulverized, sieved (250 µm particles were used as the sample) homogenized, and sub-sampled into 5-g portions. The PAHs concentrations in the sediment samples were calculated as dry weight (ng/g dw) [23,24,25,26].
The PAHs extraction from the filters (SPM) and the sediment samples was performed with a Soxhlet extractor using methylene chloride (150 mL) for 24 h, followed by 150 mL of acetone:hexane (1:1) solution for another 24 h. In the Soxhlet extraction, 5 g of the sediment sample was placed into an extraction thimble, which was then extracted using the solvent via the reflux cycle. Once the solvent was boiled, the vapour passed through a bypass arm into the condenser, where it condenses and drips back onto the solvent in the thimble. As the solvent reaches the top of the siphon arm, the solvent and extract were siphoned back onto the lower flask whereby the solvent reboils, and the cycle was repeated until all the samples were completely extracted into the lower flask. The extracts were purified via a column consisting of 1 g of sodium sulfate and 2.5 g (10% deactivated) of silica geland eluted with 70 mL of hexane:methylene chloride (7:3) solution. The extracts were evaporated to dryness, solvent-exchanged to hexane to 500 μL for the GC-MS analysis, and chrysene-d12 was added as an internal standard. The total organic carbon (TOC) was determined by the TOC analyzer (TOC-VCPH, Shimadzu Corp., Kyoto, Japan).

2.3. Instrumental Analysis

A TRACETM1310gas chromatographycoupled to the ISQTM 7000 single quadrupolemass spectrometer (GC-MS, Thermo Scientific, Waltham, MA, USA) under a selected ion monitoring (SIM) mode was used to perform the analysis. A TG-5MS capillary column (30 mm length × 0.25 mm inner diameter × 0.25 μm film thickness) and the helium as a carrier gas (constant flow rate of 1 mL/min) were used. TheMSD worked in the electron ionization (EI)mode, set at 70 eV. A splitless injection mode was adopted and the sample injection volume was 1 μL. The column temperature was programmed as follows: 60 °C for 2 min, increasing to 200 °C at 25 °C min−1, to 270 °C at 10 °C min−1 (kept for 6 min), and finally, to 310 °C at 25 °C min−1 (kept for 10 min). The injector and detector temperatures were 280 and 300 °C, respectively.
The PAHs quantification was made using a five-point calibration curve for the 16 PAHs (Dr. Ehrenstorfer GmbH, Augsburg, Germany) (r2 > 0.98) and chrysene-d12 as an internal standard.
The following PAHs, according to the USEPA priority [27], were analyzed: Naphthalene (Nap), acenaphthylene (Acy), acenaphthene (Ace), fluorene (Flu), phenanthrene (Phe), anthracene (An), fluoranthene (Fl), pyrene (Pyr), benzo[a]anthracene (BaA), chrysene (Chr), benzo[b]fluoranthene (BbF), benzo[k]fluoranthene (BkF), benzo[a]pyrene (BaP), dibenzo[a,h]anthracene (DahA), benzo[ghi]perylene (BghiP), and indeno[1,2,3-cd]pyrene (InP). Perylene (Per) was also analyzed, although it is not present in the list of the priority pollutants proposed by USEPA. The total PAHs concentration was calculated as the sum of the concentrations of the above individual PAHs compounds (ΣPAHs).

2.4. Quality Assurance and Quality Control

To estimate the quality assurance and quality control of the applied method, blanks and spiked recoveries were determined during the sample collection, preservation, and analysis. Before the process, all the glassware was heated to 200 °C and then washed thoroughly with methanol, acetone, and dichloromethane to minimize the background pollution. The detection limit (LOD) was calculated as three times the noise in a blank sample chromatogram. A total of ten blanks were analyzed as the same as the samples; PAHs in the blanks showed a concentration below the LOD.
In the water, LODs ranged from 0.01 to 0.1 ng L−1 while, in SPM and sediment samples, from 0.03 to 0.2 ng L−1and from 0.01 to 0.15 ng g−1, respectively.
The quantification limits (LOQ) were in the range of 0.02–0.15 ng L−1 in the water samples, 0.06–0.3 ng L−1 in the SPM samples, and 0.03–0.2 ng g−1 in the sediment samples. Data below the LOD were presented as <LOD. The recovery of PAHs in standard checks and samples was between 70% and 130%, which met the quality control requirements.

2.5. Statistical Analysis and Calculation of PAHs Inputs

The statistical software SPSS, version 14.01 for Windows (SPSS Inc., Chicago, IL, USA) was used to analyze the data for the purpose of calculating the PAHs input. All data were presented as the mean ±standard deviation (SD) and only p-values≤ 0.05 were considered statistically significant.
First, the flow-averaged mean concentration (Caw) and the annual contaminant discharges (Fannual), according to the UNEP guidelines [28]and widely accepted [29,30,31], were evaluated using the following equations:
C a w = i = 1 n C i Q i i = 1 n Q i
Fannual = CawQT
where Ci is the instantaneous concentration, Qi and QT are the daily averaged water flow discharge and the total river discharge over the period considered (November 2017–July 2018), respectively [31,32,33]. The temporal pollutant discharge variation was evaluated considering Ci and Qi for each campaign expressed as kg/year.
River flow data were collected from the register of the Autorità di Bacino Nazionale dei Fiumi Liri-Garigliano e Volturno to http://www.ildistrettoidrograficodellappenninomeridionale.it (Abruzzo, Basilicata, Calabria, Campania, Lazio, Molise, Puglia Government for the Environment).
The principal component analysis (PCA) allows reducing the size of a data set (sample) by finding a new smaller set of variables, that nonetheless retains most of the sample’s information [34,35]. There are three main methods used in order to determine the optimal number of components [36,37,38,39] in a principal component model (amount of explained variance, Cattell’s scree test, and Kaiser’s Eigenvalue greater than the 1.0 rule). In order to enhance the interpretation of the results of the PCA, it is possible to rotate the axes to reduce the dimensions or cover the maximum variation.
The rotation and change of the coordinates are performed by the Varimax rotation method. In order to analyze in depth the pollution of PAHs affecting the Volturno River and its environmental impact on the Tyrrhenian Sea, the principal component analysis has been conducted on a dataset obtained on DP and SPM. In each analysis, the 17 PAHs above mentioned were evaluated.

3. Results and Discussion

3.1. PAHs Concentrations in Water Samples

The amount of total PAHs in the DP, determined at 10 sampling locations during the four campaigns, ranged from 64.3 (site 8) to 1429.1 (site 1) ng L−1 with a mean value of 602.6 ± 319.3 ng L−1 (Table 1). These data ranged from 3.44 to 174.4 ng L−1 with a mean value of 58.4 ± 39.5 ng L−1 for 2-ring PAHs (Nap), from 19.9 to 805.1 ng L−1 for 3-ring PAHs (Acy, Ace, Flu, Phe, An), from 12.7 to 244.1 ng L−1 for 4-ring PAHs (Fl, Pyr, BaA, Chr), from 9.48 to 151.1 ng L−1 for 5-ring PAHs (BbF, BkF, BaP, DahA), and from 17.6 to 74.6 ng L−1 for 6-ring PAHs (BghiP, InP). The LMW-PAHs (2–3-ring) in the dissolved phase represented on average over 62% of all PAHs, in all the sampling sites. Their abundant concentrations in the water could be justified by their high water solubility and relatively high vapor pressures [40,41,42]. Moreover, the carcinogenic 5–6-ring PAHs were present in low concentrations, accounting for only 17% of the total PAHs. The amount of ΣPAHs in the DP samples (64.3–1429.1 ng L−1) was much higher than those found in other rivers of the world (Table 2) as in the Xijiang River [43], in the Yellow River [44], in the Songhua River, China [45], in the Wyre River, England [46], in the Elbe and Weser Rivers, Germany [47], and in the Tiber River, Italy [34,48].However, the PAHs were present in smaller quantities than those found in the Daliao River [49], in the Yellow River [50], in the Songhua River [51], in the Daliao River estuary, China [52], in the Gomti River, India [53], in the Cauca River, Colombia [8], in the Almendares River, Cuba [54], and in the Buffalo River estuary, South Africa [55]. The PAHs concentrations found inthis study are similar to those seen in the Henan Reach of Yellow River, China [56], in the Danube River, Hungary [57], and in the Sarno River [26]. The levels of the reported PAHs compound are relatively high, comparable to those reported for the unpolluted open sea by Berrojalbiz et al. (2011) and Marrucci et al. (2013) (0.7 and 0.4 ng/L, respectively) [58,59].

3.2. PAHs Concentrations in Suspended Particulate Matter

Table 1 shows the PAHs concentration ranges in SPM samples: From 149.3 ng L−1 in site 8 to 444.9 ng L−1 in site 1 (mean value of 264.7 ± 83.3 ng L−1). The PAHs amount obtained ranged from 4.05 to 38.9 ng L−1 with a mean value of 15.1 ± 8.1 ng L−1 for 2-ring PAHs (Nap), from 51.8 to 154.1 ng L−1 for 3-ring PAHs (Acy, Ace, Flu, Phe, An), from 39.6 to 181.0 ng L−1 for 4-ring PAHs (Fl, Pyr, BaA, Chr), from 26.5 to 103.1 ng L−1 for 5-ring PAHs (BbF, BkF, BaP, DahA), and from 17.8 to 66.6 ng L−1 for 6-ring PAHs (BghiP, InP). The 4-, 5-, 6-ring PAHs in SPM were present in high concentrations at most sampling sites, with 25%, 20%, and 12% of ΣPAHs, respectively.
HMW-PAHs in SPM samples rised to 57%, while in DP samples was just 38%. In accordance with the PAHs distribution theory, data showed that HMW compounds were mainly sorbed by SPM due to the elevated lipophilicity and poor biodegradation [48,51,57]. According to the partition coefficients (Kp = CSPM/CDP, where CSPM and CDP are the concentrations of analyte in SPM and DP, respectively), HMW-PAHs had a higher affinity to bind with SPM than DP (average value of 0.80, 0.96, and 1.00, respectively for 4-, 5-, 6-ring PAHs).
Table 2 shows the concentration ranges of PAHs found in several rivers around the world. The comparison showed that the PAHs concentrations in SPM samples were higher than those found in the Xijiang River, Yellow River, and Songhua River, China [43,44,45,51], in the Henan Reach of Yellow River, China [56], contrary to those observed in the Daliao River estuary, China [49,52] and in the Sarno River [26], which were higher than those found in this study.

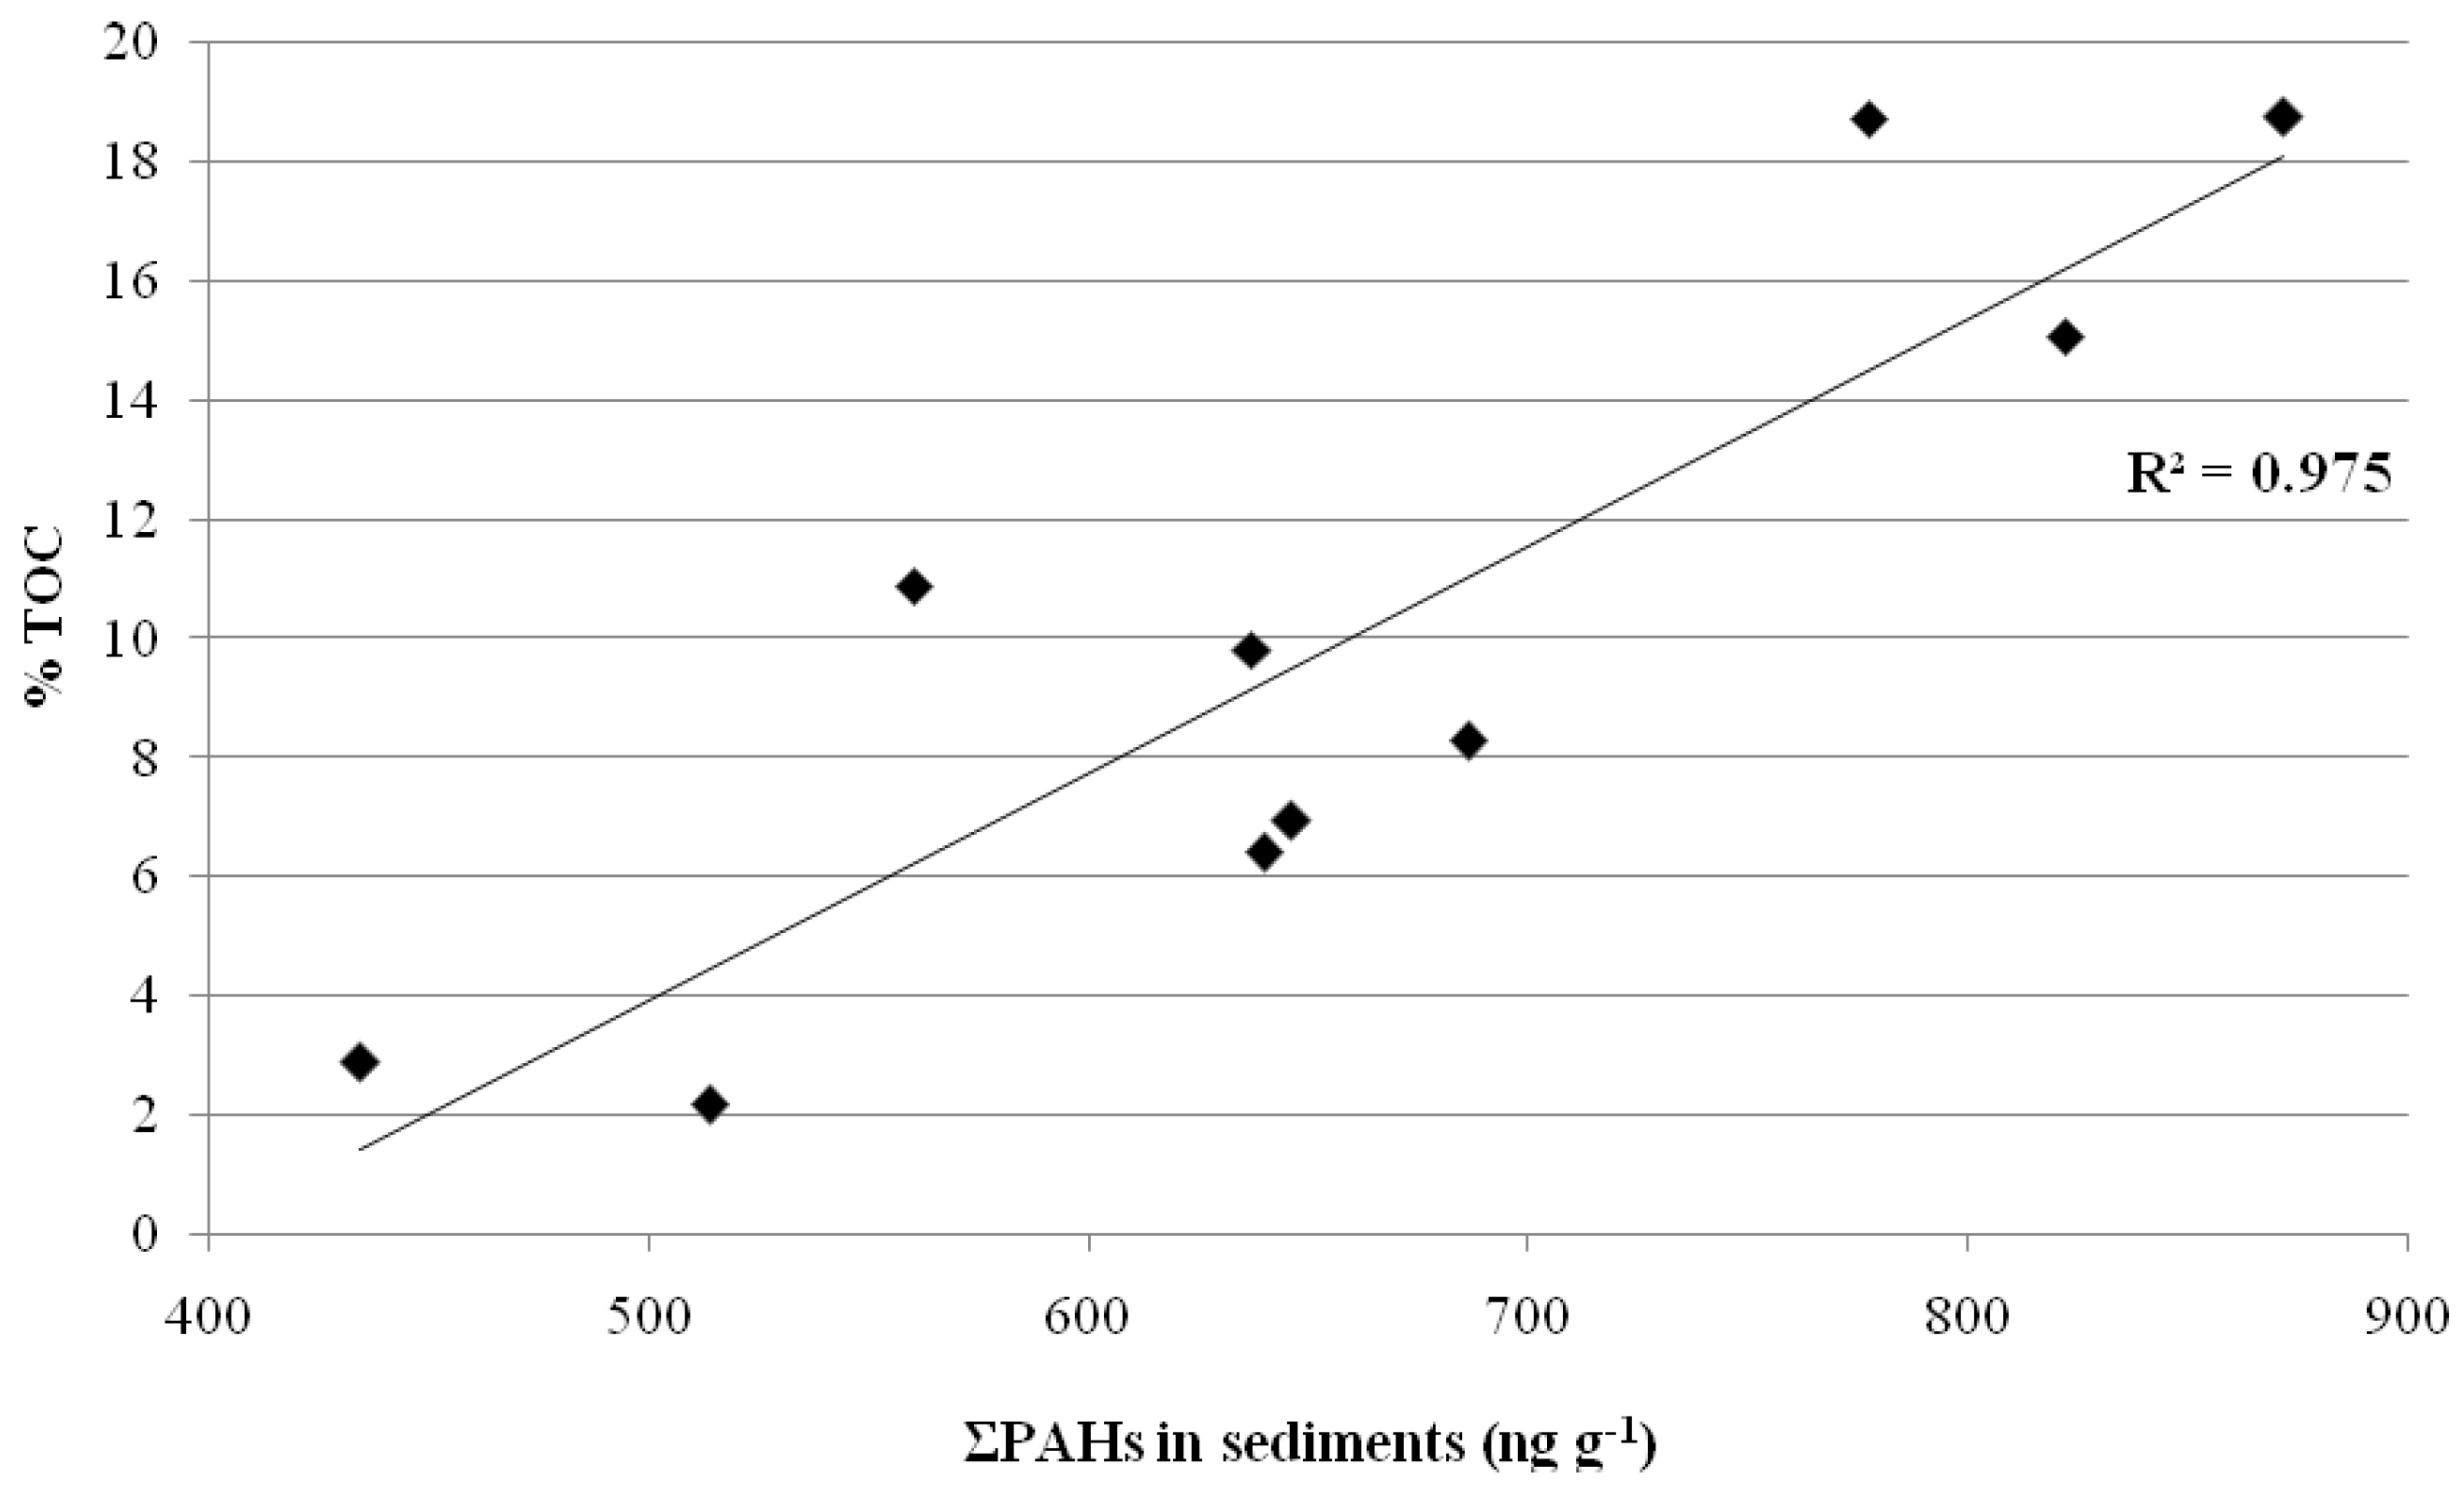
3.3. PAHs Concentrations in Sediments

The amount of total PAHs in the sediment samples are shown in Table 1. The data range from 434.8 (site 8) to 872.1 (site 1) ng g−1 with a mean value of 659.1 ± 136.9 ng g−1. The amount identified ranged from 5.29 to 73.7 ng g−1 with a mean value of 24.1 ± 27.5 ng g−1 for 2-ring PAHs (Nap), from 42.9 to 186.3 ng g−1 for 3-ring PAHs (Acy, Ace, Flu, Phe, An), from 61.7 to 199.7 ng g−1 for 4-ring PAHs (Fl, Pyr, BaA, Chr), from 262.7 to 507.1 ng g−1 for 5-ring PAHs (BbF, BkF, BaP, DahA), and from 17.5 to 133.2 ng g−1 for 6-ring PAHs (BghiP, InP). The 4- and 5-ring PAHs in the sediments were present in high concentrations at most sampling sites, with 37% and 40% of ΣPAHs, respectively. LMW-PAHs concentrations were progressively decreased by dilution due to their high water solubility and easier degradation.
Therefore, HMW compounds had a higher resistance to degradation and could easily reach the sediment due tothe low water solubility, low vapour pressure, and refractory behavior [41,67,68,69].
Table 2 shows the concentration ranges of PAHs found in several rivers around the world. The comparison showed that the amount of ΣPAHs in the sediment samples (434.8–872.1 ng g−1) was similar to those found in the Yellow River, China [50], in the Erjien River, Taiwan [60], and was greater than the concentration found in the East China Sea, China [61], in the Yellow River and in the Henan Reach of Yellow River, China [44,56], in the Yellow River Estuary, China [62], in the Danube River, Hungary [57],and in Italy, in the Tiber River [34,48,63] and in the Sarno River [26]. However, the amount of ΣPAHs in the sediment samples was lower than the concentration found in the Daliao River, China [49], in the Cocó and Ceará Rivers, Brazil [64], in the Cauca River, Colombia [8], in the Buffalo River Estuary, South Africa [55], in the Ammer River, Germany [9], and in Durance River and Huveaune River, France [65,66]. Low PAHs concentrations can be justified by the low total organic carbon (TOC) (1.1–9.5 mg g−1, mean value of 5.1 mg g−1) and high content of sand; the association between %TOC and the ΣPAHs is shown in Figure 2. The data showed that there is a positive linear regression between PAHs and TOC in the sediment samples (r = 0.97, p < 0.01), as reported by many other studies [8,49,56].

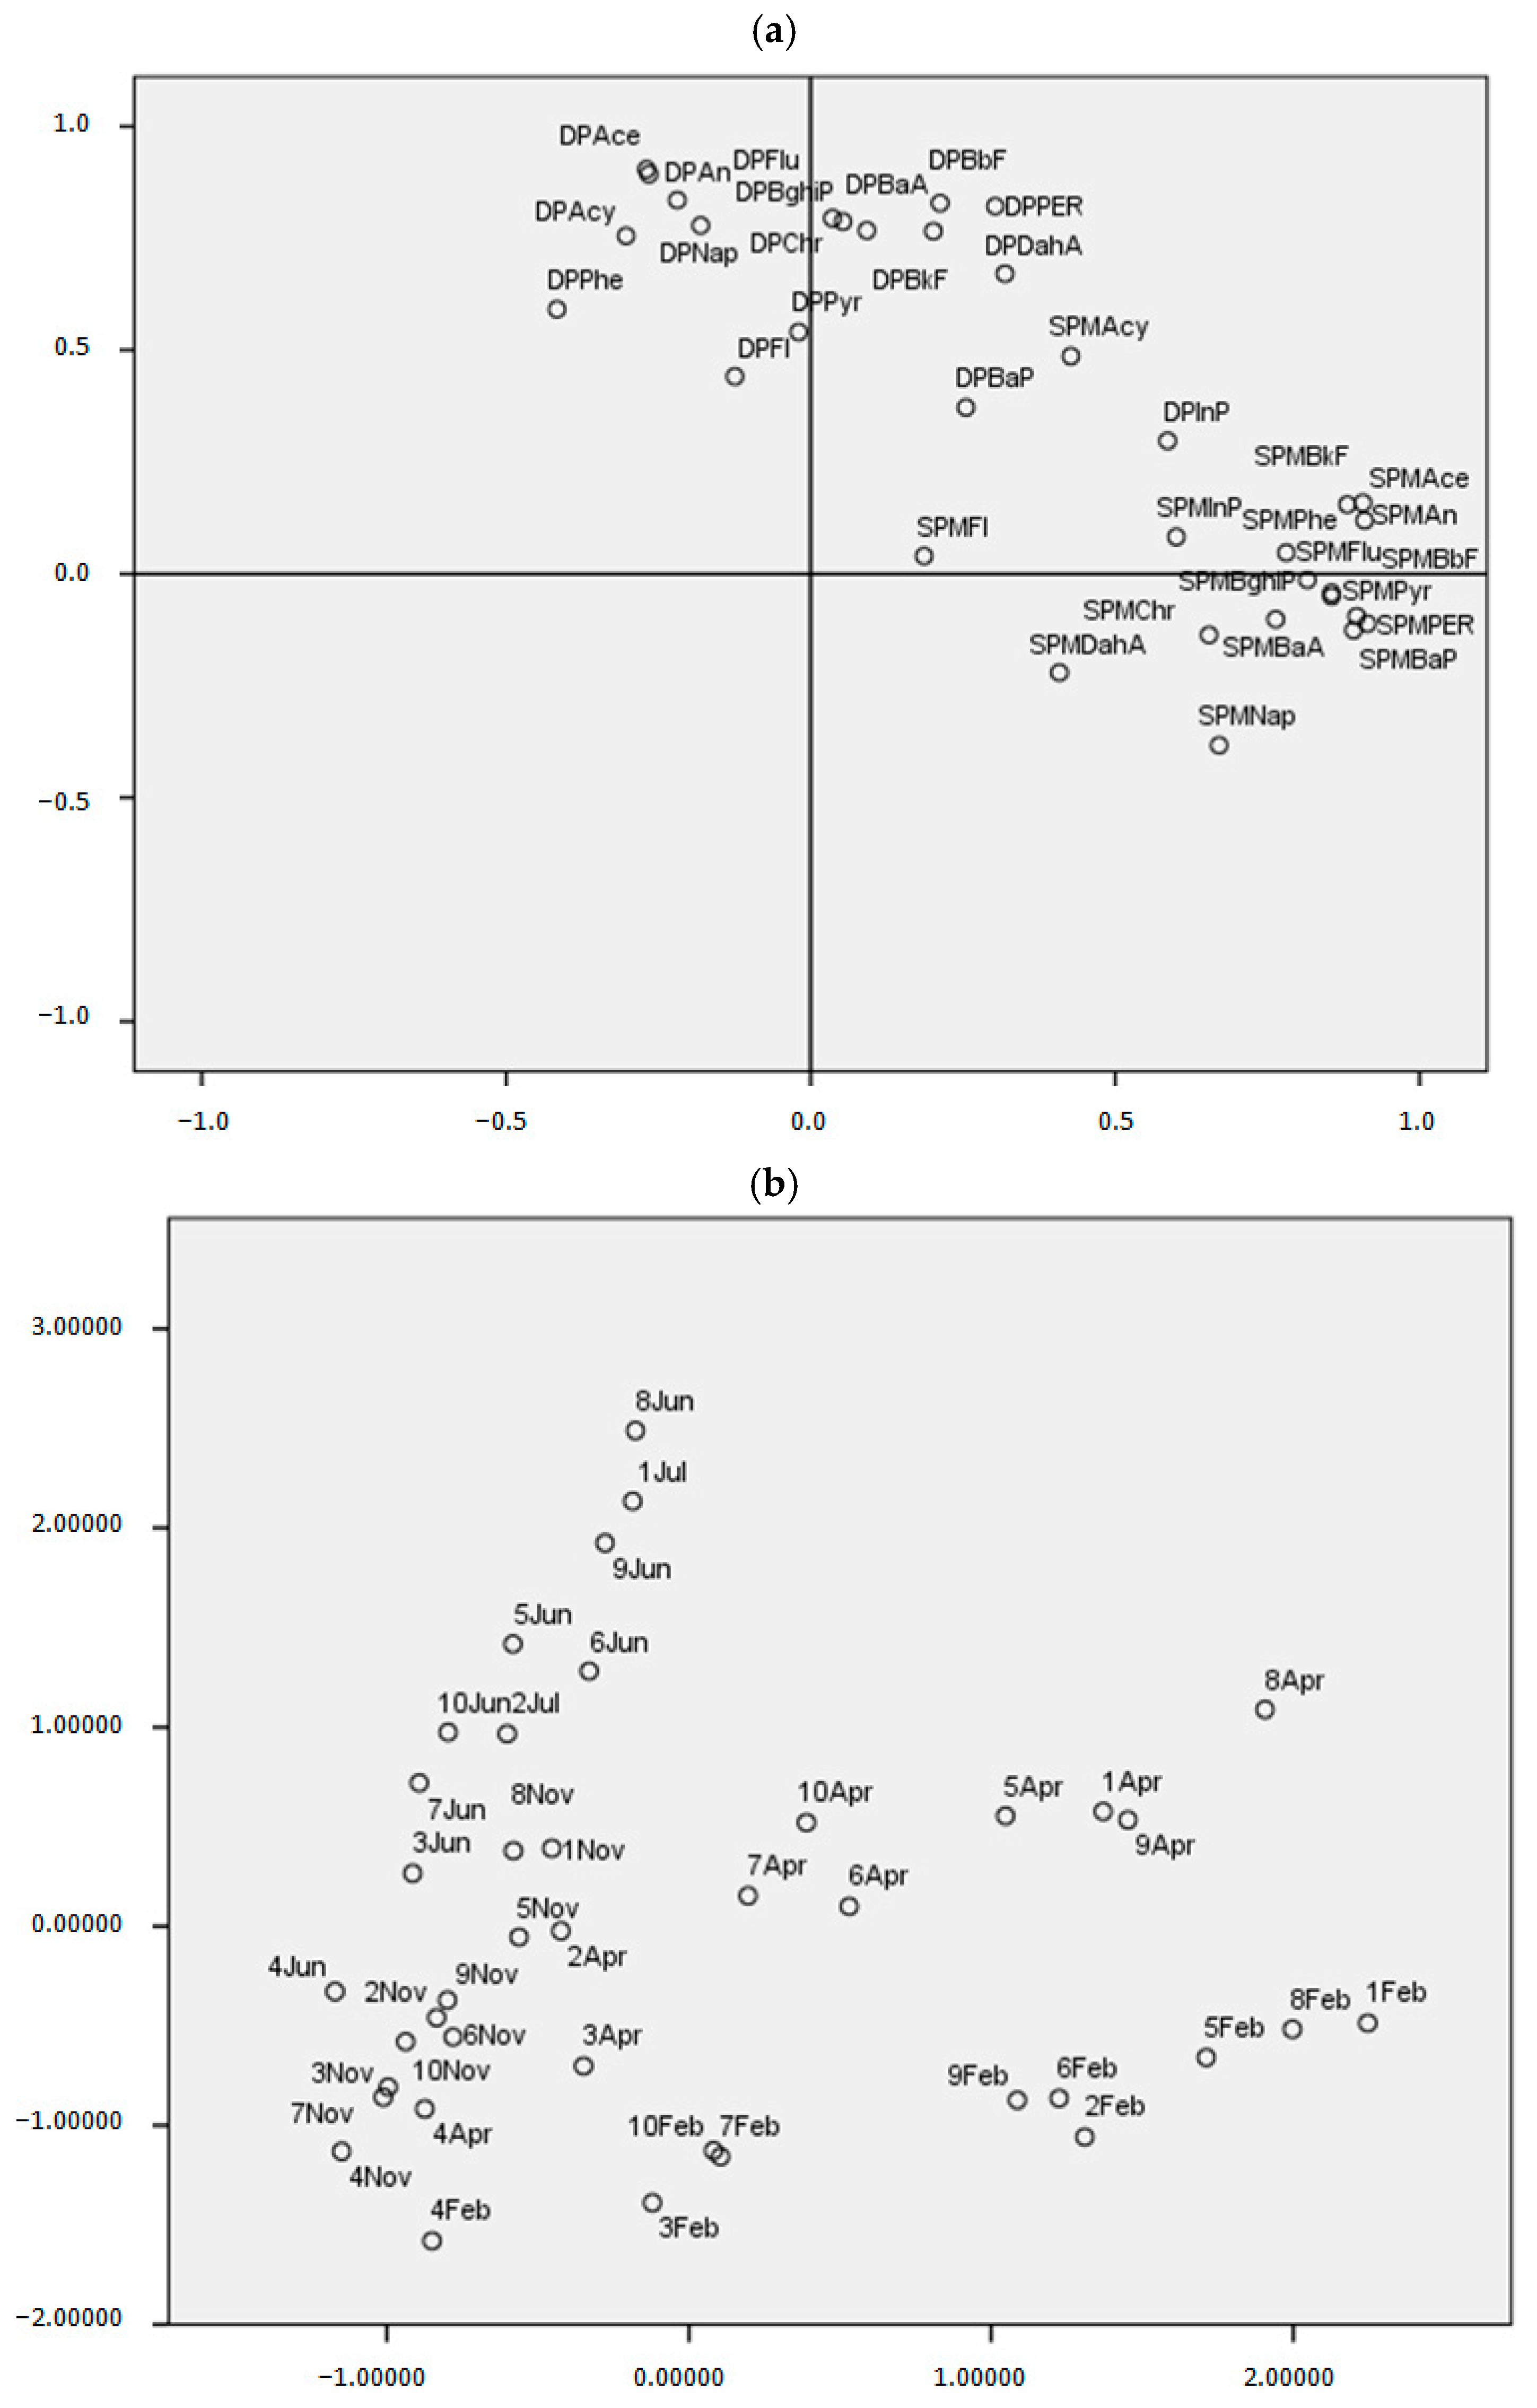
3.4. PAHs Seasonal and Spatial Distribution in DP, SPM, and Sediment Samples

The amount of total PAHs found in water and sediment samples at different sampling locations are reported in Table 1. The ratio of the concentration of ΣPAHs in DP samples to that in SPM was higher than one in all sites (average 2.5; SD ± 1.5), as the result of the greater concentrations of PAHs in DP samples rather than in SPM samples for each site and season. These results were also validated by the analysis of the ratio of the individual PAHs and it was possible to observe the same trend obtained from the reports of the sums.
Rather, the ratio of the concentration of ΣPAHs in the sediment samples (ng g−1) to that in the SPM samples (ng g−1) was below 1 in all sampling locations (average 0.014; range 0.006–0.022; SD ± 0.006), implying that the concentrations of PAHs in SPM samples were higher than those of the sediment samples for each sampling site. Moreover, the results showed that the PAHs concentrations in DPdecreased from July to February, in parallel with the increase in rainfall, which could cause dilution ratio variations. Therefore, the decrease of PAHs concentrations moving from the Volturno River mouthto the Mediterranean Sea is also affected by the high flow in the rainfall season, which results in an even higher dilution ratio.
The lowest concentrations were recorded in the dry season (July), due to the decrease in flow and a greater stagnation of SPM, which led to the shift of PAHs with a greater polarity from SPM to DP.
Finally, the variation in the flow according to the different seasons involved a change in the load and distribution of the PAHs among the DP, SPM, and sediment samples and the higher concentrations of PAHs in SPMs compared to the sediment suggested that the pollution of PAHs which is drained into the Mediterranean Sea is probably due to the fresh input.
The total load of PAHs into the Tyrrhenian Sea was evaluated to estimate the input of PAHs drained from the rainwater outflow, tributary inflow, wastewater treatment plant and industrial effluent discharge, agricultural runoff, atmospheric deposition, and dredged material disposal. The total PAHs loads contribution to the Tyrrhenian Sea from the Volturno River mouth is calculated in about 3158.2 kg/year (calculated by multiplying the average annual flow of 82.1 m3/s and the total PAHs average concentrations found at the Volturno River mouth in April, July, November, and February). The total PAHs loads contribution to the Tyrrhenian Sea from the Volturno River mouth is calculated in about 781.6 kg in the spring season (average flow in the spring season, 76.1 m3/s, multiplied by the total PAHs concentration found at the Volturno River mouth in April), in about 537.5 kg in the summer season (average flow in the summer season, 40.1 m3/s, multiplied by the total PAHs concentration found at the Volturno River mouth in July), in about 1216.5 kg in the autumn season (average flow in the autumn season, 138.1 m3/s, multiplied by the total PAHs concentration found at the Volturno River mouth in November), and in about 625.1 kg in the winter season (average flow in the winter season, 104.2 m3/s, multiplied by the total PAHs concentration found at the Volturno River mouth in February).
The spatial distribution of PAHs in DP, SPM, and sediment samples was evaluated and the concentrations of ΣPAHs are shown in Figure 3, with respect tothe different sampling locations and different seasons, with and without rain. Indeed, the level of contamination of PAHs in the water clearly decreased from location 1 to 4. The total PAHs concentrations decreased to 1219.8 ng L−1 (DP+SPM mean values of four seasons) at location 1 (Volturno River mouth) to 993.8 ng L−1 (DP+SPM mean values of four seasons) at location 2 (500mt from the mouth) to 823.0 ng L−1(DP+SPM mean values of four seasons) at location 3 (1000mt from the mouth), and to 668.0 ng L−1 (DP+SPM mean values of four seasons) at location 4 (1500mt from the mouth). In the Tyrrhenian Sea, PAHs concentrations were higher near river outflows and much lower in offshore areas (Figure 3).
Figure 3 shows that the PAH concentrations estimated at 500mt of the river outflows were comparable to those at the mouth of the Volturno River, while these were lower at 1000 and 1500mt of the river outflows. In particular, at the mouth of the Volturno, the load of PAHs moves into the Tyrrhenian Sea southwards (Figure 3).
In regards to the data obtained, the trend concentrations showed a decreasing movement from the mouth towards 1500mt at sea. This can depend both on the flow of the river which varies according to the season and on the diluting effect of the sea.

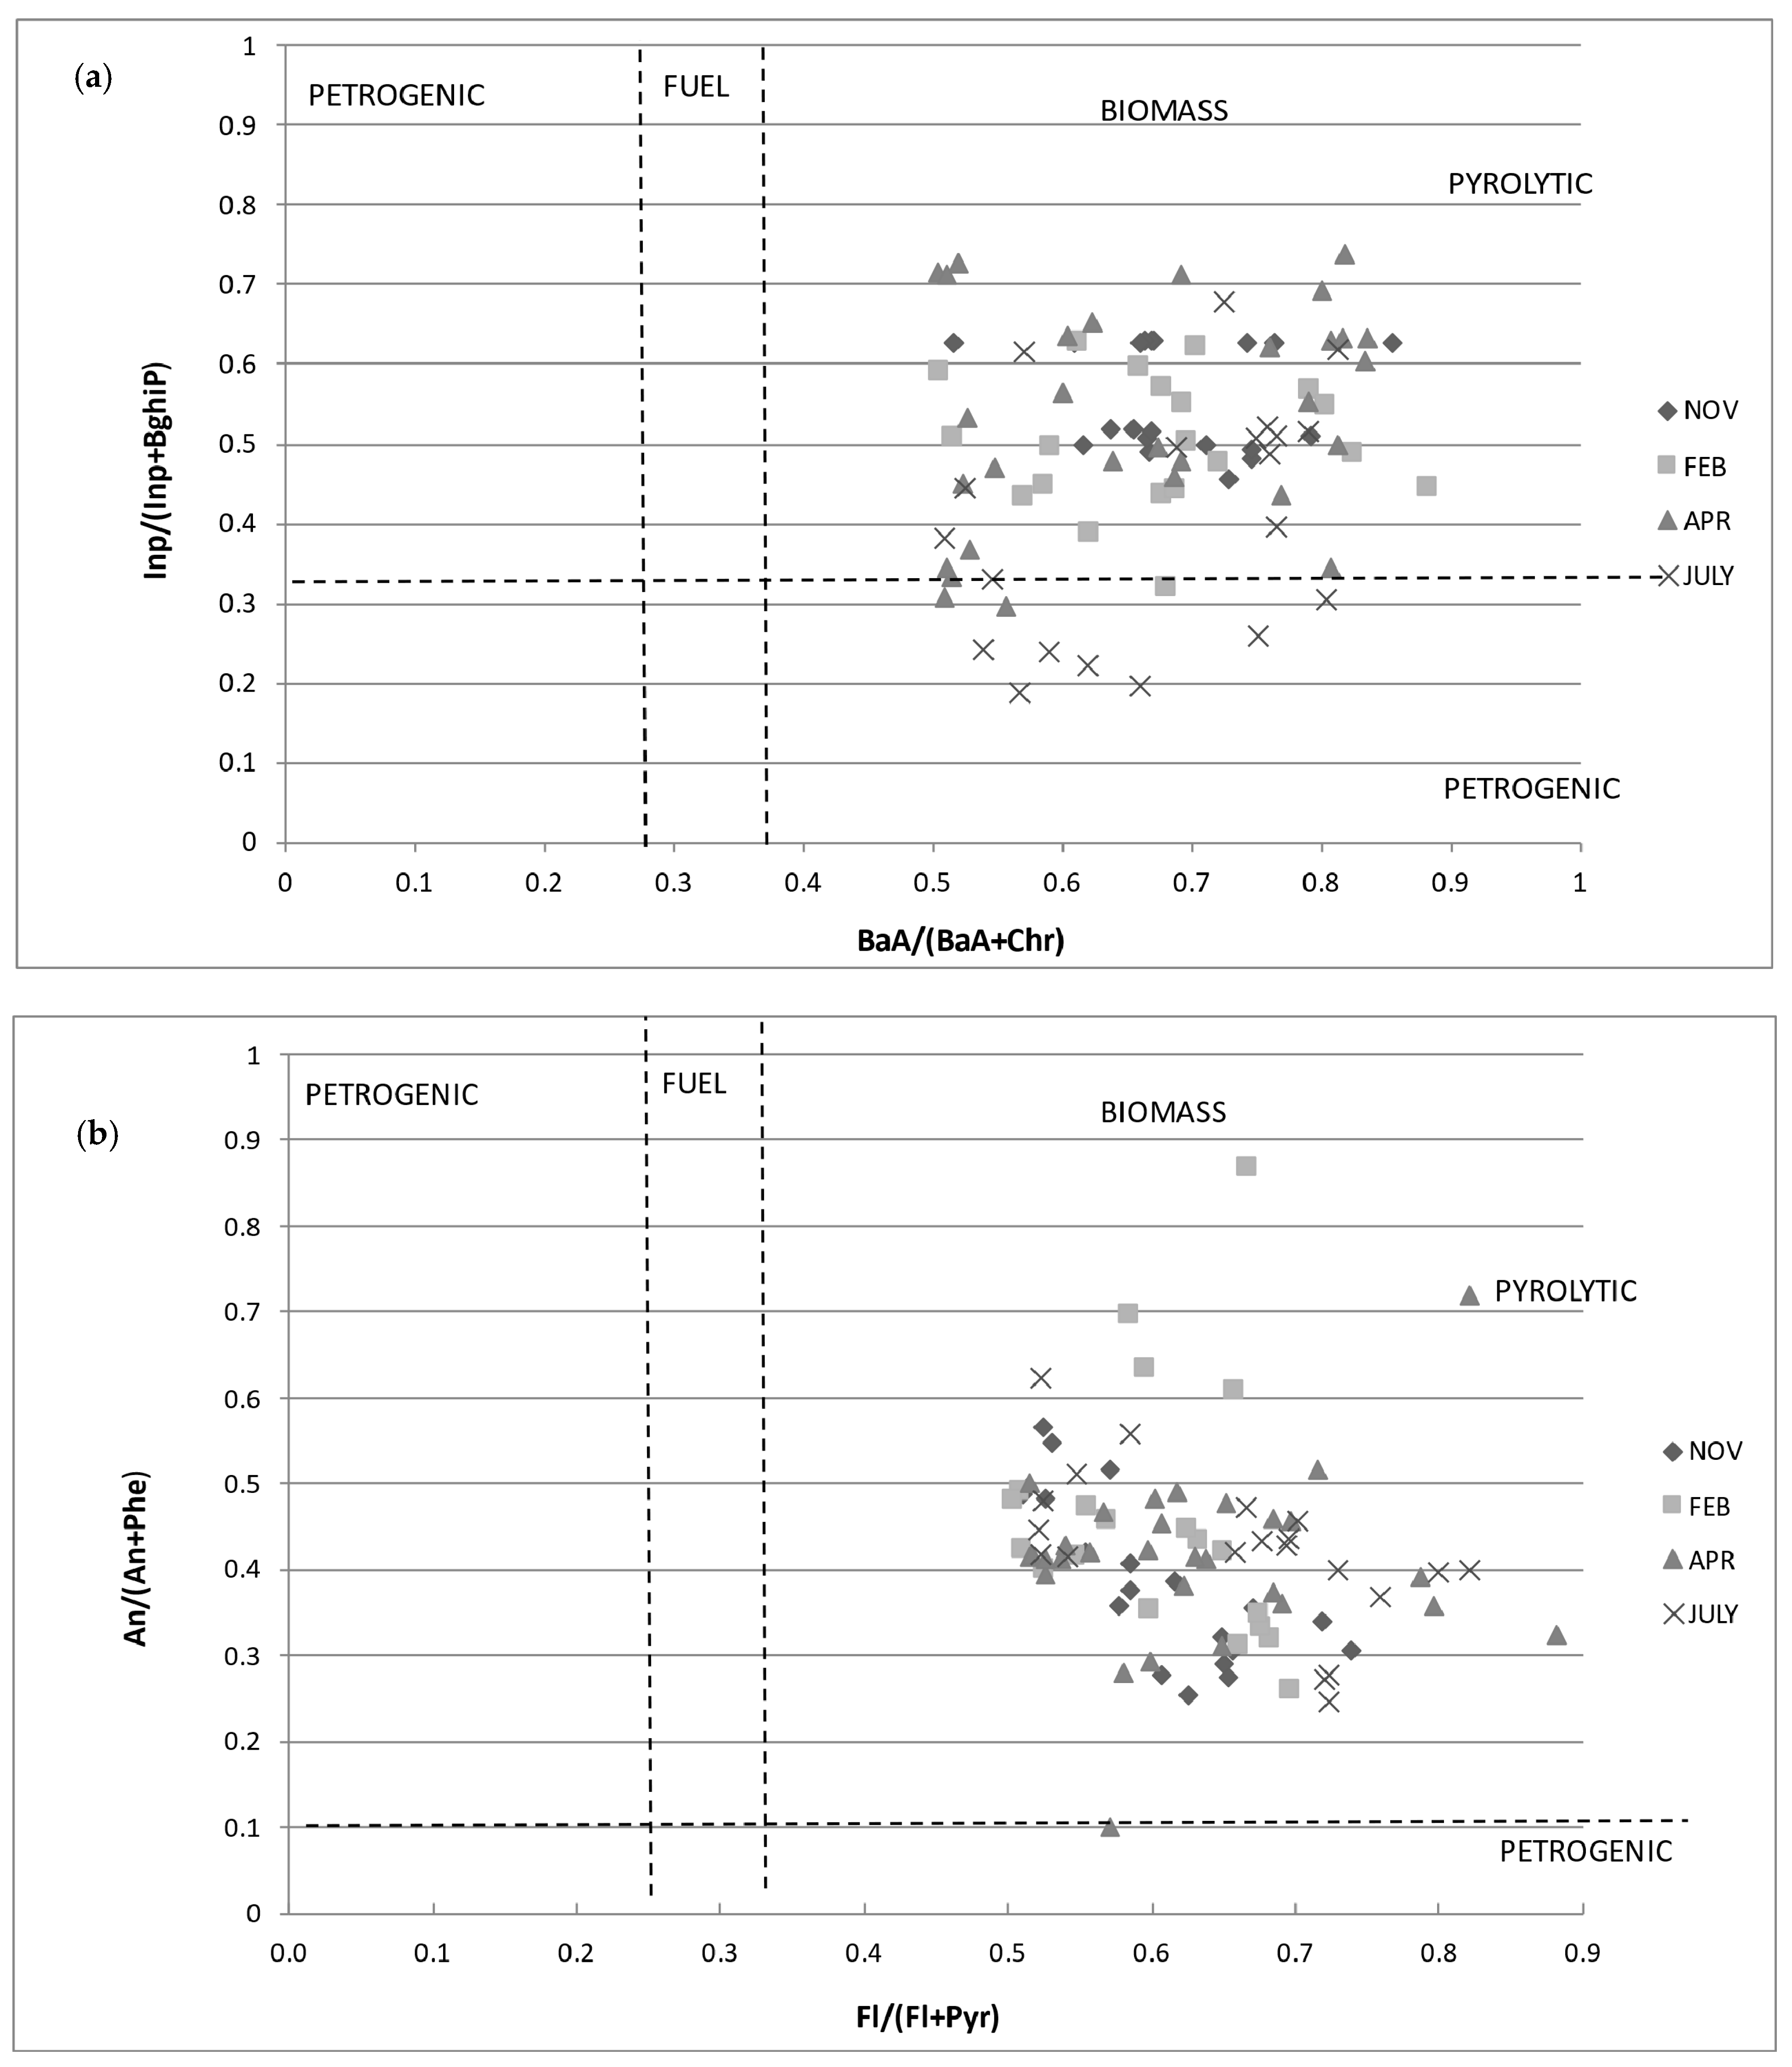
3.5. Source Identification

To analyze the origin of PAHs and identify separately petrogenic from pyrolytic inputs, chemical profiling and different diagnostic ratios on isomeric relations were used: An/(An + Phe), Fl/(Fl + Pyr), BaA/(BaA + Chr), and InP/(InP + BghiP) [13,70]. The pyrolytic sources include combustion of fossil fuels, gasoline or diesel fuel vehicles, carbon black, coal tar pitch, asphalt and petroleum cracking, while the petrogenic sources are about crude oil and petrochemicals (gasoline, diesel fuel, kerosene, and lubricating oil). Finally, apart from the pyrolytic or petrogenic source, PAHs can be formed during diagenetic processes, i.e., the formation of sediments from organic material [6]. Each source (i.e., pyrolytic, petrogenic, and diagenetic) provides typical PAH patterns. Typically, HMW compounds with four or more condensed aromatic rings are more abundant in combustion products, while bi- and tricyclic aromatic compounds (LMW) are more abundant in fossil fuels, which are, moreover, dominated by alkylated derivatives [9,10,11].
The evaluation of the above ratio indicated the prevalence of PAHs pyrolytic inputs from the Volturno River and its Estuary. In particular, the An/(An + Phe) ratio was >0.1 for all the samples (mean 0.42, 0.40, and 0.47, respectively) and this is ascribed to the origin of PAHs to pyrogenic sources. Moreover, Fl/(Fl+Pyr) ratios can distinguish the petroleum input from combustion processes and discriminate among such sources [13,71]. In particular, Fl/(Fl+Pyr) ratios <0.40 suggest petroleum, ratios from 0.40 to 0.50 are indicative of liquid fossil fuel combustion, and ratios >0.50 are typical for grass, wood, or coal combustion. The ratio Fl/(Fl + Pyr) was >0.5 relatively to all the samples, suggesting the variability of the impacts related to urban traffic emissions and biomass combustion (Figure 4a). BaA/(BaA + Chr) and InP/(InP + BghiP) ratios were >0.35 for water and sediments and these are associated, respectively with vehicular emissions and combustion sources (Figure 4b). In addition, the LMW/HMW ratio was evaluated and it was below 1 for most locations, implying a pyrolytic origin of PAHs (mean 0.85; range 0.09–2.99).
These results reflect the contamination conditions in the Volturno River flatland, which is a dense industrial area. Moreover, a widely documented illegal disposal of urban, toxic, and industrial wastes in the Campania region has occurred [17,72]. The industrial wastes enriched with combustion-derived PAHs are directly discharged into the Volturno River. Although none of the industries present in the Volturno River area exceeded the legal limits in terms of emissions to the atmosphere or industrial discharges as reported by the Piano Regione Campania, the industrial emissions could lead to significant air pollution and the PAHs related to the particulate matter could accumulate into the river over time. In addition to these inputs, some other sources such as the roads on both sides of the river and along the coast, the runoff containing street dust, and municipal wastewater, result in the pattern of pyrolytic origins of PAHs contamination in the area. About that, no other rivers in the area adjacent to that of the Volturno River has been considered with regard to the evaluation of the PAHs and for this reason valid comparisons cannot currently be made. However, some rivers have been taken into consideration for the evaluation of the PAHs, even if they are at greater distances from the Volturno River [33,48,73].
In addition to pyrolytic and petrogenic sources, Per may result from diagenesis processes: A high concentration in the sediment may indicate a natural origin of these compounds as Per is a major diagenetic precursor [6,12,70]. In particular, a Per amount above 10% of the total penta-aromatic isomers suggests a possible diagenetic input, while concentrations below 10% indicate a possible pyrolytic origin of the analyte [12,74]. In the present paper, the concentrations of Per identified in all the sediment samples (range 4.3–15.5 ng g−1) contributed less than 2% to the penta-aromatic isomers, suggesting a pyrolytic origin of these compounds.

3.6. A Composite Indicator for Water Pollution

In order to formalize a water pollution composite indicator (WP-CI), we analyzed at the same time the dissolved phase (DP) and suspended particulate phase (SPM) samples collected from 10 sites (“Sou1”, “500N2”, “1000N3”, “1500N4”, “500C5”, “1000C6”, “1500C7”, “500S8”, “1000S9”, “1500S10”) during the months of April, July, November, and February. The correlation matrix points out sets of correlated variables and only the first seven highest Eigenvalue are larger than one. However, according to Cattell’s scree test, we considered the first two components that explain the 60.0% (32.6% and 27.4%, respectively) of the total variance. The PCA for this dataset pointed out a clear distinction of the pollution of the two phases and allowed us to define two specific composite indicators (SCIs). In fact, the first factor is characterized by the presence of PAHs belonging to SPM and we named it “SPM—Composite Indicator”; the second factor is defined by the PAHs of the DP, the second factor is called “DP—Composite Indicator”. Looking at the plot of the first two principal components, and making a correlation between the sites and seasons, we observed that the pollution from SPM is higher in February, in the sites 500N2, 1000C6, 1500C7, 1000S9. However, theDP pollution is higher in July at sites 1500C7 e 1500S10 (Figure 5a,b). For each SCI, it is possible to rank the 40 statistical units and finally it is possible to observe the final ranking based on the WP-CI (Table 3). The site that has a lower rate of global pollution in all seasons of the year is the 4, followed by 3, and then 7. However, just in reference to site 7, there is an irregular behavior of the two parties. In fact, while in November, both SPM and DP appear to have a low level of pollution, in other seasons, the two components have a contrasting behavior. The most polluted months are February and April, especially for the SPM component, on the contrary, the least polluted months are July and November, in particular for the SPM component. The month of February, instead, has a tendency of a lower pollution for the DP, on the contrary, July and April are the months most polluted. Based on these results, it can be confirmed that the load and relocation of PAHs between different phases in each sampling site were related to a variation in the flow during the rainy and dry seasons.

3.7. Risk Assessment

To estimate the potential adverse effects due to PAHs, the sediment quality guidelines (SQGs) values proposed by Long et al. [75] and by MacDonald et al. [76] were used. Sediment quality guidelines (SQGs) are useful to estimate the contamination of the sediment in the marine ecosystem. Two sets of SQGs, including the ERL/ERM and the TEL/PEL values, were applied in this study to assess the toxic effects of individual PAHs in sediments. These sets are defined as: (i) Effect range low (ERL)/effect range median (ERM) and (ii) the threshold effect level (TEL)/probable effect level (PEL). ERLs and TELs represent chemical concentrations below which the probability of toxicity and other effects are rare, while the ERMs and PELs indicate mid-range above which adverse effects are more likely to occur. ERLs-ERMs and TELs-PELs represent a possible-effects range, within which negative effects would occasionally occur [77]. In the analyzed samples, although some concentrations of PAHs detected are above the TEL and ERL values, the amount of PAHs in the sediment samples was significantly lower than the PEL and ERMvalues (Table 4). In particular, TEL values were exceeded for Acy, Ace, and DahA for all the samples, for Nap and Flu in 30%, and for BaP 80%, suggesting that adverse effects might occasionally occur. The concentrations of individual PAHs do not exceed their respective ERM values, but the ERL values exceeded for Flu in 30%, Ace in 70%, and DahA for all the samples. The results indicated that in certain sites, PAHs may have been found and the environmental integrity was at risk of PAHs in the sediments from the study area.
Although compliance with the European Commission—Environmental Quality Standards (EC-EQS) in surface waters is checked using an annual average of monthly whole water (DP + SPM) concentrations [78], our data showed that the mean values of BaP and BkF + BbF concentration (63.9 and 41.2 ng L−1, respectively) were higher than the EQS values (50 and 30 ng L−1, respectively), and the mean value of BghiP + InP values (67.4 ng L−1) was significantly higher than the EQS value of 2 ng L−1, showing that the environmental integrity of the ecosystem was at risk. Moreover, the risk quotient (RQ), the ratio between the measured environmental concentration (MEC) and the predicted no effect concentrations (PNECs), has been calculated. The OSPAR Commission proposed a list of PNECs for several substances, including PAHs. In particular, in the OSPAR Agreement 2014-05, in Table 2, Section 3, PNECs values were reported for single PAHs. According to these values, the ratio between single MEC and PNEC for single PAHs was calculated and as a result, an RQ >1 for most compounds, both for water (sum of DP + SPM) and the sediment, was obtained, confirming that the environmental integrity of the ecosystem was at risk.

4. Conclusions

This research is part of a larger project which brings forth fundamental data on the frequency, distribution, and likely sources of PAHs from the Volturno River and its input into the Tyrrhenian Sea (Central Mediterranean Sea), Southern Italy. LMW-PAHs were abundantly present in the water samples, while in sediment samples, the predominant class were high molecular weight PAHs. The concentration levels of PAHs in DP, SPM, and sediment phases were remarkably different amongst the sampling sites. Contaminant discharges of PAHs into the sea showed that this river should account as one of the main contribution sources of PAHs to the Central Mediterranean Sea. A water pollution composite indicator (WP-CI) as well asan individual diagnostic PAHs ratio revealed that the main PAHs source was pyrolytic and suggested that the majority of this pollution derived for the most part from vehicle traffic and combustion processes. Regarding the risk assessment, even if the concentration of many single PAHs in a number of stations were above ERL and/or TEL (and below ERM and/or PEL), which would on occasion yield negative environmental consequences, the European Commission—Environmental Quality Standards (EC-EQS) and the risk quotient (RQ) indicated that the integrity of this area is possibly at risk. Therefore, the Volturno River waters should be continuously kept under monitor observation, as the PAHs could lead to negative consequences on its aquatic ecosystems and organisms.

Supplementary Materials

The following are available online at https://www.mdpi.com/1660-4601/18/4/1383/s1, Table S1: Environmental data of water samples from sampling sites.

Author Contributions

P.M., A.N., and M.T. designed the research; P.M., E.D.R., F.D.D., and D.P.P. organized and carried out samplings and laboratory analyses; P.S., P.M., and E.D.R. analyzed the data and performed the statistical analysis. All authors have discussed the results and co-written the manuscript. All authors have read and agreed to the published version of the manuscript.

Funding

This study received no funds.

Institutional Review Board Statement

Not applicable.

Informed Consent Statement

Not applicable.

Data Availability Statement

The datasets obtained and analyzed in the current study are available from the corresponding author on a reasonable request.

Conflicts of Interest

The authors declare no conflict of interest.

Ethics Approval and Consent to Participate

Not applicable.

Consent for Publication

Not applicable.

Abbrevations

PAHs: Polycyclic aromatic hydrocarbons; HMW: High molecular weight; LMW: Low molecular weight; SPM: Suspended particulate matter; DP: Dissolved phase; SIM: Single ion monitoring mode; USEPA: US Environmental Protection Agency; Nap: Naphthalene; Acy: Acenaphthylene; Ace: Acenaphthene; Flu: Fluorene; Phe: Phenanthrene; An: Anthracene; Fl: Fluoranthene; Pyr: Pyrene; BaA: Benzo[a]anthracene; Chr: Chrysene; BbF: Benzo[b]fluoranthene; BkF: Benzo[k]fluoranthene; BaP: Benzo[a]pyrene; DahA: Dibenzo[a,h]anthracene; BghiP: Benzo[ghi]perylene; InP: Indeno[1,2,3-cd]pyrene; Per: Perylene; LOD: Limit of detection; LOQ: Limit of quantification; PCA: Principal component analysis; TOC: Total organic carbon; WP-CI: Water pollution composite indicator; SQGs: Sediment quality guidelines; ERL: Effect range low; ERM: Effect range median; TEL: Threshold effect level; PEL: Probable effect level; EQS: Environmental quality standards; RQ: Risk quotient; MEC: Measured environmental concentration; PNECs: Predicted no effect concentrations; OSPAR: Protection of the Marine Environment of the North-East Atlantic.

References

  1. Qin, N.; He, W.; Kong, X.Z.; Liu, W.X.; He, Q.S.; Yang, B.; Ouyang, H.L.; Wang, Q.M.; Xu, F.L. Ecological risk assessment of polycyclic aromatic hydrocarbons (PAHs) in the water from a large Chinese lake based on multiple indicators. Ecol. Indic. 2013, 24, 599–608. [Google Scholar] [CrossRef]
  2. Duodu, G.O.; Ogogo, K.N.; Mummullage, S.; Harden, F.; Goonetilleke, A.; Ayoko, G.A. Source apportionment and risk assessment of PAHs in Brisbane River sediment, Australia. Ecol. Indic. 2017, 73, 784–799. [Google Scholar] [CrossRef]
  3. Yu, W.; Liu, R.; Xu, F.; Shen, Z. Environmental risk assessments and spatial variations of polycyclic aromatic hydrocarbons in surface sediments in Yangtze River Estuary, China. Mar. Pollut. Bull. 2015, 100, 507–515. [Google Scholar] [CrossRef]
  4. Wang, D.; Wang, Y.; Singh, V.P.; Zhu, J.; Jiang, L.; Zeng, D.; Liu, D.; Zeng, X.; Wu, J.; Wang, L.; et al. Ecological and health risk assessment of PAHs, OCPs, and PCBs in Taihu Lake basin. Ecol. Indic. 2018, 92, 171–180. [Google Scholar] [CrossRef]
  5. Egres, G.; Hatje, V.; Miranda, D.A.; Gallucci, F.; Barros, F. Functional response of tropical estuarine benthic assemblages to perturbation by Polycyclic Aromatic Hydrocarbons. Ecol. Indic. 2019, 96, 229–240. [Google Scholar] [CrossRef]
  6. Pérez-Fernández, B.; Viñas, L.; Franco-Hernández, M.; Bargiela, J. PAHs in the Ría de Arousa (NW Spain): A consideration of PAHs sources and abundance. Mar. Pollut. Bull. 2015, 95, 155–165. [Google Scholar] [CrossRef]
  7. Singare, P.U. Studies on polycyclic aromatic hydrocarbons in surface sediments of Mithi River near Mumbai, India: Assessment of sources, toxicity risk and biological impact. Mar. Pollut. Bull. 2015, 101, 232–242. [Google Scholar] [CrossRef]
  8. Sarria-Villa, R.; Ocampo-Duque, W.; Paez, M.I.; Schuhmacher, M. Presence of PAHs in water and sediments of the Colombian Cauca River during heavy rain episodes, and implications for risk assessment. Sci. Total Environ. 2016, 540, 455–465. [Google Scholar] [CrossRef]
  9. Liu, Y.; Beckingham, B.; Ruegner, H.; Li, Z.; Ma, L.; Schwientek, M.; Xie, H.; Zhao, J.; Grathwohl, P. Comparison of Sedimentary PAHs in the Rivers of Ammer (Germany) and Liangtan (China): Differences between Early- and Newly-Industrialized Countries. Environ. Sci. Technol. 2013, 47, 701–709. [Google Scholar] [CrossRef]
  10. Oliva, A.L.; Quintas, P.Y.; La Colla, N.S.; Arias, A.H.; Marcovecchio, J.E. Distribution, Sources, and Potential Ecotoxicological Risk of Polycyclic Aromatic Hydrocarbons in Surface Sediments from Bahía Blanca Estuary, Argentina. Arch. Environ. Contam. Toxicol. 2015, 69, 163–172. [Google Scholar] [CrossRef]
  11. Wu, Y.; Wang, X.; Li, Y.; Ya, M.; Luo, H.; Hong, H. Polybrominated diphenyl ethers, organochlorine pesticides, and polycyclic aromatic hydrocarbons in water from the Jiulong River Estuary, China: Levels, distributions, influencing factors, and risk assessment. Environ. Sci. Pollut. Res. 2015, 24, 8933–8945. [Google Scholar] [CrossRef]
  12. Baumard, P.; Budzinski, H.; Michon, Q.; Garrigues, P.; Burgeot, T.; Bellocq, J. Origin and Bioavailability of PAHs in the Mediterranean Sea from Mussel and Sediment Records. Estuar. Coast. Shelf Sci. 1998, 47, 77–90. [Google Scholar] [CrossRef]
  13. Yunker, M.B.; Macdonald, R.W.; Vingarzan, R.; Mitchell, R.H.; Goyette, D.; Sylvestre, S. PAHs in the Fraser River basin: A critical appraisal of PAH ratios as indicators of PAH source and composition. Org. Geochem. 2002, 33, 489–515. [Google Scholar] [CrossRef]
  14. Legambiente. Rapporto Ecomafia—I Numeri e le Storie Della Criminalità Ambientale Legambiente: Roma, Italy. 2007. Available online: http://www.amblav.it/download/0417_ecomafia_introduzione.pdf (accessed on 31 March 2020).
  15. D’Alisa, G.; Armiero, M.; De Rosa, S.P. Rethink Campania’s toxic-waste scandal. Nat. Cell Biol. 2014, 509, 427. [Google Scholar] [CrossRef] [Green Version]
  16. Esposito, F.; Nardone, A.; Fasano, E.; Scognamiglio, G.; Esposito, D.; Agrelli, D.; Ottaiano, L.; Fagnano, M.; Adamo, P.; Beccaloni, E.; et al. A systematic risk characterization related to the dietary exposure of the population to potentially toxic elements through the ingestion of fruit and vegetables from a potentially contaminated area. A case study: The issue of the “Land of Fires” area in Campania region, Italy. Environ. Pollut. 2018, 243, 1781–1790. [Google Scholar] [CrossRef]
  17. Senior, K.; Mazza, A. Italian “Triangle of death” linked to waste crisis. Lancet Oncol. 2004, 5, 525–527. [Google Scholar] [CrossRef]
  18. Isidori, M.; Lavorgna, M.; Nardelli, A.; Parrella, A. Integrated environmental assessment of Volturno River in South Italy. Sci. Total Environ. 2004, 327, 123–134. [Google Scholar] [CrossRef]
  19. Triassi, M.; Nardone, A.; Giovinetti, M.C.; De Rosa, E.; Canzanella, S.; Sarnacchiaro, P.; Montuori, P. Ecological risk and estimates of organophosphate pesticides loads into the Central Mediterranean Sea from Volturno River, the river of the “Land of Fires” area, southern Italy. Sci. Total Environ. 2019, 678, 741–754. [Google Scholar] [CrossRef]
  20. Moreno, M.; Semprucci, F.; Vezzulli, L.; Balsamo, M.; Fabiano, M.; Albertelli, G. The use of nematodes in assessing ecological quality status in the Mediterranean coastal ecosystems. Ecol. Indic. 2011, 11, 328–336. [Google Scholar] [CrossRef]
  21. Adhikari, P.L.; Mait, K.; Bam, W. Fate of particle-bound polycyclic aromatic hydrocarbons in the river influenced continental margin of the northern Gulf of Mexico. Mar. Pollut. Bull. 2019, 141, 350–362. [Google Scholar] [CrossRef]
  22. Zhou, J.L.; Hong, H.; Zhang, Z.; Maskaoui, K.; Chen, W.J.W.R. Multi-phase distribution of organic micropollutants in Xiamen Harbour, China. Water Res. 2000, 34, 2132–2150. [Google Scholar] [CrossRef]
  23. Kafilzadeh, F.; Shiva, A.H.; Malekpour, R. Determination of polycyclic aromatic hydrocarbons (PAHs) in water and sediments of the Kor River, Iran. Middle East J. Sci. Res. 2011, 10, 1–7. [Google Scholar]
  24. Chen, Y.; Zhu, L.; Zhou, R. Characterization and distribution of polycyclic aromatic hydrocarbon in surface water and sediment from Qiantang River, China. J. Hazard. Mater. 2007, 141, 148–155. [Google Scholar] [CrossRef]
  25. Lin, L.; Dong, L.; Meng, X.; Li, Q.; Huang, Z.; Li, C.; Crittenden, J. Distribution and sources of polycyclic aromatic hydro-carbons and phthalic acid esters in water and surface sediment from the Three Gorges Reservoir. J. Environ. Sci. 2018, 69, 271–280. [Google Scholar] [CrossRef]
  26. Montuori, P.; Triassi, M. Polycyclic aromatic hydrocarbons loads into the Mediterranean Sea: Estimate of Sarno River inputs. Mar. Pollut. Bull. 2012, 64, 512–520. [Google Scholar] [CrossRef] [Green Version]
  27. USEPA (US Environmental Protection Agency). Regional Screening Levels for Chemical Contaminants at Superfund Sites. Regional Screening Table. User’s Guide. 2012. Available online: https://www.ncbi.nlm.nih.gov/pmc/articles/PMC2713671/ (accessed on 31 March 2020).
  28. UNEP/MAP. Guidelines for River (Including Estuaries) Pollution Monitoring Programme for the Mediterranean Region; MAP Technical Reports Series No. 151; UNEP/MAP: Athens, Greece, 2004. [Google Scholar]
  29. Walling, D.E.; Webb, B.W. Estimating the discharge of contaminants to coastal waters by rivers: Some cautionary comments. Mar. Pollut. Bull. 1985, 16, 488–492. [Google Scholar] [CrossRef]
  30. HELCOM. Second Baltic Sea Pollution Load Compilation; Baltic Sea Environment Proceedings No. 45; Baltic Marine Environment Protection Commission: Helsinki, Finland, 1993. [Google Scholar]
  31. Steen, R.J.C.A.; Van Der Vaart, J.; Hiep, M.; Van Hattum, A.; Cofino, W.; Brinkman, U. Gross fluxes and estuarine behaviour of pesticides in the Scheldt Estuary (1995–1997). Environ. Pollut. 2001, 115, 65–79. [Google Scholar] [CrossRef]
  32. Gómez-Gutiérrez, A.I.; Jover, E.; Bodineau, L.; Albaigés, J.; Bayona, J.M. Organic contaminant loads into the Western Mediterranean Sea: Estimate of Ebro River inputs. Chemosphere 2006, 65, 224–236. [Google Scholar] [CrossRef]
  33. Montuori, P.; Aurino, S.; Nardone, A.; Cirillo, T.; Triassi, M. Spatial distribution and partitioning of organophosphates pesticide in water and sediment from Sarno River and Estuary, Southern Italy. Environ. Sci. Pollut. Res. 2015, 22, 8629–8642. [Google Scholar] [CrossRef] [Green Version]
  34. Montuori, P.; Aurino, S.; Garzonio, F.; Sarnacchiaro, P.; Polichetti, S.; Nardone, A.; Triassi, M. Estimates of Tiber River organophosphate pesticide loads to the Tyrrhenian Sea and ecological risk. Sci. Total Environ. 2016, 559, 218–231. [Google Scholar] [CrossRef] [Green Version]
  35. Pearson, K. On lines and planes of closest fit to systems of points in space. Lond. Edinb. Dublin Philos. Mag. J. Sci. 1901, 2, 559–572. [Google Scholar] [CrossRef] [Green Version]
  36. Hotelling, H. Analysis of a complex of statistical variables into principal components. J. Educ. Psychol. 1933, 24, 417–441. [Google Scholar] [CrossRef]
  37. Guttman, L. Some necessary conditions for common-factor analysis. Psychometrika 1954, 19, 149–161. [Google Scholar] [CrossRef]
  38. Kaiser, H.F. The Application of Electronic Computers to Factor Analysis. Educ. Psychol. Meas. 1960, 20, 141–151. [Google Scholar] [CrossRef]
  39. Yeomans, K.A.; Golder, P.A. The Guttman-Kaiser Criterion as a Predictor of the Number of Common Factors. J. R. Stat. Soc. Ser. D 1982, 31, 221. [Google Scholar] [CrossRef]
  40. Kim, L.; Jeon, H.J.; Kim, Y.C.; Yang, S.H.; Choi, H.; Kim, T.O.; Lee, S.E. Monitoring polycyclic aromatic hydrocarbon concentrations and distributions in rice paddy soils from Gyeonggi-do, Ulsan, and Pohang. Appl. Biol. Chem. 2019, 62, 18. [Google Scholar] [CrossRef] [Green Version]
  41. Edokpayi, J.N.; Odiyo, J.O.; Popoola, O.E.; Msagati, T.A.M. Determination and Distribution of Polycyclic Aromatic Hydrocarbons in Rivers, Sediments and Wastewater Effluents in Vhembe District, South Africa. Int. J. Environ. Res. Public Health 2016, 13, 387. [Google Scholar] [CrossRef] [Green Version]
  42. Zakaria, M.P.; Mahat, A.A. Distribution of polycyclic aromatic hydrocarbon (PAHs) in sediments in the Langat Estuary. Coast. Mar. Sci. 2006, 30, 387–395. [Google Scholar]
  43. Deng, H.; Peng, P.; Huang, W.; Song, J. Distribution and loadings of polycyclic aromatic hydrocarbons in the Xijiang River in Guangdong, South China. Chemosphere 2006, 64, 1401–1411. [Google Scholar] [CrossRef]
  44. Li, G.; Xia, X.; Yang, Z.; Wang, R.; Voulvoulis, N. Distribution and sources of polycyclic aromatic hydrocarbons in the middle and lower reaches of the Yellow River, China. Environ. Pollut. 2006, 144, 985–993. [Google Scholar] [CrossRef]
  45. Ma, W.-L.; Liu, L.-Y.; Qi, H.; Zhang, Z.-F.; Song, W.-W.; Shen, J.-M.; Chen, Z.-L.; Ren, N.-Q.; Grabuski, J.; Zhang, Z.-F. Polycyclic aromatic hydrocarbons in water, sediment and soil of the Songhua River Basin, China. Environ. Monit. Assess. 2013, 185, 8399–8409. [Google Scholar] [CrossRef] [PubMed]
  46. Moeckel, C.; Monteith, D.T.; Llewellyn, N.R.; Henrys, P.A.; Pereira, M.G. Relationship between the Concentrations of Dissolved Organic Matter and Polycyclic Aromatic Hydrocarbons in a Typical U.K. Upland Stream. Environ. Sci. Technol. 2013, 48, 130–138. [Google Scholar] [CrossRef] [PubMed] [Green Version]
  47. Siemers, A.-K.; Mänz, J.S.; Palm, W.-U.; Ruck, W.K. Development and application of a simultaneous SPE-method for polycyclic aromatic hydrocarbons (PAHs), alkylated PAHs, heterocyclic PAHs (NSO-HET) and phenols in aqueous samples from German Rivers and the North Sea. Chemosphere 2015, 122, 105–114. [Google Scholar] [CrossRef] [PubMed]
  48. Patrolecco, L.; Ademollo, N.; Capri, S.; Pagnotta, R.; Polesello, S. Occurrence of priority hazardous PAHs in water, suspended particulate matter, sediment and common eels (Anguilla anguilla) in the urban stretch of the River Tiber (Italy). Chemosphere 2010, 81, 1386–1392. [Google Scholar] [CrossRef]
  49. Guo, W.; He, M.; Yang, Z.; Lin, C.; Quan, X.; Men, B. Distribution, partitioning and sources of polycyclic aromatic hydrocarbons in Daliao River water system in dry season, China. J. Hazard. Mater. 2009, 164, 1379–1385. [Google Scholar] [CrossRef]
  50. Zhao, X.; Qiu, H.; Zhao, Y.; Shen, J.; Chen, Z.; Chen, J. Distribution of polycyclic aromatic hydrocarbons in surface water from the upper reach of the Yellow River, Northwestern China. Environ. Sci. Pollut. Res. 2015, 22, 6950–6956. [Google Scholar] [CrossRef]
  51. Zhao, X.; Ding, J.; You, H. Spatial distribution and temporal trends of polycyclic aromatic hydrocarbons (PAHs) in water and sediment from Songhua River, China. Environ. Geochem. Health 2014, 36, 131–143. [Google Scholar] [CrossRef]
  52. Zheng, B.; Wang, L.; Lei, K.; Nan, B. Distribution and ecological risk assessment of polycyclic aromatic hydrocarbons in water, suspended particulate matter and sediment from Daliao River estuary and the adjacent area, China. Chemosphere 2016, 149, 91–100. [Google Scholar] [CrossRef]
  53. Malik, A.; Verma, P.; Singh, A.K.; Singh, K.P. Distribution of polycyclic aromatic hydrocarbons in water and bed sediments of the Gomti River, India. Environ. Monit. Assess. 2010, 172, 529–545. [Google Scholar] [CrossRef]
  54. Santana, J.L.; Massone, C.G.; Valdés, M.; Vazquez, R.; Lima, L.A.; Olivares-Rieumont, S. Occurrence and Source Appraisal of Polycyclic Aromatic Hydrocarbons (PAHs) in Surface Waters of the Almendares River, Cuba. Arch. Environ. Contam. Toxicol. 2015, 69, 143–152. [Google Scholar] [CrossRef]
  55. Adeniji, A.O.; Okoh, O.O.; Okoh, A.I. Levels of Polycyclic Aromatic Hydrocarbons in the Water and Sediment of Buffalo River Estuary, South Africa and Their Health Risk Assessment. Arch. Environ. Contam. Toxicol. 2019, 76, 657–669. [Google Scholar] [CrossRef] [PubMed] [Green Version]
  56. Sun, J.H.; Wang, G.L.; Chai, Y.; Zhang, G.; Li, J.; Feng, J. Distribution of polycyclic aromatic hydrocarbons (PAHs) in Henan Reach of the Yellow River, Middle China. Ecotoxicol. Environ. Saf. 2009, 72, 1614–1624. [Google Scholar] [CrossRef] [PubMed]
  57. Nagy, A.S.; Szabó, J.; Vass, I. Occurrence and distribution of polycyclic aromatic hydrocarbons in surface water and sediments of the Danube River and its tributaries, Hungary. J. Environ. Sci. Health Part A 2014, 49, 1134–1141. [Google Scholar] [CrossRef] [PubMed]
  58. Berrojalbiz, N.; Dachs, J.; Ojeda, M.J.; Valle, M.C.; Castro-Jiménez, J.; Wollgast, J.; Ghiani, M.; Hanke, G.; Zaldivar, J.M. Biogeochemical and physical controls on concentrations of polycyclic aromatic hydrocarbons in water and plankton of the Mediterranean and Black Seas. Glob. Biogeochem. Cycles 2011, 25. [Google Scholar] [CrossRef] [Green Version]
  59. Marrucci, A.; Marras, B.; Campisi, S.S.; Schintu, M. Using SPMDs to monitor the seawater concentrations of PAHs and PCBs in marine protected areas (Western Mediterranean). Mar. Pollut. Bull. 2013, 75, 69–75. [Google Scholar] [CrossRef] [PubMed]
  60. Wang, Y.B.; Liu, C.W.; Kao, Y.H.; Jang, C.-S. Characterization and risk assessment of PAH-contaminated river sediment by using advanced multivariate methods. Sci. Total Environ. 2015, 525, 63–73. [Google Scholar] [CrossRef] [PubMed]
  61. Zhao, X.; Jin, H.; Ji, Z.; Li, D.; Kaw, H.Y.; Chen, J.; Xie, Z.; Zhang, T. PAES and PAHs in the surface sediments of the East China Sea: Occurrence, distribution and influence factors. Sci. Total Environ. 2020, 703, 134763. [Google Scholar] [CrossRef]
  62. Liu, B.; Liu, Y.; Bu, Q.; Cao, H.; Zhang, H.; Liu, C.; He, X.; Yun, M. Polycyclic Aromatic Hydrocarbons in Surface Water from Wuhai and Lingwu Sections of the Yellow River: Concentrations, Sources, and Ecological Risk. J. Chem. 2020, 2020, 1–8. [Google Scholar] [CrossRef]
  63. Minissi, S.; Caccese, D.; Passafiume, F.; Grella, A.; Ciccotti, E.; Rizzoni, M. Mutagenicity (micronucleus test in Vicia faba root tips), polycyclic aromatic hydrocarbons and heavy metal content of sediments collected in Tiber river and its tributaries within the urban area of Rome. Mutat. Res. Toxicol. Environ. Mutagen. 1998, 420, 77–84. [Google Scholar] [CrossRef] [Green Version]
  64. Cavalcante, R.M.; Sousa, F.W.; Nascimento, R.F.; Silveira, E.R.; Freire, G.S. The impact of urbanization on tropical mangroves (Fortaleza, Brazil): Evidence from PAH distribution in sediments. J. Environ. Manag. 2009, 91, 328–335. [Google Scholar] [CrossRef]
  65. Kanzari, F.; Syakti, A.D.; Asia, L.; Malleret, L.; Piram, A.; Mille, G.; Doumenq, P. Distributions and sources of persistent organic pollutants (aliphatic hydrocarbons, PAHs, PCBs and pesticides) in surface sediments of an industrialized urban river (Huveaune), France. Sci. Total Environ. 2014, 478, 141–151. [Google Scholar] [CrossRef] [PubMed]
  66. Kanzari, F.; Asia, L.; Syakti, A.D.; Piram, A.; Malleret, L.; Mille, G.; Doumenq, P. Distribution and risk assessment of hydrocarbons (aliphatic and PAHs), polychlorinated biphenyls (PCBs), and pesticides in surface sediments from an agricultural river (Durance) and an industrialized urban lagoon (Berre lagoon), France. Environ. Monit. Assess. 2015, 187, 1–12. [Google Scholar] [CrossRef] [PubMed]
  67. Abdel-Shafy, H.I.; Mansour, M.S.M. A review on polycyclic aromatic hydrocarbons: Source, environmental impact, effect on human health and remediation. Egypt. J. Pet. 2016, 25, 107–123. [Google Scholar] [CrossRef] [Green Version]
  68. Liu, Z.; He, L.; Lu, Y.; Su, J.; Song, H.; Zeng, X.; Yu, Z. Distribution, source, and ecological risk assessment of polycyclic aromatic hydrocarbons (PAHs) in surface sediments from the Hun River, northeast China. Environ. Monit. Assess. 2015, 187, 1–10. [Google Scholar] [CrossRef] [PubMed] [Green Version]
  69. Li, J.; Dong, H.; Zhang, D.; Han, B.; Zhu, C.; Liu, S.; Liu, X.; Ma, Q.; Li, X. Sources and ecological risk assessment of PAHs in surface sediments from Bohai Sea and northern part of the Yellow Sea, China. Mar. Pollut. Bull. 2015, 96, 485–490. [Google Scholar] [CrossRef] [PubMed]
  70. Tobiszewski, M.; Namieśnik, J. PAH diagnostic ratios for the identification of pollution emission sources. Environ. Pollut. 2012, 162, 110–119. [Google Scholar] [CrossRef] [PubMed]
  71. Ekpo, B.O.; Oyo-Ita, O.E.; Oros, D.R.; Simoneit, B.R.T. Distributions and sources of polycyclic aromatic hydrocarbons in surface sediments from the Cross River estuary, S.E. Niger Delta, Nigeria. Environ. Monit. Assess. 2011, 184, 1037–1047. [Google Scholar] [CrossRef]
  72. Mazza, A.; Piscitelli, P.; Falco, A.; Santoro, M.L.; Colangelo, M.; Imbriani, G.; Idolo, A.; De Donno, A.; Iannuzzi, L.; Colao, A. Heavy Environmental Pressure in Campania and Other Italian Regions: A Short Review of Available Evidence. Int. J. Environ. Res. Public Health 2018, 15, 105. [Google Scholar] [CrossRef] [Green Version]
  73. Arienzo, M.; Albanese, S.; Lima, A.; Cannatelli, C.; Aliberti, F.; Cicotti, F.; Qi, S.; De Vivo, B. Assessment of the concentrations of polycyclic aromatic hydrocarbons and organochlorine pesticides in soils from the Sarno River basin, Italy, and ecotoxicological survey by Daphnia magna. Environ. Monit. Assess. 2015, 187, 1–14. [Google Scholar] [CrossRef] [Green Version]
  74. Wakeham, S.G.; Canuel, E.A. Biogenic polycyclic aromatic hydrocarbons in sediments of the San Joaquin River in California (USA), and current paradigms on their formation. Environ. Sci. Pollut. Res. 2015, 23, 10426–10442. [Google Scholar] [CrossRef]
  75. Long, E.R.; MacDonald, D.D.; Smith, S.L.; Calder, E.D. Incidence of adverse biological effects within ranges of chemical concentrations in marine and estuarine sediments. Environ. Manag. 1995, 19, 81–97. [Google Scholar] [CrossRef]
  76. Macdonald, D.D.; Carr, R.S.; Calder, F.D.; Long, E.R.; Ingersoll, C.G. Development and evaluation of sediment quality guidelines for Florida coastal waters. Ecotoxicology 1996, 5, 253–278. [Google Scholar] [CrossRef]
  77. Adeleye, A.O.; Jin, H.; Di, Y.; Li, D.; Chen, J.; Ye, Y. Distribution and ecological risk of organic pollutants in the sediments and seafood of Yangtze Estuary and Hangzhou Bay, East China Sea. Sci. Total Environ. 2016, 541, 1540–1548. [Google Scholar] [CrossRef] [PubMed]
  78. Directive 2008/105/EC of the European Parliament and of the Council of 16 December 2008 on Environmental Quality Standards in the Field of Water policy, Amending and Subsequently Repealing Council Directives 82/176/EEC, 83/513/EEC, 84/156/ EEC, 84/491/EEC, 86/280/EEC and amending Directive 2000/60/EC of the European Parliament and of the Council. Off. J. Eur. Union 2008, 348, 84–97. Available online: https://eur-lex.europa.eu/legal-content/EN/ALL/?uri=celex%3A32008L0105 (accessed on 22 December 2020).
Figure 1. Map of the study area and sampling sites in the Volturno River and Estuary, Southern Italy. Source: Google Earth.
Ijerph 18 01383 g001
Figure 2. Relationship between the total organic carbon (%TOC) and ΣPAHs in the sediment samples of the Volturno River.
Ijerph 18 01383 g002
Figure 3. Spatial and temporal concentration of PAHs in the water dissolved phase (DP, ng L−1), suspended particulate matter (SPM, ng L−1), and sediments (ng g−1 dry wt) of the Volturno River and Estuary, Southern Italy.
Ijerph 18 01383 g003
Figure 4. (a) Cross plots of the values of Fl/(Fl + Pyr) versus An/(An + Phe) and (b) BaA/(BaA + Chr) versus InP/(InP + BghiP) for all the samples data of the Volturno River and its Estuary.
Ijerph 18 01383 g004
Figure 5. (a) Principal component analysis of the DP and SPM data of the Volturno River. Score plot for the first and second principal component. (b) Principal component analysis of the DP and SPM data of the Volturno River. The loading plot for the first and second principal component.
Ijerph 18 01383 g005
Table 1. Description of the sampling sites and concentration of polycyclic aromatic hydrocarbons (PAHs) in the water dissolved phase (DP), suspended particulate matter (SPM), and the sediments of the Volturno River, Southern Italy.
Sampling LocationΣPAHs
Site Number
Identification
Site
Characteristics
Site
Location
Dissolved Phase
(ng L−1)
Particulate Phase (ng L−1) (ng g−1 dry wt)Sediments
(ng g−1 dry wt)
AprJulNovFebAprJulNovFebApr
1
(river water)
Volturno River Source40°48′54.03″ N
14°36′45.36″ E
919.81429.1865.1318.1401.1
(49,334.1)
257.1
(26,324.6)
243.8
(21,499.3)
444.9
(155,032)
872.1
2
(sea water)
River Mouth
at 500mt North
40°46′42.73″ N
14°34′00.48″ E
604.0987.5571.1197.8332.3
(35,892.9)
221.8
(118,021.2)
183.3
(5907.4)
381.0
(3253.1)
637.2
3
(sea water)
River Mouth
at 500mt Central
40°46′00.34″ N
14°33′10.68″ E
726.91020.9708.8329.4372.3
(94,015.7)
225.1
(79,558.8)
214.5
(68,758.0)
400.9
(134,546)
777.5
4
(sea water)
River Mouthat 500mt South40°43′42.62″ N
14°28′07.89″ E
783.31246.2813.3332.4387.9
(38,000.5)
241.8
(226,017.2)
225.0
(6516.6)
417.2
(3902.2)
822.2
5
(sea water)
River Mouth
at 1000mt North
40°43′40.11″ N
14°28′06.45″ E
496.6797.4436.2120.8243.9
(32,792.5)
194.3
(13,512.9)
167.2
(12,661.5)
267.7
(2644.7)
514.1
6
(sea water)
River Mouth
at 1000mt Central
40°43′42.46″ N
14°28′05.03″ E
627.3923.6548.9248.1328.7
(114,934.8)
214.7
(71,336)
193.2
(67,336.9)
361.1
(118,028)
686.5
7
(sea water)
River Mouth
at 1000mt South
40°43′45.09″ N
14°28′05.17″ E
602.71111.2611.5262.1361.7
(41,484.5)
218.7
(14,888.4)
185.7
(9221.1)
351.7
(2946.8)
640.1
8
(sea water)
River Mouth
at 1500mt North
40°43′35.68″ N
14°28′02.94″ E
375.4612.4295.264.3204.2
(20,348.5)
179.0
(10,706.3)
149.3
(7564.9)
192.3
(60,683.0)
434.8
9
(sea water)
River Mouth
at 1500mt Central
40°43′42.25″ N
14°27′59.97″ E
482.8831.7445.3174.9268.6
(86,952.9)
197.9
(66,193.6)
169.5
(60,767.3)
269.1
(91,871)
560.4
10
(sea water)
River Mouth
at 1500mt South
40°43′49.26″ N
14°27′59.82″ E
545.8911.9519.5206.0275.0
(97,525.2)
194.1
(16,159.0)
173.1
(4485.7)
277.9
(97,859.7)
646.3
Table 2. Concentration ranges and mean value of PAHs in the water dissolved phase (DP), suspended particulate matter (SPM), and sediments from recent studies of different rivers and estuaries in the world.
AreaReferencesNumber PAHsRange ∑PAHsMean ∑PAHs
Water (ng L−1)
Xijiang River, ChinaDeng et al. [43]1521.7–138.0-
Yellow River, ChinaLi et al. [44]15179.0–369.0248.2
Daliao River, ChinaGuo et al. [49]18570.2–2318.6-
Henan Reach of Yellow River, ChinaSun et al. [56]16144.3–2361.0662.0
Songhua River, ChinaMa et al. [45]1514.0–161.033.9
Yellow River, ChinaZhao et al. [50]16548.0–2598.01375.0
Songhua River, ChinaZhao et al. [51]16163.5–2746.2934.6
Daliao River estuary, ChinaZheng et al. [52]1671.1–4255.4748.8
Gomti River, IndiaMalik et al. [53]1660–84,210.010,330.0
Cauca River, ColombiaSarria-Villa et al. [8]1252.1–12,888.22344.5
Almendares River, CubaSantana et al. [54]14836.0–15,811.02512.0
Buffalo River Estuary, South AfricaAdeniji et al. [55]16ND-24,910-
Wyre River, EnglandMoeckel et al. [46]282.7–20.0-
Elbe and Weser Rivers, GermanySiemers et al. [47]1610.0–40.0-
Danube River, HungaryNagy et al. [57]1625.0–1208.0122.6
Tiber River, ItalyPatrolecco et al. [48]623.9–72.043.4
Tiber River, ItalyMontuori et al. [34]171.75–607.4890.46
Sarno River, ItalyMontuori and Triassi [26]1712.4–2321.1739
Xijiang River, ChinaDeng et al. [43]151.4–58.129.8
Yellow River, ChinaLi et al. [44]1354.0–155.0*-
Daliao River, ChinaGuo et al. [49]18151.0–28,483.8-
Henan Reach of Yellow River, ChinaSun et al. [56]16506.6–10,510.0*4100.0 *
Songhua River, ChinaMa et al. [45]159.21–83.126.4
Yellow River, ChinaZhao et al. [50]161502.0–11,562.0*5591.0 *
Daliao River estuary, ChinaZheng et al. [52]161969.9–11,612.24015.7
Tiber River, ItalyPatrolecco et al. [48]637.6–353.0
Tiber River, ItalyMontuori et al. [34]174.53–473.39111.51
Sarno River, ItalyMontuori and Triassi [26]176.1–778.9-
Yellow River, ChinaLi et al. [44]1331.0–133.076.8
Daliao River, ChinaGuo et al. [49]18102.9–3419.2-
Henan Reach of Yellow River, ChinaSun et al. [56]1616.4–1358.0182.0
Yellow River, ChinaZhao et al. [50]16181.0–1583.0810.0
Erjien River, TaiwanWang et al. [60]1622.0–28,622.0737.0
East China Sea, ChinaZhao et al. [61]1657.5-364.5166.2
Yellow River Estuary, ChinaLiu et al. [62]1589.5–208.0140.5
Tiber River, ItalyMinissi et al. [63]134.5–652.2-
Cocó and Ceará Rivers, BrazilCavalcante et al. [64]173.0–2234.8-
Cauca River, ColombiaSarria-Villa et al. [8]12ND-3739.01028.0
Buffalo River Estuary, South AfricaAdeniji et al. [55]16ND-7792-
Ammer River, GermanyLiu et al. [9]16112.0–22,900.08770.0
Danube River, HungaryNagy et al. [57]168.3–1202.5170.0
Huveaune River, FranceKanzari et al. [65]16571.7–4234.91966.00
Durance River, FranceKanzari et al. [66]1657.0–1528.0-
Ría de Arousa, SpainPeréz-Fernández et al. [6]3545.0–7901.0-
Tiber River, ItalyPatrolecco et al. [48]6157.8–271.6215.2
Tiber River, ItalyMontuori et al. [34]1736.21–545.60155.26
Sarno River, ItalyMontuori and Triassi [26]175.5–678.6266.9
This studyDP1764.3–1429.1602.6 ± 319.3
SPM143.3–444.9264.7 ± 83.3
Sediment434.8–872.1659.1 ± 136.9
* ng/g; ND: Not detectable.
Table 3. Rankings based on SCIs and WP-CI according to these thresholds, (1): Normalized score > 0:60, (2): Normalized score > 0:30 and < 0:60, (3): Normalized score < 0:30.
−                        High Pollution                        +
SPM Specific Composite Indicator07-apr10-apr06-apr05-apr09-feb06-feb02-feb01-apr09-apr05-feb08-apr08-feb01-feb
DP Specific Composite Indicator10-apr09-apr05-apr01-apr07-jul02-jul10-jul08-apr06-jul05-jul09-jul01-jul08-jul
WP Composite Indicator07-apr09-jul06-apr01-jul10-apr05-feb08-jul05-apr08-feb01-feb01-apr09-apr08-apr
−                       Medium Pollution                       +
SPM Specific Composite Indicator02-jul05-jul08-nov05-nov01-nov02-apr03-apr06-jul09-jul01-jul08-jul03-feb10-feb07-feb
DP Specific Composite Indicator10-nov06-nov08-feb01-feb02-nov09-nov04-jul05-nov02-apr06-apr07-apr03-jul08-nov01-nov
WP Composite Indicator03-feb05-nov10-feb07-feb10-jul08-nov02-apr02-jul01-nov05-jul09-feb02-feb06-feb06-jul
−                        Low Pollution                        +
SPM Specific Composite Indicator04-jul04-nov03-nov07-nov10-nov03-jul07-jul04-apr04-feb02-nov09-nov10-jul06-nov
DP Specific Composite Indicator04-feb03-feb07-feb04-nov10-feb02-feb04-apr09-feb06-feb03-nov07-nov03-apr05-feb
WP Composite Indicator04-nov03-nov07-nov04-feb04-jul04-apr10-nov03-jul02-nov09-nov06-nov07-jul03-apr
Table 4. A comparison of the threshold effect level (TEL), probable effect level (PEL), effect range low (ERL), and effect range median (ERM) guideline values (µg Kg−1) for polycyclic aromatic hydrocarbons and data found in the Volturno River, Southern Italy.
PAHs
NapAcyAceFluPheAnFlPyrBaAChrBbFBkFBaPDahABghiPInP∑PAHs
TEL a34.65.876.7121.286.746.911315374.8108--88.86.22--1684
Samples percentage over the TEL3010010030000000 80100 0
PEL a39112888.914454424514941398693846--763135--16,770
Samples percentage over the PEL0000000000 010 0
ERL a16044161924085600665261384--43063.4--4022
Samples percentage over the ERL0000000000 0100 0
ERM a2100640500540150011005100260016002800--1600260--44,792
Samples percentage over the ERM0000000000 00 0
a MacDonald et al. [76]. b Long et al. [75].
Publisher’s Note: MDPI stays neutral with regard to jurisdictional claims in published maps and institutional affiliations.

