
Reliability, Validity, and Feasibility of the Frail-VIG Index

 , , and
Abstract
:1. Introduction
1.1. Background
1.2. Objective/Rationale
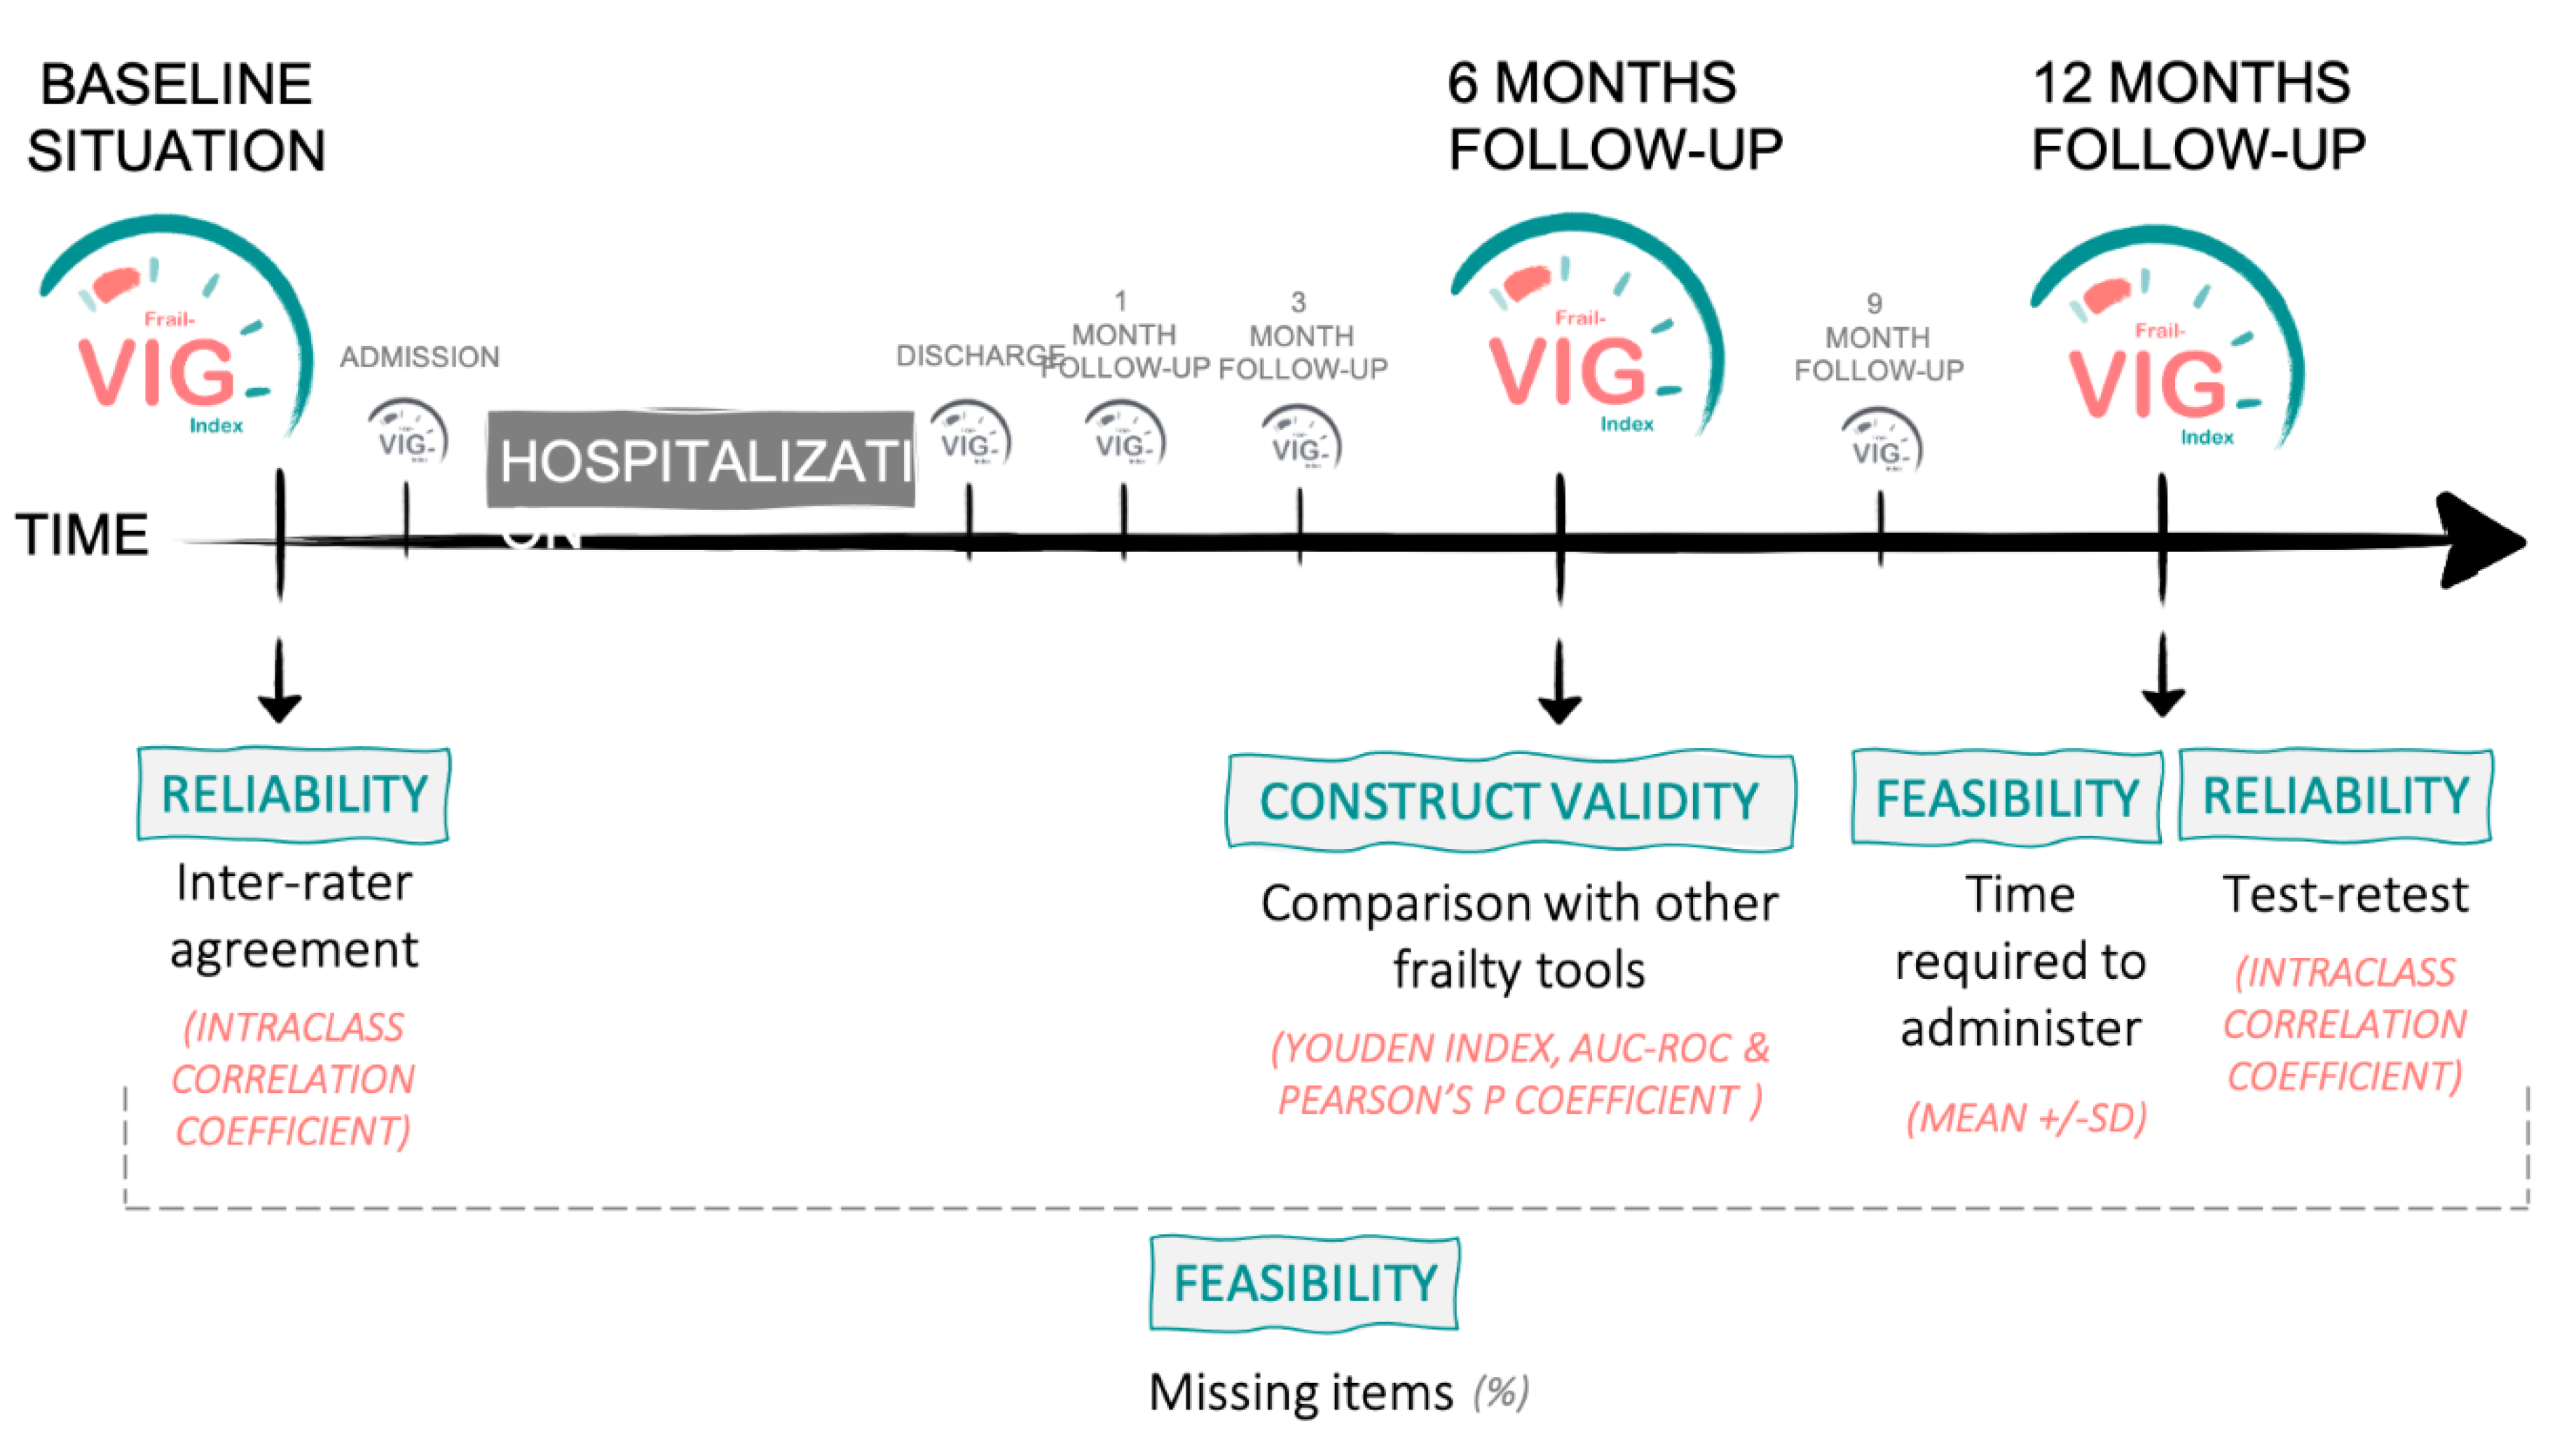
2. Methods
2.1. Study Design and Participants
2.2. Variables and Data Sources
2.3. Psychometric Assessment of the Frail-VIG Index
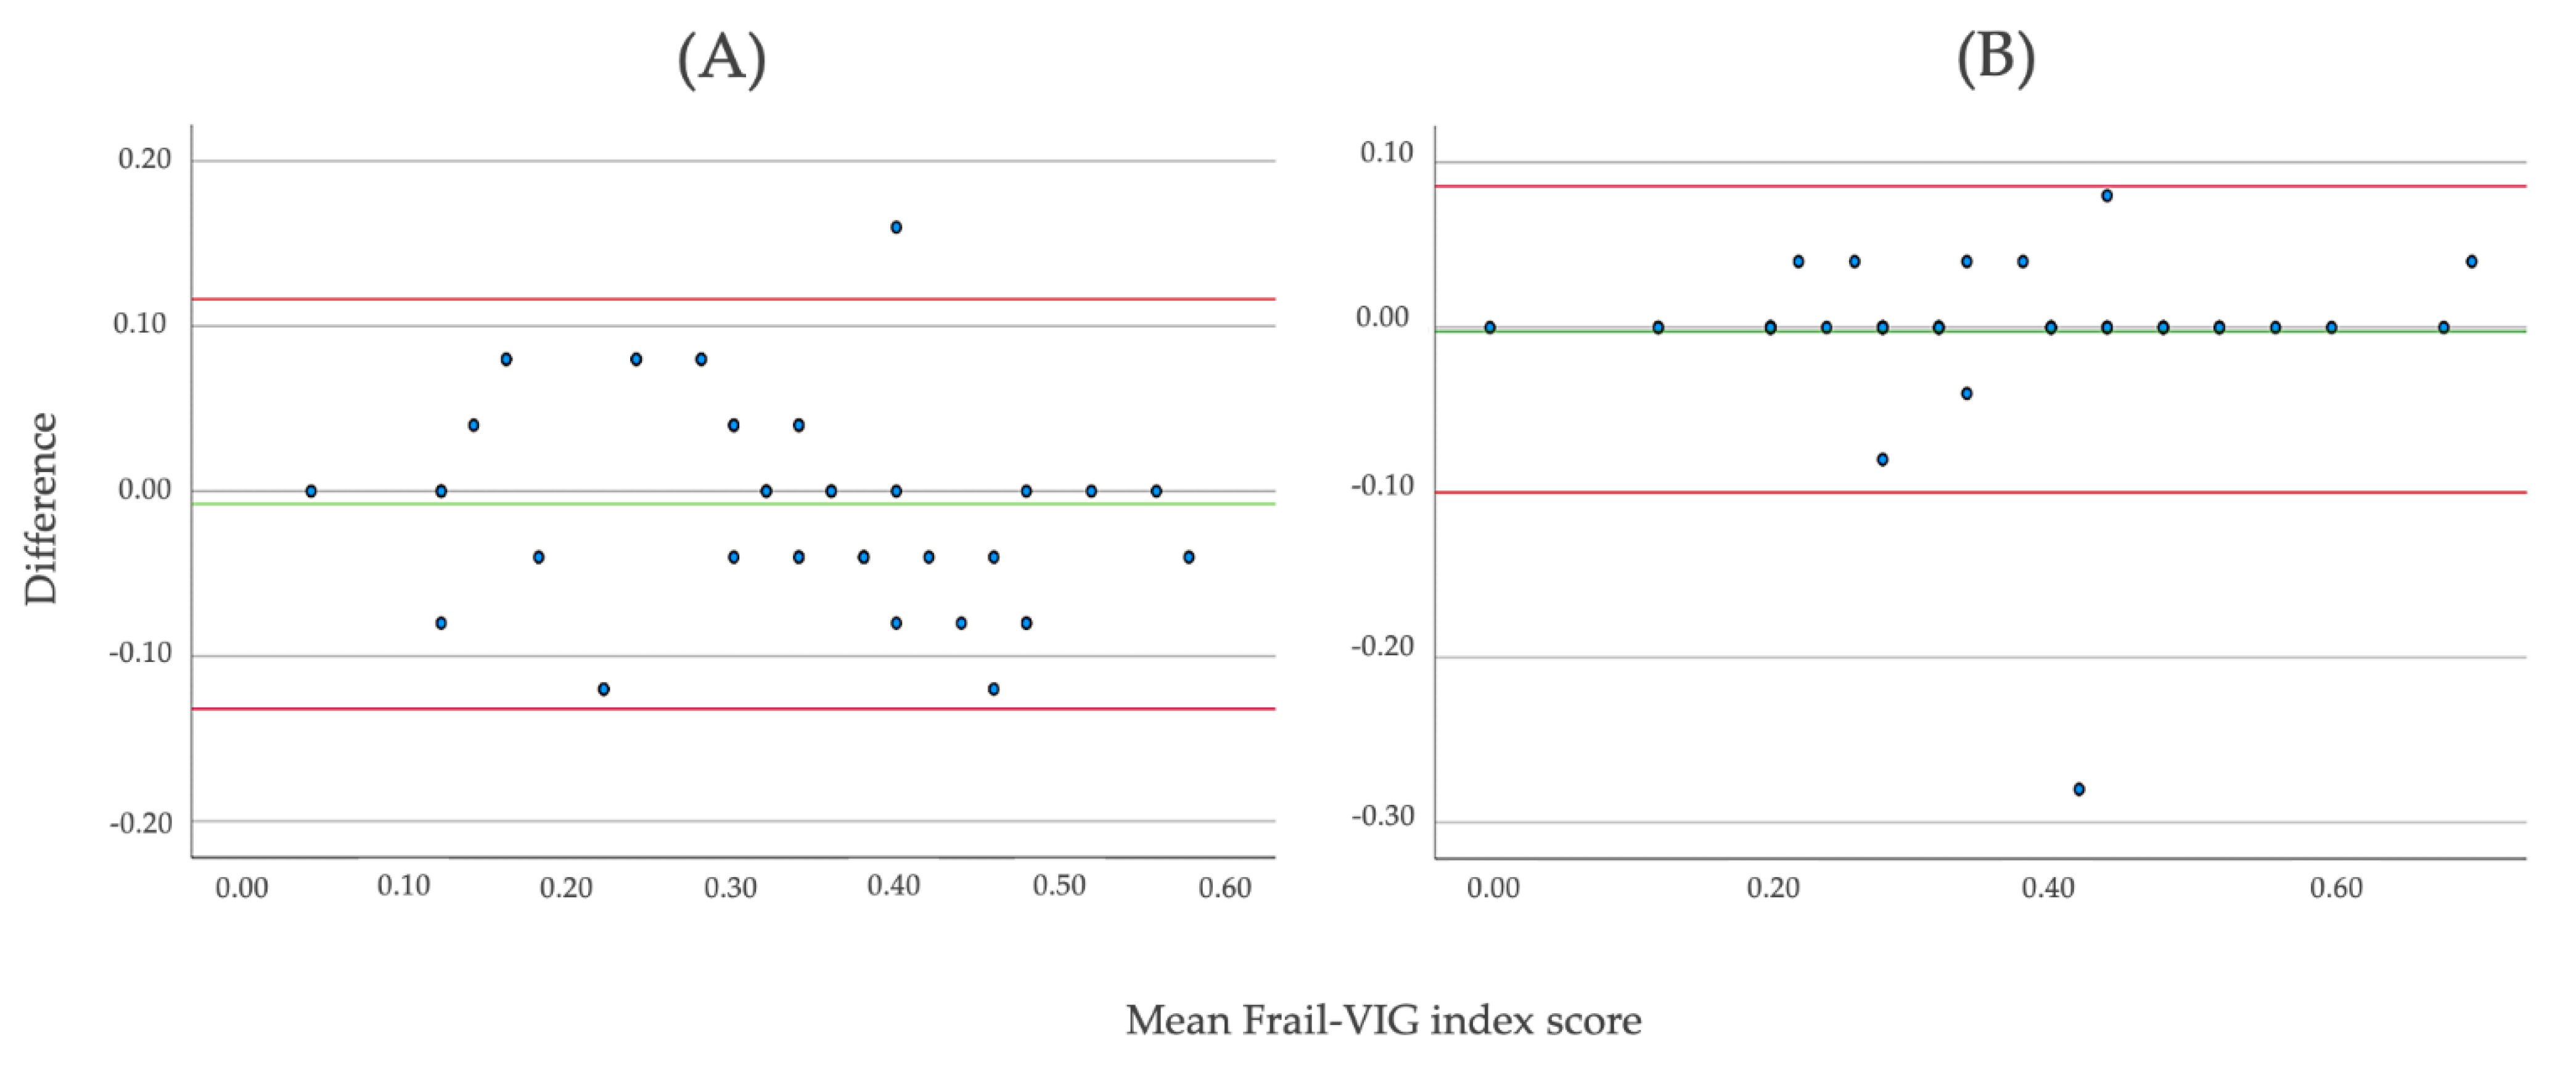
2.3.1. Reliability
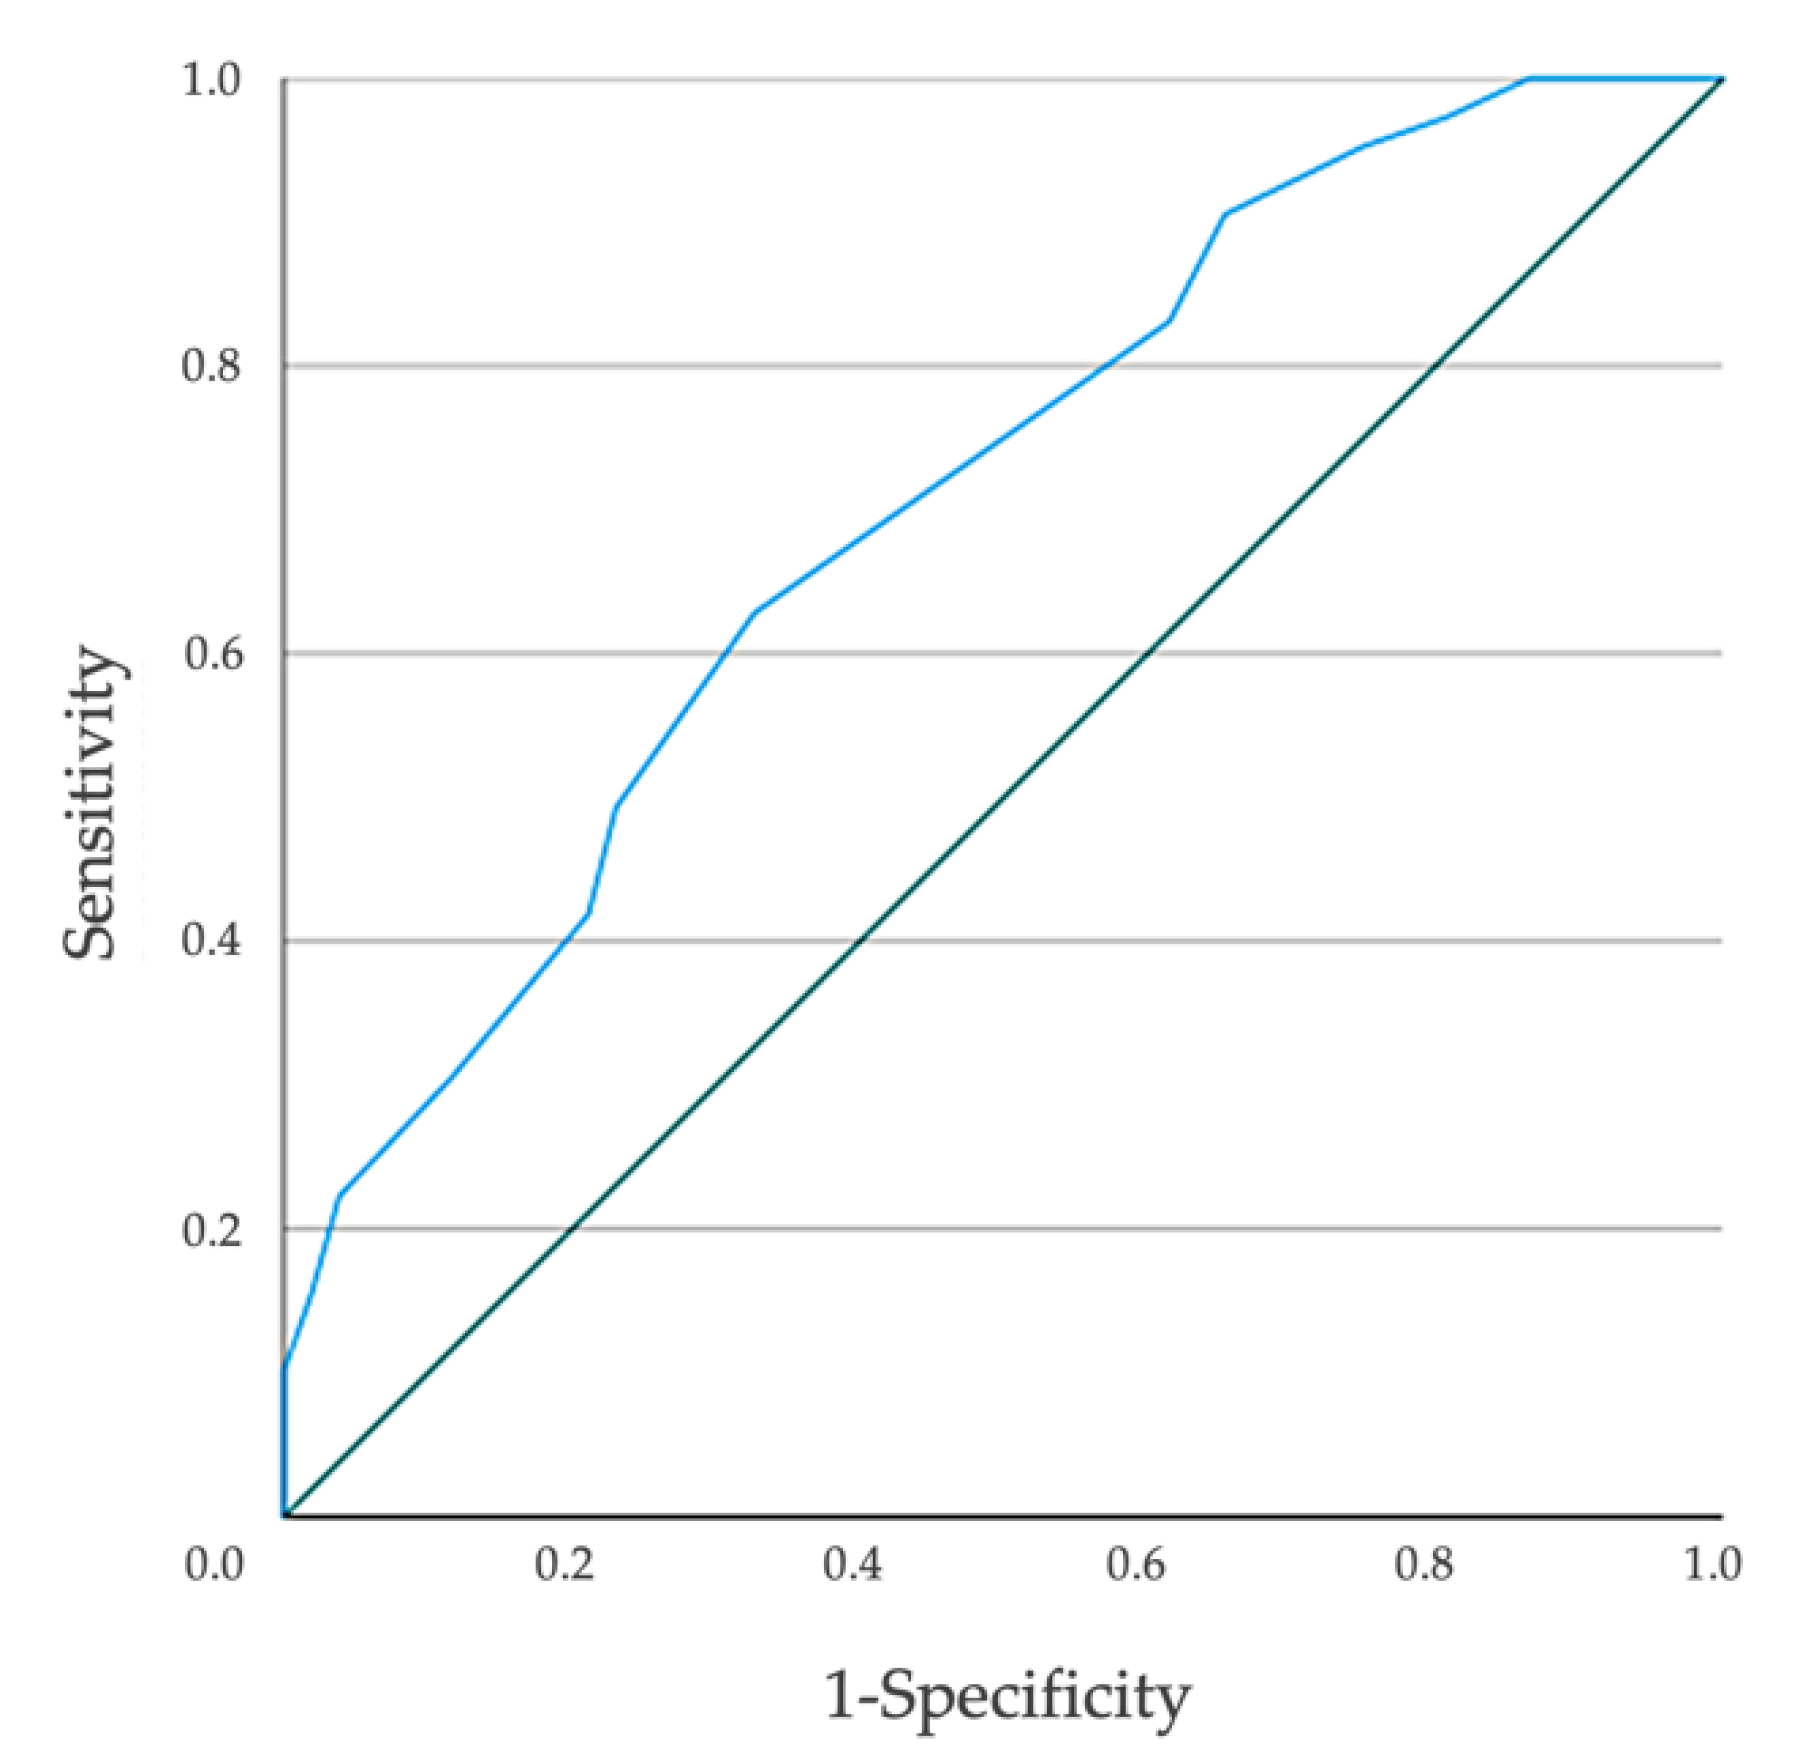
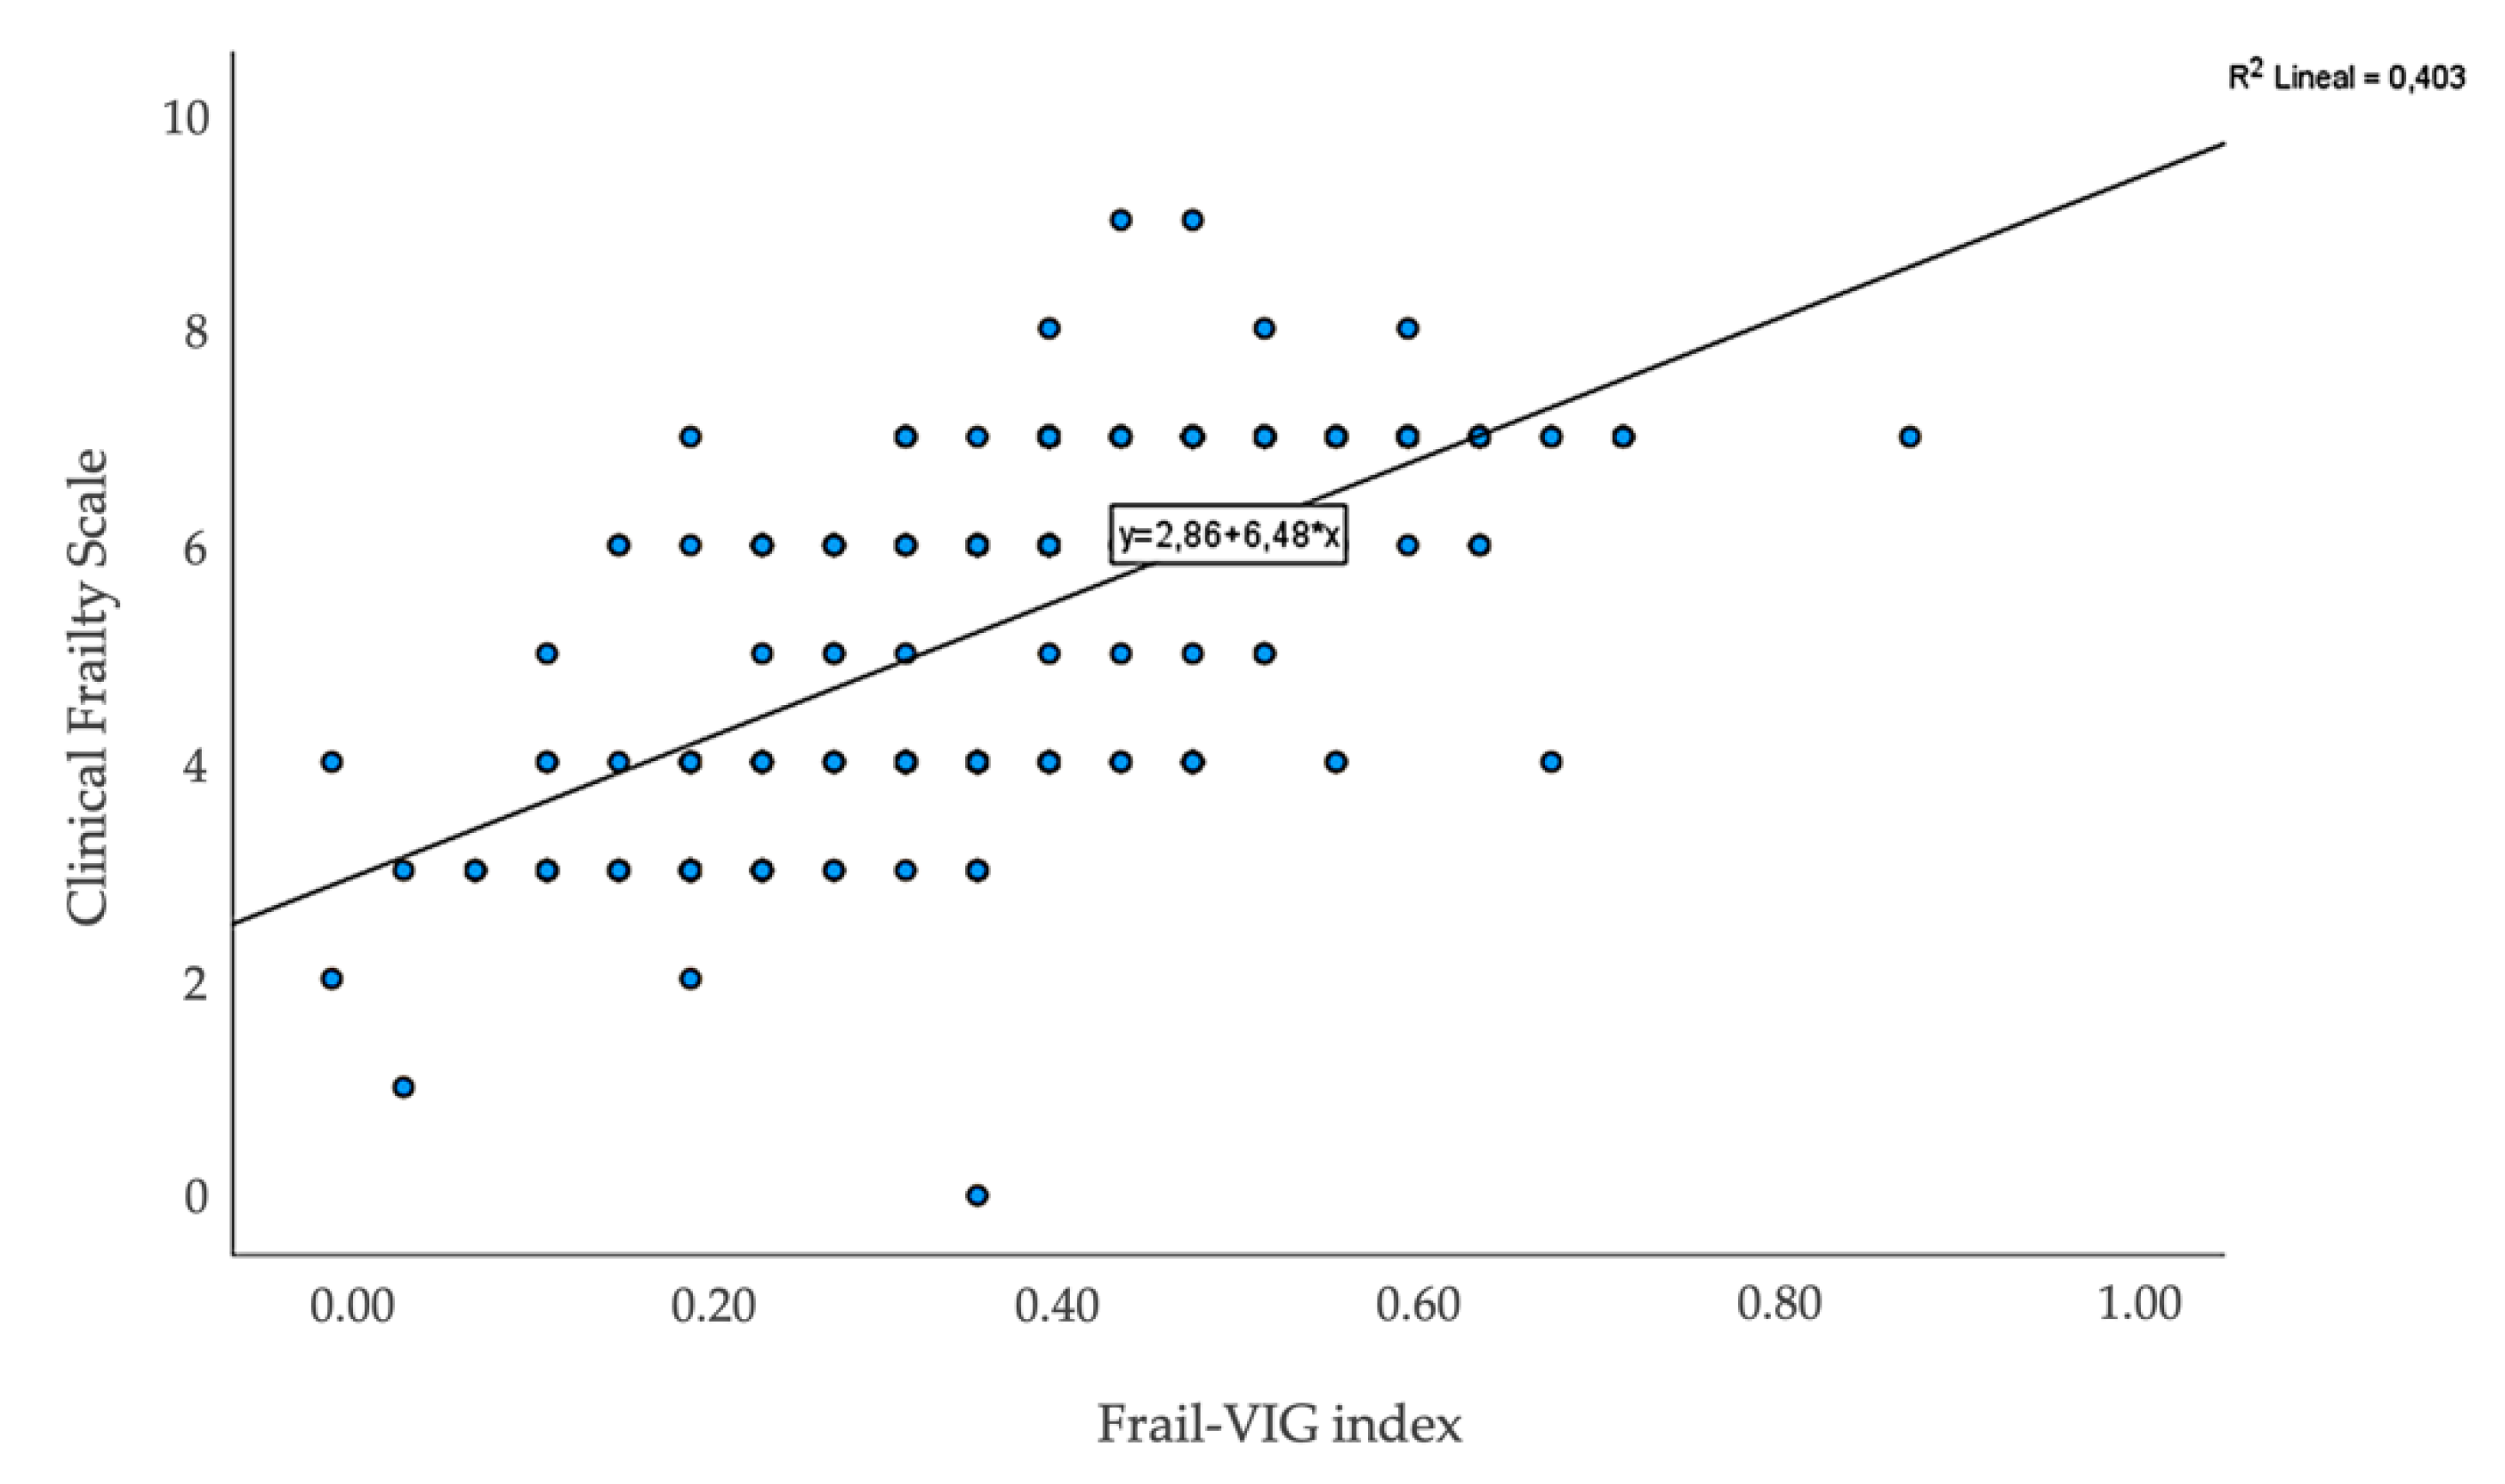
2.3.2. Validity
- As a categorical instrument for the assessment of frailty (frail vs. not frail), the five original FP criteria based on the physical characteristics as reported in the original Cardiovascular Health Study by Fried were used: weight loss, exhaustion, low energy, expenditure, slow walking speed, and weak grip strength [36]. The JAMAR PLUS+ Hand Dynamometer was used to assess grip strength, assessing the average score of two grips of the grip strength of the dominant hand. Those with no characteristics were identified as fit, those with one or two characteristics were identified as pre-frail, and those with three to five characteristics were identified as frail.
- CFS [21], a validated ordinal measure of frailty based on nine category clinical descriptors and pictographs ranging from one (fit) to nine (terminally ill), was used as a tool to assess continuous frailty.
2.3.3. Feasibility
2.4. Statistical Methods
2.4.1. Reliability
2.4.2. Validity
2.4.3. Feasibility
3. Results
3.1. General Characteristics
3.2. Psychometric Results of the Frail-VIG Index
3.2.1. Reliability
3.2.2. Validity
3.2.3. Feasibility
4. Discussion
4.1. Psychometric Assessment of the Frail-VIG Index
4.1.1. Reliability
4.1.2. Validity
4.1.3. Feasibility
4.2. Limitations of the Study
4.3. Healthcare Implications and Future Research
5. Conclusions
Supplementary Materials
Author Contributions
Funding
Institutional Review Board Statement
Informed Consent Statement
Data Availability Statement
Acknowledgments
Conflicts of Interest
References
- World Health Organization. Global Strategy on Integrated People-Centered Health Services 2016–2026; World Health Organization: Geneva, Switzerland, 2017. [Google Scholar]
- Busse, R.; Blümel, M.; Scheller-Kreinsen, D.; Zentner, A. Tackling Chronic Disease in Europe: Strategies, Interventions and Challenges; WHO Regional Office for Europe: Copenhagen, Denmark, 2010. [Google Scholar]
- Harrison, J.K.; Clegg, A.; Conroy, S.P.; Young, J. Managing frailty as a long-term condition. Age Ageing 2015, 44, 732–735. [Google Scholar] [CrossRef] [PubMed] [Green Version]
- Kojima, G.; Iliffe, S.; Walters, K. Frailty index as a predictor of mortality: A systematic review and meta-analysis. Age Ageing 2018, 47, 193–200. [Google Scholar] [CrossRef] [Green Version]
- Rivera-Almaraz, A.; Manrique-Espinoza, B.; Ávila-Funes, J.A.; Chatterji, S.; Naidoo, N.; Kowal, P.; Salinas-Rodríguez, A. Disability, quality of life and all-cause mortality in older Mexican adults: Association with multimorbidity and frailty. BMC Geriatr. 2018, 18, 236. [Google Scholar] [CrossRef]
- Marengoni, A.; Zucchelli, A.; Vetrano, D.L.; Armellini, A.; Botteri, E.; Nicosia, F.; Romanelli, G.; Beindorf, E.A.; Giansiracusa, P.; Garrafa, E.; et al. Beyond Chronological Age: Frailty and Multimorbidity Predict In-Hospital Mortality in Patients With Coronavirus Disease 2019. J. Gerontol. A Biol. Sci. Med. Sci. 2021, 76, e38–e45. [Google Scholar] [CrossRef]
- Hewitt, J.; Carter, B.; Vilches-Moraga, A.; Quinn, T.J.; Braude, P.; Verduri, A.; Pearce, L.; Stechman, M.; Short, R.; Price, A.; et al. The effect of frailty on survival in patients with COVID-19 (COPE): A multicentre, European, observational cohort study. Lancet Public Health 2020, 5, e444–e451. [Google Scholar] [CrossRef]
- Rodríguez-Mañas, L.; Féart, C.; Mann, G.; Viña, J.; Chatterji, S.; Chodzko-Zajko, W.; Harmand, M.G.-C.; Bergman, H.; Carcaillon, L.; Nicholson, C.; et al. Searching for an operational definition of frailty: A delphi method based consensus statement. the frailty operative definition-consensus conference project. J. Gerontol. A Biol. Sci. Med. Sci. 2013, 68, 62–67. [Google Scholar] [CrossRef] [PubMed] [Green Version]
- Cesari, M.; Marzetti, E.; Thiem, U.; Pérez-Zepeda, M.U.; Abellan Van Kan, G.; Landi, F.; Petrovic, M.; Cherubini, A.; Bernabei, R. The geriatric management of frailty as paradigm of “The end of the disease era”. Eur. J. Intern. Med. 2016, 31, 11–14. [Google Scholar] [CrossRef] [Green Version]
- Turner, G.; Clegg, A. Best practice guidelines for the management of frailty: A British Geriatrics Society, Age UK and Royal College of General Practitioners report. Age Ageing 2014, 43, 744–747. [Google Scholar] [CrossRef] [PubMed] [Green Version]
- Hoogendijk, E.O.; Afilalo, J.; Ensrud, K.E.; Kowal, P.; Onder, G.; Fried, L.P. Series Frailty 1 Frailty: Implications for clinical practice and public health. Lancet 2019, 394, 1365–1375. [Google Scholar] [CrossRef]
- Dent, E.; Kowal, P.; Hoogendijk, E.O. Frailty measurement in research and clinical practice: A review. Eur. J. Intern. Med. 2016, 31, 3–10. [Google Scholar] [CrossRef] [Green Version]
- Cesari, M.; Gambassi, G.; van Kan, G.A.; Vellas, B. The frailty phenotype and the frailty index: Different instruments for different purposes. Age Ageing 2014, 43, 10–12. [Google Scholar] [CrossRef] [PubMed] [Green Version]
- Fried, L.P.; Tangen, C.M.; Walston, J.; Newman, A.B.; Hirsch, C.; Gottdiener, J.; Seeman, R.; Tracy, R.; Kop, W.J.; Burke, G.; et al. Frailty in older adults: Evidence for a phenotype. J. Gerontol. A Biol. Sci. Med. Sci. 2001, 56, M146–M156. [Google Scholar] [CrossRef]
- Morley, J.E.; Malmstrom, T.K.; Miller, D.K. A simple frailty questionnaire (FRAIL) predicts outcomes in middle aged african americans. J. Nutr. Health Aging 2012, 16, 601–608. [Google Scholar] [CrossRef] [PubMed] [Green Version]
- Vellas, B.; Balardy, L.; Gillette-Guyonnet, S.; Abellan Van Kan, G.; Ghisolfi-Marque, A.; Subra, J.; Bismuth, S.; Oustric, S.; Cesari, M. Looking for Frailty in Community-Dwelling Older Persons: The Gérontopôle Frailty Screening Tool (GFST). J. Nutr. Health Aging 2013, 17, 629–631. [Google Scholar] [CrossRef] [PubMed]
- Abellan Van Kan, G.; Rolland, Y.; Andrieu, S.; Bauer, J.; Beauchet, O.; Bonnefoy, M.; Cesari, M.; Donini, L.M.; Gillette-Guyonnet, S.; Inzitari, M.; et al. Gait speed at usual pace as a predictor of adverse outcomes in community-dwelling older people an International Academy on Nutrition and Aging (IANA) task force. J. Nutr. Health Aging 2009, 13, 881–889. [Google Scholar] [CrossRef]
- Guralnik, J.M.; Simonsick, E.M.; Ferrucci, L.; Glynn, R.J.; Berkman, L.F.; Blazer, D.G.; Scherr, P.A.; Wallace, R.B. A short physical performance battery assessing lower extremity function: Association with self-reported disability and prediction of mortality and nursing home admission. J. Gerontol. 1994, 49, M85–M94. [Google Scholar] [CrossRef]
- Mitnitski, A.B.; Mogilner, A.J.; Rockwood, K. Accumulation of deficits as a proxy measure of aging. Sci. World J. 2001, 1, 323–336. [Google Scholar] [CrossRef] [Green Version]
- Amblàs-Novellas, J.; Espaulella, J.; Rexach, L.; Fontecha, B.; Inzitari, M.; Blay, C.; Gómez-Batiste, X. Frailty, severity, progression and shared decision-making: A pragmatic framework for the challenge of clinical complexity at the end of life. Eur. Geriatr. Med. 2015, 6, 189–194. [Google Scholar] [CrossRef]
- Rockwood, K.; Song, X.; MacKnight, C.; Bergman, H.; Hogan, D.B.; McDowell, I.; Mitnitski, A. A global clinical measure of fitness and frailty in elderly people. CMAJ 2005, 173, 9–13. [Google Scholar] [CrossRef] [Green Version]
- Rockwood, K.; Mitnitski, A. Frailty in relation to the accumulation of deficits. J. Gerontol. A Biol. Sci. Med. Sci. 2007, 62, 722–727. [Google Scholar] [CrossRef] [Green Version]
- Abbasi, M.; Rolfson, D.; Khera, A.S.; Dabravolskaj, J.; Dent, E.; Xia, L. Identification and management of frailty in the primary care setting. CMAJ 2018, 191, E54. [Google Scholar] [CrossRef] [PubMed] [Green Version]
- Huisingh-Scheetz, M.; Martinchek, M.; Becker, Y.; Ferguson, M.K.; Thompson, K. Translating Frailty Research Into Clinical Practice: Insights From the Successful Aging and Frailty Evaluation Clinic. J. Am. Med. Dir. Assoc. 2019, 20, 672–678. [Google Scholar] [CrossRef] [PubMed]
- Warnier, R.M.J.; van Rossum, E.; van Velthuijsen, E.; Mulder, W.J.; Schols, J.M.G.A.; Kempen, G.I.J.M. Validity, reliability and feasibility of tools to identify frail older patients in inpatient hospital care: A systematic review. J. Nutr. Health Aging 2016, 20, 218–230. [Google Scholar] [CrossRef] [PubMed]
- Drubbel, I.; Numans, M.E.; Kranenburg, G.; Bleijenberg, N.; De Wit, N.J.; Schuurmans, M.J. Screening for frailty in primary care: A systematic review of the psychometric properties of the frailty index in community-dwelling older people. BMC Geriatr. 2014, 14, 27. [Google Scholar] [CrossRef] [Green Version]
- Sutton, J.L.; Gould, R.L.; Daley, S.; Coulson, M.C.; Ward, E.V.; Butler, A.M.; Nunn, S.P.; Howard, R.J. Psychometric properties of multicomponent tools designed to assess frailty in older adults: A systematic review. BMC Geriatr. 2016, 16, 55. [Google Scholar] [CrossRef] [Green Version]
- Amblàs-Novellas, J.; Martori, J.; Molist Brunet, N.; Oller, R.; Gomez-Batiste, X.; Espaulella, J. Índice Frágil-VIG: diseño y evaluación de un Índice de Fragilidad basado en la Valoración Integral Geriátrica. Rev. Esp. Geriatr. Gerontol. 2016, 52, 119–123. [Google Scholar] [CrossRef]
- Amblàs-Novellas, J.; Martori, J.C.; Espaulella, J.; Oller, R.; Molist-Brunet, N.; Inzitari, M.; Romero-Ortuno, R. Frail-VIG index: A concise frailty evaluation tool for rapid geriatric assessment. BMC Geriatr. 2018, 18, 29. [Google Scholar] [CrossRef] [PubMed] [Green Version]
- Mokkink, L.B.; Prinsen, C.A.C.; Patrick, D.L.; Alonso, J.; Bouter, L.M.; de Vet, H.C.W.; Terwee, C.B. COSMIN Study Design Checklist for Patient-Reported Outcome Measurement Instruments; Amsterdam University Medical Centers: Amsterdam, The Netherlands, 2019. [Google Scholar]
- DeVellis, R.F. Classical test theory. Med. Care 2006, 33, S50–S59. [Google Scholar] [CrossRef]
- Contel, J.C.; Ledesma, A.; Blay, C.; González Mestre, A.; Cabezas, C.; Puigdollers, M.; Zara, C.; Amil, P.; Sarquella, E.; Constante, C. Chronic and integrated care in Catalonia. Int. J. Integr. Care 2015, 15, e025. [Google Scholar] [CrossRef] [Green Version]
- Gómez-Batiste, X.; Martínez-Muñoz, M.; Blay, C.; Amblàs-Novellas, J.; Vila, L.; Costa, X.; Espaulella, J.; Espinosa, J.; Constante, C.; Mitchell, G.K. Prevalence and characteristics of patients with advanced chronic conditions in need of palliative care in the general population: A cross-sectional study. Palliat. Med. 2014, 28, 302–311. [Google Scholar] [CrossRef]
- Mokkink, L.B.; Terwee, C.B.; Knol, D.L.; Stratford, P.W.; Alonso, J.; Patrick, D.L.; Bouter, L.M.; De Vet, H.C. The COSMIN checklist for evaluating the methodological quality of studies on measurement properties: A clarification of its content. BMC Med. Res. Methodol. 2010, 10, 22. [Google Scholar] [CrossRef] [Green Version]
- Streiner, D.L. Being inconsistent about consistency: When coefficient alpha does and doesn’t matter. J. Pers. Assess. 2003, 80, 217–222. [Google Scholar] [CrossRef]
- Alonso Bouzón, C.; Rodríguez-Mañas, L.; Carnicero, J.A.; García-García, F.J.; Turín, J.G.; Rodríguez-Mañas, L.; Turín, J.G. The Standardization of Frailty Phenotype Criteria Improves Its Predictive Ability: The Toledo Study for Healthy Aging. J. Am. Med. Dir. Assoc. 2017, 18, 402–408. [Google Scholar] [CrossRef]
- Searle, S.; Mitnitski, A.; Gahbauer, E. A standard procedure for creating a frailty index. BMC Geriatr. 2008, 8, 24. [Google Scholar] [CrossRef] [PubMed] [Green Version]
- Romero-Ortuno, R. An alternative method for Frailty Index cut-off points to define frailty categories. Eur. Ger. Med. 2013, 4. [Google Scholar] [CrossRef] [PubMed] [Green Version]
- Clegg, A.; Young, J.; Iliffe, S.; Rikkert, M.O.; Rockwood, K. Frailty in elderly people. Lancet 2013, 381, 752–762. [Google Scholar] [CrossRef] [Green Version]
- Ambagtsheer, R.; Visvanathan, R.; Cesari, M.; Yu, S.; Archibald, M.; Schultz, T.; Karnon, J.; Kitson, A.; Beilby, J. Feasibility, acceptability and diagnostic test accuracy of frailty screening instruments in community-dwelling older people within the Australian general practice setting: A study protocol for a cross-sectional study. BMJ Open 2017, 7, e016663. [Google Scholar] [CrossRef]
- Giraudeau, B.; Mary, J.Y. Planning a reproducibility study: How many subjects and how many replicates per subject for an expected width of the 95 per cent confidence interval of the intraclass correlation coefficient. Stat. Med. 2001, 20, 3205–3214. [Google Scholar] [CrossRef]
- McDowell, I. Measuring Health: A Guide to Rating Scales and Questionnaires; Oxford University Press: Oxford, UK, 2009. [Google Scholar]
- Bouillon, K.; Kivimaki, M.; Hamer, M.; Sabia, S.; Fransson, E.I.; Singh-Manoux, A.; Gale, C.R.; Batty, G.D. Measures of frailty in population-based studies: An overview. BMC Geriatr. 2013, 13, 64. [Google Scholar] [CrossRef] [PubMed] [Green Version]
- Rolfson, D.B.; Majumdar, S.R.; Tsuyuki, R.T.; Tahir, A.; Rockwood, K. Validity and reliability of the Edmonton Frail Scale. Age Ageing 2006, 35, 526–529. [Google Scholar] [CrossRef] [Green Version]
- Chan, D.C.; Tsou, H.H.; Chen, C.Y.; Chen, C.Y. Validation of the Chinese-Canadian study of health and aging clinical frailty scale (CSHA-CFS) telephone version. Arch. Gerontol. Geriatr. 2010, 50, e74–e80. [Google Scholar] [CrossRef]
- Gobbens, R.J.J.; van Assen, M.A.L.M.; Luijkx, K.G.; Wijnen-Sponselee, M.T.; Schols, J.M.G.A. The tilburg frailty indicator: Psychometric properties. J. Am. Med. Dir. Assoc. 2010, 11, 344–355. [Google Scholar] [CrossRef] [PubMed]
- Dong, L.; Qiao, X.; Tian, X.; Liu, N.; Jin, Y.; Si, H.; Gale, C.R.; Batty, G.D. Cross-Cultural Adaptation and Validation of the FRAIL Scale in Chinese Community-Dwelling Older Adults. J. Am. Med. Dir. Assoc. 2018, 19, 12–17. [Google Scholar] [CrossRef]
- Clegg, A.; Rogers, L.; Young, J. Diagnostic test accuracy of simple instruments for identifying frailty in community-dwelling older people: A systematic review. Age Ageing 2015, 44, 148–152. [Google Scholar] [CrossRef] [Green Version]
- Moreno-Ariño, M.; Torrente Jiménez, I.; Cartanyà Gutiérrez, A.; Oliva Morera, J.C.; Comet, R. Assessing the strengths and weaknesses of the Clinical Frailty Scale through correlation with a frailty index. Aging Clin. Exp. Res. 2020, 32, 2225–2232. [Google Scholar] [CrossRef] [PubMed]
- Brundle, C.; Heaven, A.; Brown, L.; Teale, E.; Young, J.; West, R.; Clegg, A. Convergent validity of the electronic frailty index. Age Ageing 2019, 48, 152–156. [Google Scholar] [CrossRef] [PubMed]
- Chong, E.; Chia, J.Q.; Law, F.; Chew, J.; Chan, M.; Lim, W.S. Validating a Standardised Approach in Administration of the Clinical Frailty Scale in Hospitalised Older Adults. Ann. Acad. Med. Singap. 2019, 48, 115–124. [Google Scholar]
- Kim, D.H.; Kim, C.A.; Placide, S.; Lipsitz, L.A.; Marcantonio, E.R. Preoperative frailty assessment and outcomes at 6 months or later in older adults undergoing cardiac surgical procedures: A systematic review. Ann. Intern. Med. 2016, 165, 650–660. [Google Scholar] [CrossRef] [PubMed]
- Jones, D.; Song, X.; Mitnitski, A.; Rockwood, K. Evaluation of a frailty index based on a comprehensive geriatric assessment in a population based study of elderly Canadians. Aging Clin. Exp. Res. 2005, 17, 465–471. [Google Scholar] [CrossRef]
- Hubbard, R.E.; Peel, N.M.; Smith, M.; Dawson, B.; Lambat, Z.; Bak, M.; Best, J.; Johnson, D.W. Feasibility and construct validity of a Frailty index for patients with chronic kidney disease. Australas. J. Ageing 2015, 34, E9–E12. [Google Scholar] [CrossRef]
- Lin, H.; Peel, N.M.; Scott, I.A.; Vardesh, D.L.; Sivalingam, P.; McBride, R.L.; Morong, J.J.; Nelson, M.J.; Hubbard, R.E. Perioperative assessment of older surgical patients using a frailty index-feasibility and association with adverse post-operative outcomes. Anaesth. Intensive Care 2017, 45, 676–682. [Google Scholar] [CrossRef] [PubMed] [Green Version]
- Evans, S.J.; Sayers, M.; Mitnitski, A.; Rockwood, K. The risk of adverse outcomes in hospitalized older patients in relation to a frailty index based on a comprehensive geriatric assessment. Age Ageing 2014, 43, 127–132. [Google Scholar] [CrossRef] [PubMed] [Green Version]
- Hubbard, R.E.; O’mahony, M.S.; Woodhouse, K.W. Characterising frailty in the clinical setting—A comparison of different approaches. Age Ageing 2009, 38, 115–119. [Google Scholar] [CrossRef] [Green Version]
- Cesari, M.; Prince, M.; Thiyagarajan, J.A.; De Carvalho, I.A.; Bernabei, R.; Chan, P.; Gutierrez-Robledo, L.M.; Michel, J.-P.; Morley, J.E.; Ong, P.; et al. Frailty: An Emerging Public Health Priority. J. Am. Med. Dir. Assoc. 2016, 17, 188–192. [Google Scholar] [CrossRef] [PubMed]
- Gobbens, R.J.J.; van Assen, M.A.L.M.; Luijkx, K.G.; Wijnen-Sponselee, M.T.; Schols, J.M.G.A. Determinants of frailty. J. Am. Med. Dir. Assoc. 2010, 11, 356–364. [Google Scholar] [CrossRef]
- Bunt, S.; Steverink, N.; Olthof, J.; van der Schans, C.P.; Hobbelen, J.S.M. Social frailty in older adults: A scoping review. Eur. J. Ageing 2017, 14, 323–334. [Google Scholar] [CrossRef] [PubMed]
- Chamberlain, A.M.; Finney Rutten, L.J.; Manemann, S.M.; Yawn, B.P.; Jacobson, D.J.; Fan, C.; Ms, B.R.G.; Roger, V.L.; Sauver, J.L.S. Frailty Trajectories in an Elderly Population-Based Cohort. J. Am. Geriatr. Soc. 2016, 64, 285–292. [Google Scholar] [CrossRef] [PubMed] [Green Version]


| Baseline Total N = 527 | Month 6 Follow-Up | Month 12 Follow-Up n = 176 | |||
|---|---|---|---|---|---|
| Total n = 200 | No Frailty n = 20 (10.0%) | Frailty n = 180 (90.0%) | |||
| Demographic characteristics | |||||
| Age (years), mean ± SD | 81.61 ± 9.9 | 80.9 ± 10.6 | 82.6 ± 7.2 | 80.7 ± 10.9 | 81.7 ± 9.6 |
| Sex (women), N (%) | 296 (56.2) | 114 (57.0) | 11 (55.0) | 103 (57.2) | 98 (55.7) |
| Usual habitat, No (%) | |||||
| Nursing home | 68 (12.9) | 63 (31.5) | 0 (0.0) | 63 (35.0) | 48 (27.3) |
| Home | 440 (83.5) | 129 (64.5) | 20 (100.0) | 109 (60.5) | 111 (63.1) |
| Others | 2 (0.4) | 1 (0.5) | 0 (0.0) | 1 (0.6) | 0 (0.0) |
| Missing information | 17 (3.2) | 7 (3.5) | 0 (0.0) | 7 (3.9) | 17 (9.6) |
| Living arrangement 1, No (%) | |||||
| With family | 303 (68.5) | 93 (71.6) | 15 (75.0) | 78 (70.9) | 76 (68.5) |
| With caregiver | 22 (5.0) | 6 (4.6) | 0 (0.0) | 6 (5.5) | 5 (4.5) |
| Alone | 105 (23.8) | 25 (19.2) | 4 (20.0) | 21 (19.1) | 18 (16.2) |
| Others | 4 (0.9) | 0 (0.0) | 0 (0.0) | 0 (0.0) | 0 (0.0) |
| Missing information | 8 (1.8) | 6 (4.6) | 1 (5.0) | 5 (4.5) | 12 (10.8) |
| Frail-VIG variables | |||||
| Functional IADLs (0–3), mean ± SD | 1.48 ± 1.3 | 1.81 ± 1.2 | 0.15 ± 0.3 | 1.99 ± 1.1 | 1.80 ± 1.3 |
| Barthel index (0–100), mean ± SD | 73.87 ± 27.5 | 57.5 ± 32.4 | 90.5 ± 22.5 | 53.9 ± 31.3 | 62.2 ± 31.1 |
| Malnutrition, N (%) | 144 (27.3) | 34 (17.1) | 2 (10.0) | 32 (17.9) | 15 (9.1) |
| Cognitive impairment, N (%) | 198 (37.6) | 83 (41.7) | 0 (0.0) | 83 (46.3) | 62 (37.8) |
| Depressive syndrome, N (%) | 165 (31.3) | 78 (39.6) | 2 (10.0) | 76 (42.9) | 75 (44.9) |
| Insomnia/anxiety, N (%) | 255 (48.4) | 119 (59.8) | 4 (20.0) | 115 (64.2) | 96 (56.8) |
| Social vulnerability, N (%) | 74 (14.0) | 4 (2.0) | 0 (0.0) | 4 (2.0) | 8 (4.8) |
| Delirium, N (%) | 85 (16.1) | 59 (29.5) | 1 (5.0) | 58 (32.2) | 45 (26.8) |
| Falls, N (%) | 111 (21.1) | 35 (17.7) | 1 (5.0) | 34 (19.1) | 23 (13.9) |
| Ulcers, N (%) | 56 (10.6) | 27 (13.5) | 0 (0.0) | 27 (15.0) | 17 (10.4) |
| Polypharmacy, N (%) | 425 (80.6) | 176 (88.0) | 357 (86.7) | 176 (88.0) | 141 (83.9) |
| Dysphagia, N (%) | 88 (16.7) | 41 (20.6) | 0 (0.0) | 41 (22.9) | 28 (17.2) |
| Pain, N (%) | 131 (24.9) | 62 (31.0) | 2 (10.0) | 60 (33.3) | 36 (21.7) |
| Dyspnoea, N (%) | 47 (8.9) | 34 (17.1) | 1 (5.0) | 33 (18.4) | 21 (12.8) |
| Cancer, N (%) | 128 (24.3) | 43 (21.8) | 2 (10.0) | 41 (23.2) | 25 (15.3) |
| Chronic respiratory disease, N (%) | 147 (27.9) | 78 (39.4) | 3 (15.0) | 75 (42.1) | 63 (37.3) |
| Chronic cardiac disease, N (%) | 232 (44.1) | 111 (55.5) | 6 (30.0) | 105 (58.3) | 89 (53.9) |
| Chronic neurological disease, N (%) | 74 (14.1) | 47 (23.5) | 2 (10.0) | 45 (25.0) | 34 (20.5) |
| Chronic digestive disease, N (%) | 40 (7.6) | 39 (20.1) | 2 (10.0) | 37 (21.2) | 28 (17.2) |
| Chronic renal disease, N (%) | 210 (39.8) | 91 (46.4) | 3 (15.8) | 88 (49.8) | 68 (40.7) |
| Frailty degree 2 | |||||
| Total cohort average, mean ± SD | 0.31 ± 0.15 | 0.39 ± 0.16 | 0.11 ± 0.05 | 0.42 ± 0.14 | 0.35 ± 0.16 |
| No frailty, N (%) | 115 (21.8) | 20 (10.0) | 20 (100.0) | - | 35 (20.5) |
| Mild frailty, N (%) | 190 (36.1) | 52 (26.0) | - | 52 (28.9) | 43 (25.1) |
| Intermediate frailty, N (%) | 147 (27.9) | 77 (38.5) | - | 77 (42.8) | 59 (34.5) |
| Severe frailty, N (%) | 75 (14.2) | 51 (25.5) | - | 51 (28.3) | 34 (19.9) |
| Non-Frailty/Pre-Frailty | Frailty | ||
|---|---|---|---|
| FP | No (%) | 52 (26.0) | 148 (74.0) |
| Frail-VIG, mean ± SD | 0.30 (0.16) | 0.42 (0.15) | |
| IF-VIG | No (%) | 20 (10) | 180 (90) |
| (Frailty cutoff ≥0.20) | Frail-VIG, mean ± SD | 0.11 (0.05) | 0.42 (0.14) |
| IF-VIG | No (%) | 32 (16) | 168 (84) |
| (Frailty cutoff ≥0.23) | Frail-VIG, mean ± SD | 0.14 (0.06) | 0.44 (0.13) |
| IF-VIG | mean ± SD | 45 (22.5) | 155 (77.5) |
| (Frailty cutoff ≥0.25) | Frail-VIG, mean (DS) | 0.17 (0.07) | 0.45 (0.12) |
| Sensitivity | Specificity | PPV | NPV | Youden Index | Frail-VIG Index (Frailty Value Cutoff) | |
|---|---|---|---|---|---|---|
| FP | 78.3% | 65.0% | 95.3% | 25.0% | 0.43 | ≥0.20 |
| 79.8% | 56.3% | 90.5% | 34.6% | 0.36 | ≥0.23 | |
| 79.4% | 44.4% | 83.1% | 38.5% | 0.24 | ≥0.25 |
Publisher’s Note: MDPI stays neutral with regard to jurisdictional claims in published maps and institutional affiliations. |
© 2021 by the authors. Licensee MDPI, Basel, Switzerland. This article is an open access article distributed under the terms and conditions of the Creative Commons Attribution (CC BY) license (https://creativecommons.org/licenses/by/4.0/).
Share and Cite
Torné, A.; Puigoriol, E.; Zabaleta-del-Olmo, E.; Zamora-Sánchez, J.-J.; Santaeugènia, S.; Amblàs-Novellas, J. Reliability, Validity, and Feasibility of the Frail-VIG Index. Int. J. Environ. Res. Public Health 2021, 18, 5187. https://doi.org/10.3390/ijerph18105187
Torné A, Puigoriol E, Zabaleta-del-Olmo E, Zamora-Sánchez J-J, Santaeugènia S, Amblàs-Novellas J. Reliability, Validity, and Feasibility of the Frail-VIG Index. International Journal of Environmental Research and Public Health. 2021; 18(10):5187. https://doi.org/10.3390/ijerph18105187
Chicago/Turabian StyleTorné, Anna, Emma Puigoriol, Edurne Zabaleta-del-Olmo, Juan-José Zamora-Sánchez, Sebastià Santaeugènia, and Jordi Amblàs-Novellas. 2021. "Reliability, Validity, and Feasibility of the Frail-VIG Index" International Journal of Environmental Research and Public Health 18, no. 10: 5187. https://doi.org/10.3390/ijerph18105187