Willingness to Self-Isolate When Facing a Pandemic Risk: Model, Empirical Test, and Policy Recommendations


Abstract
:1. Introduction
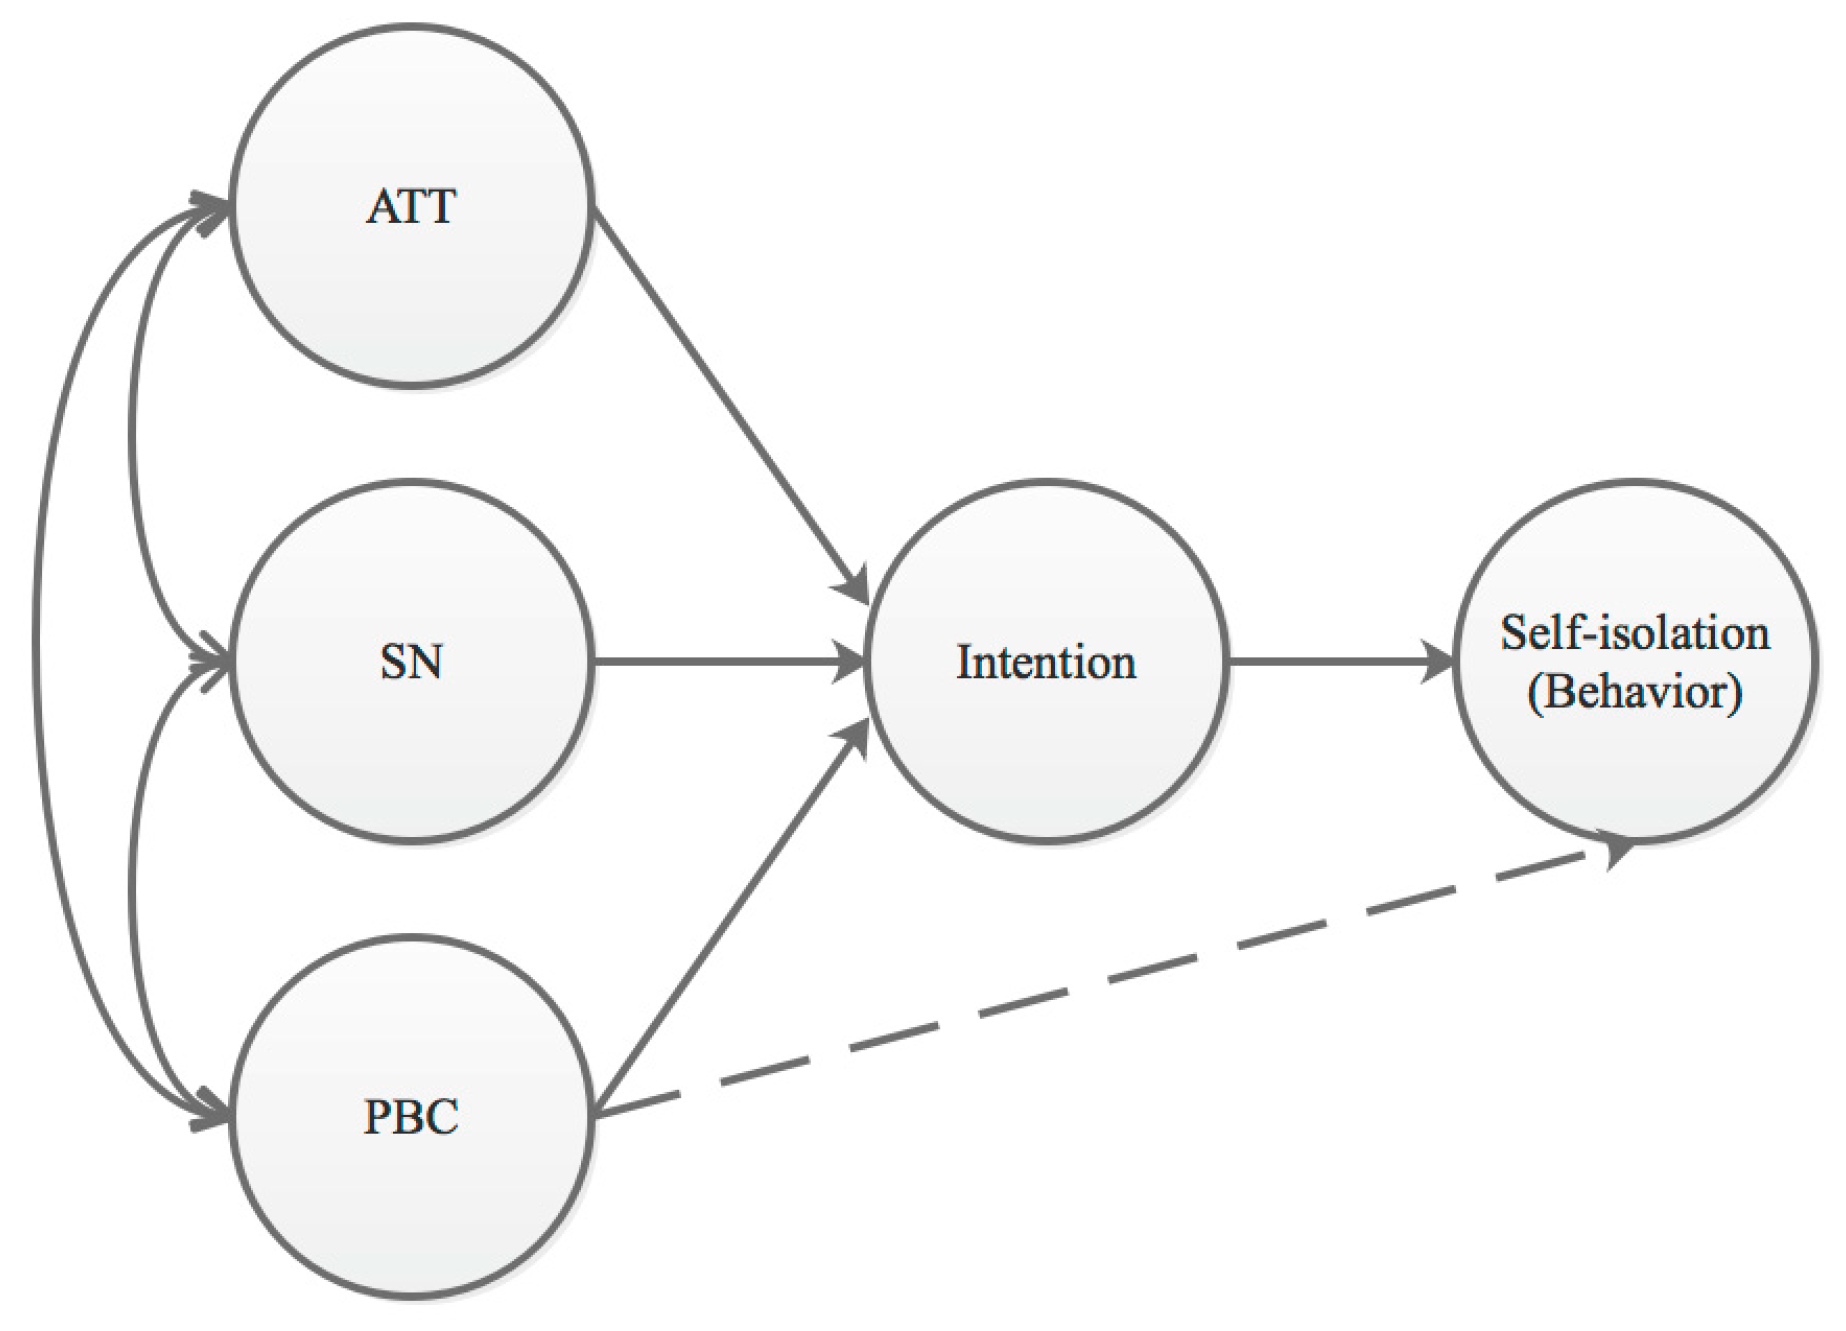
2. Conceptual Model and Hypotheses
3. Materials and Methods
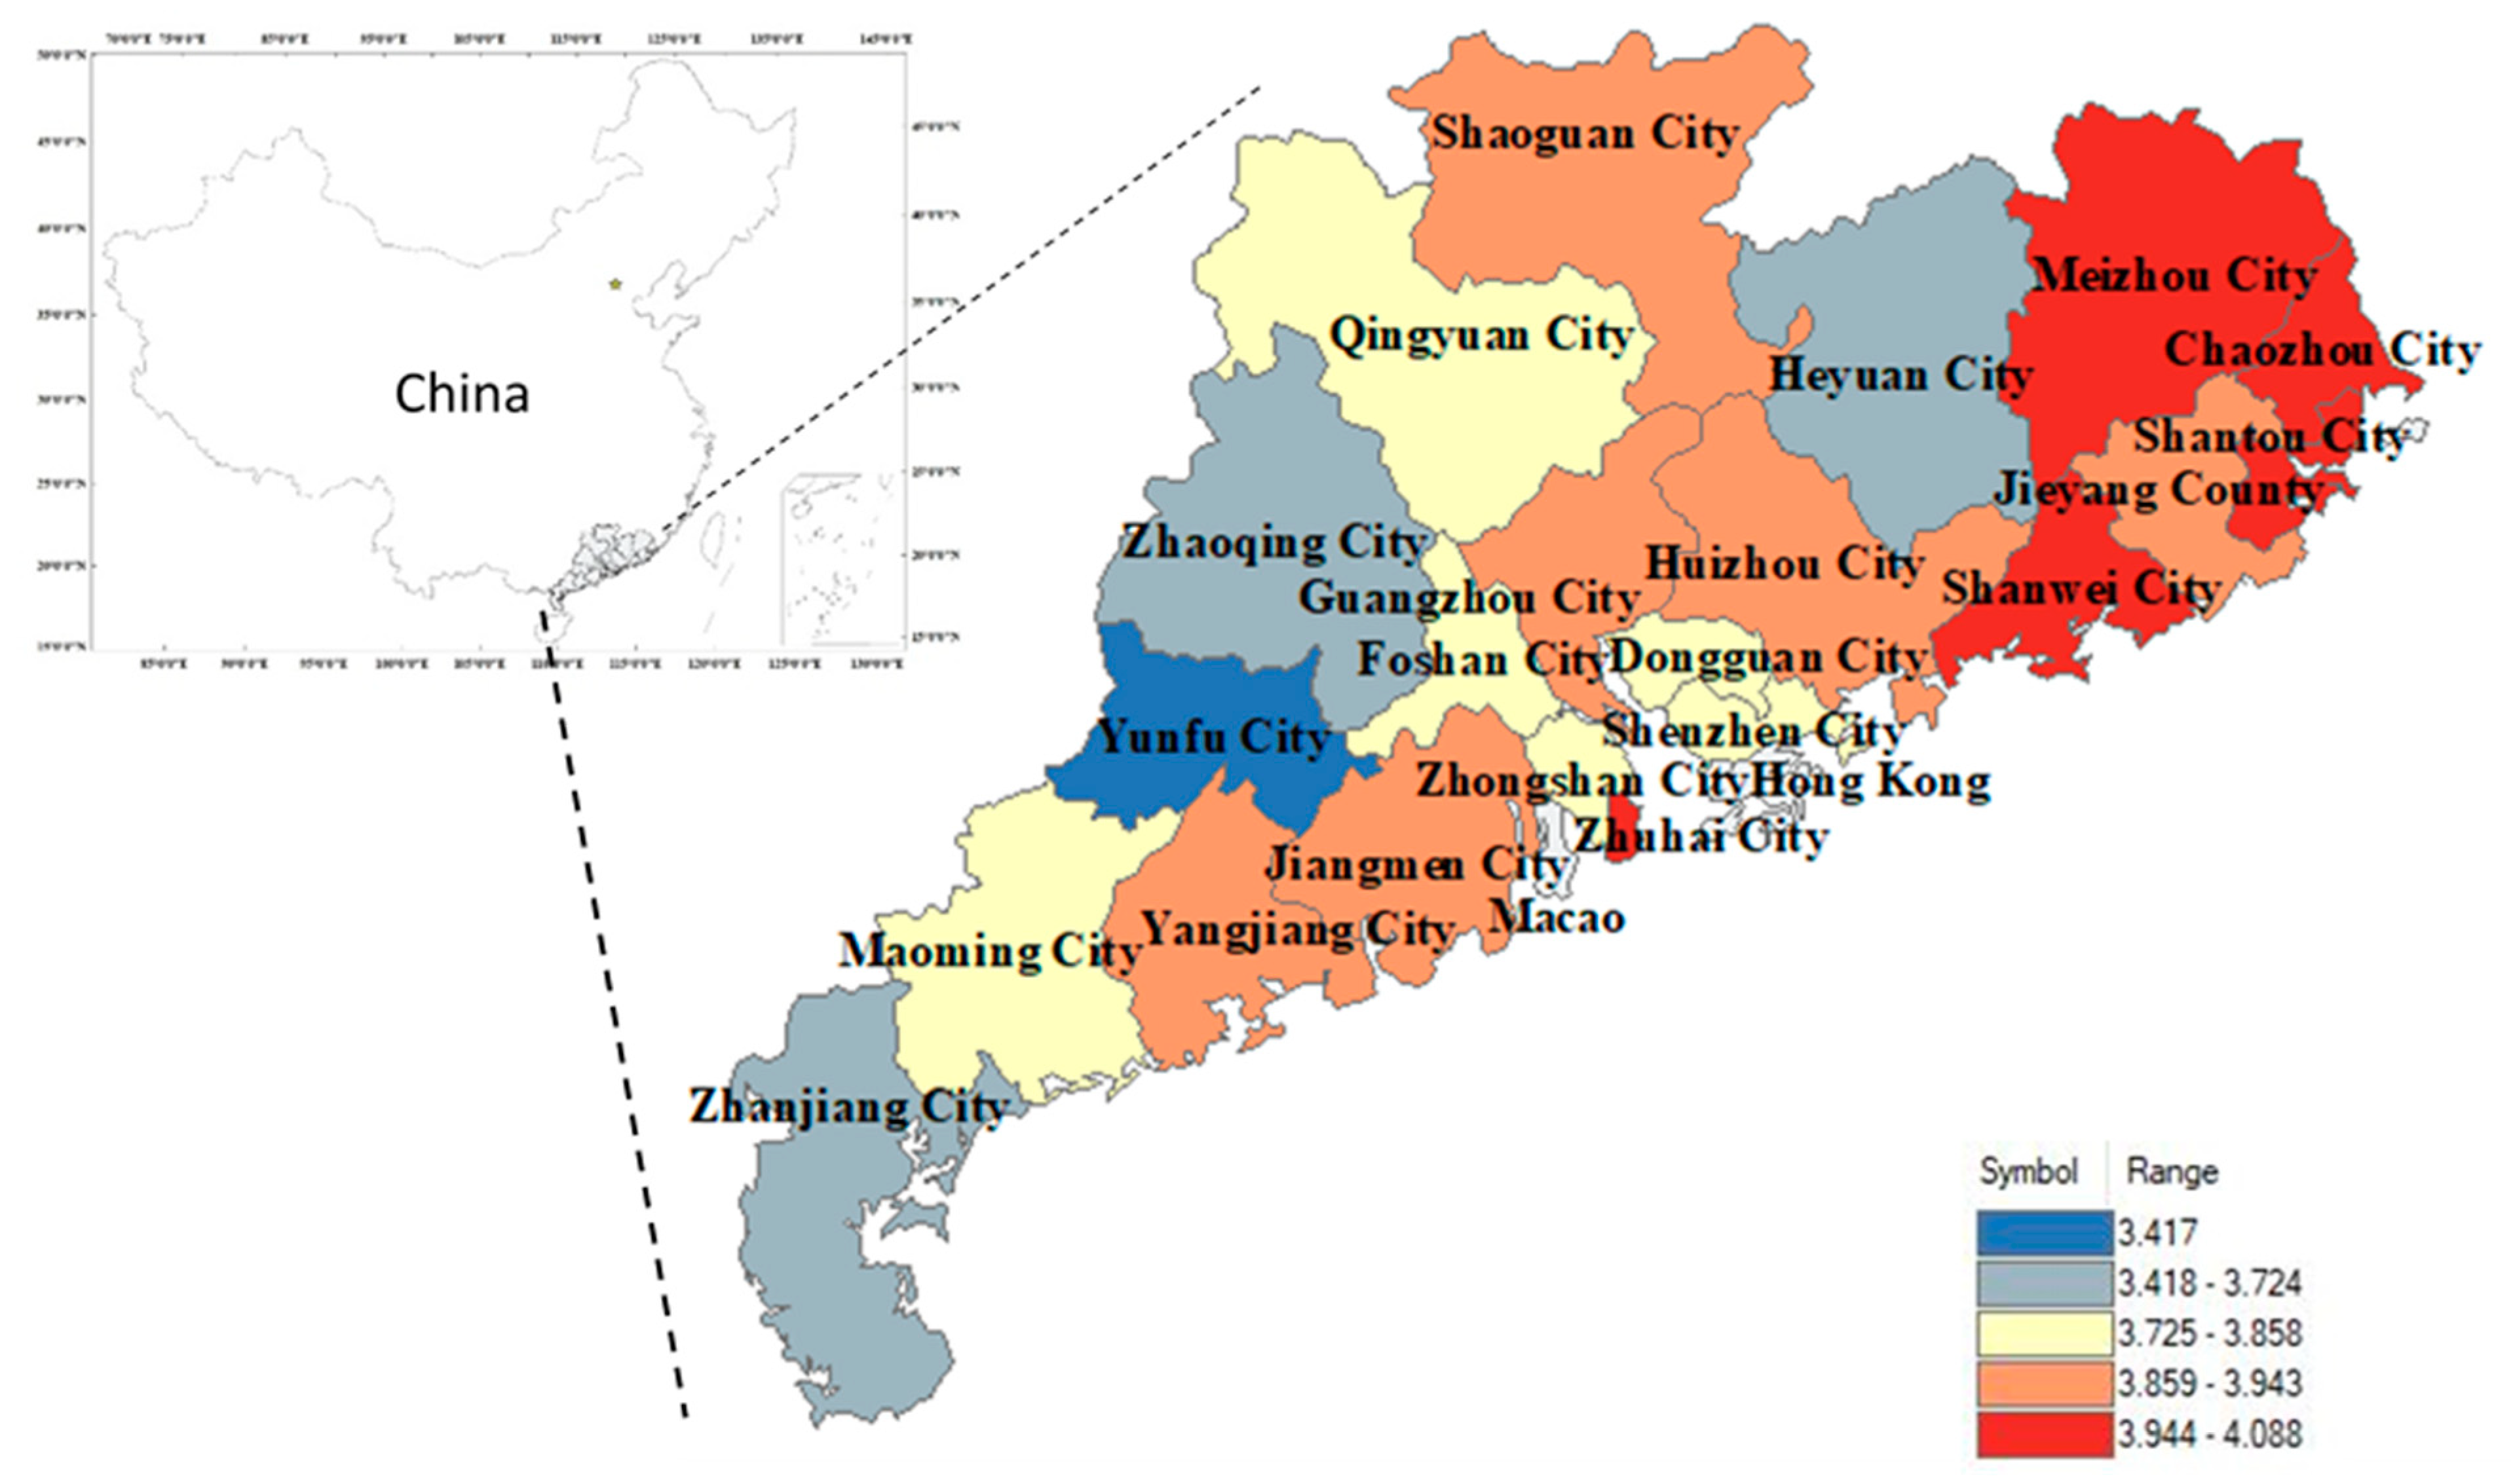
3.1. Study Area
3.2. Definition and Measurement of Explanatory Variables
3.3. Data Analysis
4. Results
4.1. Mapping SI
4.2. Influencing Factors of SI
4.3. Influencing Factors of SI in Difference Regions
5. Discussions
5.1. The Factors Contributing to the Willingness to Self-Isolate
5.2. Policy Recommendations for the Government
6. Conclusions
Author Contributions
Funding
Acknowledgments
Conflicts of Interest
References
- Crokidakis, N.; Queirós, S.M.D. Probing into the effectiveness of self-isolation policies in epidemic control. J. Stat. Mech. 2012, 2012, P06003. [Google Scholar] [CrossRef] [Green Version]
- Vogel, L. World must prepare for inevitable next flu pandemic, WHO says. Reuters, 11 March 2019. [Google Scholar]
- Morse, S.S. Pandemic influenza: Studying the lessons of history. Proc. Natl. Acad. Sci. USA 2007, 104, 7313–7314. [Google Scholar] [CrossRef] [Green Version]
- Markel, H.; Lipman, H.B.; Navarro, J.A.; Sloan, A.; Michalsen, J.R.; Stern, A.M.; Cetron, M.S. Nonpharmaceutical Interventions Implemented by US Cities during the 1918–1919 Influenza Pandemic. JAMA 2007, 298, 644–654. [Google Scholar] [CrossRef] [PubMed] [Green Version]
- Wu, J.T.; Cowling, B.J.; Lau, E.H.Y.; Ip, D.K.M.; Ho, L.-M.; Tsang, T.; Chuang, S.-K.; Leung, P.-Y.; Lo, S.-V.; Liu, S.-H.; et al. School Closure and Mitigation of Pandemic (H1N1) 2009, Hong Kong. Emerg. Infect. Dis. 2010, 16, 538–541. [Google Scholar] [CrossRef] [PubMed]
- Hollins, J. Leviticus 13. In Holy Bible; Kessinger Publishing: Whitefish, MT, USA, 2005. [Google Scholar]
- Kass, N.E. An Ethics Framework for Public Health. Am. J. Public Health 2001, 91, 1776–1782. [Google Scholar] [CrossRef] [PubMed]
- Rashid, H.; Ridda, I.; King, C.; Begun, M.; Tekin, H.; Wood, J.G.; Booy, R. Evidence compendium and advice on social distancing and other related measures for response to an influenza pandemic. Paediatr. Respir. Rev. 2015, 16, 119–126. [Google Scholar] [CrossRef]
- Flahault, A.; Vergu, E.; Coudeville, L.; Grais, R.F. Strategies for containing a global influenza pandemic. Vaccine 2006, 24, 6751–6755. [Google Scholar] [CrossRef]
- Haber, M.J.; Shay, D.K.; Davis, X.M.; Patel, R.; Jin, X.; Weintraub, E.; Orenstein, E.; Thompson, W.W. Effectiveness of Interventions to Reduce Contact Rates during a Simulated Influenza Pandemic. Emerg. Infect. Dis. 2007, 13, 581–589. [Google Scholar] [CrossRef]
- Smylie, M.A. Reducing Racial Isolation in Large School Districts: The Comparative Effectiveness of Mandatory and Voluntary Desegregation Strategies. Urban Educ. 1983, 17, 477–502. [Google Scholar] [CrossRef]
- Cook, A.R.; Zhao, X.; Chen, M.I.C.; Finkelstein, E.A. Public preferences for interventions to prevent emerging infectious disease threats: A discrete choice experiment. BMJ Open 2018, 8, e017355. [Google Scholar] [CrossRef] [Green Version]
- Van, D.; McLaws, M.-L.; Crimmins, J.; MacIntyre, C.R.; Seale, H. University life and pandemic influenza: Attitudes and intended behaviour of staff and students towards pandemic (H1N1) 2009. BMC Public Health 2010, 10, 130. [Google Scholar] [CrossRef] [PubMed] [Green Version]
- Zhang, Q.; Wang, D. Assessing the Role of Voluntary Self-Isolation in the Control of Pandemic Influenza Using a Household Epidemic Model. Int. J. Environ. Res. Public Health 2015, 12, 9750–9767. [Google Scholar] [CrossRef] [Green Version]
- Nicoll, A. Personal (non-pharmaceutical) protective measures for reducing transmission of influenza—ECDC interim recommendations. Wkly. Releases (1997–2007) 2006, 11, 3061. [Google Scholar] [CrossRef] [PubMed]
- Becker, N.G.; Glass, K.; Li, Z.; Aldis, G.K. Controlling emerging infectious diseases like SARS. Math. Biosci. 2005, 193, 205–221. [Google Scholar] [CrossRef] [PubMed]
- Loustalot, F.; Silk, B.J.; Gaither, A.; Shim, T.; Lamias, M.; Dawood, F.; Morgan, O.W.; Fishbein, D.; Guerra, S.; Verani, J.R.; et al. Household Transmission of 2009 Pandemic Influenza A (H1N1) and Nonpharmaceutical Interventions among Households of High School Students in San Antonio, Texas. Clin. Infect. Dis. 2011, 52, 146–153. [Google Scholar] [CrossRef]
- Teh, B.; Olsen, K.; Black, J.; Cheng, A.C.; Aboltins, C.; Bull, K.; Johnson, P.D.R.; Grayson, M.L.; Torresi, J. Impact of swine influenza and quarantine measures on patients and households during the H1N1/09 pandemic. Scand. J. Infect. Dis. 2012, 44, 289–296. [Google Scholar] [CrossRef]
- Kavanagh, A.M.; Bentley, R.J.; Mason, K.E.; McVernon, J.; Petrony, S.; Fielding, J.; LaMontagne, A.D.; Studdert, D.M. Sources, perceived usefulness and understanding of information disseminated to families who entered home quarantine during the H1N1 pandemic in Victoria, Australia: A cross-sectional study. BMC Infect. Dis. 2011, 11, 2. [Google Scholar] [CrossRef] [Green Version]
- Mas, F.S.; Jacobson, H.E.; Olivarez, A.; Hsu, C.E.; Juo, H.-H. Communicating H1N1 Risk to College Students: A Regional Cross-Sectional Survey Study. J. Homel. Secur. Emerg. Manag. 2012, 9. [Google Scholar] [CrossRef]
- Katz, R.; May, L.; Sanza, M.; Johnston, L.; Petinaux, B. H1N1 Preventive Health Behaviors in a University Setting. J. Am. Coll. Health 2012, 60, 46–56. [Google Scholar] [CrossRef]
- Eastwood, K.; Durrheim, D.; Francis, J.L.; d’Espaignet, E.T.; Duncan, S.; Islam, F.; Speare, R. Knowledge about pandemic influenza and compliance with containment measures among Australians. Bull. World Health Organ. 2009, 87, 588–594. [Google Scholar] [CrossRef]
- Horney, J.A.; Moore, Z.; Davis, M.; MacDonald, P.D.M. Intent to Receive Pandemic Influenza A (H1N1) Vaccine, Compliance with Social Distancing and Sources of Information in NC, 2009. PLoS ONE 2010, 5, e11226. [Google Scholar] [CrossRef] [PubMed]
- Eastwood, K.; Durrheim, D.N.; Butler, M.; Jones, A. Responses to Pandemic (H1N1) 2009, Australia. Emerg. Infect. Dis. 2010, 16, 1211–1216. [Google Scholar] [CrossRef] [PubMed]
- Mousavi, S.M.; Sharafkhani, N.; Didarloo, P.; Didarloo, A. Using the Theory of Planned Behavior to Explain Intent to Consume Sugar-Sweetened Beverages among Secondary School Students. Int. J. Pediatr. Mashhad 2019, 7, 9413–9422. [Google Scholar]
- Ajzen, I. The theory of planned behavior. Organ. Behav. Hum. Decis. Process. 1991, 50, 179–211. [Google Scholar] [CrossRef]
- Conner, M.; Armitage, C.J. Extending the theory of planned behavior: A review and avenues for further research. J. Appl. Soc. Psychol. 1998, 28, 1429–1464. [Google Scholar] [CrossRef]
- Ju, D.; Xu, M.; Qin, X.; Spector, P. A Multilevel Study of Abusive Supervision, Norms, and Personal Control on Counterproductive Work Behavior: A Theory of Planned Behavior Approach. J. Leadersh. Organ. Stud. 2019, 26, 163–178. [Google Scholar] [CrossRef]
- Jeihooni, A.K.; Kouhpayeh, A.; Najafi, S.; Bazrafshan, M.-R. Application theory of planned behavior on promotion of safe sexual behaviors among drug users. J. Subst. Use 2019, 24, 293–299. [Google Scholar] [CrossRef]
- Armitage, C.J.; Conner, M. Distinguishing perceptions of control from self-efficacy: Predicting consumption of a low-fat diet using the theory of planned behavior. J. Appl. Soc. Psychol. 1999, 29, 72–90. [Google Scholar] [CrossRef]
- Conner, M.; Norman, P.; Bell, R. The theory of planned behavior and healthy eating. Health Psychol. 2002, 21, 194–201. [Google Scholar] [CrossRef]
- Ajzen, I. Attitudes, Traits, and Actions: Dispositional Prediction of Behavior in Personality and Social Psychology. In Advances in Experimental Social Psychology; Berkowitz, L., Ed.; Academic Press: New York, NY, USA, 1987; Volume 20, pp. 1–63. [Google Scholar]
- Fishbein, M.; Ajzen, I. Belief, Attitude, Intention and Behaviour: An Introduction to Theory and Research. 1977. Available online: https://philarchive.org/archive/FISBAI (accessed on 6 December 2019).
- Rhodes, R.E.; Courneya, K.S. Investigating multiple components of attitude, subjective norm, and perceived control: An examination of the theory of planned behaviour in the exercise domain. Br. J. Soc. Psychol. 2003, 42, 129–146. [Google Scholar] [CrossRef]
- Maxwell, K.A. Friends: The Role of Peer Influence across Adolescent Risk Behaviors. J. Youth Adolesc. 2002, 31, 267–277. [Google Scholar] [CrossRef]
- Terry, D.; Oleary, J. The Theory of Planned Behavior—The Effects of Perceived Behavioral-Control and Self-Efficacy. Br. J. Soc. Psychol. 1995, 34, 199–220. [Google Scholar] [CrossRef] [PubMed]
- DeLay, P. Gender and Monitoring the Response to HIV/AIDS Pandemic1. Emerg. Infect. Dis. 2004, 10, 1979–1983. [Google Scholar] [CrossRef] [PubMed] [Green Version]
- Park, J.-H.; Cheong, H.-K.; Son, D.-Y.; Kim, S.-U.; Ha, C.-M. Perceptions and behaviors related to hand hygiene for the prevention of H1N1 influenza transmission among Korean university students during the peak pandemic period. BMC Infect. Dis. 2010, 10, 222. [Google Scholar] [CrossRef] [PubMed] [Green Version]
- Ek, S. Gender differences in health information behaviour: A Finnish population-based survey. Health Promot. Int. 2015, 30, 736–745. [Google Scholar] [CrossRef] [Green Version]
- Ibuka, Y.; Chapman, G.B.; Meyers, L.A.; Li, M.; Galvani, A.P. The dynamics of risk perceptions and precautionary behavior in response to 2009 (H1N1) pandemic influenza. BMC Infect. Dis. 2010, 10, 296. [Google Scholar] [CrossRef] [Green Version]
- Bults, M.; Beaujean, D.J.; de Zwart, O.; Kok, G.; van Empelen, P.; van Steenbergen, J.E.; Richardus, J.H.; Voeten, H.A. Perceived risk, anxiety, and behavioural responses of the general public during the early phase of the Influenza A (H1N1) pandemic in the Netherlands: Results of three consecutive online surveys. BMC Public Health 2011, 11, 2. [Google Scholar] [CrossRef] [Green Version]
- Popkin, B.M.; Zizza, C.; Siega-Riz, A.M. Who is leading the change? U.S. dietary quality comparison between 1965 and 1996. Am. J. Prev. Med. 2003, 25, 1–8. [Google Scholar] [CrossRef]
- Wong, L.P.; Sam, I.-C. Public Sources of Information and Information Needs for Pandemic Influenza A(H1N1). J. Community Health 2010, 35, 676–682. [Google Scholar] [CrossRef]
- Roger, D.; Martin, G.; Abdool Quarraisha, K.; Chorh Chuan, T. Risk perception and communication. In Oxford Textbook of Global Public Health; Oxford University Press: Oxford, UK, 2015; pp. 987–1002. ISBN 978-0-19-178856-7. [Google Scholar]
- Schoenborn, C.A. Marital status and health: United States, 1999–2002. Adv. Data 2004. Available online: http://citeseerx.ist.psu.edu/viewdoc/download?doi=10.1.1.137.3613&rep=rep1&type=pdf (accessed on 6 December 2019).
- Hutchins, S.S.; Truman, B.I.; Merlin, T.L.; Redd, S.C. Protecting Vulnerable Populations from Pandemic Influenza in the United States: A Strategic Imperative. Am. J. Public Health 2009, 99, 243–248. [Google Scholar] [CrossRef]
- Campbell, V.A.; Gilyard, J.A.; Sinclair, L.; Sternberg, T.; Kailes, J.I. Preparing for and Responding to Pandemic Influenza: Implications for People with Disabilities. Am. J. Public Health 2009, 99, 294–300. [Google Scholar] [CrossRef] [PubMed]
- Zhang, C.Q.; Zhang, R.; Chung, P.K.; Duan, Y.; fai Lau, J.T.; Chan, D.K.C.; Hagger, M.S. Promoting influenza prevention for elderly people in Hong Kong using health action process approach: Study protocol. BMC Public Health 2018, 18, 1230. [Google Scholar] [CrossRef] [PubMed]
- Chuang, Y.-C.; Huang, Y.-L.; Tseng, K.-C.; Yen, C.-H.; Yang, L. Social Capital and Health-Protective Behavior Intentions in an Influenza Pandemic. PLoS ONE 2015, 10, e0122970. [Google Scholar] [CrossRef] [PubMed] [Green Version]
- Van der Weerd, W.; Timmermans, D.R.; Beaujean, D.J.; Oudhoff, J.; van Steenbergen, J.E. Monitoring the level of government trust, risk perception and intention of the general public to adopt protective measures during the influenza A (H1N1) pandemic in the Netherlands. BMC Public Health 2011, 11, 575. [Google Scholar] [CrossRef] [PubMed] [Green Version]
- Sadique, M.Z.; Edmunds, W.J.; Smith, R.D.; Meerding, W.J.; de Zwart, O.; Brug, J.; Beutels, P. Precautionary Behavior in Response to Perceived Threat of Pandemic Influenza. Emerg. Infect. Dis. 2007, 13, 1307–1313. [Google Scholar] [CrossRef] [PubMed]
- Vaughan, E.; Tinker, T. Effective Health Risk Communication about Pandemic Influenza for Vulnerable Populations. Am. J. Public Health 2009, 99, 324–332. [Google Scholar] [CrossRef]
- Reissman, D.B.; Watson, P.J.; Klomp, R.W.; Tanielian, T.L.; Prior, S.D. Pandemic Influenza Preparedness: Adaptive Responses to an Evolving Challenge. J. Homel. Secur. Emerg. Manag. 2006, 3. [Google Scholar] [CrossRef]
- Rizzo, C.; Rota, M.C.; Bella, A.; Giannitelli, S.; Santis, S.D.; Nacca, G.; Pompa, M.G.; Vellucci, L.; Salmaso, S.; Declich, S. Response to the 2009 influenza A(H1N1) pandemic in Italy. Eurosurveillance 2010, 15, 19744. [Google Scholar] [CrossRef] [Green Version]
- Guan, Y.; Zheng, B.J.; He, Y.Q.; Liu, X.L.; Zhuang, Z.X.; Cheung, C.L.; Luo, S.W.; Li, P.H.; Zhang, L.J.; Guan, Y.J.; et al. Isolation and Characterization of Viruses Related to the SARS Coronavirus from Animals in Southern China. Science 2003, 302, 276–278. [Google Scholar] [CrossRef] [Green Version]
- Zhou, P.-P.; Yu, G.; Kuang, Y.-Q.; Huang, X.-H.; Li, Y.; Fu, X.; Lin, P.; Yan, J.; He, X. Rapid and complicated HIV genotype expansion among high-risk groups in Guangdong Province, China. BMC Infect. Dis. 2019, 19, 185. [Google Scholar] [CrossRef] [Green Version]
- Cao, S.-M.; Xu, Y.-J.; Lin, G.-Z.; Huang, Q.-H.; Wei, K.-R.; Xie, S.-H.; Liu, Q. Estimation of cancer burden in Guangdong Province, China in 2009. Chin. J. Cancer 2015, 34, 58. [Google Scholar] [CrossRef] [PubMed] [Green Version]
- Klement, C.; Kissova, R.; Lengyelova, V.; Stipalova, D.; Sobotova, Z.; Galama, J.M.D.; Bopegamage, S. Human enterovirus surveillance in the Slovak Republic from 2001 to 2011. Epidemiol. Infect. 2013, 141, 2658–2662. [Google Scholar] [CrossRef] [PubMed] [Green Version]
- Sun, L.; Zheng, H.; Zheng, H.; Guo, X.; He, J.; Guan, D.; Kang, M.; Liu, Z.; Ke, C.; Li, J.; et al. An enterovirus 71 epidemic in Guangdong Province of China, 2008: Epidemiological, clinical, and virogenic manifestations. Jpn. J. Infect. Dis. 2011, 64, 13–18. [Google Scholar] [PubMed]

| Variable | Indicators | Variable Description |
|---|---|---|
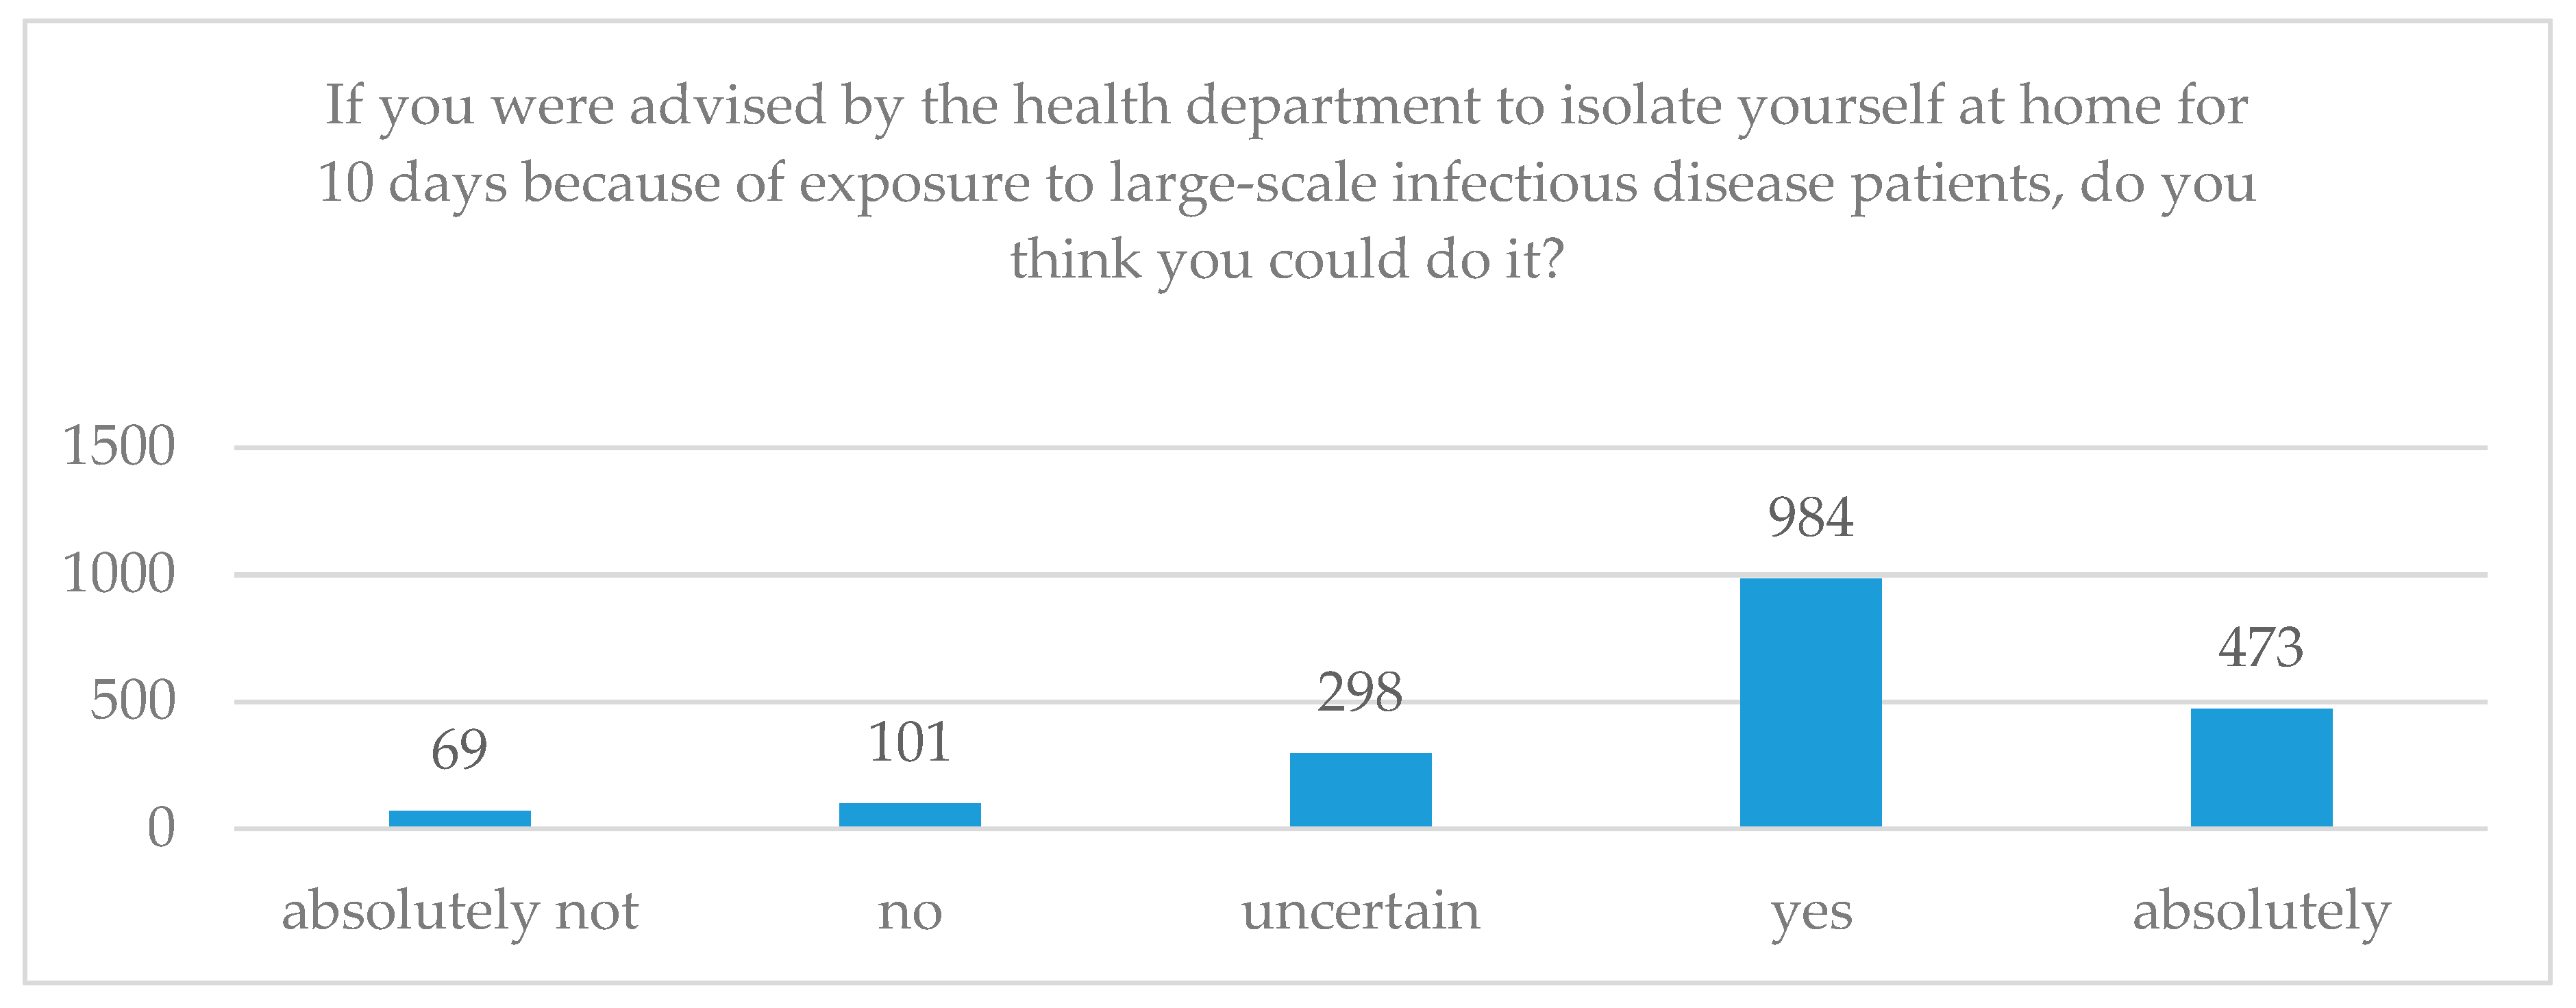
| SI | “If you were advised by the health department to isolate yourself at home for 10 days because of exposure to large-scale infectious disease patients, do you think you could do it?” | (1) Absolutely not, (2) No, (3) Uncertain, (4) Yes, (5) Absolutely |
| ATT | “Do you agree or disagree with the government’s mandatory isolation of infected people during a large-scale epidemic of an infectious disease?” | (1) Strongly disagree, (2) Disagree, (3) It does not matter, (4) Agree, (5) Strongly agree |
| SN | “If you were infected with a pandemic disease, would you let your neighbors or colleagues know?” | (1) Absolutely not, (2) No, (3) Probably, (4) Absolutely |
| “How much do you trust the infectious disease prevention information/text messages issued by the health department?” | (1) Strongly distrust, (2) Distrust, (3) Cannot say trust or distrust, (4) Trust, (5) Strongly trust | |
| PBC | “Do you think that a large-scale infectious disease would have a serious impact on you or your family?” | (1) Not serious at all, (2) Not too serious, (3) A little serious, (4) Very serious |
| “Are you worried about large-scale infectious diseases?” | (1) Not worried at all, (2) Not too worried, (3) A little worried, (4) Very worried | |
| “Do you have confidence that you can protect yourself and your family if a large-scale infectious disease occurs?” | (1) No confidence, (2) Little confidence, (3) Uncertain, (4) Some confidence, (5) Very confident | |
| Gender | “What is your gender?” | (1) Male, (2) Female |
| Age | “How old are you?” | (1) 18–44, (2) 45–59, (3) 60–74, (4) 75-89, (5) Older than 90 |
| Education | “What is your highest education level (including your current level of study)?” | (1) Primary school and below, (2) Junior high school, (3) High school, (4) College, (5) Undergraduate, (6) Graduate and above |
| Marriage | “Are you married?” | (1) Not yet, (2) Cohabiting/married, (3) Separated/divorced, (4) Widowed |
| SS | “What level of social and economic status do you think you have?” | (1) Upper level, (2) Middle and upper levels, (3) Middle level, (4) Middle and lower levels, (5) Lower level |
| GT | “Do you agree or disagree with local leaders?” | (1) Strongly disagree, (2) Disagree, (3) It does not matter, (4) Agree, (5) Strongly agree |
| “Do you agree or disagree that local government works well?” | (1) Strongly disagree, (2) Disagree, (3) It does not matter, (4) Agree, (5) Strongly agree | |
| CR | “Do you agree or disagree that your community has the resources (capital/technology/materials/services, etc.) to solve community problems?” | (1) Strongly disagree, (2) Disagree, (3) It does not matter, (4) Agree, (5) Strongly agree |
| ES | “If an emergency happens, do you agree or disagree that your community can provide emergency services?” | (1) Strongly disagree, (2) Disagree, (3) It does not matter, (4) Agree, (5) Strongly agree |
| FNSC | “Is there anyone under 18 in your family?” | (1) Yes, (2) No |
| “Is there anyone older than 60 in your family?” | (1) Yes, (2) No | |
| “Is there anyone with a disability in your family?” | (1) Yes, (2) No | |
| “Is there anyone with a chronic disease in your family?” | (1) Yes, (2) No |
| Variable | Obs | Mean | Std. Dev. | Min | Max |
|---|---|---|---|---|---|
| SI | 1925 | 3.878 | 0.958 | 1 | 5 |
| PBC | 1925 | 9.051 | 1.836 | 3 | 13 |
| ATT | 1925 | 4.004 | 0.915 | 1 | 5 |
| SN | 1925 | 7.387 | 1.194 | 2 | 9 |
| Gender | 1925 | 0.543 | 0.498 | 0 | 1 |
| Age | 1925 | 35.118 | 13.670 | 18 | 66 |
| Edu | 1925 | 4.242 | 1.202 | 1 | 6 |
| Marriage | 1925 | 0.665 | 0.472 | 0 | 1 |
| SS | 1925 | 3.079 | 0.941 | 1 | 5 |
| TL | 1925 | 3.576 | 1.032 | 1 | 5 |
| TG | 1925 | 3.787 | 0.979 | 1 | 5 |
| CR | 1925 | 3.594 | 0.963 | 1 | 5 |
| ES | 1925 | 3.729 | 0.947 | 1 | 5 |
| Child | 1925 | 0.740 | 0.439 | 0 | 1 |
| Old People | 1925 | 0.777 | 0.417 | 0 | 1 |
| Disable | 1925 | 0.124 | 0.330 | 0 | 1 |
| Chronic | 1925 | 0.384 | 0.487 | 0 | 1 |
| FNSC | 1925 | 2.025 | 1.002 | 0 | 4 |
| Variables | SI | PBC | ATT | SN | Gender | Age | Edu | Marriage | SS | TL | TG | CR | ES | Child | Old Peo | Disable | Chronic |
|---|---|---|---|---|---|---|---|---|---|---|---|---|---|---|---|---|---|
| SI | 1 | ||||||||||||||||
| PBC | 0.395 *** | 1 | |||||||||||||||
| ATT | 0.609 *** | 0.371 *** | 1 | ||||||||||||||
| SN | 0.487 *** | 0.332 *** | 0.479 *** | 1 | |||||||||||||
| Gender | 0.001 | −0.028 | −0.029 | 0.027 | 1 | ||||||||||||
| Age | 0.052 ** | 0.026 | 0.057 ** | −0.011 | 0.411 *** | 1 | |||||||||||
| Edu | 0.069 *** | −0.009 | 0.032 | 0.080 *** | −0.066 *** | −0.316 *** | 1 | ||||||||||
| Marriage | 0.113 *** | 0.083 *** | 0.112 *** | 0.077 *** | 0.228 *** | 0.620 *** | 0.007 | 1 | |||||||||
| Soci Eco | 0.072 *** | −0.001 | 0.127 *** | 0.017 | 0.011 | 0.118 *** | −0.349 *** | −0.049 ** | 1 | ||||||||
| TL | 0.203 *** | 0.181 *** | 0.151 *** | 0.259 *** | 0.036 | −0.030 | 0.209 *** | 0.115 *** | −0.271 *** | 1 | |||||||
| TG | 0.211 *** | 0.148 *** | 0.182 *** | 0.308 *** | 0.082 *** | 0.003 | 0.175 *** | 0.093 *** | −0.246 *** | 0.624 *** | 1 | ||||||
| CR | 0.114 *** | 0.131 *** | 0.152 *** | 0.199 *** | 0.022 | 0.0150 | 0.129 *** | 0.134 *** | −0.229 *** | 0.472 *** | 0.416 *** | 1 | |||||
| ES | 0.234 *** | 0.225 *** | 0.242 *** | 0.280 *** | 0.014 | 0.001 | 0.080 *** | 0.106 *** | −0.157 *** | 0.453 *** | 0.479 *** | 0.537 *** | 1 | ||||
| Child | −0.012 | 0.083 *** | −0.009 | 0.020 | −0.039 * | −0.035 | 0.065 *** | 0.209 *** | −0.229 *** | 0.139 *** | 0.177 *** | 0.093 *** | 0.127 *** | 1 | |||
| Old peo | −0.054 ** | 0.073 *** | −0.037 | −0.020 | 0.024 | 0.075 *** | −0.105 *** | 0.029 | −0.066 *** | 0.012 | −0.007 | 0.017 | 0 | 0.100 *** | 1 | ||
| Disable | −0.179 *** | −0.077 *** | −0.210 *** | −0.131 *** | −0.009 | −0.086 *** | 0.007 | −0.103 *** | −0.172 *** | −0.024 | −0.019 | −0.003 | −0.084 *** | 0.119 *** | 0.107 *** | 1 | |
| Chronic | −0.005 | 0.006 | −0.011 | −0.002 | 0.005 | −0.023 | 0.059 ** | 0.020 | −0.097 *** | −0.090 *** | −0.040 * | 0.002 | 0.004 | 0.052 ** | 0.203 *** | 0.276 *** | 1 |
| Variables | (1) | (2) | (3) | (4) |
|---|---|---|---|---|
| Gender | −0.073 | −0.042 | 0.009 | −0.009 |
| (−1.60) | (−0.98) | (0.26) | (−0.26) | |
| Age | 0.001 | 0.002 | 0.001 | 0.002 |
| (0.63) | (0.78) | (0.44) | (1.08) | |
| Edu | 0.055 ** | 0.063 *** | 0.038 * | 0.036 * |
| (2.75) | (3.38) | (2.35) | (2.24) | |
| Marriage | 0.153 * | 0.116 * | 0.059 | 0.043 |
| (2.51) | (2.03) | (1.19) | (0.88) | |
| SS | 0.143 *** | 0.124 *** | 0.037 | 0.029 |
| (5.76) | (5.30) | (1.82) | (1.43) | |
| TL | 0.104 *** | 0.067 ** | 0.068 ** | 0.059 ** |
| (3.79) | (2.62) | (3.06) | (2.69) | |
| TG | 0.109 *** | 0.106 *** | 0.056 * | 0.024 |
| (3.86) | (3.99) | (2.42) | (1.04) | |
| CR | −0.054 * | −0.049 * | −0.067 ** | −0.069 ** |
| (−2.03) | (−1.97) | (−3.10) | (−3.25) | |
| ES | 0.163 *** | 0.103 *** | 0.047 * | 0.036 |
| (5.88) | (3.95) | (2.05) | (1.61) | |
| Child | −0.077 | −0.111 * | −0.078 | −0.064 |
| (−1.51) | (−2.33) | (−1.87) | (−1.59) | |
| Old Peo | −0.079 | −0.134 ** | −0.093 * | −0.090 * |
| (−1.55) | (−2.80) | (−2.24) | (−2.21) | |
| Disable | −0.401 *** | −0.336 *** | −0.128 * | −0.109 * |
| (−6.00) | (−5.35) | (−2.33) | (−2.03) | |
| Chronic | 0.128 ** | 0.112 ** | 0.062 | 0.052 |
| (2.84) | (2.65) | (1.68) | (1.45) | |
| PBC | 0.179 *** | 0.098 *** | 0.082 *** | |
| (16.49) | (9.82) | (8.30) | ||
| ATT | 0.519 *** | 0.443 *** | ||
| (25.06) | (20.50) | |||
| SN | 0.162 *** | |||
| (9.86) | ||||
| _cons | 2.013 *** | 0.832 *** | 0.296 | −0.239 |
| (9.94) | (4.11) | (1.67) | (−1.32) | |
| N | 1925 | 1925 | 1925 | 1925 |
| Adjusted R2 | 0.129 | 0.237 | 0.426 | 0.454 |
| Variables | Pearl River Delta | Eastern Guangdong | Western Guangdong | Northern Guangdong |
|---|---|---|---|---|
| Gender | 0.023 | 0.048 | −0.007 | 0.036 |
| (0.43) | (0.74) | (−0.07) | (0.38) | |
| Age | −0.004 | 0.007 * | −0.005 | 0.015 ** |
| (−1.55) | (2.07) | (−0.69) | (2.87) | |
| Edu | 0.016 | 0.055 * | 0.051 | 0.018 |
| (0.64) | (2.15) | (1.02) | (0.32) | |
| Marriage | 0.085 | 0.135 | −0.063 | 0.046 |
| (1.20) | (1.56) | (−0.40) | (0.38) | |
| SS | −0.039 | 0.196 *** | 0.101 | 0.020 |
| (−1.33) | (5.17) | (1.82) | (0.37) | |
| TL | 0.029 | 0.128 ** | 0.214 *** | 0.027 |
| (0.88) | (3.23) | (3.53) | (0.46) | |
| TG | 0.063 | −0.028 | −0.058 | 0.051 |
| (1.87) | (−0.71) | (−0.83) | (0.83) | |
| CR | −0.111 *** | −0.031 | −0.003 | 0.022 |
| (−3.65) | (−0.80) | (−0.05) | (0.38) | |
| ES | 0.078 * | −0.002 | −0.022 | −0.031 |
| (2.40) | (−0.07) | (−0.31) | (−0.55) | |
| Child | −0.052 | −0.175 * | −0.084 | 0.015 |
| (−0.90) | (−2.43) | (−0.64) | (0.14) | |
| Old peo | −0.107 * | 0.028 | −0.401 ** | 0.029 |
| (−1.97) | (0.35) | (−2.97) | (0.24) | |
| Disable | −0.152 | −0.091 | −0.074 | −0.066 |
| (−1.91) | (−0.81) | (−0.50) | (−0.55) | |
| Chronic | 0.070 | −0.084 | 0.111 | 0.027 |
| (1.33) | (−1.37) | (1.02) | (0.27) | |
| PBC | 0.072 *** | 0.062 ** | 0.096 ** | 0.077 ** |
| (5.23) | (3.31) | (3.14) | (2.72) | |
| ATT | 0.422 *** | 0.421 *** | 0.595 *** | 0.374 *** |
| (14.73) | (8.42) | (8.31) | (6.50) | |
| SN | 0.162 *** | 0.193 *** | 0.062 | 0.260 *** |
| (6.71) | (6.62) | (1.20) | (6.55) | |
| _cons | 0.320 | −0.94 1** | −0.323 | −1.252 ** |
| (1.17) | (−2.80) | (−0.61) | (−2.69) | |
| N | 1107 | 350 | 224 | 244 |
| Adjusted R2 | 0.407 | 0.568 | 0.565 | 0.636 |
© 2019 by the authors. Licensee MDPI, Basel, Switzerland. This article is an open access article distributed under the terms and conditions of the Creative Commons Attribution (CC BY) license (http://creativecommons.org/licenses/by/4.0/).
Share and Cite
Zhang, X.; Wang, F.; Zhu, C.; Wang, Z. Willingness to Self-Isolate When Facing a Pandemic Risk: Model, Empirical Test, and Policy Recommendations. Int. J. Environ. Res. Public Health 2020, 17, 197. https://doi.org/10.3390/ijerph17010197
Zhang X, Wang F, Zhu C, Wang Z. Willingness to Self-Isolate When Facing a Pandemic Risk: Model, Empirical Test, and Policy Recommendations. International Journal of Environmental Research and Public Health. 2020; 17(1):197. https://doi.org/10.3390/ijerph17010197
Chicago/Turabian StyleZhang, Xiaojun, Fanfan Wang, Changwen Zhu, and Zhiqiang Wang. 2020. "Willingness to Self-Isolate When Facing a Pandemic Risk: Model, Empirical Test, and Policy Recommendations" International Journal of Environmental Research and Public Health 17, no. 1: 197. https://doi.org/10.3390/ijerph17010197