WEEE Treatment in Developing Countries: Environmental Pollution and Health Consequences—An Overview

 ,
,  ,
,
Abstract
:1. Introduction
2. Materials and Methods
- Mechanical treatment: fragmentation, sieving, sorting, etc.
- Open burning: burning of compound materials with plastic content to release the metal content, e.g., cable burning
- Leaching processes: acid leaching, amalgamation
- Mixed: more than one treatment technology applied
- NA (not available): unknown, not explained in the paper
3. Results
4. Discussion
5. Conclusions
Supplementary Materials
Author Contributions
Funding
Acknowledgments
Conflicts of Interest
References
- Cucchiella, F.; D’Adamo, I.; Lenny Koh, S.C.; Rosa, P. Recycling of WEEEs: An economic assessment of present and future e-waste streams. Renew. Sustain. Energy Rev. 2015, 51, 263–272. [Google Scholar] [CrossRef] [Green Version]
- Baldé, C.; Forti, V.; Gray, V.; Kuehr, R.; Stegmann, P. The Global E-waste Monitor 2017; United Nations University (UNU): Bonn, Germany; International Telecommunication Union (ITU): Geneva, Switzerland; International Solid Waste Association (ISWA): Vienna, Austria, 2017; Available online: http://collections.unu.edu/eserv/UNU:6341/Global-E-waste_Monitor_2017__electronic_single_pages_.pdf (accessed on 10 January 2019).
- Khaliq, A.; Rhamdhani, M.; Brooks, G.; Masood, S. Metal Extraction Processes for Electronic Waste and Existing Industrial Routes: A Review and Australian Perspective. Resources 2014, 3, 152–179. [Google Scholar] [CrossRef]
- Zhang, L.; Xu, Z. A review of current progress of recycling technologies for metals from waste electrical and electronic equipment. J. Clean. Prod. 2016, 127, 19–36. [Google Scholar] [CrossRef]
- Marra, A.; Cesaro, A.; Belgiorno, V. Separation efficiency of valuable and critical metals in WEEE mechanical treatments. J. Clean. Prod. 2018, 186, 490–498. [Google Scholar] [CrossRef]
- Cesaro, A.; Marra, A.; Belgiorno, V.; Guida, M. Effectiveness of WEEE mechanical treatment: Separation yields and recovered material toxicity. J. Clean. Prod. 2017, 142, 2656–2662. [Google Scholar] [CrossRef]
- Tsydenova, O.; Bengtsson, M. Chemical hazards associated with treatment of waste electrical and electronic equipment. Waste Manag. 2011, 31, 45–58. [Google Scholar] [CrossRef] [PubMed]
- Tue, N.M.; Goto, A.; Takahashi, S.; Itai, T.; Asante, K.A.; Kunisue, T.; Tanabe, S. Release of chlorinated, brominated and mixed halogenated dioxin-related compounds to soils from open burning of e-waste in Agbogbloshie (Accra, Ghana). J. Hazard. Mater. 2016, 302, 151–157. [Google Scholar] [CrossRef]
- Adeola, F.O. WEEE generation and the consequences of its improper disposal. In Waste Electrical and Electronic Equipment Recycling; Vegliò, F., Birloaga, I., Eds.; Woodhead Publishing: Cambridge, UK, 2018; pp. 13–31. [Google Scholar]
- Perkins, D.N.; Brune Drisse, M.N.; Nxele, T.; Sly, P.D. E-waste: A global hazard. Ann. Glob. Heal. 2014, 80, 286–295. [Google Scholar] [CrossRef]
- Tang, X.; Shen, C.; Shi, D.; Cheema, S.A.; Khan, M.I.; Zhang, C.; Chen, Y. Heavy metal and persistent organic compound contamination in soil from Wenling: An emerging e-waste recycling city in Taizhou area, China. J. Hazard. Mater. 2010, 173, 653–660. [Google Scholar] [CrossRef]
- Yu, Y.; Zhu, X.; Li, L.; Lin, B.; Xiang, M.; Zhang, X.; Chen, X.; Yu, Z.; Wang, Z.; Wan, Y. Health implication of heavy metals exposure via multiple pathways for residents living near a former e-waste recycling area in China: A comparative study. Ecotoxicol. Environ. Saf. 2019, 169, 178–184. [Google Scholar] [CrossRef] [PubMed]
- Zeng, X.; Xu, X.; Boezen, H.M.; Huo, X. Children with health impairments by heavy metals in an e-waste recycling area. Chemosphere 2016, 148, 408–415. [Google Scholar] [CrossRef] [PubMed]
- Schluep, M.; Hagelueken, C.; Kuehr, R.; Magalini, F.; Maurer, C.; Meskers, C.; Mueller, E.; Wang, F. Recycling from E-Waste to Resources; United Nations Environment Programme; United Nations University: Berlin, Germany, 2009; Available online: http://www.unep.fr/shared/publications/pdf/DTIx1192xPA-Recycling%20from%20ewaste%20to%20Resources.pdf (accessed on 10 January 2019).
- Breivik, K.; Armitage, J.M.; Wania, F.; Jones, K.C. Tracking the global generation and exports of e-waste. Do existing estimates add up? Environ. Sci. Technol. 2014, 48, 8735–8743. [Google Scholar] [CrossRef]
- Diaz-Barriga, F. Evidence-based intervention programs to reduce children’s exposure to chemicals in e-waste sites. In Discussion Paper for WHO Working Meeting on E-Waste and Children’s Health; WHO: Geneva, Switzerland, 11–12 June 2013; pp. 1–90. [Google Scholar]
- Li, J.; Lopez, N.B.N.; Liu, L.; Zhao, N.; Yu, K.; Zheng, L. Regional or global WEEE recycling. Where to go? Waste Manag. 2013, 33, 923–934. [Google Scholar] [CrossRef] [PubMed]
- Salhofer, S.; Steuer, B.; Ramusch, R.; Beigl, P. WEEE management in Europe and China—A comparison. Waste Manag. 2016, 57, 27–35. [Google Scholar] [CrossRef] [PubMed]
- Chan, J.K.Y.; Wong, M.H. A review of environmental fate, body burdens, and human health risk assessment of PCDD/Fs at two typical electronic waste recycling sites in China. Sci. Total Environ. 2013, 463–464, 1111–1123. [Google Scholar] [CrossRef] [PubMed]
- Ilankoon, I.M.S.K.; Ghorbani, Y.; Chong, M.N.; Herath, G.; Moyo, T.; Petersen, J. E-waste in the international context—A review of trade flows, regulations, hazards, waste management strategies and technologies for value recovery. Waste Manag. 2018, 82, 258–275. [Google Scholar] [CrossRef]
- Tzoraki, O.; Lasithiotakis, M. Environmental risks associated with waste electrical and electronic equipment recycling plants. In Reference Module in Earth Systems and Environmental Sciences; Elsevier Inc.: Amsterdam, The Netherlands, 2018. [Google Scholar]
- International Labour Organization (ILO). Women and Men in the Informal Economy: A Statistical Picture, 3rd ed.; ILO: Geneva, Switzerland, 2018. [Google Scholar]
- Ongondo, F.O.; Williams, I.D.; Cherrett, T.J. How are WEEE doing? A global review of the management of electrical and electronic wastes. Waste Manag. 2011, 31, 714–730. [Google Scholar] [CrossRef]
- Annamalay, J. Occupational health hazards related to informal recycling of E-waste in India: An overview. Indian J. Occup. Environ. Med. 2015, 19, 61–65. [Google Scholar] [CrossRef] [Green Version]
- Raghupathy, L.; Krüger, C.; Chaturvedi, A.; Arora, R.; Henzler, M. E-Waste Recycling In India—Bridging The Gap Between The Informal And Formal Sector. Available online: https://www.iswa.org/fileadmin/galleries/General Assembly and WC 2010 11 Hamburg/Presentations/Krueger.pdf (accessed on 3 April 2019).
- Awasthi, A.K.; Zeng, X.; Li, J. Environmental pollution of electronic waste recycling in India: A critical review. Environ. Pollut. 2016, 211, 259–270. [Google Scholar] [CrossRef]
- Singh, M.; Thind, P.S.; John, S. Health risk assessment of the workers exposed to the heavy metals in e-waste recycling sites of Chandigarh and Ludhiana, Punjab, India. Chemosphere 2018, 203, 426–433. [Google Scholar] [CrossRef]
- Awasthi, A.K.; Wang, M.; Awasthi, M.K.; Wang, Z.; Li, J. Environmental pollution and human body burden from improper recycling of e-waste in China: A short-review. Environ. Pollut. 2018, 243, 1310–1316. [Google Scholar] [CrossRef] [PubMed]
- Suzuki, G.; Someya, M.; Matsukami, H.; Tue, N.M.; Uchida, N.; Tuyen, L.H.; Viet, P.H.; Takahashi, S.; Tanabe, S.; Brouwer, A.; et al. Comprehensive evaluation of dioxins and dioxin-like compounds in surface soils and river sediments from e-waste-processing sites in a village in northern Vietnam: Heading towards the environmentally sound management of e-waste. Emerg. Contam. 2016, 2, 98–108. [Google Scholar] [CrossRef] [Green Version]
- Prudêncio, M.I.; Gonzalez, M.I.; Dias, M.I.; Galan, E.; Ruiz, F. Geochemistry of sediments from El Melah lagoon ( NE Tunisia ): A contribution for the evaluation of anthropogenic inputs. J. Arid Environ. 2007, 69, 285–298. [Google Scholar] [CrossRef]
- Song, Q.; Li, J. Environmental effects of heavy metals derived from the e-waste recycling activities in China: A systematic review. Waste Manag. 2014, 34, 2587–2594. [Google Scholar] [CrossRef] [PubMed]
- Bi, X.; Simoneit, B.R.T.; Wang, Z.; Wang, X.; Sheng, G.; Fu, J. The major components of particles emitted during recycling of waste printed circuit boards in a typical e-waste workshop of South China. Atmos. Environ. 2010, 44, 4440–4445. [Google Scholar] [CrossRef]
- Bi, X.; Li, Z.; Zhuang, X.; Han, Z.; Yang, W. High levels of antimony in dust from e-waste recycling in southeastern China. Sci. Total Environ. 2011, 409, 5126–5128. [Google Scholar] [CrossRef]
- Zhu, Z.; Han, Z.; Bi, X.; Yang, W. The relationship between magnetic parameters and heavy metal contents of indoor dust in e-waste recycling impacted area, Southeast China. Sci. Total Environ. 2012, 433, 302–308. [Google Scholar] [CrossRef]
- Leung, A.; Cai, Z.W.; Wong, M.H. Environmental contamination from electronic waste recycling at Guiyu, southeast China. J. Mater. Cycles Waste Manag. 2006, 8, 21–33. [Google Scholar] [CrossRef]
- Wang, J.; Liu, L.; Wang, J.; Pan, B.; Fu, X.; Zhang, G.; Zhang, L.; Lin, K. Distribution of metals and brominated flame retardants (BFRs) in sediments, soils and plants from an informal e-waste dismantling site, South China. Environ. Sci. Pollut. Res. 2015, 22, 1020–1033. [Google Scholar] [CrossRef]
- Wong, M.H.; Wu, S.C.; Deng, W.J.; Yu, X.Z.; Luo, Q.; Leung, A.O.W.; Wong, C.S.C.; Luksemburg, W.J.; Wong, A.S. Export of toxic chemicals—A review of the case of uncontrolled electronic-waste recycling. Environ. Pollut. 2007, 149, 131–140. [Google Scholar] [CrossRef]
- Deng, W.J.; Louie, P.K.K.; Liu, W.K.; Bi, X.H.; Fu, J.M.; Wong, M.H. Atmospheric levels and cytotoxicity of PAHs and heavy metals in TSP and PM2.5at an electronic waste recycling site in southeast China. Atmos. Environ. 2006, 40, 6945–6955. [Google Scholar] [CrossRef]
- Sepúlveda, A.; Schluep, M.; Renaud, F.G.; Streicher, M.; Kuehr, R.; Hagelüken, C.; Gerecke, A.C. A review of the environmental fate and effects of hazardous substances released from electrical and electronic equipments during recycling: Examples from China and India. Environ. Impact Assess. Rev. 2010, 30, 28–41. [Google Scholar] [CrossRef]
- Deng, W.J.; Zheng, J.S.; Bi, X.H.; Fu, J.M.; Wong, M.H. Distribution of PBDEs in air particles from an electronic waste recycling site compared with Guangzhou and Hong Kong, South China. Environ. Int. 2007, 33, 1063–1069. [Google Scholar] [CrossRef]
- Wen, S.; Gong, Y.; Li, J.G.; Shi, T.M.; Zhao, Y.F.; Wu, Y.N. Particle-bound PCDD/Fs in the Atmosphere of an Electronic Waste Dismantling Area in China. Biomed. Environ. Sci. 2011, 24, 102–111. [Google Scholar] [PubMed]
- Luo, C.; Liu, C.; Wang, Y.; Liu, X.; Li, F.; Zhang, G.; Li, X. Heavy metal contamination in soils and vegetables near an e-waste processing site, south China. J. Hazard. Mater. 2011, 186, 481–490. [Google Scholar] [CrossRef] [PubMed]
- Quan, S.X.; Yan, B.; Yang, F.; Li, N.; Xiao, X.M.; Fu, J.M. Spatial distribution of heavy metal contamination in soils near a primitive e-waste recycling site. Environ. Sci. Pollut. Res. 2015, 22, 1290–1298. [Google Scholar] [CrossRef]
- Oguri, T.; Suzuki, G.; Matsukami, H.; Uchida, N.; Tue, N.M.; Tuyen, L.H.; Viet, P.H.; Takahashi, S.; Tanabe, S.; Takigami, H. Exposure assessment of heavy metals in an e-waste processing area in northern Vietnam. Sci. Total Environ. 2018, 621, 1115–1123. [Google Scholar] [CrossRef]
- Li, J.; Duan, H.; Shi, P. Heavy metal contamination of surface soil in electronic waste dismantling area: Site investigation and source-apportionment analysis. Waste Manag. Res. 2011, 29, 727–738. [Google Scholar]
- Alabi, O.A.; Bakare, A.A.; Xu, X.; Li, B.; Zhang, Y.; Huo, X. Comparative evaluation of environmental contamination and DNA damage induced by electronic-waste in Nigeria and China. Sci. Total Environ. 2012, 423, 62–72. [Google Scholar] [CrossRef]
- Zhao, W.; Ding, L.; Gu, X.; Luo, J.; Liu, Y.; Guo, L.; Shi, Y.; Huang, T.; Cheng, S. Levels and ecological risk assessment of metals in soils from a typical e-waste recycling region in southeast China. Ecotoxicology 2015, 24, 1947–1960. [Google Scholar] [CrossRef]
- Nie, X.; Fan, C.; Wang, Z.; Su, T.; Liu, X.; An, T. Toxic assessment of the leachates of paddy soils and river sediments from e-waste dismantling sites to microalga, Pseudokirchneriella subcapitata. Ecotoxicol. Environ. Saf. 2015, 111, 168–176. [Google Scholar] [CrossRef] [PubMed]
- Leung, A.O.W.; Duzgoren-Aydin, N.S.; Cheung, K.C.; Wong, M.H. Heavy metals concentrations of surface dust from e-waste recycling and its human health implications in southeast China. Environ. Sci. Technol. 2008, 42, 2674–2680. [Google Scholar] [CrossRef] [PubMed]
- Wong, C.S.C.; Wu, S.C.; Duzgoren-Aydin, N.S.; Aydin, A.; Wong, M.H. Trace metal contamination of sediments in an e-waste processing village in China. Environ. Pollut. 2007, 145, 434–442. [Google Scholar] [CrossRef] [PubMed]
- Wong, C.S.C.; Duzgoren-Aydin, N.S.; Aydin, A.; Wong, M.H. Evidence of excessive releases of metals from primitive e-waste processing in Guiyu, China. Environ. Pollut. 2007, 148, 62–72. [Google Scholar] [CrossRef]
- Liu, H.; Zhou, Q.; Wang, Y.; Zhang, Q.; Cai, Z.; Jiang, G. E-waste recycling induced polybrominated diphenyl ethers, polychlorinated biphenyls, polychlorinated dibenzo-p-dioxins and dibenzo-furans pollution in the ambient environment. Environ. Int. 2008, 34, 67–72. [Google Scholar] [CrossRef] [Green Version]
- Zeng, X.; Xu, X.; Zheng, X.; Reponen, T.; Chen, A.; Huo, X. Heavy metals in PM2.5and in blood, and children’s respiratory symptoms and asthma from an e-waste recycling area. Environ. Pollut. 2016, 210, 346–353. [Google Scholar] [CrossRef]
- Zhang, M.; Feng, G.; Yin, W.; Xie, B.; Ren, M.; Xu, Z.; Zhang, S.; Cai, Z. Airborne PCDD/Fs in two e-waste recycling regions after stricter environmental regulations. J. Environ. Sci. (China) 2017, 62, 3–10. [Google Scholar] [CrossRef]
- Zheng, X.; Xu, F.; Chen, K.; Zeng, Y.; Luo, X.; Chen, S.; Mai, B.; Covaci, A. Flame retardants and organochlorines in indoor dust from several e-waste recycling sites in South China: Composition variations and implications for human exposure. Environ. Int. 2015, 78, 1–7. [Google Scholar] [CrossRef]
- Fu, J.; Zhou, Q.; Liu, J.; Liu, W.; Wang, T.; Zhang, Q.; Jiang, G. High levels of heavy metals in rice (Oryza sativa L.) from a typical E-waste recycling area in southeast China and its potential risk to human health. Chemosphere 2008, 71, 1269–1275. [Google Scholar] [CrossRef]
- Jun-hui, Z.; Hang, M. Eco-toxicity and metal contamination of paddy soil in an e-wastes recycling area. J. Hazard. Mater. 2009, 165, 744–750. [Google Scholar] [CrossRef]
- Tang, X.; Shen, C.; Chen, L.; Xiao, X.; Wu, J.; Khan, M.I.; Dou, C.; Chen, Y. Inorganic and organic pollution in agricultural soil from an emerging e-waste recycling town in Taizhou area, China. J. Soils Sediments 2010, 10, 895–906. [Google Scholar] [CrossRef]
- Cai, Z.; Jiang, G. Determination of polybrominated diphenyl ethers in soil from e-waste recycling site. Talanta 2006, 70, 88–90. [Google Scholar] [CrossRef] [PubMed]
- Wen, S.; Yang, F.X.; Gong, Y.; Zhang, X.L.; Hui, Y.; Li, J.G.; Liu, A.I.L.; Wu, Y.N.; Lu, W.Q.; Xu, Y. Elevated levels of urinary 8-hydroxy-2′-deoxyguanosine in male electrical and electronic equipment dismantling workers exposed to high concentrations of polychlorinated dibenzo-p-dioxins and dibenzofurans, polybrominated diphenyl ethers, and polychlorinat. Environ. Sci. Technol. 2008, 42, 4202–4207. [Google Scholar] [CrossRef] [PubMed]
- Chakraborty, P.; Prithiviraj, B.; Selvaraj, S.; Kumar, B. Polychlorinated biphenyls in settled dust from informal electronic waste recycling workshops and nearby highways in urban centers and suburban industrial roadsides of Chennai city, India: Levels, congener profiles and exposure assessment. Sci. Total Environ. 2016, 573, 1413–1421. [Google Scholar] [CrossRef] [PubMed]
- Chakraborty, P.; Selvaraj, S.; Nakamura, M.; Prithiviraj, B.; Cincinelli, A.; Bang, J.J. PCBs and PCDD/Fs in soil from informal e-waste recycling sites and open dumpsites in India: Levels, congener profiles and health risk assessment. Sci. Total Environ. 2018, 621, 930–938. [Google Scholar] [CrossRef]
- Pradhan, J.K.; Kumar, S. Informal e-waste recycling: Environmental risk assessment of heavy metal contamination in Mandoli industrial area, Delhi, India. Environ. Sci. Pollut. Res. 2014, 21, 7913–7928. [Google Scholar] [CrossRef] [PubMed]
- Ha, N.N.; Agusa, T.; Ramu, K.; Tu, N.P.C.; Murata, S.; Bulbule, K.A.; Parthasaraty, P.; Takahashi, S.; Subramanian, A.; Tanabe, S. Contamination by trace elements at e-waste recycling sites in Bangalore, India. Chemosphere 2009, 76, 9–15. [Google Scholar] [CrossRef] [PubMed]
- Uchida, N.; Matsukami, H.; Someya, M.; Tue, N.M.; Tuyen, L.H.; Viet, P.H.; Takahashi, S.; Tanabe, S.; Suzuki, G. Hazardous metals emissions from e-waste-processing sites in a village in northern Vietnam. Emerg. Contam. 2018, 4, 11–21. [Google Scholar] [CrossRef]
- Matsukami, H.; Tue, N.M.; Suzuki, G.; Someya, M.; Tuyen, L.H.; Viet, P.H.; Takahashi, S.; Tanabe, S.; Takigami, H. Flame retardant emission from e-waste recycling operation in northern Vietnam: Environmental occurrence of emerging organophosphorus esters used as alternatives for PBDEs. Sci. Total Environ. 2015, 514, 492–499. [Google Scholar] [CrossRef]
- Itai, T.; Otsuka, M.; Asante, K.A.; Muto, M.; Opoku-Ankomah, Y.; Ansa-Asare, O.D.; Tanabe, S. Variation and distribution of metals and metalloids in soil/ash mixtures from Agbogbloshie e-waste recycling site in Accra, Ghana. Sci. Total Environ. 2014, 470–471, 707–716. [Google Scholar] [CrossRef]
- Hogarh, J.N.; Seike, N.; Kobara, Y.; Carboo, D.; Fobil, J.N.; Masunaga, S. Source characterization and risk of exposure to atmospheric polychlorinated biphenyls (PCBs) in Ghana. Environ. Sci. Pollut. Res. 2018, 25, 16316–16324. [Google Scholar] [CrossRef]
- Isimekhai, K.A.; Garelick, H.; Watt, J.; Purchase, D. Heavy metals distribution and risk assessment in soil from an informal E-waste recycling site in Lagos State, Nigeria. Environ. Sci. Pollut. Res. 2017, 24, 17206–17219. [Google Scholar] [CrossRef] [Green Version]
- Olafisoye, O.B.; Adefioye, T.; Osibote, O.A. Heavy metals contamination of water, soil, and plants around an electronic waste dumpsite. Polish J. Environ. Stud. 2013, 22, 1431–1439. [Google Scholar]
- Fujimori, T.; Takigami, H.; Agusa, T.; Eguchi, A.; Bekki, K.; Yoshida, A.; Terazono, A.; Ballesteros, F.C. Impact of metals in surface matrices from formal and informal electronic-waste recycling around Metro Manila, the Philippines, and intra-Asian comparison. J. Hazard. Mater. 2012, 221–222, 139–146. [Google Scholar] [CrossRef] [PubMed]
- Damrongsiri, S.; Vassanadumrongdee, S.; Tanwattana, P. Heavy metal contamination characteristic of soil in WEEE (waste electrical and electronic equipment) dismantling community: A case study of Bangkok, Thailand. Environ. Sci. Pollut. Res. 2016, 23, 17026–17034. [Google Scholar] [CrossRef] [PubMed]
- Rudnick, R.L.; Gao, S. Composition of the Continental Crust, 2nd ed.; Elsevier Ltd.: Amsterdam, The Netherlands, 2014; ISBN 9780080959757. [Google Scholar]
- Rastogi, N.; Sarin, M.M. Quantitative chemical composition and characteristics of aerosols over western India: One-year record of temporal variability. Atmos. Environ. 2009, 43, 3481–3488. [Google Scholar] [CrossRef]
- Wilkinson, J. Rounding Errors in Algebraic Processes; Dover Publications: New York, NY, USA, 1994; ISBN 0486679993. [Google Scholar]
- Gong, S.L.; Barrie, L.A. Trends of heavy metal components in the Arctic aerosols and their relationship to the emissions in the Northern Hemisphere. Sci. Total Environ. 2005, 342, 175–183. [Google Scholar] [CrossRef]
- Massas, I.; Kalivas, D.; Ehaliotis, C.; Gasparatos, D. Total and available heavy metal concentrations in soils of the Thriassio plain (Greece) and assessment of soil pollution indexes. Environ. Monit. Assess. 2013, 185, 6751–6766. [Google Scholar] [CrossRef] [PubMed]
- Golubeva, N.I.; Burtseva, L.V.; Matishov, G.G.; Il’in, G.V. The results of measurements of heavy metals in atmospheric aerosols in the open areas of the Arctic Seas in 2009–2010. Dokl. Earth Sci. 2013, 453, 1090–1093. [Google Scholar] [CrossRef]
- Bogdal, C.; Scheringer, M.; Abad, E.; Abalos, M.; Van Bavel, B.; Hagberg, J.; Fiedler, H. Worldwide distribution of persistent organic pollutants in air, including results of air monitoring by passive air sampling in five continents. TrAC Trends Anal. Chem. 2013, 46, 150–161. [Google Scholar] [CrossRef]
- Wuana, R.A.; Okieimen, F.E. Heavy Metals in Contaminated Soils: A Review of Sources, Chemistry, Risks and Best Available Strategies for Remediation. ISRN Ecol. 2011, 2011, 20. [Google Scholar] [CrossRef]
- Khan, S.; Cao, Q.; Zheng, Y.M.; Huang, Y.Z.; Zhu, Y.G. Health risks of heavy metals in contaminated soils and food crops irrigated with wastewater in Beijing, China. Environ. Pollut. 2008, 152, 686–692. [Google Scholar] [CrossRef] [Green Version]
- Liu, W.; Zhao, J.; Ouyang, Z.; So, L. Impacts of sewage irrigation on heavy metal distribution and contamination in Beijing, China. Environ. Int. 2005, 31, 805–812. [Google Scholar] [CrossRef] [PubMed]
- Muchuweti, M.; Birkett, J.W.; Chinyanga, E.; Zvauya, R. Heavy metal content of vegetables irrigated with mixtures of wastewater and sewage sludge in Zimbabwe: Implications for human health. Agric. Ecosyst. Environ. 2006, 112, 41–48. [Google Scholar] [CrossRef] [Green Version]
- Sharma, R.K.; Agrawal, M.; Marshall, F. Heavy metal contamination of soil and vegetables in suburban areas of Varanasi, India. Ecotoxicol. Environ. Saf. 2007, 66, 258–266. [Google Scholar] [CrossRef]
- Tran, C.D.; Salhofer, S.P. Processes in informal end-processing of e-waste generated from personal computers in Vietnam. J. Mater. Cycles Waste Manag. 2018, 20, 1154–1178. [Google Scholar] [CrossRef]
- Wang, F.; Kuehr, R.; Ahlquist, D.; Li, J. E-waste in China: A country report; United Nations University. 2013. Available online: https://collections.unu.edu/eserv/UNU:1624/ewaste-in-china.pdf (accessed on 10 February 2019).
- Behnamfard, A.; Mehdi, M.; Veglio, F. Process development for recovery of copper and precious metals from waste printed circuit boards with emphasize on palladium and gold leaching and precipitation. Waste Manag. 2013, 33, 2354–2363. [Google Scholar] [CrossRef] [PubMed]
- Evangelopoulos, P.; Kantarelis, E.; Yang, W. Journal of Analytical and Applied Pyrolysis Investigation of the thermal decomposition of printed circuit boards ( PCBs ) via thermogravimetric analysis ( TGA ) and analytical pyrolysis (Py-GC/MS). J. Anal. Appl. Pyrolysis 2015, 115, 337–343. [Google Scholar] [CrossRef]
- Keller, M. Assessment of Gold Recovery Processes in Bangalore, India and Evaluation of an Alternative Recycling Path for Printed Wiring Boards. Master’s Thesis, Swiss Federal Institute of Technology (ETH), Zurich, Switzerland, 2006. [Google Scholar]
- Barbieri, M. The Importance of Enrichment Factor (EF) and Geoaccumulation Index (Igeo) to Evaluate the Soil Contamination. J. Geol. Geophys. 2016, 5, 237. [Google Scholar] [CrossRef]
- OSPAR Commission. Co-Ordinated Environmental Monitoring Programme—Assessment Manual for Contaminants in Sediment and Biota; OSPAR Commission: London, UK, 2008; pp. 1–39. ISBN 978-1-906840-20-4. Publication Number No. 379/2008. [Google Scholar]
- Wolrd Health Organization (WHO). Air Quality Guidelines for Europe, 2nd ed.; WHO Regional Office for Europe: Copenhagen, Denmark, 2000; Available online: http://www.euro.who.int/document/e71922.pdf (accessed on 10 February 2019).
- Hosford, M. Human Health Toxicological Assessment of Contaminants in Soil. Environment Agency, UK. 2009. Available online: https://assets.publishing.service.gov.uk/government/uploads/system/uploads/attachment_data/file/291011/scho0508bnqy-e-e.pdf (accessed on 10 February 2019).
- Jeffries, J.; Martin, I. Updated technical background to the CLEA model. Environment Agency, UK. 2009. Available online: https://assets.publishing.service.gov.uk/government/uploads/system/uploads/attachment_data/file/291014/scho0508bnqw-e-e.pdf (accessed on 10 February 2019).
- World Health Organization (WHO). Health Risks of Heavy Metals from Long-Range Transboundary Air Pollution; WHO Regional Office for Europe (WHO Regional publications): Copenhagen, Denmark, 2007; Available online: http://www.euro.who.int/__data/assets/pdf_file/0007/78649/E91044.pdf (accessed on 10 February 2019).
- Alloway, B.J. Heavy Metals in Soils, 2nd ed.; Springer Netherlands: Dordrecht, The Netherlands, 1995; ISBN 978-94-010-4586-5. [Google Scholar]
- Fjeld, R.A.; Eisenberg, N.A.; Compton, K.L. Quantitative Environmental Risk Analysis for Human Health; John Wiley & Sons: Hoboken, NJ, USA, 2007; ISBN 9780471722434. [Google Scholar]
- Zahra, N.; Kalim, I.; Mahmood, M.; Naeem, N. Perilous Effects of Heavy Metals Contamination on Human Health. J. Anal. Environ. Chem 2017, 18, 1–17. [Google Scholar] [CrossRef]
- Song, Q.; Li, J. A review on human health consequences of metals exposure to e-waste in China. Environ. Pollut. 2015, 196, 450–461. [Google Scholar] [CrossRef] [PubMed]
- Quinete, N.; Schettgen, T.; Bertram, J.; Kraus, T. Occurrence and distribution of PCB metabolites in blood and their potential health effects in humans: A review. Environ. Sci. Pollut. Res. 2014, 21, 11951–11972. [Google Scholar] [CrossRef] [PubMed]
- Cogliano, V.J.; Baan, R.; Straif, K.; Grosse, Y.; Lauby-Secretan, B.; Ghissassi, F.E.; Bouvard, V.; Benbrahim-Tallaa, L.; Guha, N.; Freeman, C.; et al. Preventable exposures associated with human cancers. J. Natl. Cancer Inst. 2011, 103, 1827–1839. [Google Scholar] [CrossRef] [PubMed]
- Asante, K.A.; Agusa, T.; Biney, C.A.; Agyekum, W.A.; Bello, M.; Otsuka, M.; Itai, T.; Takahashi, S.; Tanabe, S. Multi-trace element levels and arsenic speciation in urine of e-waste recycling workers from Agbogbloshie, Accra in Ghana. Sci. Total Environ. 2012, 424, 63–73. [Google Scholar] [CrossRef] [PubMed]
- Wittsiepe, J.; Fobil, J.N.; Till, H.; Burchard, G.D.; Wilhelm, M.; Feldt, T. Levels of polychlorinated dibenzo-p-dioxins, dibenzofurans (PCDD/Fs) and biphenyls (PCBs) in blood of informal e-waste recycling workers from Agbogbloshie, Ghana, and controls. Environ. Int. 2015, 79, 65–73. [Google Scholar] [CrossRef]
- Yuan, J.; Chen, L.; Chen, D.; Guo, H.; Bi, X.; Ju, Y.; Jiang, P.; Shi, J.; Yu, Z.; Yang, J.; et al. Elevated Serum Polybrominated Diphenyl Ethers and Thyroid-Stimulating Hormone Associated with Lymphocytic Micronuclei in Chinese Workers from an E-Waste Dismantling Site. Environ. Sci. Technol. 2008, 42, 2195–2200. [Google Scholar] [CrossRef] [PubMed]
- Dai, Y.; Huo, X.; Zhang, Y.; Yang, T.; Li, M.; Xu, X. Elevated lead levels and changes in blood morphology and erythrocyte CR1 in preschool children from an e-waste area. Sci. Total Environ. 2017, 592, 51–59. [Google Scholar] [CrossRef]
- Zhang, Y.; Huo, X.; Cao, J.; Yang, T.; Xu, L.; Xu, X. Elevated lead levels and adverse effects on natural killer cells in children from an electronic waste recycling area. Environ. Pollut. 2016, 213, 143–150. [Google Scholar] [CrossRef]
- Zhang, T.; Ruan, J.; Zhang, B.; Lu, S.; Gao, C.; Huang, L.; Bai, X.; Xie, L.; Gui, M.; Qiu, R. liang Heavy metals in human urine, foods and drinking water from an e-waste dismantling area: Identification of exposure sources and metal-induced health risk. Ecotoxicol. Environ. Saf. 2019, 169, 707–713. [Google Scholar] [CrossRef]
- Eguchi, A.; Nomiyama, K.; Devanathan, G.; Subramanian, A.; Bulbule, K.A.; Parthasarathy, P.; Takahashi, S.; Tanabe, S. Different profiles of anthropogenic and naturally produced organohalogen compounds in serum from residents living near a coastal area and e-waste recycling workers in India. Environ. Int. 2012, 47, 8–16. [Google Scholar] [CrossRef]
- Domenico, P.A. An analytical model for multidimensional transport of a decaying contaminant species. J. Hydrol. 1987, 91, 49–58. [Google Scholar] [CrossRef]
- Vaccari, M.; Vinti, G.; Tudor, T. An Analysis of the Risk Posed by Leachate from Dumpsites in Developing Countries. Environments 2018, 5, 99. [Google Scholar] [CrossRef]


| Location | Site Description | Treatment Process | Reference | Code |
|---|---|---|---|---|
| Guiyu (China) | Printed circuit board recycling workshop | Mechanical treatment | [31,32] | AA |
| Guiyu (China) | Family-run e-waste recycling workshops | Mechanical treatment | [31,33] | AB |
| Guiyu (China) | Family-run workshops in e-waste-recycling impacted area | Mechanical treatment | [31,34] | AC |
| Guiyu (China) | E-waste recycling sites (from Lianjiang River-1) | Mechanical treatment | [31,35] | AD |
| Wenling in Taizhou (China) | Paddy soil in an e-waste recycling area | Mechanical treatment | [31] | AE |
| Longtang (China) | E-waste disassembling workshops | Mechanical treatment | [31] | AF |
| Shijiao (China) | E-waste disassembling workshops | Mechanical treatment | [31] | AG |
| Qingyuan (China) | E-waste recycling area | Mechanical treatment | [28,36] | AH |
| Guiyu (China) | Street characterized by residential and commercial buildings involved in e-waste recycling | Open burning | [37,38] | AI |
| Guiyu (China) | Street characterized by residential and commercial buildings involved in e-waste recycling | Open burning | [39,40] | AJ |
| Guiyu (China) | E-waste recycling areas influenced by dumping–burning | Open burning | [39] | AK |
| Longtang (China) | E-waste open burning sites | Open burning | [31] | AL |
| Longtang (China) | E-waste incineration site | Open burning | [31] | AM |
| Taizhou (China) | E-waste recycling area | Open burning | [19,41] | AN |
| Qingyuan (China) | E-waste open incineration site | Open burning | [42] | AO |
| Guiyu (China) | Acid leaching of printed circuit boards site | Leaching processes | [37] | AP |
| Guiyu (China) | E-waste acid leaching treatment area | Leaching processes | [28,43] | AQ |
| Guiyu (China) | E-waste acid leaching treatment area | Leaching processes | [43,44] | AR |
| Guiyu (China) | Abandoned e-waste workshop | Leaching processes | [45] | AS |
| Guiyu (China) | E-waste recycling sites (from Lianjiang River-3) | Mixed | [31,35] | AT |
| Guiyu (China) | Lianjiang River, area related with circuit board, acid and burning processing of E-waste | Mixed | [39] | AU |
| Guiyu (China) | E-waste dumpsite soil | NA | [46] | AV |
| Guiyu (China) | Roadside soil | NA | [31,46] | AW |
| Guiyu (China) | E-waste recycling sites (from duck pond-A) | NA | [31,35] | AX |
| Guiyu (China) | E-waste recycling sites (from duck pond-B) | NA | [31,35] | AY |
| Guiyu (China) | E-waste recycling sites (from Lianjiang River-2) | NA | [31,35] | AZ |
| Guiyu (China) | E-waste recycling sites (from Lianjiang River) | NA | [31] | BA |
| Guiyu (China) | E-waste recycling sites (from Nanyang River) | NA | [31] | BB |
| Guiyu (China) | E-waste recycling area | NA | [28,47] | BC |
| Guiyu (China) | E-waste recycling area | NA | [28,48] | BD |
| Guiyu (China) | Circuit board recycling workshops | NA | [39,49] | BE |
| Guiyu (China) | Roads adjacent to E-waste workshops | NA | [39,49] | BF |
| Guiyu (China) | Lianjiang River, near e-waste recycling area | NA | [39,50] | BG |
| Guiyu (China) | Nanyang River, near E-waste recycling area | NA | [39,50] | BH |
| Guiyu (China) | Rivers near E-waste recycling area | NA | [39,51] | BI |
| Guiyu (China) | E-waste recycling site | NA | [19,52] | BJ |
| Guiyu (China) | Area near e-waste recycling workshop | NA | [45] | BK |
| Guiyu (China) | E-waste recycling area | NA | [53] | BL |
| Guiyu (China) | Area near informal E-waste workshops | NA | [54] | BM |
| Guiyu area (China) | Workshops and houses involved in E-waste recycling activities | NA | [55] | BN |
| Qingyuan (China) | Former e-waste recycling area | NA | [12] | BO |
| Qingyuan (China) | Area near informal E-waste workshops | NA | [54] | BP |
| Taizhou (China) | E-waste recycling area | NA | [31,56] | BQ |
| Taizhou (China) | E-waste recycling area | NA | [31,57] | BR |
| Taizhou (China) | Agricultural soils near e-waste recycling workshops | NA | [31,58] | BS |
| Taizhou (China) | E-waste recycling site (from Nanguan River) | NA | [31] | BT |
| Taizhou (China) | E-waste recycling site | NA | [39,59] | BU |
| Taizhou (China) | E-waste treatment indoor environment | NA | [19,60] | BV |
| Longtang area (China) | Workshops and houses involved in E-waste recycling activities | NA | [55] | BW |
| Longtang area (China) | Workshops and houses involved in E-waste recycling activities | NA | [55] | BX |
| Longtang area (China) | Workshops and houses involved in E-waste recycling activities | NA | [55] | BY |
| Wenling (China) | Simple household E-waste recycling workshops | NA | [11,44] | BZ |
| Dali area (China) | Workshops and houses involved in E-waste recycling activities | NA | [55] | CA |
| Chennai (India) | E-waste sites involved in dismantling and shredding of E-wastes | Mechanical treatment | [61] | CB |
| Zarfarabad in New Delhi (India) | E-waste recycling workshops with solder activities | Mechanical treatment | [26] | CC |
| Shashtri Park in New Delhi (India) | E-waste recycling workshops with solder activities | Mechanical treatment | [26] | CD |
| Brijgang in New Delhi (India) | Cathode-ray tube storage shed | Mechanical treatment | [26] | CE |
| Brijgang in New Delhi (India) | Open-air cathode-ray tube storage area | Mechanical treatment | [26] | CF |
| New Delhi, Mumbai and Chennai (India) | E-waste recycling sites characterized by dismantling activities | Mechanical treatment | [62] | CG |
| New Delhi, Mumbai and Chennai (India) | E-waste recycling sites characterized by shredding and grinding activities | Mechanical treatment | [62] | CH |
| Mandoli (India) | E-waste recycling site | Mixed | [63] | CI |
| Mandoli (India) | E-waste dumping site | Mixed | [63] | CJ |
| Mandoli (India) | An area 50 m away from e-waste recycling site | Mixed | [63] | CK |
| Mandoli (India) | An area 100 m away from e-waste recycling site | Mixed | [63] | CL |
| Mandoli (India) | An area 500 m away from e-waste recycling site | Mixed | [63] | CM |
| Chandigarh and Ludhiana (India) | E-waste dismantling workshop and general scrap dealer dismantling areas | Mixed | [27] | CN |
| Bangalore (India) | E-waste site in slum | NA | [64] | CO |
| Bangalore (India) | E-waste site | NA | [64] | CP |
| Bangalore (India) | E-waste site | NA | [64] | CQ |
| New Delhi (India) | E-waste battery recycling workshop | NA | [26] | CR |
| Shashtri Park in New Delhi (India) | Street near E-waste recycling workshop | NA | [26] | CS |
| Zarfarabad in New Delhi (India) | E-waste separation workshop | NA | [26] | CT |
| Shashtri Park in New Delhi (India) | E-waste recycling activities | NA | [26] | CU |
| Shashtri Park in New Delhi (India) | E-waste separation workshop | NA | [26] | CV |
| Kailash Nagar in New Delhi (India) | Street in an area without workshops | NA | [26] | CW |
| Safourjung in New Delhi (India) | Street in residential area | NA | [26] | CX |
| Buradi in New Delhi (India) | E-waste battery recycling workshop | NA | [26] | CY |
| Chennai (India) | E-waste sites with workshops engaged in metal recovery operations | NA | [61] | CZ |
| New Delhi, Mumbai and Chennai (India) | E-waste recycling sites for metal recovery | NA | [62] | DA |
| New Delhi, Mumbai and Chennai (India) | E-waste recycling sites | NA | [62] | DB |
| Gaziabad (India) | E-waste recycling areas with workshop | NA | [26] | DC |
| Bui Dau village (Vietnam) | E-waste processing area | Mechanical treatment | [44] | DD |
| Bui Dau village (Vietnam) | Open burning sites in an E-waste-processing area | Open burning | [65] | DE |
| Bui Dau village (Vietnam) | Open burning site in an E-waste recycling area | Open burning | [66] | DF |
| Bui Dau village (Vietnam) | Wires and cables open-burning area | Open burning | [29] | DG |
| Bui Dau village (Vietnam) | E-waste-processing workshop sites | NA | [65] | DH |
| Bui Dau village (Vietnam) | E-waste-processing area | NA | [65] | DI |
| Bui Dau village (Vietnam) | A river near an e-waste recycling workshop | NA | [65] | DJ |
| Bui Dau village (Vietnam) | E-waste recycling area | NA | [66] | DK |
| Bui Dau village (Vietnam) | E-waste recycling workshop | NA | [66] | DL |
| Bui Dau village (Vietnam) | A river near an e-waste recycling area | NA | [66] | DM |
| Bui Dau village (Vietnam) | E-waste processing site | NA | [29] | DN |
| Bui Dau village (Vietnam) | Areas adjacent to E-waste-processing workshops | NA | [29] | DO |
| Agbogbloshie, Accra (Ghana) | E-waste open burning area | Open burning | [8] | DP |
| Agbogbloshie, Accra (Ghana) | E-waste open burning area | Open burning | [67] | DQ |
| Agbogbloshie, Accra (Ghana) | E-waste recycling area, in correspondence of plumes emanating from the burning of e-wastes | Open burning | [68] | DR |
| Agbogbloshie, Accra (Ghana) | E-waste recycling area | NA | [68] | DS |
| Agbogbloshie, Accra (Ghana) | E-waste recycling area without burning activities | NA | [8] | DT |
| Agbogbloshie, Accra (Ghana) | E-waste recycling area without burning activities | NA | [67] | DU |
| Ojo (Nigeria) | E-waste dismantling area (during dry season) | Mechanical treatment | [69] | DV |
| Ojo (Nigeria) | E-waste dismantling area (during wet season) | Mechanical treatment | [69] | DW |
| Ojo (Nigeria) | E-waste recycling area (during dry season) | Open burning | [69] | DX |
| Ojo (Nigeria) | E-waste recycling area (during wet season) | Open burning | [69] | DY |
| Ojo (Nigeria) | E-waste dumpsite | NA | [26,70] | DZ |
| Manila (Philippines) | E-waste treatment area | NA | [44,71] | EA |
| Manila (Philippines) | E-waste recycling sites | NA | [71] | EB |
| Bangkok (Thailand) | Household workshops in which are dismantled E-waste | Mechanical treatment | [72] | EC |
| Code | Al | As | Ba | Cd | Co | Cr | Cu | Hg | Li | Mn | Ni | Pb | Sb | Zn |
|---|---|---|---|---|---|---|---|---|---|---|---|---|---|---|
| AE | 0.3 | 41.1 | 39.9 | 48.3 | 137.0 | |||||||||
| AF | 39.3 | 6371.5 | 1635.4 | 3039.6 | ||||||||||
| AG | 21.3 | 4000 | 943.7 | 2044.8 | ||||||||||
| AH | 80.2 | 6.3 | 2159.3 | 1.4 | 78.1 | 576.3 | 1366.0 | |||||||
| AL | 10.3 | 63.3 | 4850.6 | 100.3 | 1714.5 | 1016.7 | ||||||||
| AM | 17.1 | 11,140 | 4500 | 3690 | ||||||||||
| AO | 17.1 | 68.9 | 11,140 | 60.1 | 4500 | 3690 | ||||||||
| AQ | 1.4 | 11.9 | 7.4 | 684 | 22.4 | 278 | 223 | 1706 | 573 | |||||
| AR | 1.4 | 684 | 222.8 | 1706 | 572.8 | |||||||||
| AS | 26.0 | 1.2 | 2600 | 4800 | 0.2 | 300 | 480 | 150 | 1100 | 330 | ||||
| AV | 32.0 | 153.6 | 787.7 | 374.1 | 114.2 | 1431 | ||||||||
| AW | 5.8 | 12.2 | 683.8 | 461 | 26.8 | 540.9 | ||||||||
| BC | 4.7 | 0.1 | 10.8 | 58.1 | 50.0 | 1.2 | 45.3 | 57.0 | 77.5 | 1.4 | 102 | |||
| BD | 1.3 | 25.8 | 71.6 | 99.3 | ||||||||||
| BK | 6.1 | 0.4 | 51 | 48 | 0.05 | 180 | 22 | 93 | 9.9 | 90 | ||||
| BO | 2.4 | 97.0 | 8.1 | 53 | 104 | |||||||||
| BQ | 4.1 | 1.2 | 6.1 | 98.8 | 0.3 | 34.6 | 55.8 | |||||||
| BR | 6.4 | 26.8 | 256.4 | 366.56 | 46.8 | 209.8 | ||||||||
| BS | 1.8 | 61.4 | 98.7 | 40.7 | 115.1 | 163.4 | ||||||||
| BZ | 4.4 | 327 | 313 | 299 | ||||||||||
| CI | 8822.1 | 12.8 | 1.1 | 13.2 | 83.6 | 6734.9 | 0.1 | 1465 | 2134.0 | 416.3 | ||||
| CJ | 14,142.6 | 17.1 | 1.3 | 12.4 | 115.5 | 4291.6 | 0.1 | 126.5 | 2645.3 | 776.8 | ||||
| CK | 6476.4 | 3.8 | 0.7 | 4.9 | 34.8 | 77.0 | nd | 44.7 | 40.3 | 90.3 | ||||
| CL | 6538.8 | nd | 0.1 | 2.3 | 22.0 | 65.3 | nd | 35.1 | 29.6 | 68.4 | ||||
| CM | 6432.0 | nd | 0.04 | 2.6 | 16.4 | 63.4 | nd | 35.7 | 27.9 | 62.5 | ||||
| CN | 40.0 | 976.4 | 8.3 | 19.4 | 287.2 | 145,434 | 130.2 | 1615.8 | 4737.7 | |||||
| CO | 11 | 73 | 592 | 449 | 326 | |||||||||
| CP | 14 | 54 | 429 | 619 | 192 | |||||||||
| DD | 1 | 1520 | 509 | 759 | 46 | 761 | ||||||||
| DE | 10 a | 0.3 a | 7.6 a | 340 a | 25 a | 530 a | 23 a | 90 a | 120 a | |||||
| DH | 7.4 a | 0.4 a | 6.7 a | 130 a | 13 a | 300 a | 23 a | 89 a | 200 a | |||||
| DI | 8.2 a | <0.25 a | 6.4 a | 31 a | 18 a | 130 a | 17 a | 35 a | 66 a | |||||
| DQ | 177.2 b | 218.2 b | 11.5 b | 26 b | 9.1 b | 12,450 b | 115 b | 102.5 b | 9475 b | 279.2 b | 14,025 b | |||
| DU | 43.8 b | 48.2 b | 2 b | 80.15 b | 3.1 b | 766.3 b | 81.7 b | 533.3 b | 8 b | 3205 b | ||||
| DV | 10.3 | 36.8 | 3165 | 254.9 | 77.4 | 911 | 22.5 | 862.6 | ||||||
| DW | 8.7 | 49.6 | 5880 | 120.8 | 23.91 | 1823 | 58.4 | 1921 | ||||||
| DX | 26.4 | 35.4 | 3277 | 115.4 | 40.8 | 2418 | 38.5 | 2195 | ||||||
| DY | 12.7 | 23.0 | 4858 | 92 | 23.3 | 1969 | 35.4 | 915 | ||||||
| DZ | 7.8 | 32.6 | 84.2 | 502 | 66.9 | |||||||||
| EA | 2.9 | 810 | 900 | 650 | 1000 | |||||||||
| EB | 3.7 | 2.5 | 30 | 680 | 950 | 47 | 800 | 900 | ||||||
| EC | 4827.7 b | 561.3 b | 74.4 b | 1058.6 b | 1847.3 b |
| Code | As | Cd | Co | Cr | Cu | Hg | Mn | Mo | Ni | Pb | Sb | Zn |
|---|---|---|---|---|---|---|---|---|---|---|---|---|
| AB | 5.4–17.7 | 6.1–232 | ||||||||||
| AC | 1.9 | 61 | 2740 | 69 | 892 | 1120 | ||||||
| BE | 110,000 | |||||||||||
| BF | 22,600 | |||||||||||
| BO | 8.2 | 1475 | 130 | 416 | 1199 | |||||||
| CC | <5 | <20 | 2070 | <10 | <20 | 362,000 | <10 | |||||
| CD | 15.5 | 64 | 2140 | 0.5 | 4 | 10,900 | ||||||
| CE | 310 | 86 | 439 | 0.5 | <2 | 4600 | 21100 | |||||
| CF | 16.4 | 21 | 82 | <0.2 | <2 | 1370 | 506 | |||||
| CN | 19.4 | 4.4 | 8.87 | 131.0 | 1564.1 | 819.1 | 89.0 | 2044.8 | ||||
| CR | 42.6 | 103 | 1730 | 3.5 | 7 | 88,100 | 4920 | |||||
| CS | 1.4 | 30 | 230 | <0.2 | <2 | 48 | 710 | |||||
| CT | 97 | 158 | 6850 | 460 | 12 | 8615 | 4440 | |||||
| CU | <5 | <20 | 2670 | <10 | <20 | 375,000 | 21 | |||||
| CV | 14.1 | 78 | 2800 | 2.1 | 7 | 2360 | 2200 | |||||
| CW | <0.5 | 25 | 414 | 0.6 | <2 | 100 | 414 | |||||
| CX | <0.5 | 25 | 21 | 0.5 | <2 | 20 | 83 | |||||
| CY | 200,000 | 61 | 1610 | 48.2 | 91 | 13,300 | 1240 | |||||
| DC | 11.4 | 20 | 149 | <0.2 | <2 | 100 | 549 | |||||
| DD | 2.4 | 881 | 509 | 549 | 38 | 1000 | ||||||
| EA | 3.0 | 6600 | 1400 | 2800 | ||||||||
| EB | 7.4 | 3.9 | 33 | 6300 | 1800 | 380 | 1100 | 2900 |
| Code | As | Cd | Co | Cr | Cu | Ni | Pb | Zn |
|---|---|---|---|---|---|---|---|---|
| AD | 0.1 | 17.6 | 113 | 10.1 | 316 | 86.8 | ||
| AP | 4.7 | 14.8 | 22.1 | 601 | 54.5 | 217 | 356 | |
| AT | 0.5 | 27.3 | 20.1 | 12.6 | 118 | 175 | ||
| AX | 0 | 21.2 | 32.2 | 20.6 | 57.7 | 79.6 | ||
| AY | 0.3 | 43.5 | 30.9 | 20.8 | 53.1 | 84.5 | ||
| AZ | 0.9 | 29.2 | 528 | 120 | 94.3 | 249 | ||
| BA | 0.2 | 35.3 | 66.7 | 51.5 | 55.0 | 133.7 | ||
| BB | 6.3 | 65.4 | 2153.9 | 294.0 | 394.5 | 482.8 | ||
| BG | 230 | |||||||
| BH | 47.3 | |||||||
| BT | 11.9 | 6.3 | 316.5 | 4787.5 | 153.4 | 377.3 | ||
| DJ | 11 a | 0.6 a | 11 a | 400 a | 32 a | 130 a | 200 a |
| Code | Al | As | Cd | Cr | Cu | Mn | Ni | Pb | Sb | Zn |
|---|---|---|---|---|---|---|---|---|---|---|
| AA | 5240 | 80 | 570 | 80 | 4400 | 150 | 3320 | |||
| AI | 10.2 a | 7.3 a | 1161 a | 483 a | 60.6 a | 10.0 a | 444 a | 1038 a | ||
| AI | 6.0 b | 7.3 b | 1152 b | 126 b | 25.4 b | 7.2 b | 392 b | 924 b | ||
| BL | 5.6b | 6.5 b | 22.1 b | 153.0 b | ||||||
| BO | 1.1 | 32.1 | 4.3 | 32.9 | 79.5 | |||||
| CQ | 1.5 | 18 | 111 | 59.6 | 88.9 | 13 | 191 |
| Code | Al | As | Cd | Co | Cr | Cu | Ni | Pb | Zn |
|---|---|---|---|---|---|---|---|---|---|
| AU | 1.9–24 | ||||||||
| BI | 0.001–0.002 | ||||||||
| CI | 3.67 | 0.04 | 0.05 | 0.001 | 0.60 | 0.70 | 0.05 | 0.04 | 1.89 |
| CM | 61 | 0.007 | 0.002 | 0.001 | 0.02 | 0.05 | 0.03 | 0.002 | 1.46 |
| Code | PBDEs | PCDD/Fs | PCBs | Dioxin-Like PCBs |
|---|---|---|---|---|
| AK | 1140 a | |||
| BD | 433.8 | |||
| BJ | 46.1 b | |||
| BU | 940 a | |||
| CG | 6.5 a | |||
| CH | 8.2 a | |||
| DA | 148 a | |||
| DB | 5 (3.1 × 10⁻²) b | 46.1 (3.9 × 10⁻²) b | ||
| DF | 24 | |||
| DG | 13 b,c (PCDDs) 64 b,c (PCDFs) | |||
| DK | 2.2 | |||
| DL | 1900 | |||
| DN | 0.7 b,c (PCDDs) 0.5 b,c (PCDFs) | |||
| DO | 0.8 b,c (PCDDs) 3.7 b,c (PCDFs) | |||
| DP | 62,000 c (Total PCDDs) 230,000 c (Total PCDFs) | 42 c | ||
| DT | 990 c (Total PCDDs) 2100 c (Total PCDFs) | 1.9 c |
| Code | PBDEs | PCDD/Fs | PCB | Dioxin-Like PCBs | PFRs |
|---|---|---|---|---|---|
| BN | 52 a | 33,100 a | |||
| BV | 0.7 b | ||||
| BW | 74 a | 2180 a | |||
| BX | 750 a | 5560 a | |||
| BY | 2900 a | 6750 a | |||
| CA | 544 a | 7600 a | |||
| CB | 4.5 | 1.3 | |||
| CD | 3000 | 34,000 | |||
| CR | 16,000 | ||||
| CS | 25,000 | ||||
| CT | 23,000 | ||||
| CV | 2000 | 25,000 | |||
| CZ | 112 | 58 |
| Code | PBDEs | PCDD/Fs |
|---|---|---|
| DG | 1 b,c (PCDDs) 6.3 b,c (PCDFs) | |
| DM | 243330 a | |
| DO | 1.2 b,c (PCDDs) 0.04 b,c (PCDFs) |
| Code | PBDEs (in PM 2.5) | PBDEs (in TSP) | PCDD/Fs (in PM 2.5) | PCDD/Fs (in Particulate and Gas Phase) | PCB |
|---|---|---|---|---|---|
| AI | 16,822 a | 6.5 | |||
| AJ | 16,600 a | 21,500 a | |||
| AN | 3.2 b | 3.4 b | |||
| BM | 24.3 (1.24 b) | ||||
| BP | 50.2 (0.644 b) | ||||
| DR | 11,100 | ||||
| DS | 4640 |
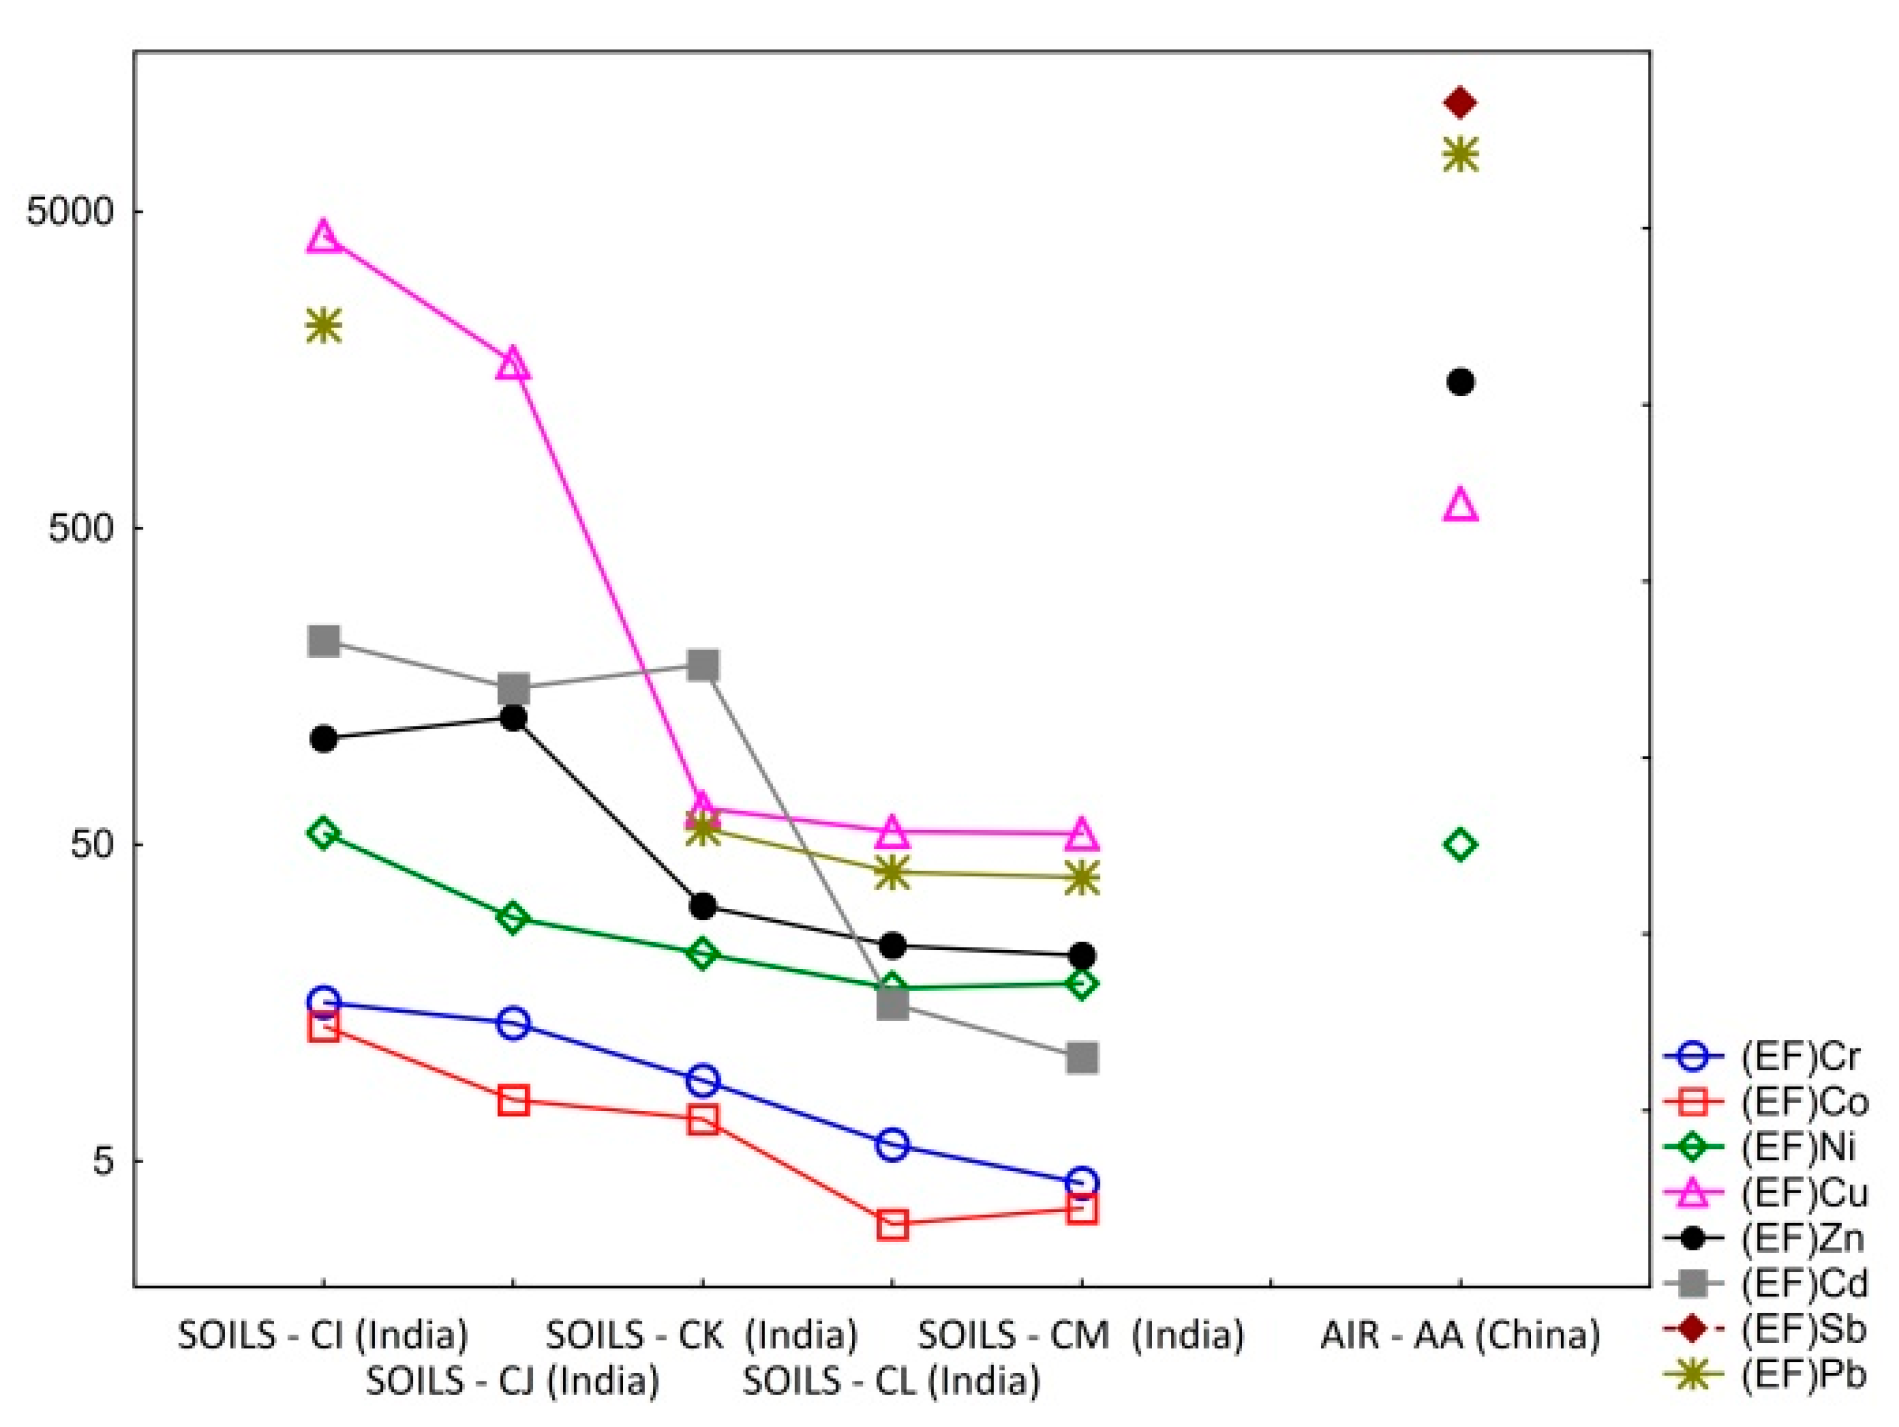
| Site | (EF) Cr | (EF) Co | (EF) Ni | (EF) Cu | (EF) Zn | (EF) As | (EF) Cd | (EF) Sb | (EF) Hg | (EF) Pb |
|---|---|---|---|---|---|---|---|---|---|---|
| SOILS—CI (India) | 15.9 | 13.4 | 54.4 | 4198.7 | 108.5 | 46.7 | 221.1 | na | 24.4 | 2191 |
| SOILS—CJ(India) | 13.7 | 7.8 | 29.3 | 1669.0 | 126.3 | 38.7 | 156.1 | na | 17.4 | nd |
| SOILS—CK (India) | 9.0 | 6.8 | 22.6 | 65.4 | 32.0 | 18.6 | 184.9 | na | nd | 56.3 |
| SOILS—CL (India) | 5.6 | 3.2 | 17.6 | 54.9 | 24.0 | nd | 15.7 | na | nd | 41.0 |
| SOILS—CM (India) | 4.3 | 3.5 | 18.2 | 54.3 | 22.3 | nd | 10.6 | na | nd | 39.4 |
| AIR—AA(China) | na | na | 50 | 598.3 | 1456 | 489.8 | na | 11,021 | na | 7607 |
© 2019 by the authors. Licensee MDPI, Basel, Switzerland. This article is an open access article distributed under the terms and conditions of the Creative Commons Attribution (CC BY) license (http://creativecommons.org/licenses/by/4.0/).
Share and Cite
Vaccari, M.; Vinti, G.; Cesaro, A.; Belgiorno, V.; Salhofer, S.; Dias, M.I.; Jandric, A. WEEE Treatment in Developing Countries: Environmental Pollution and Health Consequences—An Overview. Int. J. Environ. Res. Public Health 2019, 16, 1595. https://doi.org/10.3390/ijerph16091595
Vaccari M, Vinti G, Cesaro A, Belgiorno V, Salhofer S, Dias MI, Jandric A. WEEE Treatment in Developing Countries: Environmental Pollution and Health Consequences—An Overview. International Journal of Environmental Research and Public Health. 2019; 16(9):1595. https://doi.org/10.3390/ijerph16091595
Chicago/Turabian StyleVaccari, Mentore, Giovanni Vinti, Alessandra Cesaro, Vincenzo Belgiorno, Stefan Salhofer, Maria Isabel Dias, and Aleksander Jandric. 2019. "WEEE Treatment in Developing Countries: Environmental Pollution and Health Consequences—An Overview" International Journal of Environmental Research and Public Health 16, no. 9: 1595. https://doi.org/10.3390/ijerph16091595