Changes in the Selected Antioxidant Defense Parameters in the Blood of Patients after High Resolution Computed Tomography

 , , and
Abstract
:1. Introduction
2. Materials and Methods
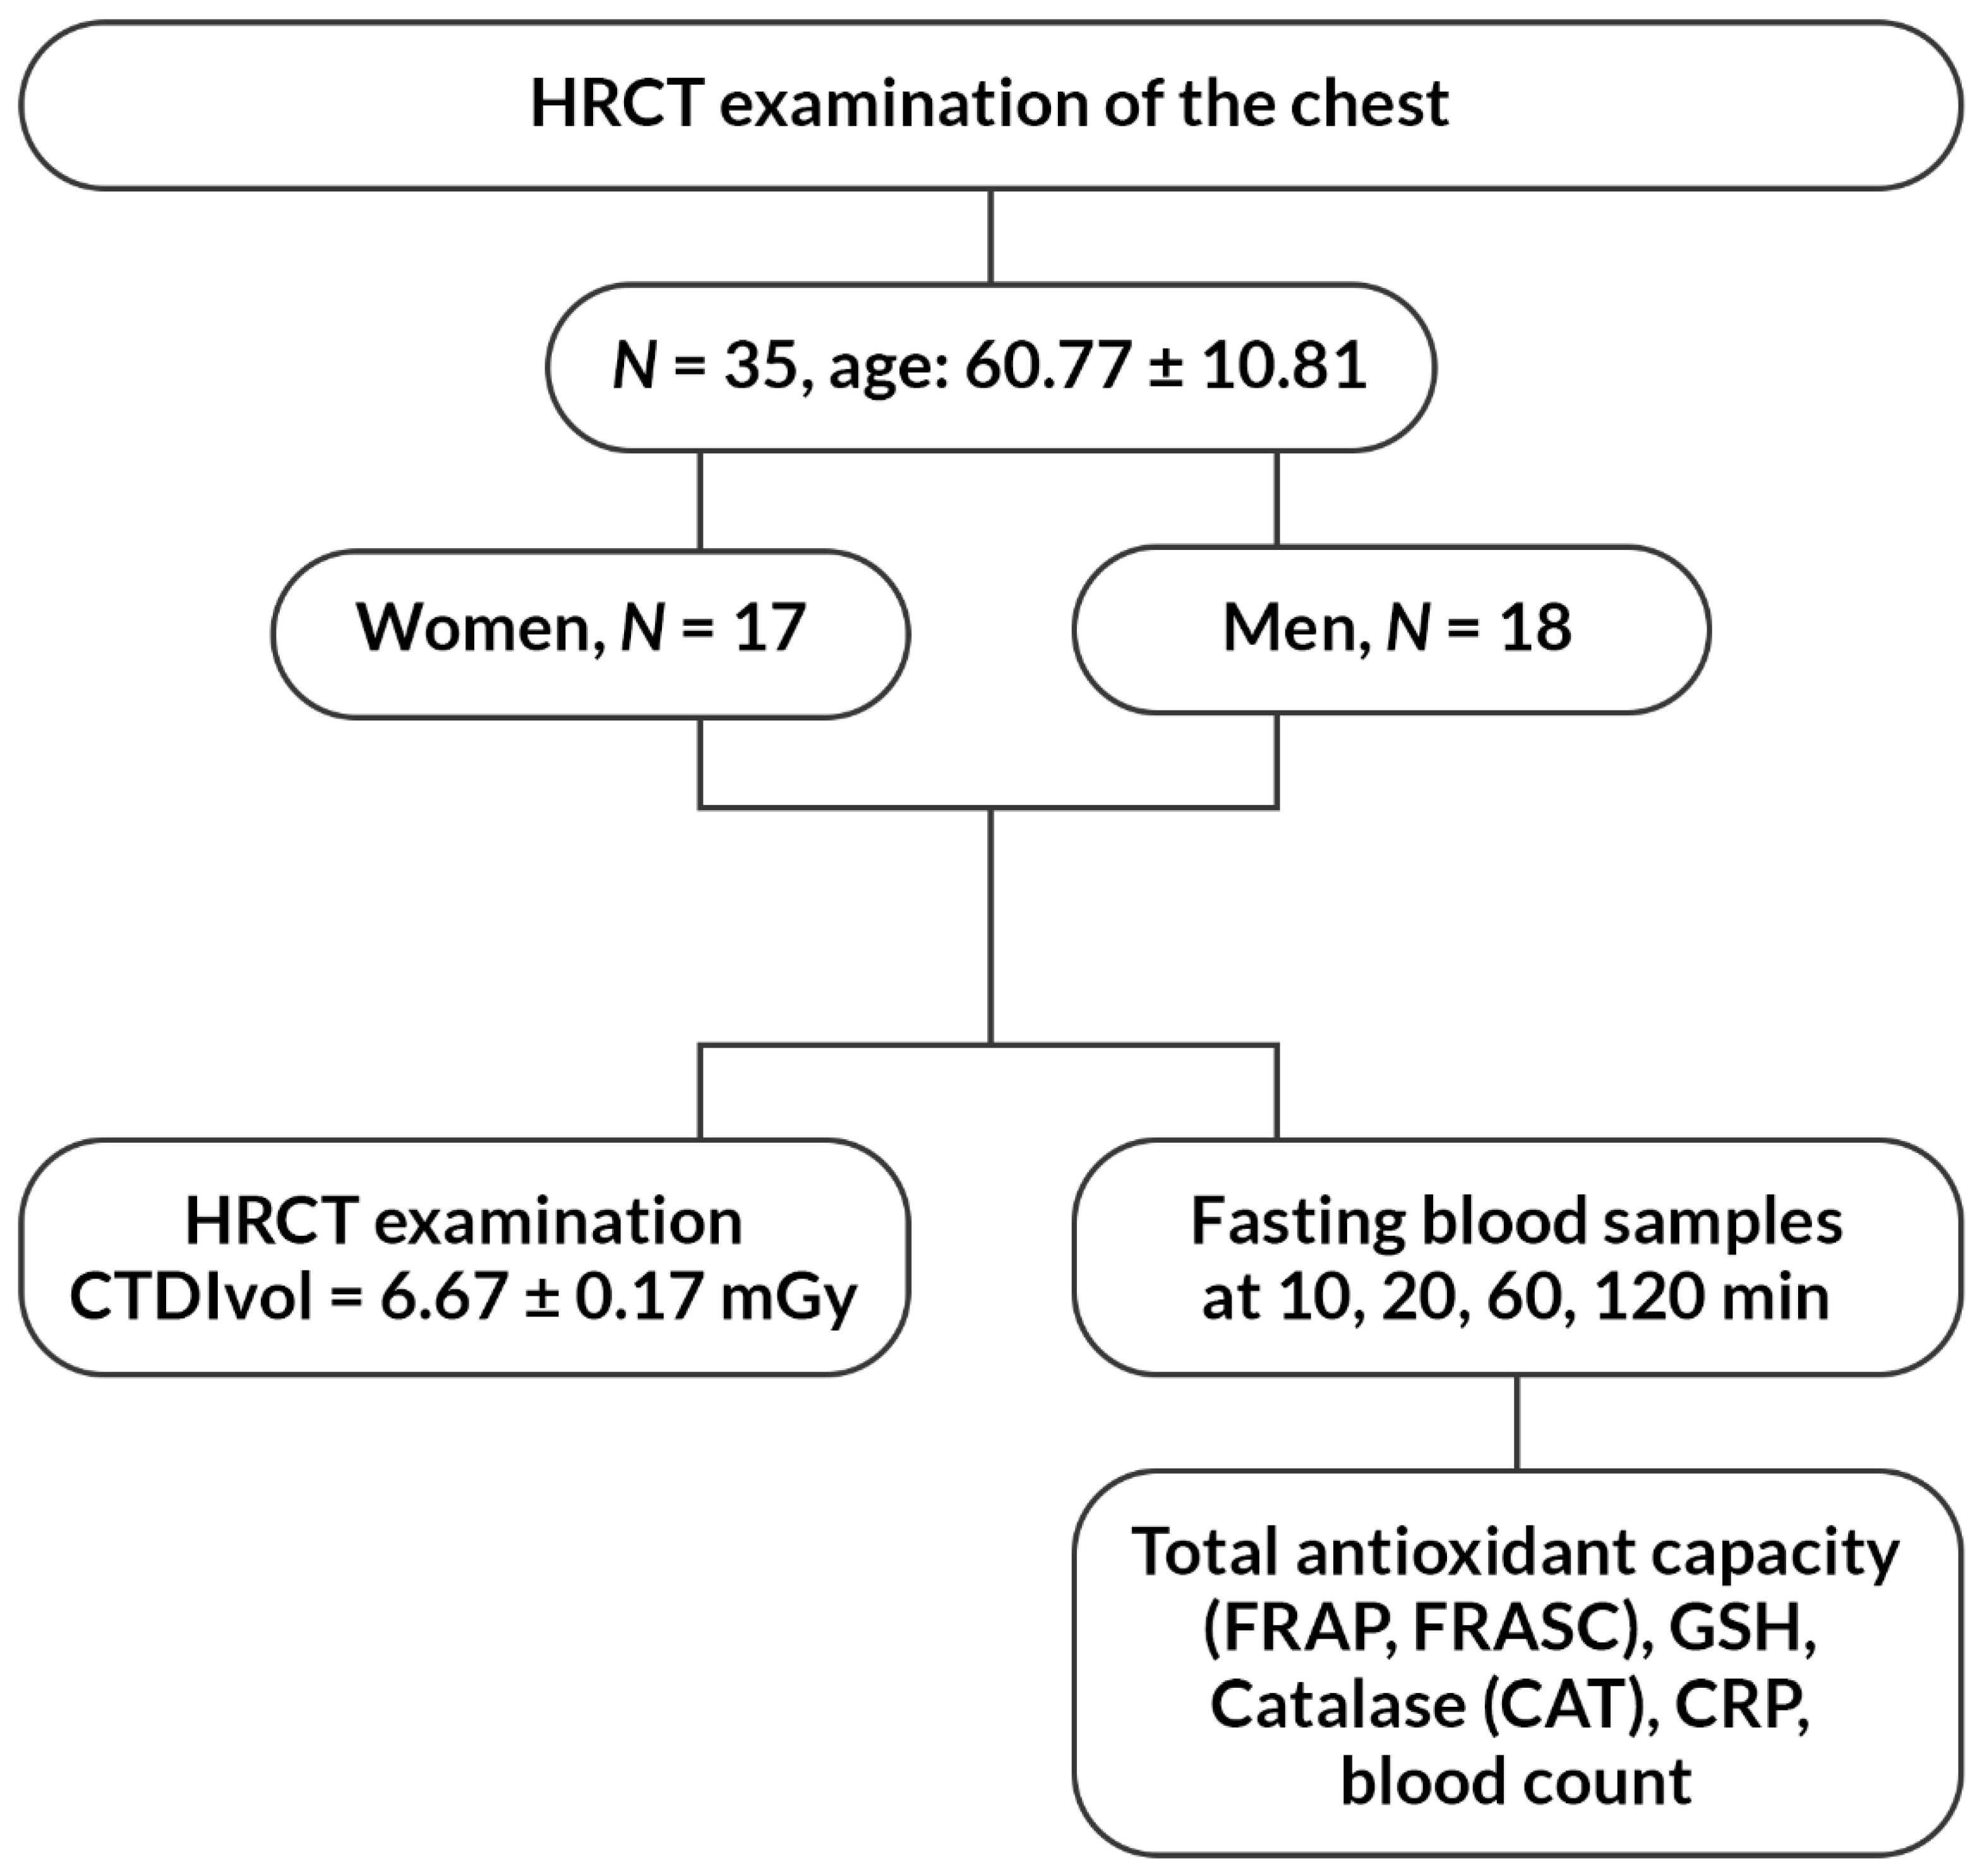
2.1. The Study Group
2.2. Collection and Preparation of the Material
2.3. Analysis of Selected Antioxidant Parameters
2.4. Statistical Analysis
3. Results
4. Discussion
5. Conclusions
- A disorder of the antioxidative system was observed in patients after the exposure to ionizing radiation during HRCT examination of the chest.
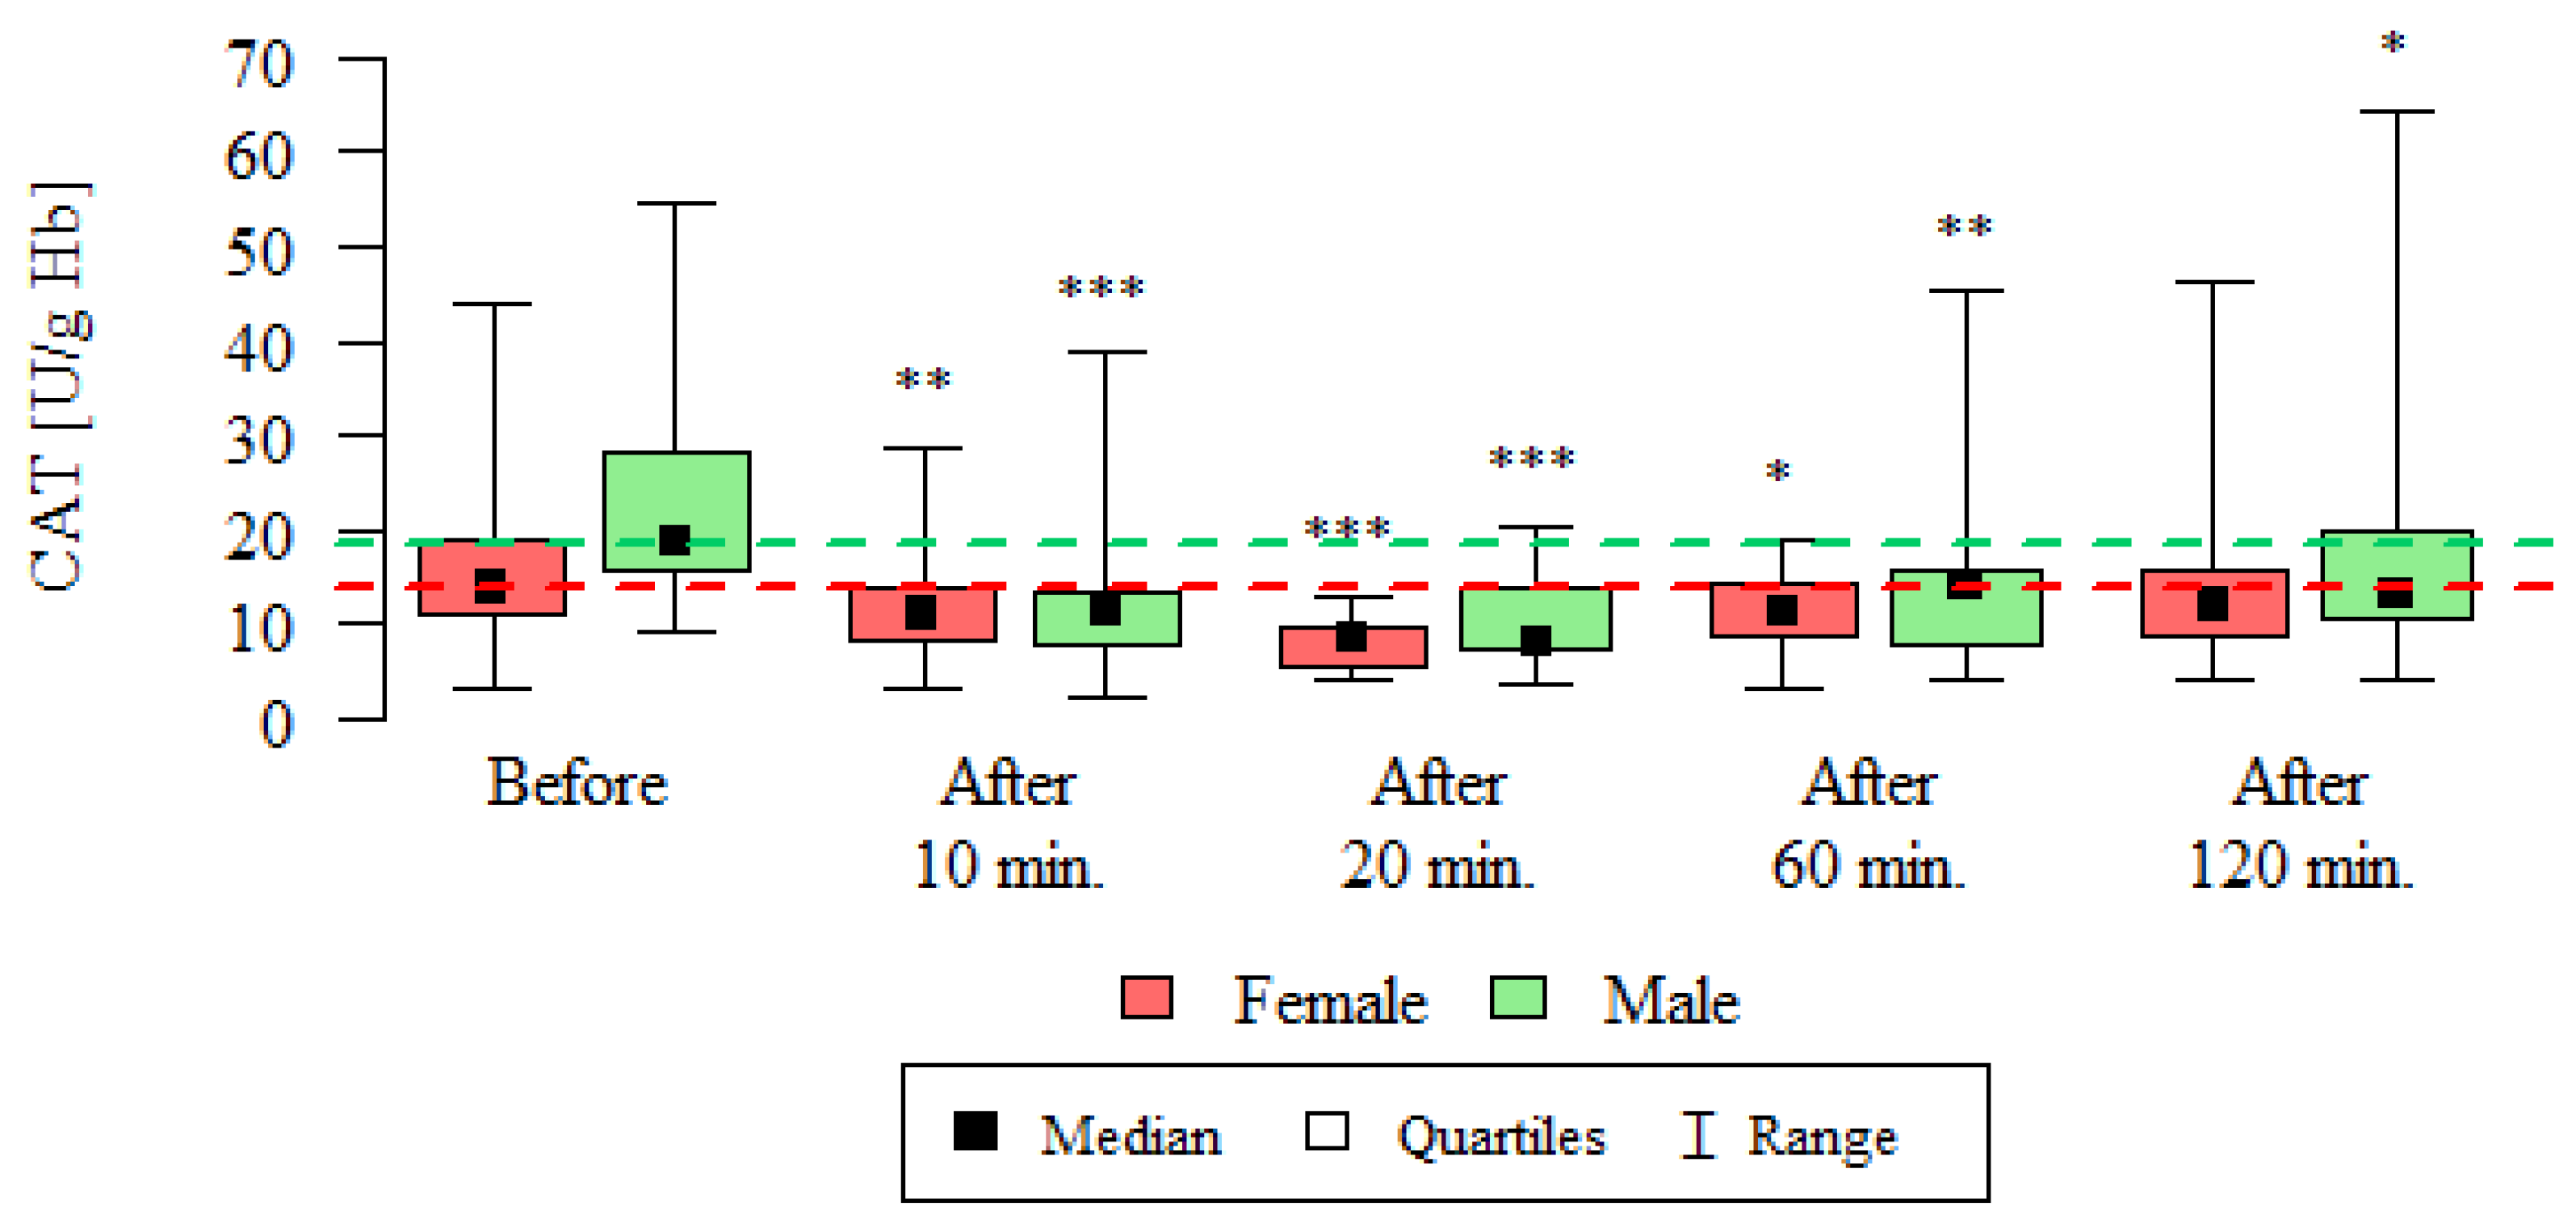
- The average activity of catalase as an element of human antioxidant defense was reduced after 10, 20, 60 and 120 min from the HRCT examination of the chest.
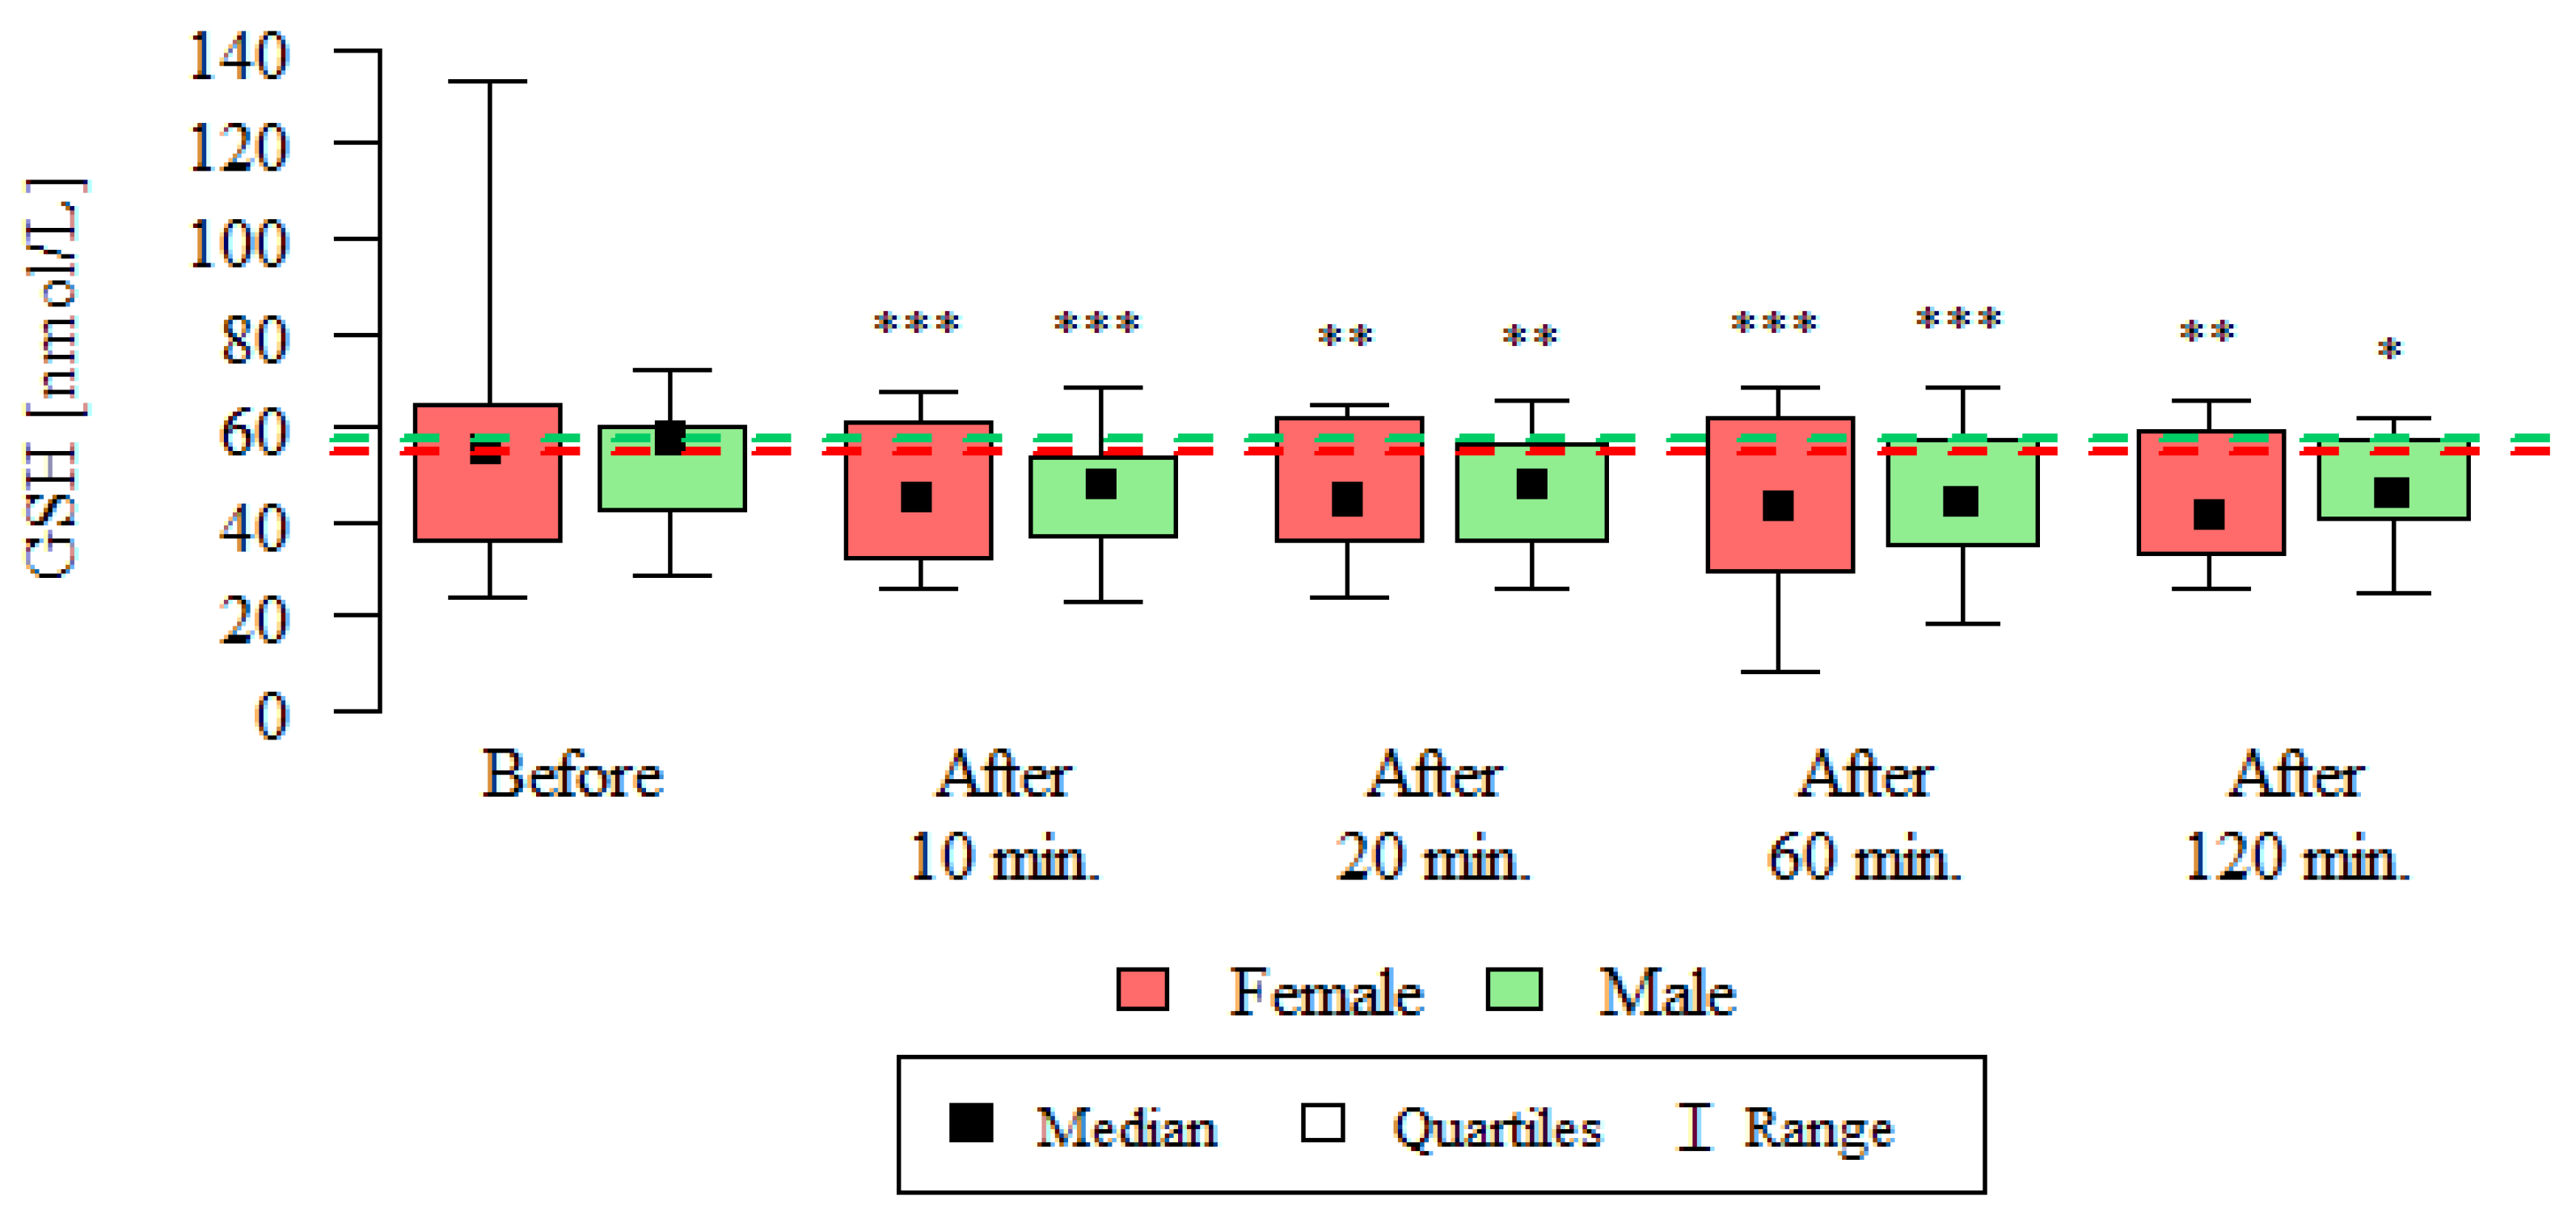
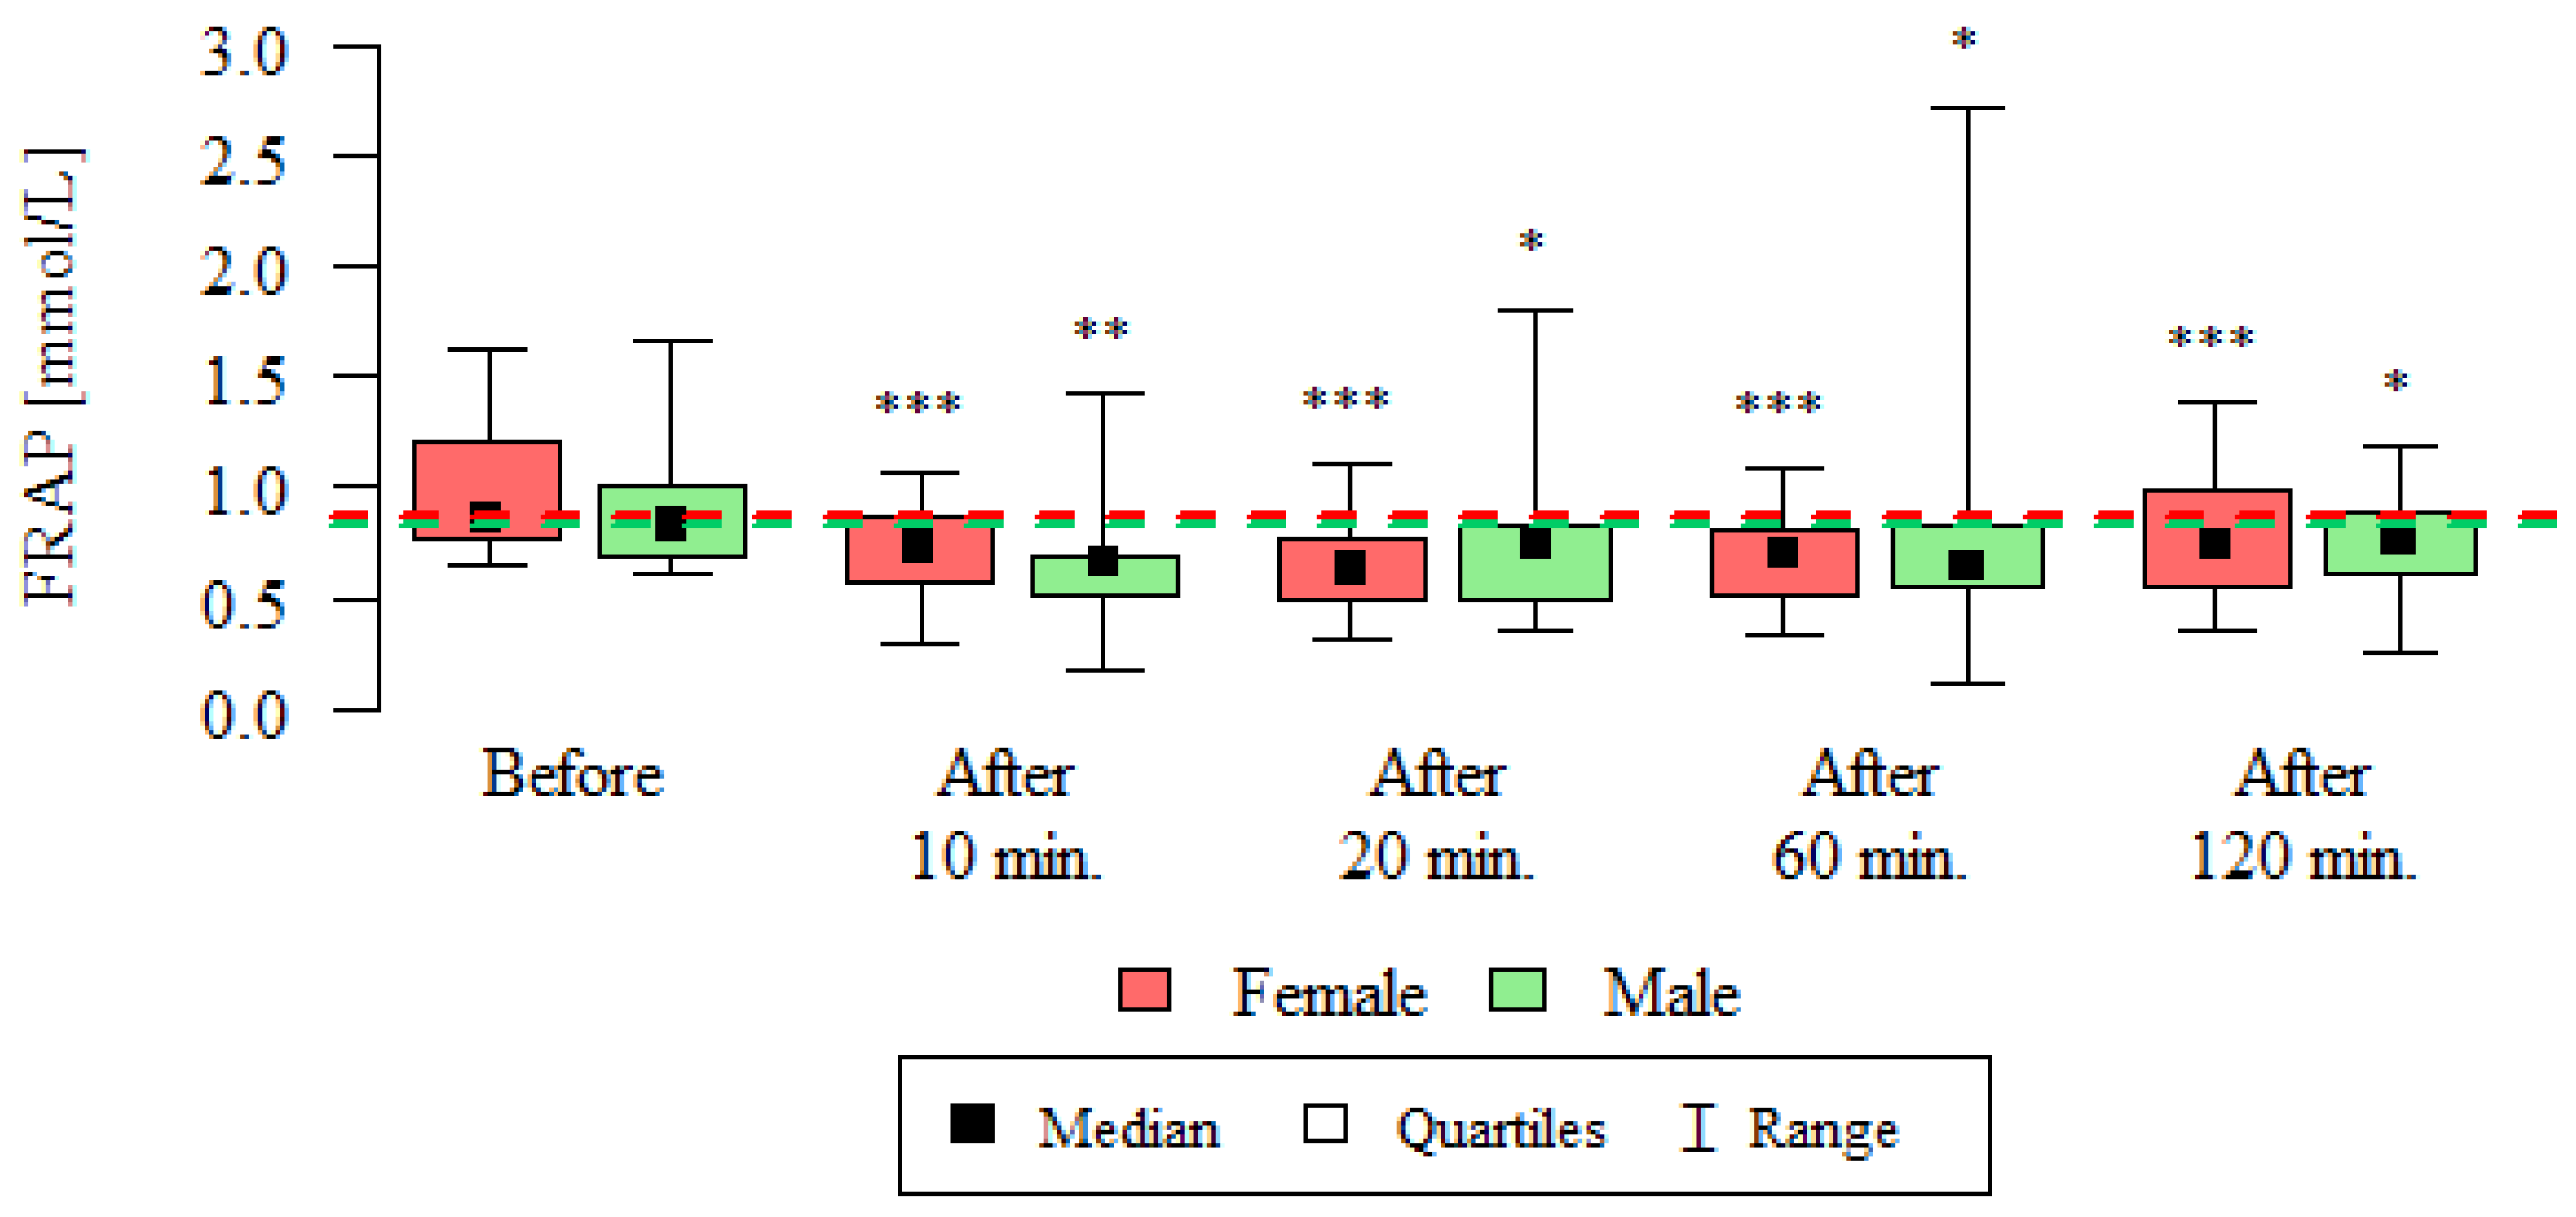
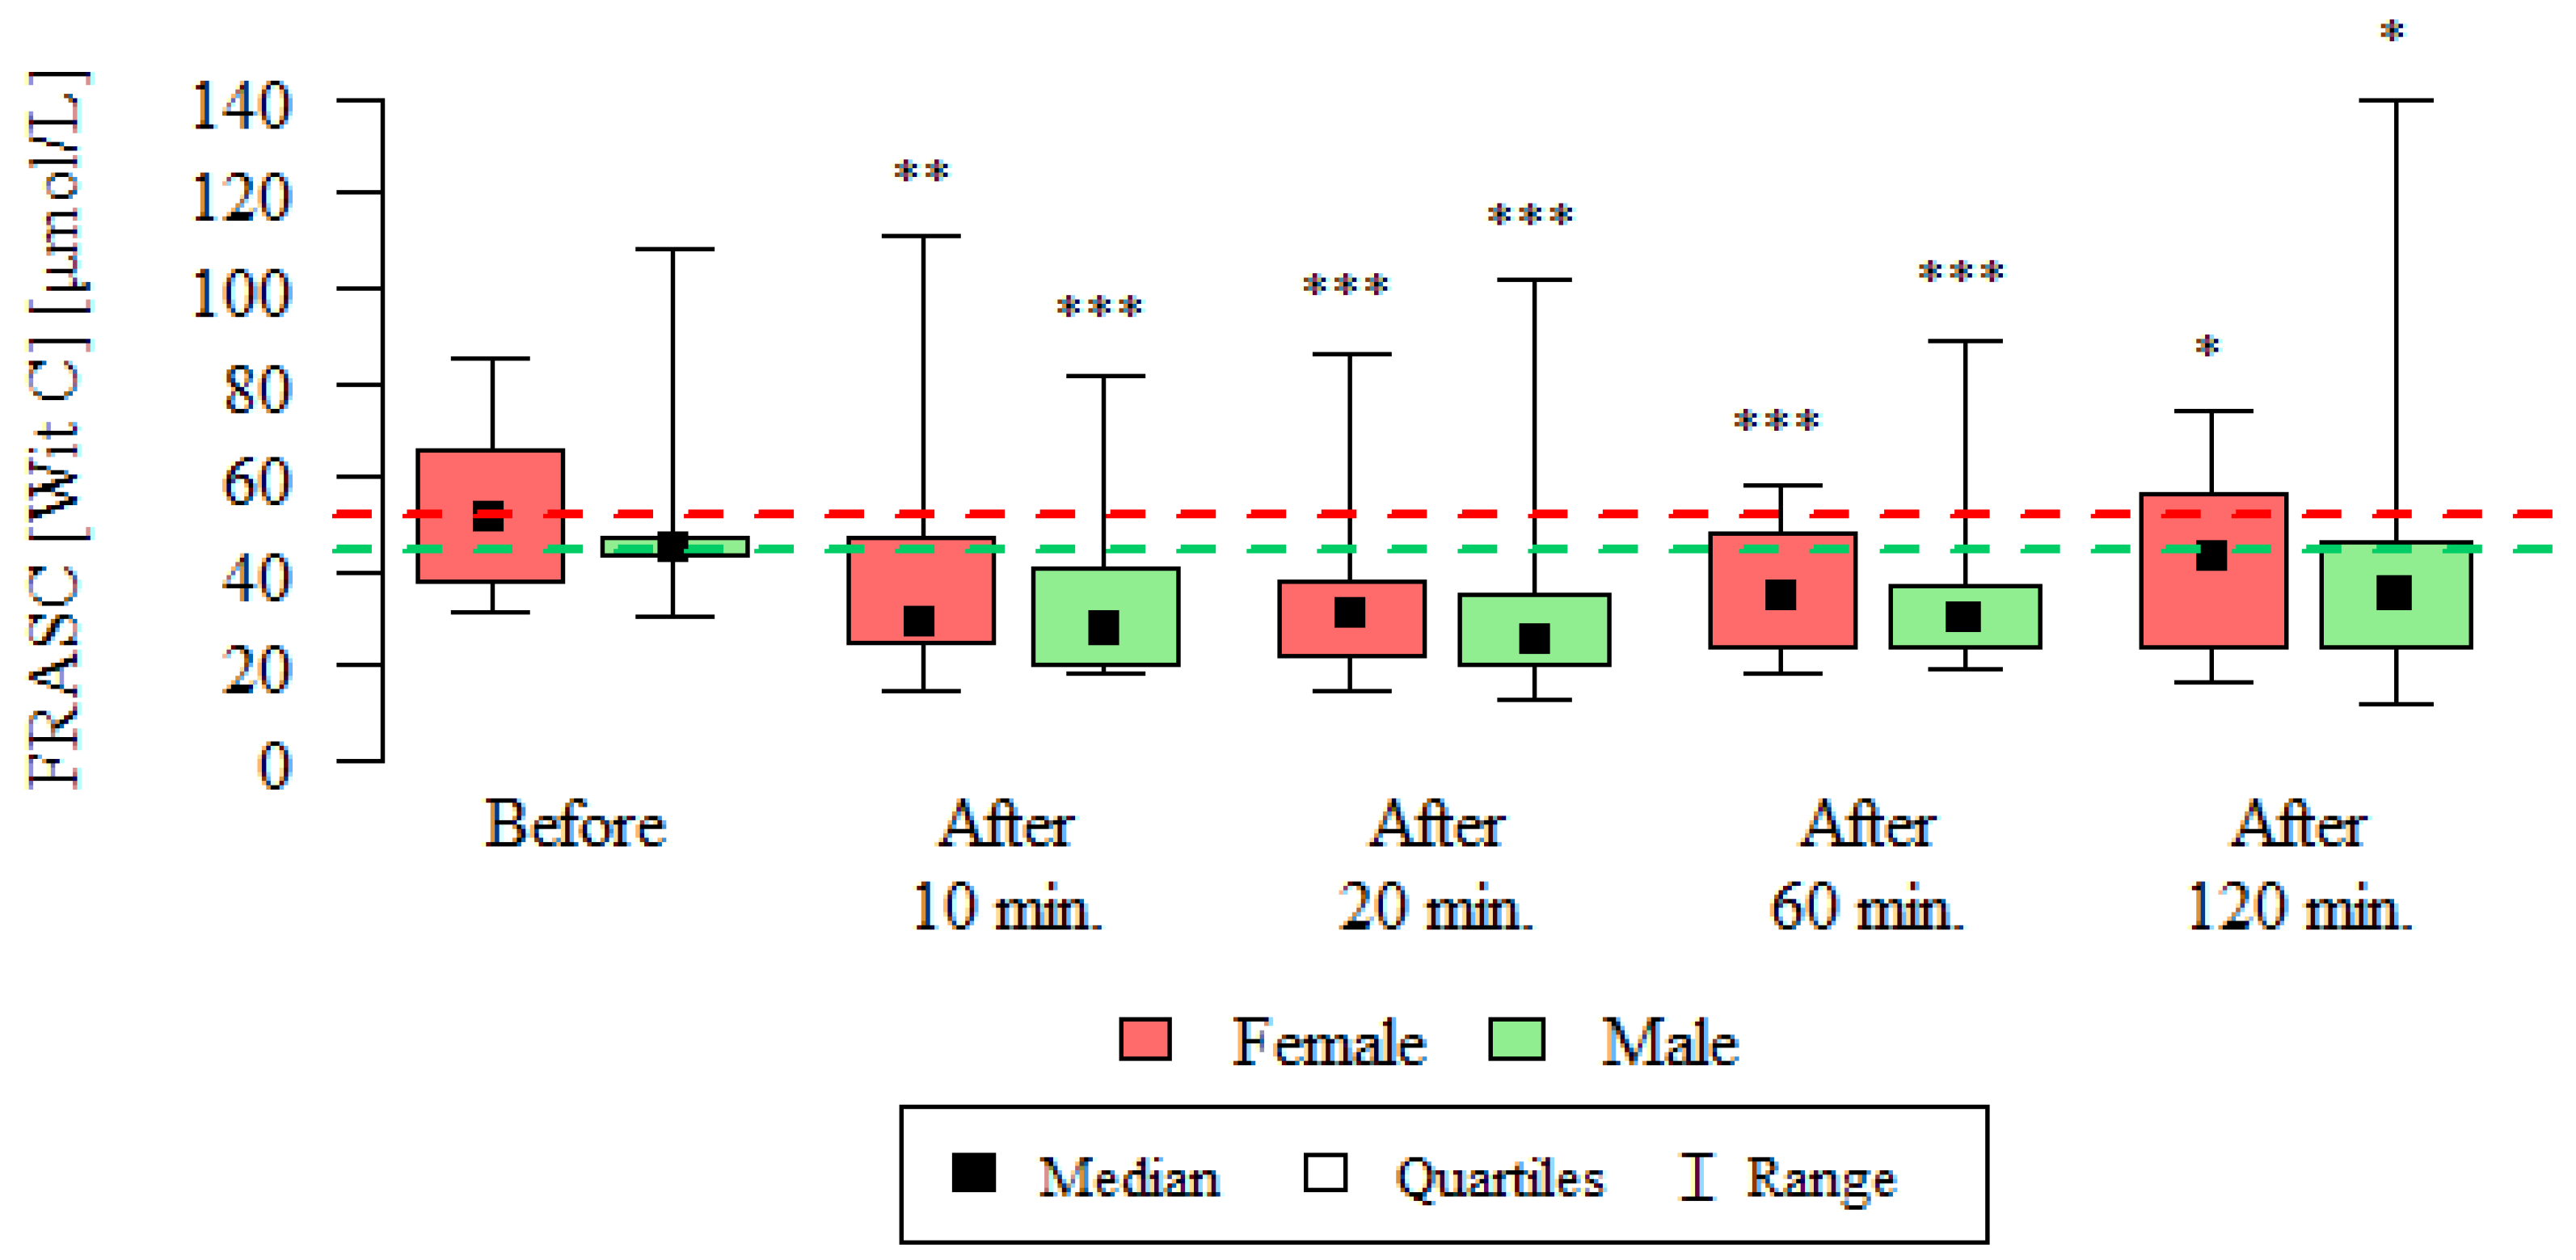
- Mean glutathione concentrations and total antioxidant potential decreased after exposure to ionizing radiation in both women and men.
- The observed changes in antioxidant parameters in humans are a manifestation of the oxidative-antioxidative balance disorder caused by the exposition to ionizing radiation during the routine HRCT examination of the chest.
- Measurement of the selected antioxidant defense parameters may constitute a useful indicator of oxidative stress resulting from ionizing radiation.
Author Contributions
Funding
Conflicts of Interest
References
- Abozaid, O.A.R.; Moawed, F.S.M.; Farrag, M.A.; Abdel Aziz, A.A.A. 4-(4-Hydroxy-3-methoxyphenyl)-2-butanone modulates redox signal in gamma-irradiation-induced nephrotoxicity in rats. Free Radic. Res. 2017, 51, 943–953. [Google Scholar] [CrossRef] [PubMed]
- Chang, J.; Feng, W.; Wang, Y.; Allen, A.R.; Turner, J.; Stewart, B.; Raber, J.; Hauer-Jensen, M.; Zhou, D.; Shao, L. 28Si total body irradiation injures bone marrow hematopoietic stem cells via induction of cellular apoptosis. Life Sci. Space Res. 2017, 13, 39–44. [Google Scholar] [CrossRef] [PubMed]
- Berrington de Gonzalez, A.; Mahesh, M.; Kim, K.P.; Bhargavan, M.; Lewis, R.; Mettler, F.; Land, C. Projected cancer risks from computed tomographic scans performed in the United States in 2007. Arch. Intern. Med. 2009, 169, 2071–2077. [Google Scholar] [CrossRef] [PubMed]
- Smith-Bindman, R.; Lipson, J.; Marcus, R.; Kim, K.P.; Mahesh, M.; Gould, R.; Berrington de González, A.; Miglioretti, D.L. Radiation dose associated with common computed tomography examinations and the associated lifetime attributable risk of cancer. Arch. Intern. Med. 2009, 169, 2078–2086. [Google Scholar] [CrossRef] [PubMed]
- Marant Micallef, C.; Shield, K.D.; Vignat, J.; Baldi, I.; Charbotel, B.; Fervers, B.; Gilg Soit, Il.A.; Guénel, P.; Olsson, A.; Rushton, L.; Hutchings, S.J.; et al. Cancers in France in 2015 attributable to occupational exposures. Int. J. Hyg. Environ. Health 2018. [Google Scholar] [CrossRef]
- Burgio, E.; Piscitelli, P.; Migliore, L. Ionizing Radiation and Human Health: Reviewing Models of Exposure and Mechanisms of Cellular Damage. An Epigenetic Perspective. Int. J. Environ. Res. Public Health 2018, 15, 1971. [Google Scholar] [CrossRef]
- Bevelacqua, J.J.; Mortazavi, S.M. Regarding “Concise Review: The Effect of Low-Dose Ionizing Radiation on Stem Cell Biology: A Contribution to Radiation Risk”. Stem Cells 2018, 36, 1789. [Google Scholar] [CrossRef]
- Redza-Dutordoir, M.; Averill-Bates, D.A. Activation of apoptosis signalling pathways by reactive oxygen species. Biochim. Biophys. Acta 2016, 1863, 2977–2992. [Google Scholar] [CrossRef]
- Khaket, T.P.; Ahmad, R. Biochemical studies on hemoglobin modified with reactive oxygen species (ROS). Appl. Biochem. Biotechnol. 2011, 164, 1422–1430. [Google Scholar] [CrossRef]
- Wang, X.; Zheng, X.; Zhang, J.; Zhao, S.; Wang, Z.; Wang, F.; Shang, W.; Barasch, J.; Qiu, A. Physiological functions of Ferroportin in the regulation of renal iron recycling and ischemic acute kidney injury. Am. J. Physiol. Renal. Physiol. 2018, 315, F1042–F1057. [Google Scholar] [CrossRef]
- Cindrova-Davies, T.; Fogarty, N.M.E.; Jones, C.J.P.; Kingdom, J.; Burton, G.J. Evidence of oxidative stress-induced senescence in mature, post-mature and pathological human placentas. Placenta 2018, 68, 15–22. [Google Scholar] [CrossRef]
- Yang, L.; Yang, X.; Tang, Y.; Zhang, D.; Zhu, L.; Wang, S.; Wang, B.; Ma, T. Inhibition of DNA-PK activity sensitizes A549 cells to X-ray irradiation by inducing the ATM-dependent DNA damage response. Mol. Med. Rep. 2018, 17, 7545–7552. [Google Scholar] [CrossRef] [Green Version]
- Benzie, I.F.; Strain, J.J. The ferric reducing ability of plasma (FRAP) as a measure of “antioxidant power”: The FRAP assay. Anal. Biochem. 1996, 239, 70–76. [Google Scholar] [CrossRef]
- Choy, C.K.; Benzie, I.F.; Cho, P. Ascorbic acid concentration and total antioxidant activity of human tear fluid measured using the FRASC assay. Invest. Ophthalmol. Vis. Sci. 2000, 41, 3293–3298. [Google Scholar] [PubMed]
- Chung, W.Y.; Chung, J.K.; Szeto, Y.T.; Tomlinson, B.; Benzie, I.F. Plasma ascorbic acid: Measurement, stability and clinical utility revisited. Clin. Biochem. 2001, 34, 623–627. [Google Scholar] [CrossRef]
- Karajibani, M., Jr.; Hashemi, M.; Montazerifar, F.; Dikshit, M. Antioxidant Status before and after Dietary Intervention in Cardiovascular Disease (CVD) Patients. Malays. J. Nutr. 2010, 16, 327–338. [Google Scholar] [PubMed]
- Benzie, I.F.; Choi, S.W. Antioxidants in food: Content, measurement, significance, action, cautions, caveats, and research needs. Adv. Food. Nutr. Res. 2014, 71, 1–53. [Google Scholar]
- Ellman, G.L. Tissue sulfhydryl groups. Arch. Biochem. Biophys. 1959, 82, 70–77. [Google Scholar] [CrossRef]
- Darczuk, D.; Krzysciak, W.; Vyhouskaya, P.; Kesek, B.; Galecka-Wanatowicz, D.; Lipska, W.; Kaczmarzyk, T.; Gluch-Lutwin, M.; Mordyl, B.; Chomyszyn-Gajewska, M. Salivary oxidative status in patients with oral lichen planus. J. Physiol. Pharmacol. 2016, 67, 885–894. [Google Scholar]
- Owens, C.W.; Belcher, R.V. A colorimetric micro-method for the determination of gluthathione. Biochem. J. 1965, 94, 705–711. [Google Scholar] [CrossRef]
- Liu, Z.; Li, T.; Deng, S.; Fu, S.; Zhou, X.; He, Y. Radiation Induces Apoptosis and Osteogenic Impairment through miR-22-Mediated Intracellular Oxidative Stress in Bone Marrow Mesenchymal Stem Cells. Stem Cells Int. 2018, 1–16. [Google Scholar] [CrossRef] [PubMed]
- Becuwe, P.; Ennen, M.; Klotz, R.; Barbieux, C.; Grandemange, S. Manganese superoxide dismutase in breast cancer: From molecular mechanisms of gene regulation to biological and clinical significance. Free Radic. Biol. Med. 2014, 77, 139–151. [Google Scholar] [CrossRef] [PubMed]
- Xu, G.; Wu, H.; Zhang, J.; Li, D.; Wang, Y.; Wang, Y.; Zhang, H.; Lu, L.; Li, C.; Huang, S.; et al. Metformin ameliorates ionizing irradiation-induced long-term hematopoietic stem cell injury in mice. Free Radic. Biol. Med. 2015, 87, 15–25. [Google Scholar] [CrossRef] [PubMed] [Green Version]
- Farhood, B.; Goradel, N.H.; Mortezaee, K.; Khanlarkhani, N.; Salehi, E. Intercellular communications-redox interactions in radiation toxicity; potential targets for radiation mitigation. J. Cell Commun. Signal. 2018, 13, 3–16. [Google Scholar] [CrossRef]
- Jiang, Y.; Chen, X.; Tian, W.; Yin, X.; Wang, J.; Yang, H. The role of TGF-β1-miR-21-ROS pathway in bystander responses induced by irradiated non-small-cell lung cancer cells. Br. J. Cancer 2014, 111, 772–780. [Google Scholar] [CrossRef]
- Han, X.; Tan, Y.; Fang, Y.; Li, F. Protective effects of celastrol against γ irradiation-induced oxidative stress in human umbilical vein endothelial cells. Exp. Ther. Med. 2018, 1–10. [Google Scholar] [CrossRef] [PubMed]
- El-Saghire, H.; Thierens, H.; Monsieurs, P.; Michaux, A.; Vandevoorde, C.; Baatout, S. Gene set enrichment analysis highlights different gene expression profiles in whole blood samples X-irradiated with low and high doses. Int. J. Radiat. Biol. 2013, 89, 628–638. [Google Scholar] [CrossRef]
- Vandevoorde, C.; Franck, C.; Bacher, K.; Breysem, L.; Smet, M.H.; Ernst, C.; De Backer, A.; Van De Moortele, K.; Smeets, P.; Thierens, H. γ-H2AX foci as in vivo effect biomarker in children emphasize the importance to minimize X-ray doses in paediatric CT imaging. Eur. Radiol. 2014, 25, 800–811. [Google Scholar] [CrossRef] [PubMed]
- Rothkamm, K.; Balroop, S.; Shekhdar, J.; Fernie, P.; Goh, V. Leukocyte DNA Damage after Multi–Detector Row CT: A Quantitative Biomarker of Low-Level Radiation Exposure. Radiology 2007, 242, 244–251. [Google Scholar] [CrossRef] [PubMed]
- Stephan, G.; Schneider, K.; Panzer, W.; Walsh, L.; Oestreicher, U. Enhanced yield of chromosome aberrations after CT examinations in paediatric patients. Int. J. Radiat. Biol. 2007, 83, 281–287. [Google Scholar] [CrossRef] [PubMed]
- Sudprasert, W.; Navasumrit, P.; Ruchirawat, M. Effects of low-dose gamma radiation on DNA damage, chromosomal aberration and expression of repair genes in human blood cells. Int. J. Hyg. Environ. Health 2006, 209, 503–511. [Google Scholar] [CrossRef] [PubMed]
- Geisel, D.; Zimmermann, E.; Rief, M.; Greupner, J.; Laule, M.; Laule, F.; Laule, B.; Dewey, M. DNA double-strand breaks as potential indicators for the biological effects of ionising radiation exposure from cardiac CT and conventional coronary angiography: A randomized, controlled study. Eur. Radiol. 2012, 22, 1641–1650. [Google Scholar] [CrossRef]
- Kuefner, M.A.; Grudzenski, S.; Hamann, J.; Achenbach, S.; Lell, M.; Anders, K.; Schwab, S.A.; Häberle, L.; Löbrich, M.; Uder, M. Effect of CT scan protocols on X-ray-induced DNA double-strand breaks in blood lymphocytes of patients undergoing coronary CT angiography. Eur. Radiol. 2010, 20, 2917–2924. [Google Scholar] [CrossRef]
- Lobrich, M.; Rief, N.; Kuhne, M.; Heckmann, M.; Fleckenstein, J.; Rube, C.; Uder, M. In vivo formation and repair of DNA double-strand breaks after computed tomography examinations. Proc. Natl. Acad. Sci. USA 2005, 102, 8984–8989. [Google Scholar] [CrossRef] [Green Version]
- Durante, M.; Formenti, S.C. Radiation-Induced Chromosomal Aberrations and Immunotherapy: Micronuclei, Cytosolic DNA, and Interferon-Production Pathway. Front. Oncol. 2018, 8. [Google Scholar] [CrossRef]
- Velauthapillai, N.; Barfett, J.; Jaffer, H.; Mikulis, D.; Murphy, K. Antioxidants Taken Orally Prior to Diagnostic Radiation Exposure Can Prevent DNA Injury. J. Vasc. Interv. Radiol. 2017, 28, 406–411. [Google Scholar] [CrossRef]
- Castellano, I.A.; Nicol, E.D.; Bull, R.K.; Roobottom, C.A.; Williams, M.C.; Harden, S.P. A prospective national survey of coronary CT angiography radiation doses in the United Kingdom. J. Cardiovasc. Comput. Tomogr. 2017, 11, 268–273. [Google Scholar] [CrossRef]
- Nestler, T.; Nestler, K.; Neisius, A.; Isbarn, H.; Netsch, C.; Waldeck, S.; Schmelz, H.U.; Ruf, C. Diagnostic accuracy of third-generation dual-source dual-energy CT: A prospective trial and protocol for clinical implementation. World J. Urol. 2018. [Google Scholar] [CrossRef] [PubMed]
- Pages, J.; Buls, N.; Osteaux, M. CT doses in children: A multicentre study. Br. J. Radiol. 2003, 76, 803–811. [Google Scholar] [CrossRef]
- Shrimpton, P.C.; Hillier, M.C.; Lewis, M.A.; Dunn, M. National survey of doses from CT in the UK: 2003. Br. J. Radiol. 2006, 79, 968–980. [Google Scholar] [CrossRef]
- Mancuso, M.; Pasquali, E.; Leonardi, S.; Tanori, M.; Rebessi, S.; Di Majo, V.; Pazzaglia, S.; Toni, M.P.; Pimpinella, M.; Covelli, V.; et al. Oncogenic bystander radiation effects in Patched heterozygous mouse cerebellum. Proc. Natl. Acad. Sci. USA 2008, 105, 12445–12450. [Google Scholar] [CrossRef] [PubMed] [Green Version]


| Women | Men | Total | |
|---|---|---|---|
| Number of patients | 18 | 17 | 35 |
| Age (mean ± SD) | 61.61 ± 12.47 | 59.88 ± 9.04 | 60.77 ± 10.81 |
| CTDIvol (mean ± SD) | 6.67 ± 0.17 | 6.67 ± 0.18 | 6.67 ± 0.17 |
| DLP (mean ± SD) | 227.89 ± 17.54 | 246.24 ± 22.64 | 236.8 ± 21.94 |
| Catalase Activity [CAT U/g Hb] | ||||||||||
| Time | Sex | n | Mean | SD | Median | Min | Max | Q1 | Q3 | p * |
| Before | Female | 18 | 16.04 | 8.77 | 13.82 | 3.2 | 43.78 | 11.22 | 18.88 | --- |
| Male | 17 | 22.16 | 11.3 | 18.51 | 9.08 | 54.59 | 15.47 | 28.14 | --- | |
| After 10 min | Female | 18 | 11.59 | 5.85 | 11 | 2.97 | 28.64 | 8.36 | 13.75 | 0.002 |
| Male | 17 | 12.53 | 8.28 | 11.4 | 2.33 | 38.79 | 7.65 | 13.15 | <0.001 | |
| After 20 min | Female | 18 | 8.24 | 2.66 | 8.56 | 3.93 | 12.93 | 5.67 | 9.89 | 0.001 |
| Male | 17 | 10.4 | 5.17 | 8.2 | 3.51 | 20.27 | 7.32 | 13.95 | <0.001 | |
| After 60 min | Female | 18 | 11.12 | 4.32 | 11.32 | 3.22 | 19 | 8.7 | 14.42 | 0.024 |
| Male | 17 | 15.18 | 10.62 | 14.2 | 3.91 | 45.16 | 7.94 | 15.82 | 0.005 | |
| After 120 min | Female | 18 | 14.89 | 11.39 | 12 | 4.17 | 46.28 | 8.91 | 15.88 | 0.212 |
| Male | 17 | 18.69 | 14.59 | 13.31 | 4.11 | 64.29 | 10.51 | 19.8 | 0.025 | |
| Reduced Glutathione GSH [nmol/L] | ||||||||||
| Time | Sex | n | Mean | SD | Median | Min | Max | Q1 | Q3 | p * |
| Before | Female | 18 | 54.35 | 24.31 | 54.78 | 24.04 | 132.85 | 36.14 | 65.04 | --- |
| Male | 17 | 52.93 | 12.21 | 57.24 | 28.91 | 72.15 | 42.27 | 60.53 | --- | |
| After 10 min | Female | 18 | 46.41 | 14.73 | 44.81 | 25.72 | 67.88 | 32.04 | 61 | <0.001 |
| Male | 16 | 46.25 | 12.65 | 47.22 | 23.37 | 68.02 | 36.52 | 53.3 | 0.001 | |
| After 20 min | Female | 18 | 46.48 | 14.27 | 44.31 | 24.37 | 64.72 | 36.03 | 62.25 | 0.004 |
| Male | 17 | 47.04 | 12.26 | 47.56 | 26.14 | 65.29 | 36.3 | 56.84 | 0.003 | |
| After 60 min | Female | 18 | 43.56 | 17.63 | 43.27 | 8.08 | 68.08 | 29.39 | 61.85 | 0.001 |
| Male | 17 | 44.89 | 14.02 | 43.78 | 18.45 | 68.55 | 34.87 | 57.44 | <0.001 | |
| After 120 min | Female | 18 | 45.15 | 14.35 | 41.26 | 26.22 | 65.92 | 33.15 | 59.35 | 0.002 |
| Male | 16 | 46.58 | 11.45 | 45.65 | 25.05 | 62.38 | 40.73 | 56.88 | 0.013 | |
| FRAP [mmol/L] | ||||||||||
| Time | Sex | n | Mean | SD | Median | Min | Max | Q1 | Q3 | p * |
| Before | Female | 18 | 1 | 0.31 | 0.87 | 0.64 | 1.63 | 0.77 | 1.2 | --- |
| Male | 17 | 0.91 | 0.31 | 0.83 | 0.61 | 1.66 | 0.69 | 1 | --- | |
| After 10 min | Female | 18 | 0.7 | 0.22 | 0.73 | 0.3 | 1.08 | 0.57 | 0.87 | <0.001 |
| Male | 17 | 0.65 | 0.28 | 0.66 | 0.17 | 1.42 | 0.52 | 0.69 | 0.004 | |
| After 20 min | Female | 18 | 0.65 | 0.22 | 0.63 | 0.31 | 1.1 | 0.49 | 0.77 | <0.001 |
| Male | 17 | 0.74 | 0.34 | 0.74 | 0.35 | 1.8 | 0.5 | 0.83 | 0.02 | |
| After 60 min | Female | 18 | 0.67 | 0.21 | 0.7 | 0.34 | 1.08 | 0.51 | 0.81 | <0.001 |
| Male | 17 | 0.8 | 0.57 | 0.64 | 0.13 | 2.73 | 0.56 | 0.83 | 0.017 | |
| After 120 min | Female | 18 | 0.79 | 0.28 | 0.74 | 0.35 | 1.38 | 0.55 | 0.99 | 0.001 |
| Male | 16 | 0.75 | 0.26 | 0.77 | 0.25 | 1.18 | 0.61 | 0.89 | 0.011 | |
| FRASC (Vitamin C) [µmol/L] | ||||||||||
| Time | Sex | n | Mean | SD | Median | Min | Max | Q1 | Q3 | p * |
| Before | Female | 18 | 52.43 | 15.79 | 51.3 | 31.53 | 84.72 | 37.84 | 65.61 | --- |
| Male | 17 | 48.72 | 17.75 | 44.7 | 30.32 | 108.46 | 42.95 | 47.35 | --- | |
| After 10 min | Female | 18 | 37.14 | 22.9 | 28.89 | 14.28 | 110.6 | 25 | 47.39 | 0.002 |
| Male | 17 | 33.38 | 17.04 | 27.65 | 18.19 | 81.32 | 20.66 | 40.78 | 0.001 | |
| After 20 min | Female | 18 | 34.14 | 18.62 | 30.69 | 14.23 | 86.1 | 22.12 | 37.62 | <0.001 |
| Male | 17 | 31.82 | 21.79 | 25.56 | 13.19 | 101.68 | 19.86 | 35.36 | <0.001 | |
| After 60 min | Female | 18 | 36.29 | 12.9 | 34.85 | 18.02 | 57.81 | 23.84 | 48.38 | <0.001 |
| Male | 17 | 34.95 | 16.09 | 30.27 | 19.28 | 89.03 | 24.41 | 36.66 | <0.001 | |
| After 120 min | Female | 18 | 42.72 | 19.68 | 43.29 | 16.51 | 73.68 | 24.39 | 56.66 | 0.018 |
| Male | 16 | 40.36 | 29.59 | 35.03 | 11.99 | 139.97 | 23.85 | 45.88 | 0.039 | |
| Measurement | Correlation Coefficient | p | Dependence | The Power of Dependence |
|---|---|---|---|---|
| Correlation between FRAP and FRASC in Women | ||||
| Before | 0.112 | 0.656 | --- | --- |
| After 10 min | 0.62 | 0.007 | positive | average |
| After 20 min | 0.183 | 0.467 | --- | --- |
| After 60 min | 0.005 | 0.987 | --- | --- |
| After 120 min | −0.165 | 0.512 | --- | --- |
| Correlation between FRAP and FRASC in Men | ||||
| Before | 0.302 | 0.239 | --- | --- |
| After 10 min | −0.006 | 0.981 | --- | --- |
| After 20 min | 0.228 | 0.377 | --- | --- |
| After 60 min | −0.056 | 0.831 | --- | --- |
| After 120 min | −0.076 | 0.78 | --- | --- |
| Correlation between FRAP and FRASC both Women and Men | ||||
| Before | 0.314 | 0.066 | --- | --- |
| After 10 min | 0.338 | 0.047 | positive | weak |
| After 20 min | 0.183 | 0.291 | --- | --- |
| After 60 min | −0.017 | 0.922 | --- | --- |
| After 120 min | −0.01 | 0.953 | --- | --- |
| CAT [U/g Hb] | ||||||||||
| Time | Sex | n | Mean | SD | Median | Min | Max | Q1 | Q3 | p * |
| Before | Female | 18 | 16.04 | 8.77 | 13.82 | 3.2 | 43.78 | 11.22 | 18.88 | 0.041 |
| Male | 17 | 22.16 | 11.3 | 18.51 | 9.08 | 54.59 | 15.47 | 28.14 | ||
| After 10 min | Female | 18 | 11.59 | 5.85 | 11 | 2.97 | 28.64 | 8.36 | 13.75 | 1 |
| Male | 17 | 12.53 | 8.28 | 11.4 | 2.33 | 38.79 | 7.65 | 13.15 | ||
| After 20 min | Female | 18 | 8.24 | 2.66 | 8.56 | 3.93 | 12.93 | 5.67 | 9.89 | 0.4 |
| Male | 17 | 10.4 | 5.17 | 8.2 | 3.51 | 20.27 | 7.32 | 13.95 | ||
| After 60 min | Female | 18 | 11.12 | 4.32 | 11.32 | 3.22 | 19 | 8.7 | 14.42 | 0.318 |
| Male | 17 | 15.18 | 10.62 | 14.2 | 3.91 | 45.16 | 7.94 | 15.82 | ||
| After 120 min | Female | 18 | 14.89 | 11.39 | 12 | 4.17 | 46.28 | 8.91 | 15.88 | 0.198 |
| Male | 16 | 18.69 | 14.59 | 13.31 | 4.11 | 64.29 | 10.51 | 19.8 | ||
| GSH [nmol/L] | ||||||||||
| Time | Sex | n | Mean | SD | Median | Min | Max | Q1 | Q3 | p * |
| Before | Female | 18 | 54.35 | 24.31 | 54.78 | 24.04 | 132.85 | 36.14 | 65.04 | 0.804 |
| Male | 17 | 52.93 | 12.21 | 57.24 | 28.91 | 72.15 | 42.27 | 60.53 | ||
| After 10 min | Female | 18 | 46.41 | 14.73 | 44.81 | 25.72 | 67.88 | 32.04 | 61 | 0.986 |
| Male | 17 | 46.25 | 12.65 | 47.22 | 23.37 | 68.02 | 36.52 | 53.3 | ||
| After 20 min | Female | 18 | 46.48 | 14.27 | 44.31 | 24.37 | 64.72 | 36.03 | 62.25 | 0.934 |
| Male | 17 | 47.04 | 12.26 | 47.56 | 26.14 | 65.29 | 36.3 | 56.84 | ||
| After 60 min | Female | 18 | 43.56 | 17.63 | 43.27 | 8.08 | 68.08 | 29.39 | 61.85 | 0.961 |
| Male | 17 | 44.89 | 14.02 | 43.78 | 18.45 | 68.55 | 34.87 | 57.44 | ||
| After 120 min | Female | 18 | 45.15 | 14.35 | 41.26 | 26.22 | 65.92 | 33.15 | 59.35 | 0.796 |
| Male | 16 | 46.58 | 11.45 | 45.65 | 25.05 | 62.38 | 40.73 | 56.88 | ||
| FRAP [mmol/L] | ||||||||||
| Time | Sex | n | Mean | SD | Median | Min | Max | Q1 | Q3 | p * |
| Before | Female | 18 | 1 | 0.31 | 0.87 | 0.64 | 1.63 | 0.77 | 1.2 | 0.338 |
| Male | 17 | 0.91 | 0.31 | 0.83 | 0.61 | 1.66 | 0.69 | 1 | ||
| After 10 min | Female | 18 | 0.7 | 0.22 | 0.73 | 0.3 | 1.08 | 0.57 | 0.87 | 0.428 |
| Male | 17 | 0.65 | 0.28 | 0.66 | 0.17 | 1.42 | 0.52 | 0.69 | ||
| After 20 min | Female | 18 | 0.65 | 0.22 | 0.63 | 0.31 | 1.1 | 0.49 | 0.77 | 0.463 |
| Male | 17 | 0.74 | 0.34 | 0.74 | 0.35 | 1.8 | 0.5 | 0.83 | ||
| After 60 min | Female | 18 | 0.67 | 0.21 | 0.7 | 0.34 | 1.08 | 0.51 | 0.81 | 0.807 |
| Male | 17 | 0.8 | 0.57 | 0.64 | 0.13 | 2.73 | 0.56 | 0.83 | ||
| After 120 min | Female | 18 | 0.79 | 0.28 | 0.74 | 0.35 | 1.38 | 0.55 | 0.99 | 0.932 |
| Male | 16 | 0.75 | 0.26 | 0.77 | 0.25 | 1.18 | 0.61 | 0.89 | ||
| FRASC (vitamin C) [µmol/L] | ||||||||||
| Time | Sex | N | Mean | SD | Median | Min | Max | Q1 | Q3 | p * |
| Before | Female | 18 | 52.43 | 15.79 | 51.3 | 31.53 | 84.72 | 37.84 | 65.61 | 0.347 |
| Male | 17 | 48.72 | 17.75 | 44.7 | 30.32 | 108.46 | 42.95 | 47.35 | ||
| After 10 min | Female | 18 | 37.14 | 22.9 | 28.89 | 14.28 | 110.6 | 25 | 47.39 | 0.656 |
| Male | 17 | 33.38 | 17.04 | 27.65 | 18.19 | 81.32 | 20.66 | 40.78 | ||
| After 20 min | Female | 18 | 34.14 | 18.62 | 30.69 | 14.23 | 86.1 | 22.12 | 37.62 | 0.335 |
| Male | 17 | 31.82 | 21.79 | 25.56 | 13.19 | 101.68 | 19.86 | 35.36 | ||
| After 60 min | Female | 18 | 36.29 | 12.9 | 34.85 | 18.02 | 57.81 | 23.84 | 48.38 | 0.478 |
| Male | 17 | 34.95 | 16.09 | 30.27 | 19.28 | 89.03 | 24.41 | 36.66 | ||
| After 120 min | Female | 18 | 42.72 | 19.68 | 43.29 | 16.51 | 73.68 | 24.39 | 56.66 | 0.398 |
| Male | 16 | 40.36 | 29.59 | 35.03 | 11.99 | 139.97 | 23.85 | 45.88 | ||
| Parameter | Before | After 10 Min | After 20 Min | After 60 Min | After 120 Min |
|---|---|---|---|---|---|
| Females | |||||
| FRAP [mmol/L] | r = −0.052 p = 0.839 | r = 0.300 p = 0.227 | r = 0.226 p = 0.366 | r = 0.055 p = 0.829 | r = −0.217 p = 0.387 |
| FRASC (vitamin C) [µmol/L] | r = 0.543 p = 0.02 * | r = 0.417 p = 0.085 | r = 0.46 p = 0.055 | r = 0.286 p = 0.249 | r = 0.323 p = 0.191 |
| GSH [nmol/L] | r = −0.181 p = 0.472 | r = −0.237 p = 0.344 | r = −0.013 p = 0.958 | r = −0.031 p = 0.903 | r = 0.139 p = 0.583 |
| CAT [U/g Hb] | r = −0.131 p = 0.603 | r = −0.402 p = 0.098 | r = −0.101 p = 0.69 | r = 0.133 p = 0.598 | r = −0.04 p = 0.874 |
| Males | |||||
| FRAP [mmol/L] | r = 0.181 p = 0.488 | r = 0.085 p = 0.746 | r = 0.036 p = 0.892 | r = −0.043 p = 0.87 | r = 0.227 p = 0.398 |
| FRASC (vitamin C) [µmol/L] | r = −0.392 p = 0.12 | r = −0.403 p = 0.109 | r = −0.084 p = 0.75 | r = −0.346 p = 0.173 | r = −0.631 p = 0.009 ** |
| GSH [nmol/L] | r = 0.151 p = 0.563 | r = 0.06 p = 0.824 | r = −0.057 p = 0.828 | r = −0.071 p = 0.786 | r = 0.133 p = 0.624 |
| CAT [U/g Hb] | r = 0.186 p = 0.476 | r = 0.134 p = 0.608 | r = −0.237 p = 0.36 | r = 0.065 p = 0.804 | r = 0.035 p = 0.897 |
| Females and Males | |||||
| FRAP [mmol/L] | r = 0.048 p = 0.782 | r = 0.218 p = 0.208 | r = 0.117 p = 0.505 | r = 0.03 p = 0.865 | r = 0.043 p = 0.809 |
| FRASC (vitamin C) [µmol/L] | r = 0.165 p = 0.343 | r = 0.062 p = 0.723 | r = 0.185 p = 0.287 | r = 0.043 p = 0.806 | r = −0.035 p = 0.842 |
| GSH [nmol/L] | r = −0.014 p = 0.935 | r = −0.064 p = 0.72 | r = −0.028 p = 0.875 | r = −0.04 p = 0.818 | r = 0.123 p = 0.487 |
| CAT [U/g Hb] | r = −0.03 p = 0.865 | r = −0.125 p = 0.473 | r = −0.181 p = 0.297 | r = 0.068 p = 0.699 | r = −0.059 p = 0.742 |
| Parameter | Before | After 10 Min | After 20 Min | After 60 Min | After 120 Min |
|---|---|---|---|---|---|
| Dependence on CTDIvol | |||||
| FRAP [mmol/L] | r = 0.059 p = 0.735 | r = 0.14 p = 0.421 | r = 0.178 p = 0.306 | r = 0.011 p = 0.951 | r = 0.156 p = 0.38 |
| FRASC (vitamin C) [µmol/L] | r = −0.144 p = 0.408 | r = −0.288 p = 0.094 | r = −0.088 p = 0.614 | r = −0.19 p = 0.274 | r = −0.021 p = 0.907 |
| GSH [nmol/L] | r = 0.226 p = 0.192 | r = 0.151 p = 0.395 | r = 0.131 p = 0.453 | r = 0.296 p = 0.084 | r = 0.107 p = 0.549 |
| CAT [U/g Hb] | r = 0.071 p = 0.684 | r = −0.051 p = 0.773 | r = −0.18 p = 0.302 | r = −0.067 p = 0.701 | r = −0.026 p = 0.885 |
| Dependence on DLP | |||||
| FRAP [mmol/L] | r = 0.052 p = 0.766 | r = −0.208 p = 0.229 | r = −0.116 p = 0.506 | r = −0.062 p = 0.723 | r = 0.021 p = 0.906 |
| FRASC (vitamin C) [µmol/L] | r = −0.298 p = 0.082 | r = −0.43 p = 0.01 | r = −0.195 p = 0.261 | r = −0.235 p = 0.174 | r = −0.326 p = 0.06 |
| GSH [nmol/L] | r = 0.238 p = 0.168 | r = 0.176 p = 0.32 | r = 0.129 p = 0.46 | r = 0.192 p = 0.27 | r = 0.141 p = 0.428 |
| CAT [U/g Hb] | r = 0.257 p = 0.136 | r = −0.015 p = 0.934 | r = −0.14 p = 0.424 | r = −0.088 p = 0.617 | r = 0.103 p = 0.562 |
© 2019 by the authors. Licensee MDPI, Basel, Switzerland. This article is an open access article distributed under the terms and conditions of the Creative Commons Attribution (CC BY) license (http://creativecommons.org/licenses/by/4.0/).
Share and Cite
Bryll, A.; Krzyściak, W.; Jurczak, A.; Chrzan, R.; Lizoń, A.; Urbanik, A. Changes in the Selected Antioxidant Defense Parameters in the Blood of Patients after High Resolution Computed Tomography. Int. J. Environ. Res. Public Health 2019, 16, 1476. https://doi.org/10.3390/ijerph16091476
Bryll A, Krzyściak W, Jurczak A, Chrzan R, Lizoń A, Urbanik A. Changes in the Selected Antioxidant Defense Parameters in the Blood of Patients after High Resolution Computed Tomography. International Journal of Environmental Research and Public Health. 2019; 16(9):1476. https://doi.org/10.3390/ijerph16091476
Chicago/Turabian StyleBryll, Amira, Wirginia Krzyściak, Anna Jurczak, Robert Chrzan, Anna Lizoń, and Andrzej Urbanik. 2019. "Changes in the Selected Antioxidant Defense Parameters in the Blood of Patients after High Resolution Computed Tomography" International Journal of Environmental Research and Public Health 16, no. 9: 1476. https://doi.org/10.3390/ijerph16091476