Article

137Cs-Based Variation of Soil Erosion in Vertical Zones of a Small Catchment in Southwestern China

1
Institute of Mountain Hazards and Environment, Chinese Academy of Sciences, Chengdu 610041, China
2
University of Chinese Academy of Sciences, Beijing 100049, China
*
Author to whom correspondence should be addressed.
Int. J. Environ. Res. Public Health 2019, 16(8), 1371; https://doi.org/10.3390/ijerph16081371
Submission received: 4 April 2019 / Revised: 12 April 2019 / Accepted: 13 April 2019 / Published: 16 April 2019

Abstract

:
The study of the variability of soil erosion in mountainous areas provides the basis for soil and water conservation work and forest ecological construction in a targeted way. In this study, Liangshan Town catchment, a typical catchment in the Hengduan Mountains region, southwest China, was selected to investigate the variation of soil erosion in different vertical zones using the 137Cs tracing technique. The mean 137Cs reference inventories varied between 573.51 and 705.54 Bq/m2, with the elevation increasing from 1600 to 2600 m. The rates of soil erosion exhibited a significant variation. Under the same land cover condition, the average annual soil erosion modulus of high-elevation forest (elevation > 2200 m) was 400.3 t/(km2·a). However, the average annual soil erosion modulus of a low-elevation sparse forest (elevation < 1600 m) was as high as 1756 t/(km2·a). The average annual soil erosion modulus of the sloping farmland, mainly distributed at elevations of 1600–2200 m, was estimated to be 2771 t/(km2·a). These results indicate that effective soil management measures need to be implemented on the cultivated sloping land in the future.

1. Introduction

Soil erosion remains one of the most important environmental problems that threaten the survival and sustainable development of human beings [1,2]. Concerns for the environmental problems associated with soil erosion in agricultural and forest land also directed attention to the impact of soil and water loss in mountainous and sloping farmland, where the soil is more exposed to intense erosion and the sediments from soil erosion have a great effect on the river system [3,4]. Therefore, understanding the key zones of soil and water imbalance is an important requirement [5].
Accelerated soil erosion and degradation caused by excessive land use make soil one of the scarce resources in both developed and developing countries. Therefore, quantitative assessments of soil erosion and the evaluation of the rate of soil loss are urgently needed for effective soil and water conservation measures and sediment management strategies. Despite an apparent progress in the quantification of soil losses and sediment redistribution achieved in China during the past several decades [6,7], an objective knowledge about the intensity of these processes is still insufficient in different landscapes, for example, the Hengduan Mountains area in southwest China [8]. The soils in this region are extremely prone to erosion due to the loose sedimentary rock structure and, especially, the intensive agricultural activities [9]. On-site effects of erosion include soil degradation and the associated crop productivity reduction in this region, while off-site problems include watercourse and reservoir siltation and the eutrophication of water bodies. Previous studies [10,11] have demonstrated that the Hengduan Mountains region is one of the main sources of sediment input to rivers such as the Lancang and Yangtze Rivers.
Fallout radionuclides (FRNs), such as 137Cs, 210Pbex, and 7Be, have been widely used for assessing the rates of soil loss at different and temporal scales [12,13]. Anthropogenic fallout radionuclide 137Cs is the most commonly used radionuclide, and its deposition rate on the earth’s surface showed a significant peak in 1963 [14,15]. 137Cs is mainly absorbed by fine soil particles, especially clay minerals, after reaching the ground through dry and wet deposition [16]. It moves slowly in the vertical direction along water seepage and migrates mechanically through physical processes such as the erosion, transport, and deposition of soil particles in space [17,18]. 137Cs has proved to be a cost- and time-effective tool to evaluate soil redistribution due to erosion within the landscape and can complement the information provided by conventional erosion measurements and modelling [19,20]. This study aimed to quantify the variation of soil erosion and to explore the hotspots of soil loss on a small agricultural catchment of the Hengduan Mountains region, southwest China.

2. Materials and Methods
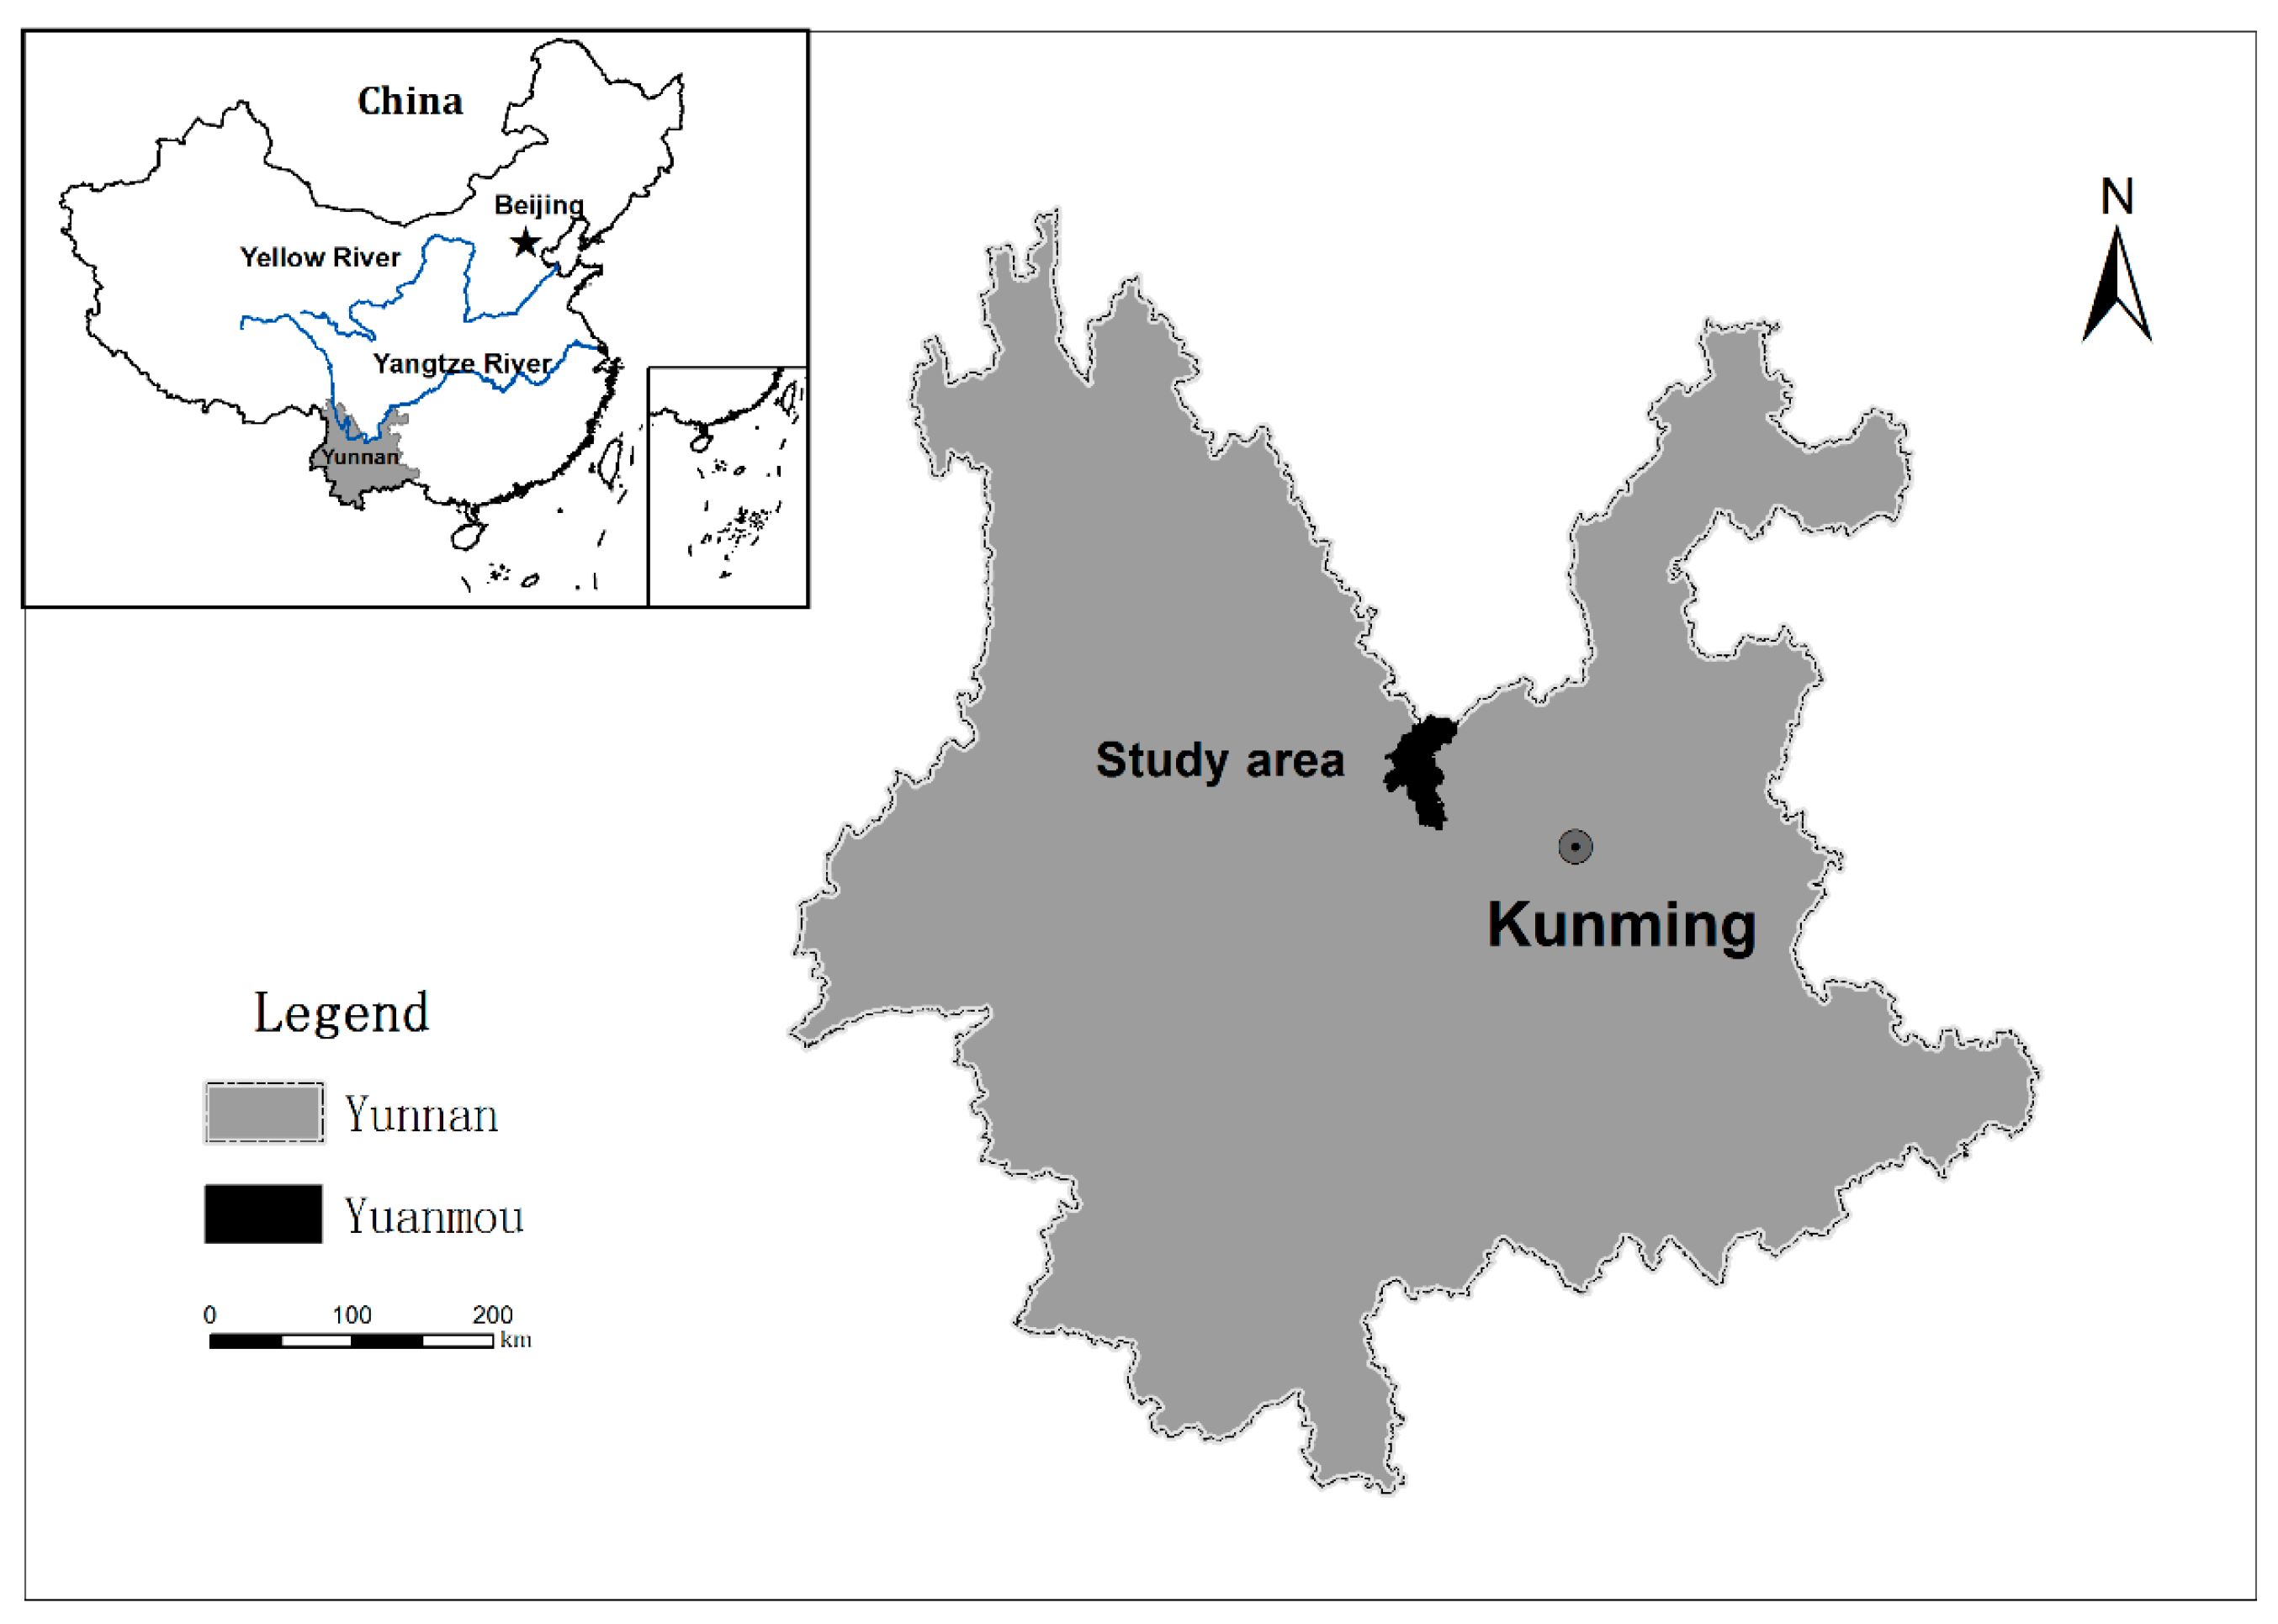
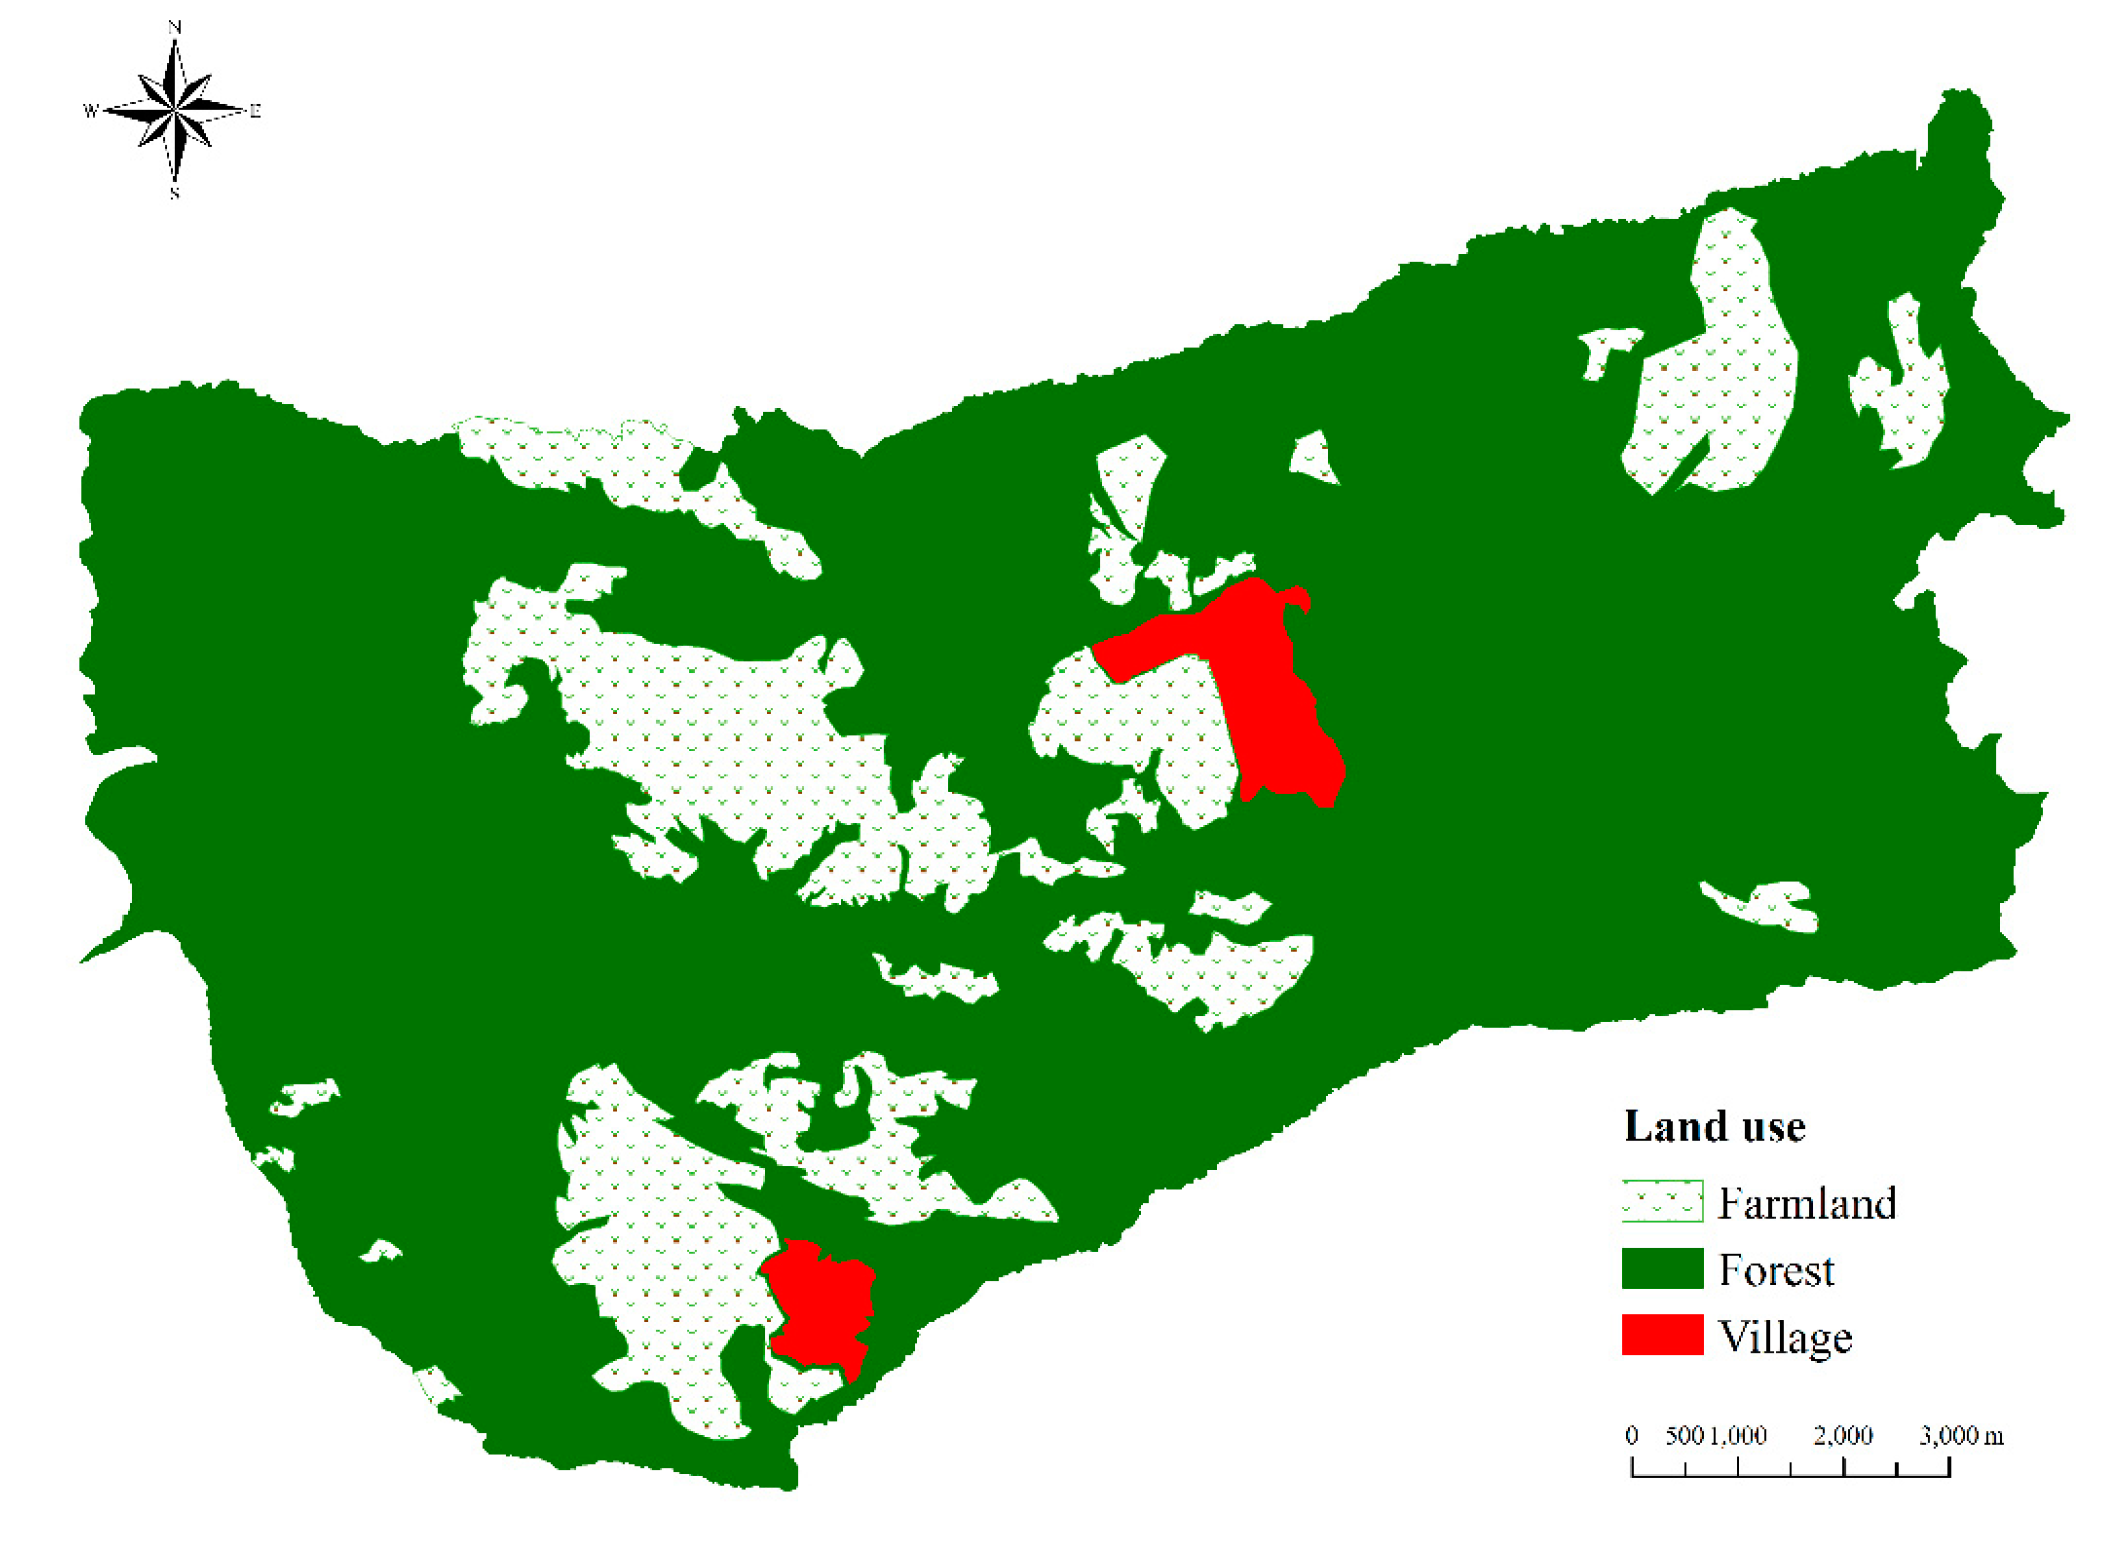
2.1. Study Area

The Liangshan Town catchment (4.4 km2), located in the Hengduan Mountains region in Yuanmou County of Yunnan Province (Figure 1), was chosen as the study area. The mean annual temperature and precipitation in the study area were 10.5 °C and 914.9 mm, respectively. The main soil types are yellow-brown soil and purple soil with bulk densities ranging from 1.2 to 1.4 g/cm3. The dominant land uses in this catchment area are forestry and cropland, accounting for 80.2% and 18.4% of the total area, respectively (Figure 2).
The forestland can be divided into two sections according to their elevations, namely the high-elevation forestland (2200–2835 m) and the low-elevation sparse forestland (1350–1600 m). In the former section, the forest is mainly composed of Chir pine, Pinus yunnanensis, and broadleaf tree species (Quercus semecarpifolia and Quercus glauca). However, in the low-elevation sparse forestland section, vegetation is dominated by Dodonaea viscosa shrubs and secondary eucalyptus [21].
The mid-catchment, with an elevation varying between 1600 and 2200 m, is characterized by cropland in terms of land use. Here, slope-cultivated land occupies 42.3% of the cropland area, followed by terrace land that occupies 35.6% and paddy fields that cover 22.1% of the cropland area.

2.2. Soil Sampling and 137Cs Measurements

The collection of soil samples from the catchment for 137Cs analysis involved two separate sampling strategies. The first was designed to establish the 137Cs reference inventories and their depth distribution in the soil profile. In this case, reference locations with a minimum slope and terrace land were selected for each vertical zone (i.e., 1350–1600 m, 1600–2200 m, and 2200–2835 m). The reference sites were sampled using a grid design to collect 5–10 samples, including one depth incremental sample for each vertical section. The sampling depths were 20–30 cm for forested sites and 30–40 cm for terrace land. The depth incremental samples were sectioned at 2-cm intervals. The second sampling strategy involved a coring program to establish the magnitude of soil redistribution rates within the catchment. In this case, the catchment was divided into several sampling units based on land use types (i.e., forest or cropland), and a minimum of 10 samples were taken for each unit. All samples were collected using a 7-cm diameter stainless steel coring device.
All samples were air-dried, disaggregated, and passed through a 2-mm sieve prior to a determination of their 137Cs activity by gamma spectrometry using a hyperpure lithium-drifted germanium detector (ORTEC, Oak Ridge, TN, USA). A sample weight of approximately 250 g and a counting time of over 35,000 s provided results with an analytical error of approximately ± 6% at the 95% level of confidence.

2.3. Conversion Models

A simplified Mass Balance Model [22] is widely used for the assessment of erosion rates on cultivated land, and it is expressed as follows:
A = A 0 ( 1 h / H ) N 1963
where A0 is the 137Cs reference inventory (Bq·m−2); A is the 137Cs inventory at an eroding point (Bq·m−2); h is the annual soil loss in depth since the year 1963 (cm); H is the plough depth (cm); and N is the sampling year.
For uncultivated soil, the depth distribution of 137Cs in the soil profile is significantly different from that in cultivated soils. Usually, the depth distribution of 137Cs in an undisturbed stable soil exhibits a well-defined exponential decline with depth, described by a Profile Distribution Model:
A x = A 0 ( 1 e x / h 0 )
where x is the mass depth from the soil surface (kg·m−2); Ax is the 137Cs inventory above depth x (Bq·m−2); and h0 is the coefficient describing the profile shape (kg·m−2).

3. Results

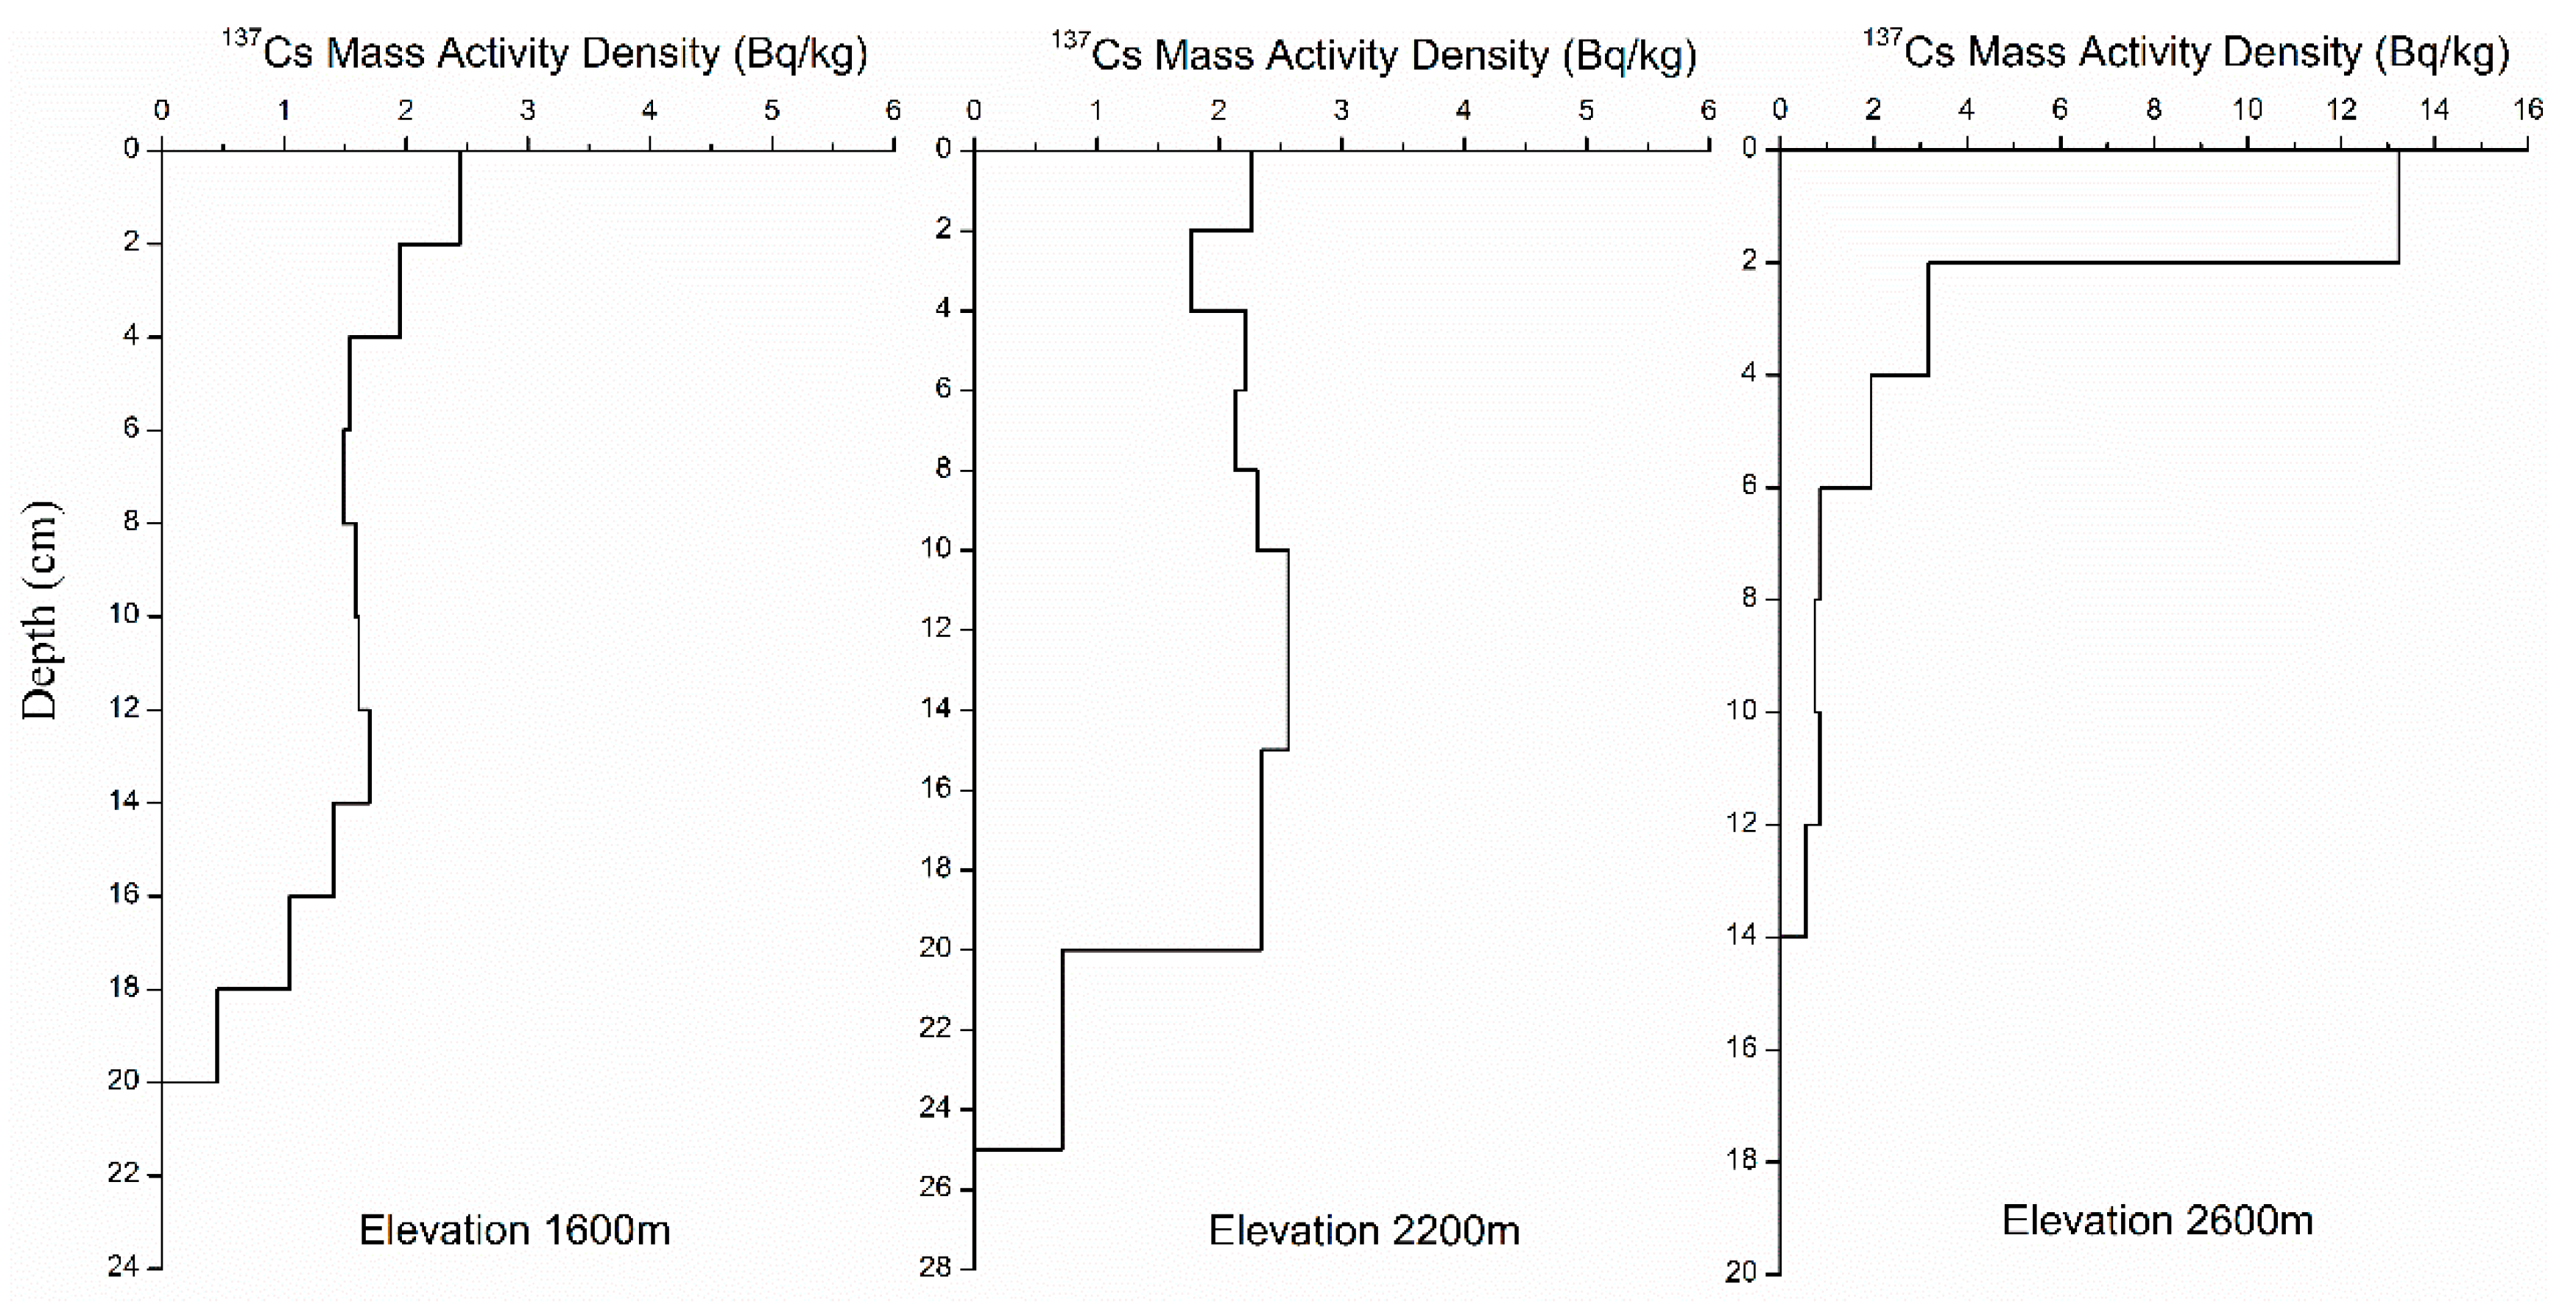
3.1. Variation of 137Cs Reference Inventory

The regional variability of 137Cs reference inventories in China were mainly related to rainfall and climate, China’s nuclear test in Xinjiang, and the former Soviet Union’s nuclear test in Central Asia [23]. Many studies have reported that 137Cs reference inventories in Yunnan province are rather low; the main reasons could be that this region is far away from the nuclear test sites as they are separated by mountains. In addition, because of the influence of the southwest monsoon climate, water vapours mainly come from the low latitude Indian Ocean, where few nuclear tests were conducted.
The moisture-rich monsoon airflow from the Indian Ocean form precipitation when forced to rise upon encountering high mountains. As vertical gradients of elevation in the study area reach more than 1500 m, the precipitation increases with elevation, and the distribution of precipitation varies significantly because of the large fluctuation of terrain. The elevation gradients of the catchment selected in this study range from 1350 m to 2835 m along the valley to the summit. The precipitation in the past two years increased from 652.2 to 914.9 mm, increasing by 40.3% along the valley to the top of the mountain. The 137Cs reference inventories increased by 23%, from 573.5 to 705.5 Bq/m2 along a 1600–2600-m elevation. The vertical variability of 137Cs reference inventories demonstrated that it was inaccurate to calculate the soil erosion modulus using only one mean value of reference inventories in the whole study area when the elevation and precipitation changed significantly in the vertical, when using the fallout radionuclide 137Cs technique to estimate soil erosion or sediments deposition. In contrast, the design of multilocation and multi-reference inventories was a more reasonable sampling method (Table 1).
American scientist Sutherland [24] pointed out that the sampling method and sample size are primary factors that affect the experimental results of the fallout radionuclide 137Cs technique. However, the sampling method and size of reference inventories are not described in detail in many studies that have applied this method. For reference areas with information on the number of control locations and the estimate of dispersion, the minimum number of samples (n’) necessary to estimate the mean 137Cs baseline inventory with an allowable error of 10% at a 90% confidence was determined using the following equation [25]:
n = [ t ( a , n 1 ) · C V A E ] 2
where t is the Student’s t-value for a = 0.10 (90% confidence), with n − 1 degrees of freedom. CV is the coefficient of variation (decimal fraction) and is defined as the standard deviation or arithmetic mean, and AE is the allowable error 0.1.
Thus, the experimental results are not convincible if it lacks details of the sample method and size of reference inventories, as the estimation of the soil erosion was based on the average value of the reference inventories. Unscientific reference inventories would increase the deviation between the estimated results and the actual values of soil erosion or sediment deposition. Therefore, the dispersion degree of data at the sampling location is a prerequisite to calculate the CV value of the data. The minimum sample size n at a 90% confidence interval under the T test is calculated based on the CV value, and the sampling of reference inventories is unrepresentative when the number of samples (n) is less than n’. The variation coefficients of 137Cs reference inventories at three vertical zones were all within the normal range in this study, with n > n’.
Figure 3 showed the depth distribution of 137Cs reference inventories at the three sampling locations. The 137Cs reference inventories obtained under the Pinus yunnanensis forest at 2600 m, along a depth distribution, showed a significant variation in the exponential function because this site is covered with the Yunnan pine and is free from human interference due to its high elevation. The 137Cs activities of surface soil were the highest and reached up to 13.2 Bq/kg. The 137Cs activity values decreased exponentially with an increasing soil depth up to a 14-cm depth. The curve presented a typical depth variation of 137Cs in uncultivated soil, which indicated that the sampling sites had not been disturbed by human activities in the past 50 years. The depth distribution of 137Cs reference inventories obtained at 2200 m and 1600 m varied in a pattern typical of cultivated land. The 137Cs activity values in the agricultural layer (approx. 15 cm) were uniform and decreased dramatically below the agricultural layer. It was confirmed that the two reference locations were old terraced fields that had not been changed artificially in the past 50 years; these locations were suitable as reference sites for 137Cs at this elevation and were identified after inquiring with local farmers and investigations.

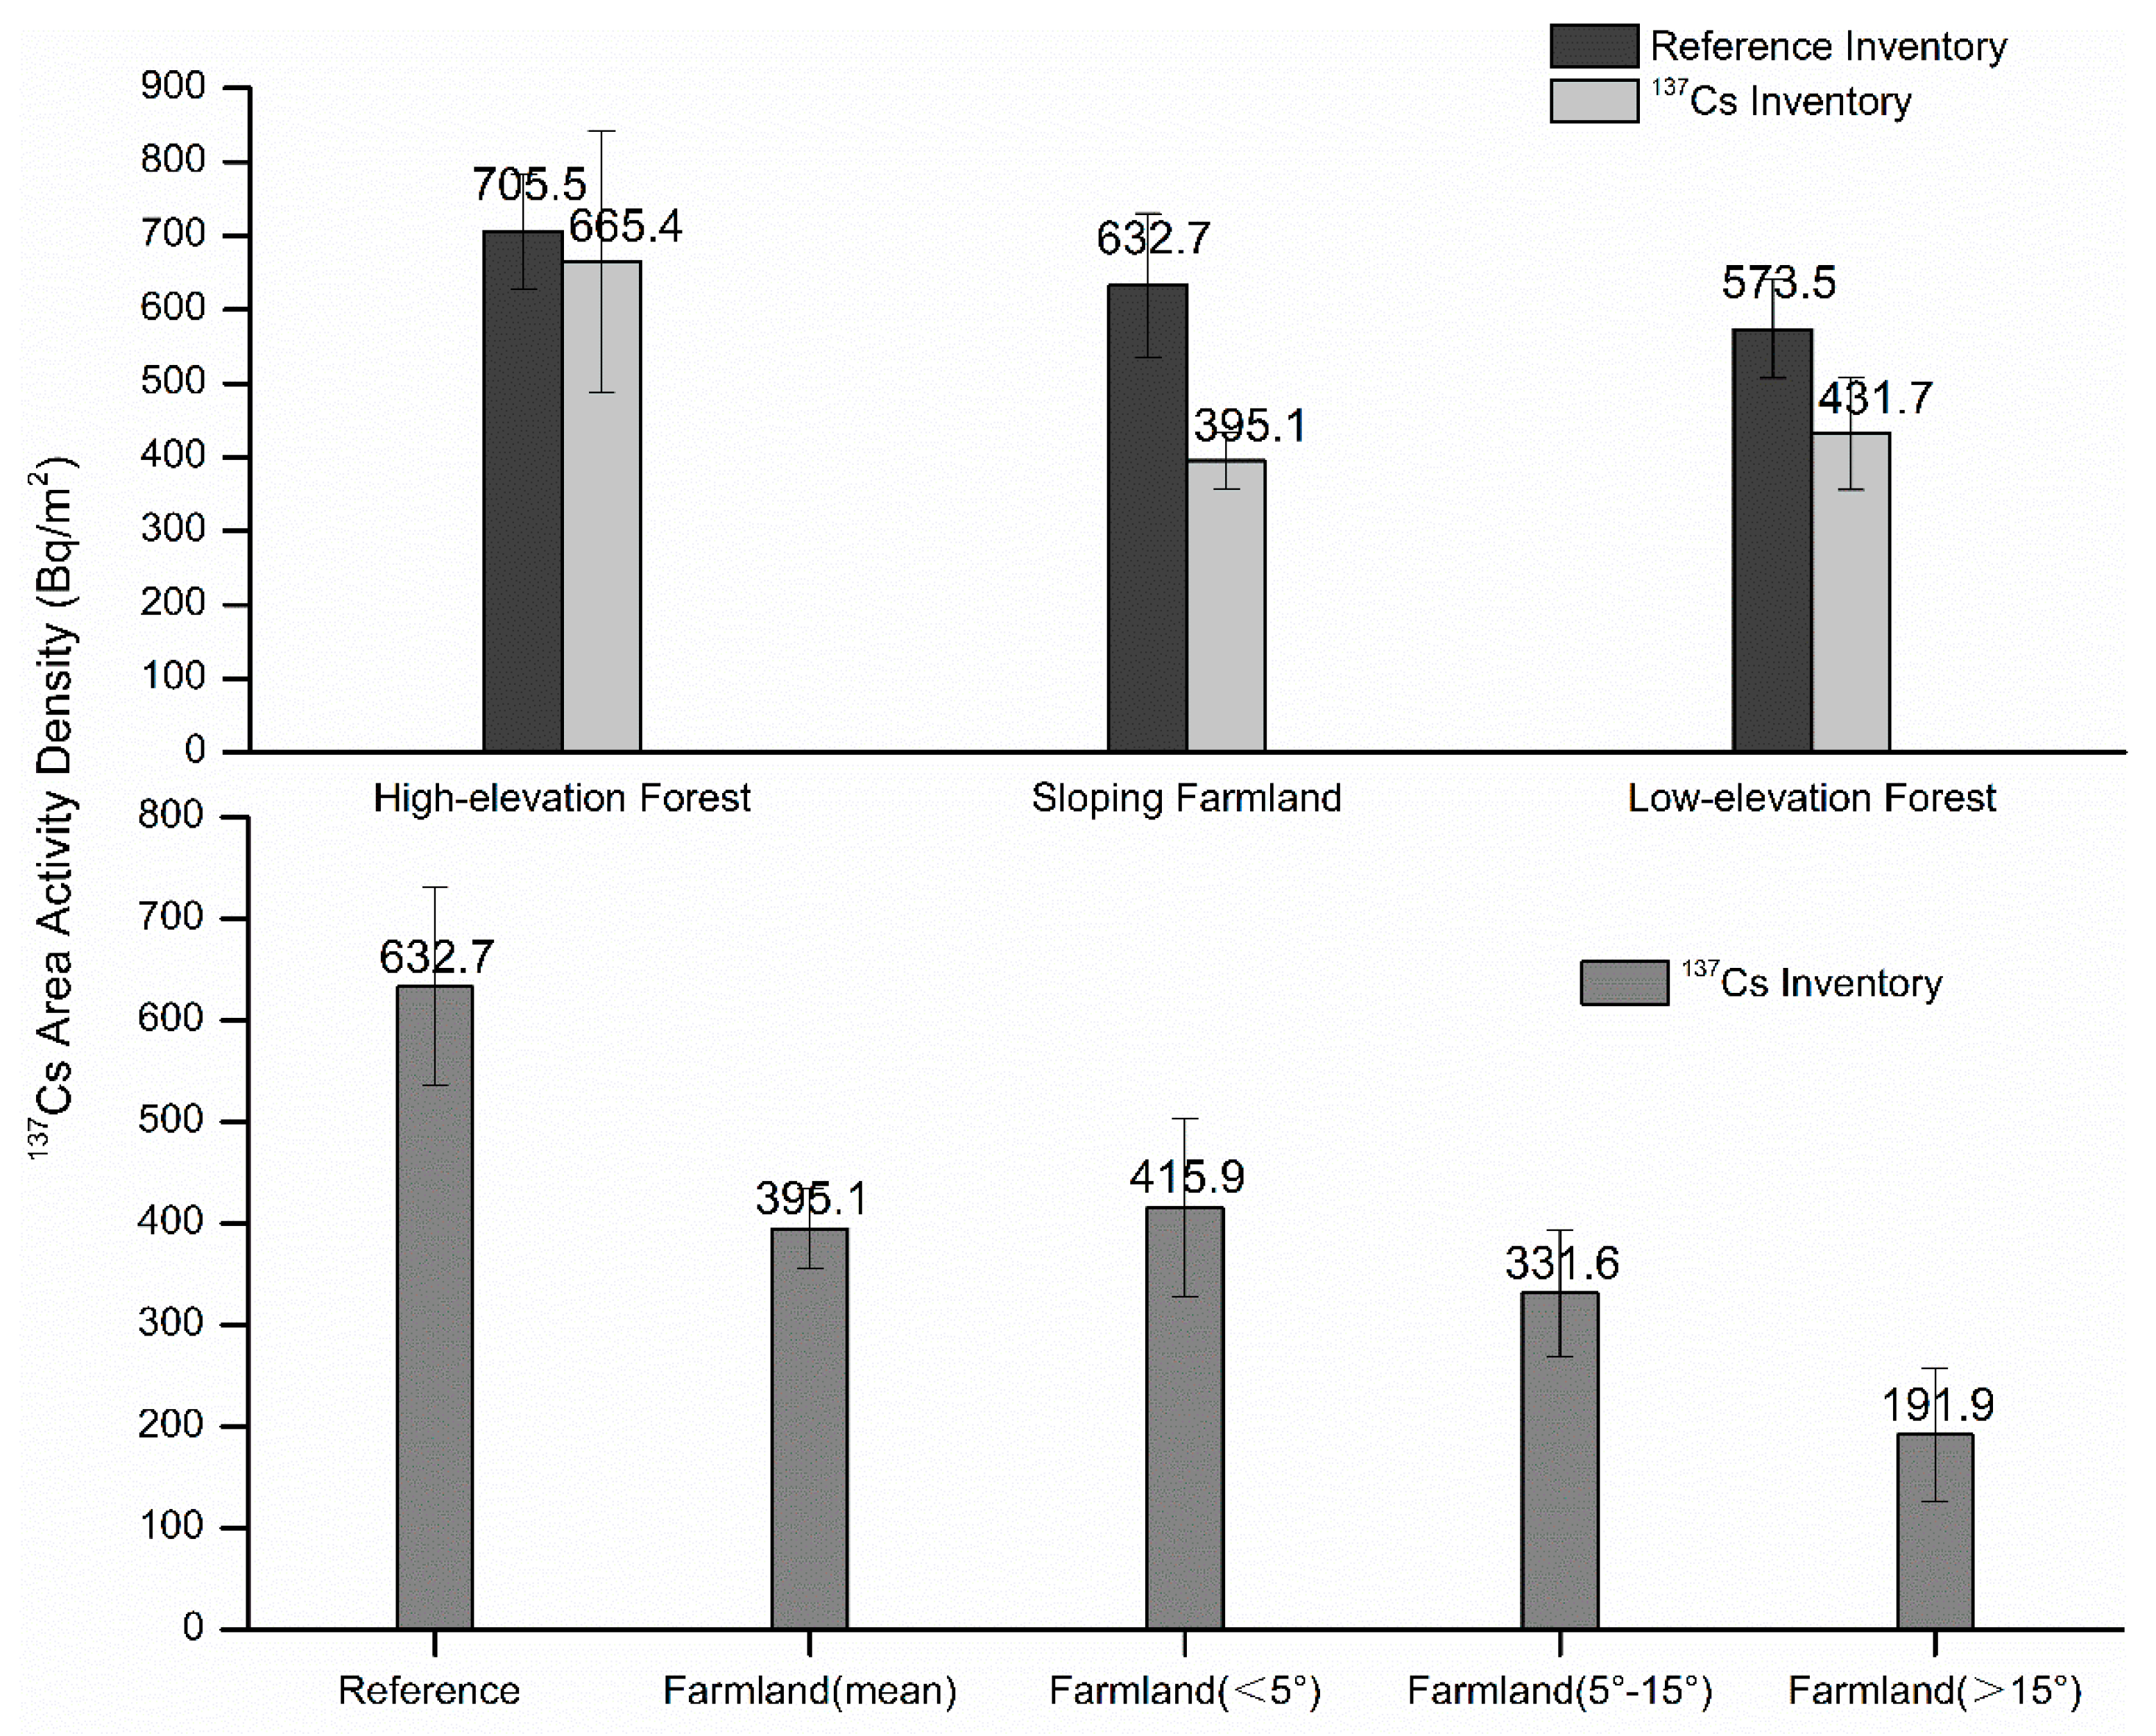
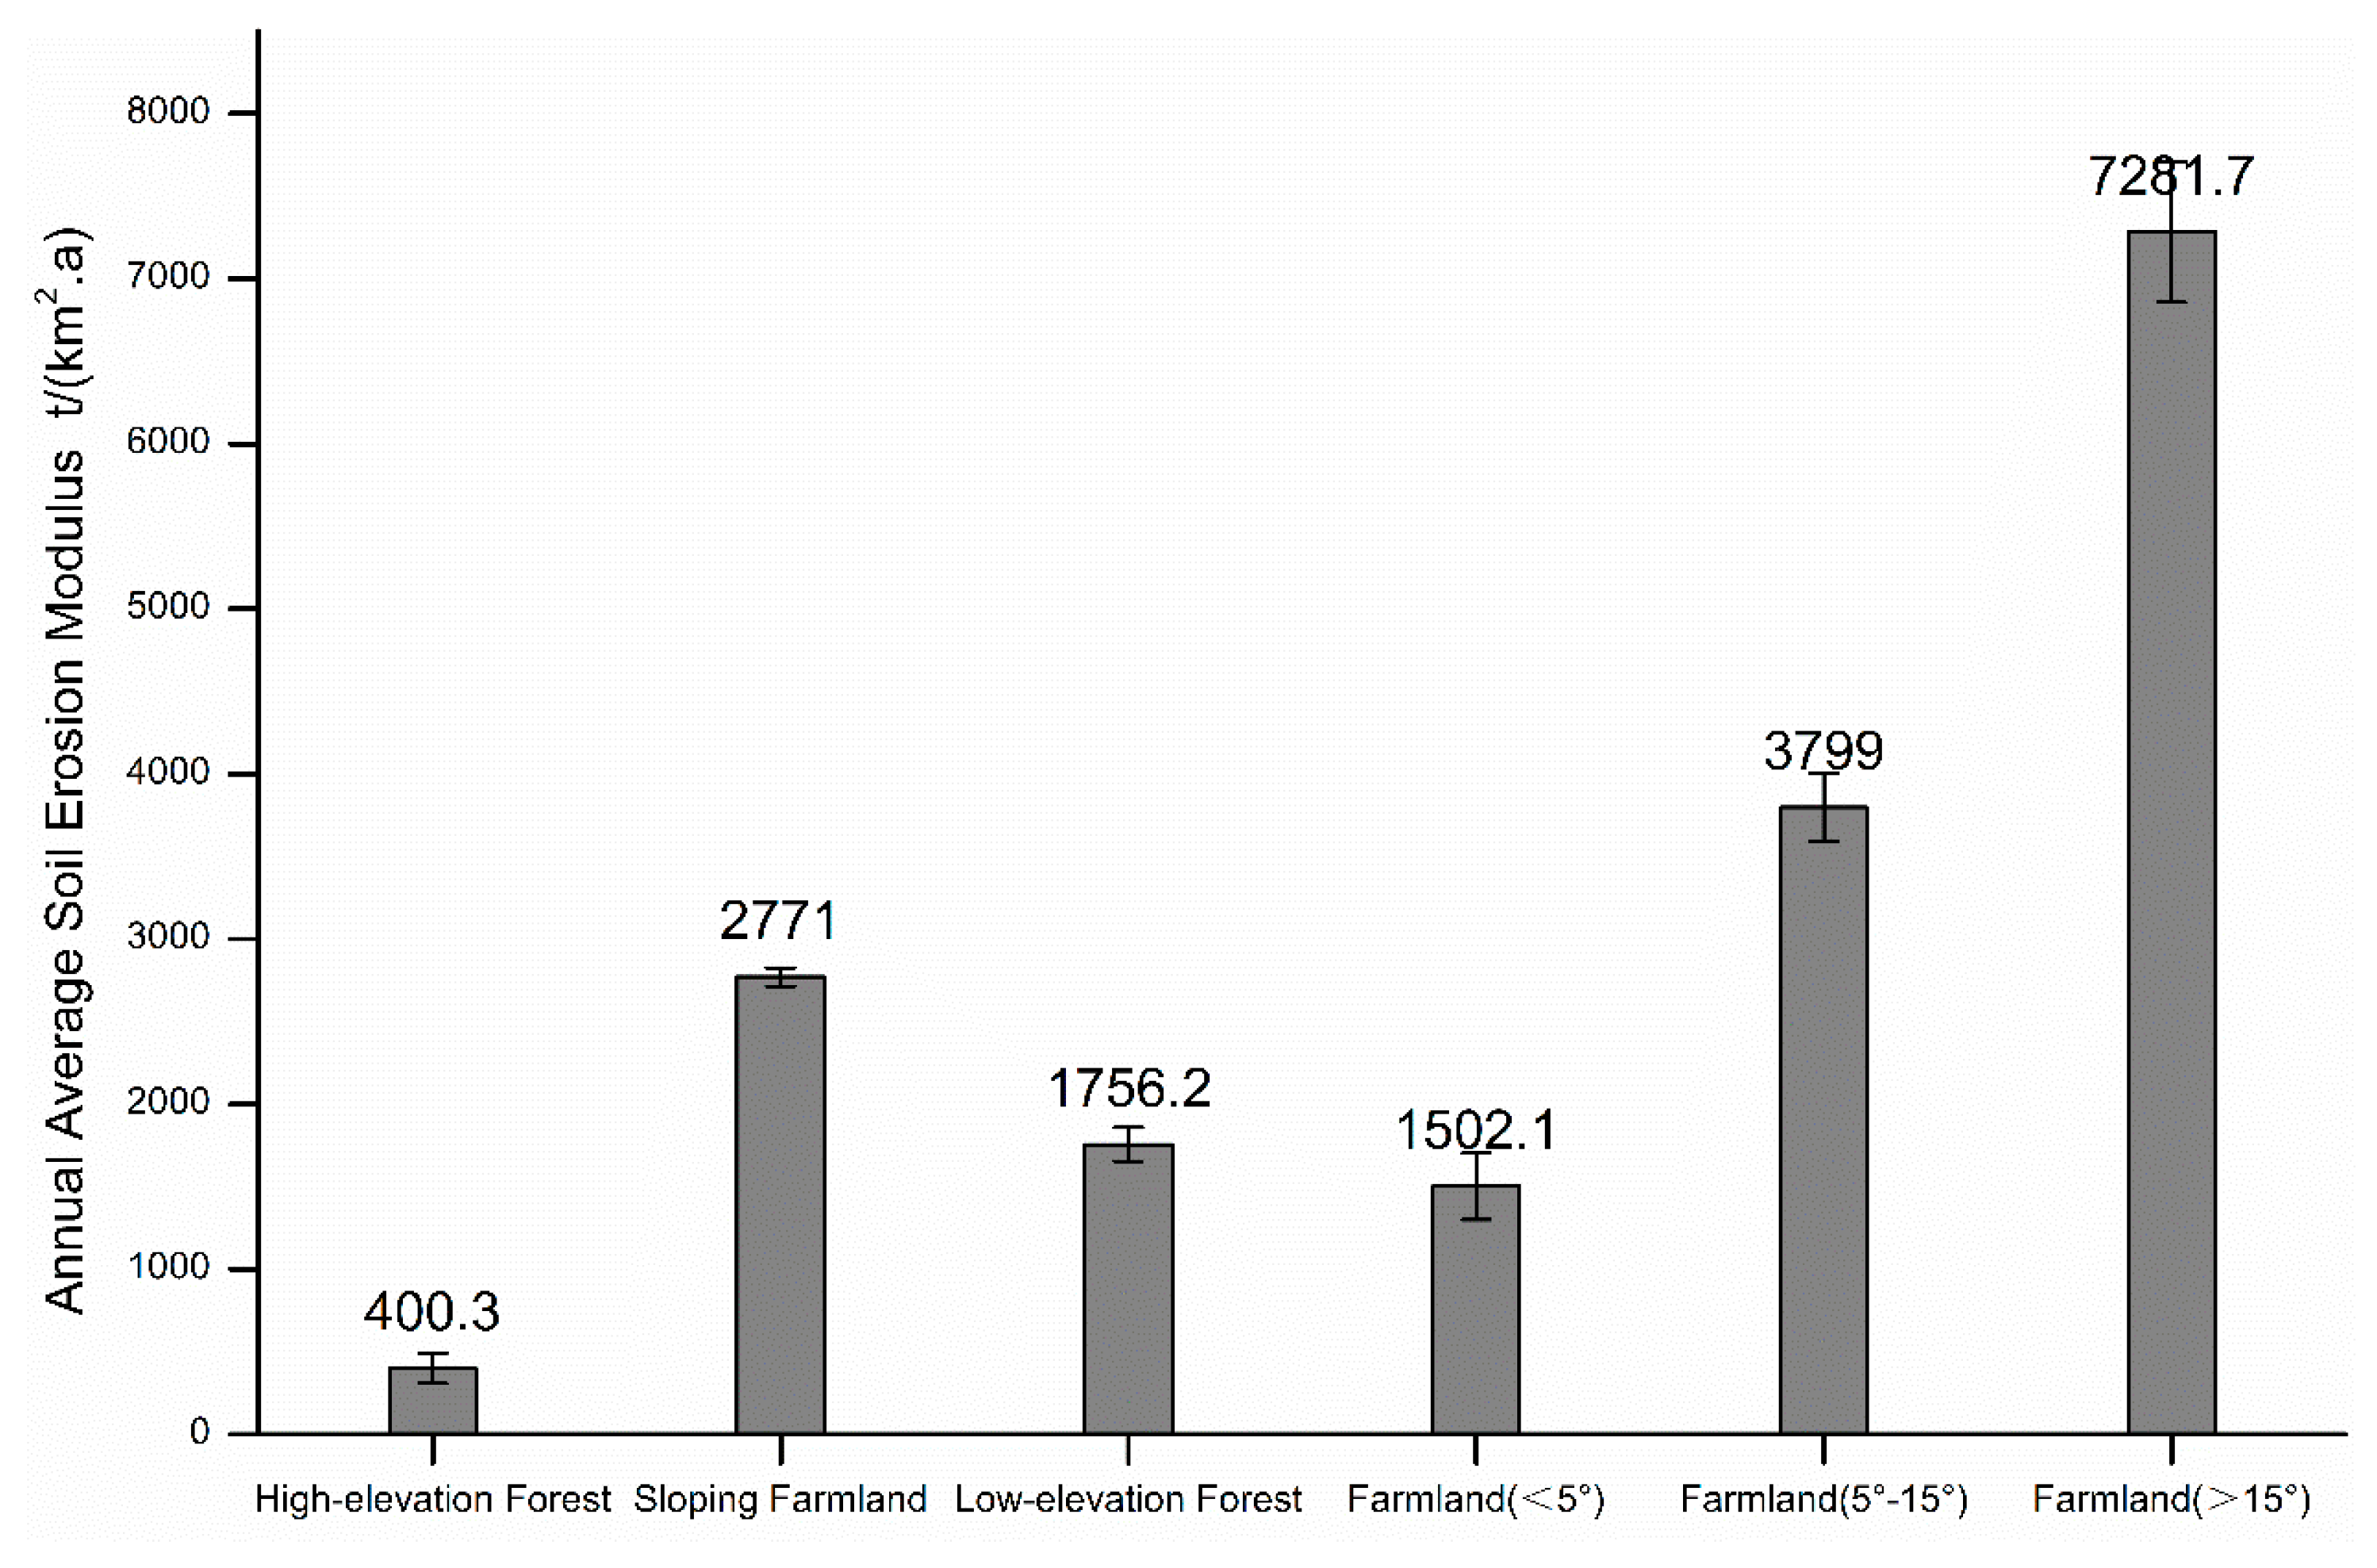
3.2. Variability of Soil Erosion Modulus in Different Vertical Zones

The average annual soil erosion modulus was calculated by comparing the 137Cs inventory values under different land use types and the 137Cs reference inventory in the corresponding vertical zones. The greater the difference between the 137Cs area activity density and the 137Cs reference inventory value, the more intense the soil erosion of the slope soil was (Figure 4). The average annual soil erosion modulus of a high-elevation forest (elevation > 2200 m) was 400.3 t/(km2·a), while that of a low-elevation sparse forest (elevation < 1600 m) was as high as 1756 t/(km2·a) with less annual rainfall. The average annual soil erosion modulus of a sloping farmland was 2771 t/(km2·a), which was mainly distributed between 1600 and 2200 m. Thus, the value of 632.7 Bq/m2 was used as the reference inventory in the calculation process. The steep slope farmland (slope > 15°) had an intense soil erosion, with an average annual soil erosion modulus as high as 7282 t/(km2.a) (Figure 5).
Many researchers have used different methods to study soil erosion in the Hengduan Mountains. For example, Wen [26] obtained an average soil erosion modulus of 1668 t/(km2·a) in the upper reaches of Longchuan River, based on the relationship between the sediment transport modulus and catchment area. In this study area, the Liangshan Town catchment, the average soil erosion intensity of a sloping farmland, was 2771 t/(km2·a) over the recent decades, which belonged to moderate erosion intensity; the average soil erosion intensity of a sparse forestland was 1756 t/(km2·a), which belonged to a mild erosion intensity, indicating that the soil erosion situation in this area was not serious.
The soil erosion modulus of an entire catchment can be calculated using the following formula [27]:
E w = ( i = 1 n S i · E i ) S t o t
where Ew is the erosion modulus for the entire catchment or area (t·km−2·a−1); n is the number of sampling units; Si is the surface area of the sampling units; Stot is the surface area of the entire catchment or area (km2); and Ei is the average erosion modulus of the representative fields of the sampling unit i (t·km−2·a−1). The average soil erosion modulus of the entire catchment was 1216.5 t/(km2·a), calculated using Equation (4), which was lower than the values obtained by other researchers in this region (Table 2).

4. Discussion

4.1. Factors Influencing the Local 137Cs Reference Inventory

The region’s representative reference inventory of fallout radionuclide 137Cs was the basis for using the 137Cs technique to estimate the average soil erosion or the deposition rate in recent decades [28]. The reference inventories of radionuclides were significantly different from each other at different longitudes and elevations in the world [29]. Because of the combined actions of different factors, the reference inventories of radionuclides in the same basin still showed a variability, mainly affected by the average annual precipitation, slope, and land use pattern within small catchments [30].
The variability of 137Cs reference inventories were presented as (1) the differences in 137Cs reference inventories between different latitudes and longitudes and between the southern and northern hemispheres, which showed a close relationship with the geographical locations where nuclear tests were conducted in the last century [31]; (2) a variability at different elevations of the same latitude and longitude, with the change in elevation also being the main factor inducing variation in annual precipitation. In areas where wet precipitation takes the leading role, the average annual precipitation was the key factor influencing the 137Cs reference inventories. Related research [32,33] demonstrated that the correlation coefficient of the variation in annual precipitation and the 137Cs reference inventories is 0.5; (3) there were significant differences in the reference inventories under different land use types [34]. Related studies indicated that grassland was the most suitable land cover type that reflected the real background value of the region. Normally, flat grassland was the optimum land cover type for sampling 137Cs reference inventories due to its small slope and runoff and slight disturbance level. In forestland, affected by canopy interception, 137Cs reference inventories near tree trunks were higher than that under the canopy, which results in a variation of 137Cs reference inventories within the forestland [35]. In addition, the main roots of woodland trees were mainly distributed in the surface soil and caused ab inconvenience for sample collection. Under these circumstances, the terraced fields that had been abandoned for decades or fields that have not been eroded were often considered as sampling sites for reference inventories.

4.2. Causes of Soil Erosion Within Vertical Zones and Soil Conservation Measures

The variability of soil erosion showed an obvious vertical zonality. The soil erosion intensity in low-elevation zones was obviously higher than that in high-elevation zones under the same land cover type. 137Cs is mainly absorbed by fine soil particles, especially clay mineral, after reaching the ground. Although the soils in high-elevation zones are dominated by Yellow-brown soils and those in low-elevation zones are dominated by purple soils, there is no significant difference in the clay content between the two soil types [21]. The main reason was that annual rainfall in high-elevation zones was 40% more than that in low-elevation zones, which led to sufficient soil moisture and high vegetation coverage in high-elevation zones. In addition, the temperature decrease with an increasing elevation and low annual evapotranspiration, which enabled the surface soil to maintain a certain amount of water under very low precipitations in winter, supported the normal growth of plants at high-elevation zones. A high vegetation cover and a complete forest ecosystem were the key factors reducing soil erosion. Because of the special monsoon climate and less rainfall, a high temperature and drought occurred in winter in the low-elevation zones, accompanied by large soil evapotranspiration. As a result, the surface vegetation coverage rate was low and the vegetation was mainly low drought-tolerant shrubs, with fewer herbs and a large area of bare soil. When the summer rainstorm was concentrated, surface erosion and rill erosion were serious.
A sloping farmland had the greatest soil erosion in the catchment. Soil erosion on sloping farmlands was the main source of sediments in the river. The average soil erosion intensity of a sloping farmland in the Liangshan Town catchment was 2771 t/(km2·a), which was less than the values obtained by other researchers in this region. This was mainly due to the gentle slope of the farmland, which was terraced mainly in the Liangshan Town catchment; the farmland that had been effectively maintained by local farmers; the export of rural labour forces in recent decades; and the effect of returning farmland to forest (pasture).
The results of the present study in Liangshan Town catchment showed that the sloping farmland in the mountainside zone and the sparse woodland in the low-elevation zone were the key zones of the soil and water imbalance in Hengduan Mountains, southwest China. Reducing steep the slope tillage, introducing more cash crops and fruit trees, and adjusting the agricultural structure were the effective approaches to reducing soil erosion in the region. In order to control soil erosion in the low-elevation sparse forest zone, the best measures were introducing drought-resistant forest trees and grasses and gully control, such as by planting drought-resistant pioneer plants mainly composed of Gladiolus and Leucaena leucocephala, which can improve the soil-vegetation system structure and change the microclimate. Finally, other economically beneficial trees could be introduced.
In general, steep-sloping farmland and low-elevation sparse forestland should be taken as key areas of soil and water imbalance and effectively harnessed according to local conditions for soil and water conservation in the Hengduan Mountains of southwest China. Although the two soil types of yellow-brown and purple soils have comparable clay contents as indicated above, other properties (e.g., organic matter content and pH) that have the potential to affect the adsorption of 137Cs in soils have not been measured in present work, which should be seen as a limitation of this study. Further works are needed to focus on these issues to strengthen the successful use of the 137Cs method in this area.

5. Conclusions

In this study, anthropogenic fallout radionuclide 137Cs was used to investigate the variability of soil erosion in Liangshan Town, a small agricultural catchment in Hengduan Mountains. Three 137Cs reference locations along the vertical zones from the summit to the valley were established according to differences in the elevation and rainfall. The results showed that the reference inventory of 137Cs increased from 573.51 Bq/m2 to 705.54 Bq/m2 with the elevation rising from 1600 m to 2600 m, indicating a significant variability. In order to accurately calculate the soil erosion modulus of different land-use types under different vertical zones, the 137Cs inventory values in each vertical zone were compared with the 137Cs reference inventory in the corresponding vertical zone. The results showed that a sloping farmland had the most intense soil erosion, making sloping farmland one of the important sources of sediments in the catchment. The average soil erosion intensity of a sloping farmland in this catchment was 2771 t/(km2·a), which belonged to the category of moderate erosion according to the classification of soil erosion intensity. The average annual soil erosion modulus was as high as 7282 t/(km2·a) when the slope of the cultivated land was greater than 15 degrees, which belong to an intense erosion category. The average annual soil erosion modulus of a low-elevation sparse forest zone (elevation < 1600 m) was 1756 t/(km2·a), which is significantly higher than that of the high-elevation forest zone (elevation > 2200 m) with a value of 400 t/(km2·a).

Author Contributions

J.C. was the main contributor to the experimental process and manuscript; Z.S. contributed to the original ideas and experimental design; A.W. and D.Y. contributed to the review of the manuscript; T.C. contributed to the soil sampling.

Funding

This research was funded by the National Basic Research Programme of China (2015CB452704).

Acknowledgments

The authors would like to thank the assistance of the Gully Erosion and Collapse Experimental Station in Yuanmou Dry-Hot Valley.

Conflicts of Interest

The authors declare no conflict of interest.

References

  1. Lal, R. Soil erosion and the global carbon budget. Environ. Int. 2003, 29, 437–450. [Google Scholar] [CrossRef] [Green Version]
  2. Pimentel, D. Soil Erosion: A Food and Environmental Threat. Environ. Dev. Sustain. 2006, 8, 119–137. [Google Scholar] [CrossRef]
  3. Walling, D.E.; He, Q.; Appleby, P.G. Conversion Models for Use in Soil-Erosion, Soil-Redistribution and Sedimentation Investigations. In Handbook for the Assessment of Soil Erosion and Sedimentation Using Environmental Radionuclides; Springer: Dordrecht, The Netherlands, 2002; pp. 111–164. [Google Scholar] [CrossRef]
  4. Collins, A.L.; Pulley, S.; Foster, I.D.; Gellis, A.; Porto, P.; Horowitz, A.J. Sediment source fingerprinting as an aid to catchment management: A review of the current state of knowledge and a methodological decision-tree for end-users. J. Environ. Manage. 2017, 194, 86–108. [Google Scholar] [CrossRef] [Green Version]
  5. Du, J.; Shi, C.; Zhou, Y. Sediment yield pattern and its controlling factors in the upper Yangtze River. J. Mt. Sci. 2010, 28, 660–667. [Google Scholar]
  6. Wen, A.B.; Zhang, X.B.; Wang, Y.K.; Wang, J.W.; He, Y.R.; Zhang, Y.Y.; Xu, J.Y.; Bai, L.X. Study on sedimentation source using cesium -137 technique in Yungui Plateau Region of upper Yangtze River. J. Soil Water Conserv. 2000, 14, 25–27. [Google Scholar] [CrossRef]
  7. Chai, Z.X.; Fan, J.R. Forecast of soil erosion change in the upper Yangtze River in the coming 50 years. J. Natural Disasters. 2001, 10, 15–19. [Google Scholar]
  8. Zhang, X.B. Status and causes of sediment change in the upper Yangtze River and sediment reduction measures-comparison of Jialing River with Jinsha River. Soil Water Conserv. China. 1999, 2, 22–24. [Google Scholar]
  9. Wen, A.B.; Zhang, X.B.; Li, H.; Walling, D.E.; Qi, Y.Q. Interpreting of variations of 137Cs, 210Pbex and fine particle contents in a deposit profile of the Jiulongdian Reservoir, Chuxiong, Yunnan, China. J. Sediment Res. 2008, 6, 17–23. [Google Scholar] [CrossRef]
  10. Du, J.; Shi, C.; Zhang, S.; Zhang, L. Impact of Human Activities on Recent Changes in Sediment Discharge of the Upper Yangtze River. Progress Geogr. 2010, 29, 15–22. [Google Scholar] [CrossRef]
  11. Shi, Z.; Deng, W.; Zhang, S. Spatio-temporal pattern changes of land space in Hengduan Mountains during 1990–2015. J. Geogr. Sci. 2018, 28, 529–542. [Google Scholar] [CrossRef]
  12. Collins, A.L.; Walling, D.E.; Sichingabula, H.M.; Leeks, G.J.L. Using 137Cs measurements to quantify soil erosion and redistribution rates for areas under different land use in the Upper Kaleya River basin, southern Zambia. Geoderma 2001, 104, 299–323. [Google Scholar] [CrossRef]
  13. Gaspar, L.; Navas, A.; Machín, J.; Walling, D.E. Using 210Pbex measurements to quantify soil redistribution along two complex toposequences in Mediterranean agroecosystems, northern Spain. Soil Tillage Res. 2013, 130, 81–90. [Google Scholar] [CrossRef]
  14. Robbins, J. Geochemical and geophysical applications of radioactive lead. In Biogeochemistry of Lead in the Environment; Nriagu, O., Ed.; Elsevier: Amsterdam, The Netherlands, 1978; pp. 285–393. [Google Scholar]
  15. Iurian, A.R.; Mabit, L.; Cosma, C. Uncertainty related to input parameters of 137Cs soil redistribution model for undisturbed fields. J. Environ. Radioact. 2014, 136, 112–120. [Google Scholar] [CrossRef] [PubMed]
  16. Bygaart, A.J.V.; Protz, R. Bomb-fallout 137Cs as a marker of geomorphic stability in dune sands and soils, Pinery Provincial Park, Ontario, Canada. Earth Surf. Process. Landforms 2010, 26, 689–700. [Google Scholar] [CrossRef]
  17. Estrany, J.; Garcia, C.; Walling, D.E. An investigation of soil erosion and redistribution in a Mediterranean lowland agricultural catchment using caesium-137. Int. J. Sediment Res. 2010, 25, 1–16. [Google Scholar] [CrossRef]
  18. Navas, A.; López-Vicente, M.; Gaspar, L.; Machín, J. Assessing soil redistribution in a complex karst catchment using fallout 137Cs and GIS. Geomorphology 2013, 196, 231–241. [Google Scholar] [CrossRef]
  19. IAEA (International Atomic Energy Agency). Guidelines for Using Fallout Radionuclides to Assess Erosion and Effectiveness of Soil Conservation Strategies; International Atomic Energy Agency: Vienna, Austria, 2014; pp. 1–224. [Google Scholar]
  20. Lizaga, I.; Gaspar, L.; Quijano, L.; Dercon, G.; Navas, A. NDVI, 137Cs and nutrients for tracking soil and vegetation development on glacial landforms in the Lake Parón Catchment (Cordillera Blanca, Peru). Sci. Total Environ. 2019, 651, 250–260. [Google Scholar] [CrossRef]
  21. Su, Z.; Xiong, D.; Zhang, J.; Zhou, T.; Yang, H.; Dong, Y.; Fang, H.; Shi, L. Variation in the vertical zonality of erodibility and critical shear stress of rill erosion in China’s Hengduan Mountains. Earth Surf. Process. Landforms 2019, 44, 88–97. [Google Scholar] [CrossRef]
  22. Zhang, X.B.; Higgitt, D.L.; Walling, D.E. A preliminary assessment of the potential for using cesium-137 to estiamte rates of soil erosion in the Loss Plateau of China. Hydrol. Sci. 1990, 35, 243–252. [Google Scholar]
  23. Qi, Y.Q.; Zhang, X.B.; He, X.; Wen, A.B.; Fu, J. 137Cs reference inventories distribution pattern in China. Nuclear Tech. 2006, 29, 42–50. [Google Scholar]
  24. Sutherland, R.A. Caesium-137 soil sampling and inventory variability in reference locations: A literature survey. Hydrol. Process. 1996, 10, 43–53. [Google Scholar] [CrossRef]
  25. Sutherland, R.A. Examination of caesium-137 areal activities in control (uneroded) locations. Soil Technol. 1991, 4, 33–50. [Google Scholar] [CrossRef]
  26. Wen, A.B.; Zhang, X.B.; Wang, Y.K.; Huo, T.R.; Wang, J.W. Study on sedimentation delivery ratio in upper Longchuan River of Yungui Plateau Region. J. Soil Water Conserv. 2003, 17, 139–141. [Google Scholar]
  27. Mabit, L.; Bernard, C.; Laverdiere, M.R. Assessment of erosion in the Boyer River watershed (Canada) using a GIS oriented sampling strategy and 137Cs measurements. Catena. 2007, 71, 242–249. [Google Scholar] [CrossRef]
  28. Owens, P.N. Spatial variability of caesium-137 inventories at reference sites: an example from two contrasting sites in England and Zimbabwe. Appl. Radiat. Isot. 1996, 47, 699–707. [Google Scholar] [CrossRef]
  29. Loughran, R.J.; Pennock, D.J.; Walling, D.E. Spatial distribution of caesium-137. In Handbook for the Assessment of Soil Erosion and Sedimentation Using Environmental Radionuclides; Zapata, F., Ed.; Springer: Dordrecht, The Netherlands, 2002; pp. 97–109. [Google Scholar]
  30. Mabit, L.; Meusburger, K.; Fulajtar, E.; Alewell, C. The usefulness of 137Cs as a tracer for soil erosion assessment: a critical reply to Parsons and Foster (2011). Earth-Sci. Rev. 2013, 127, 300–307. [Google Scholar] [CrossRef]
  31. Funk, R.; Li, Y.; Hoffmann, C.; Reiche, M.; Zhang, Z.; Li, J.; Sommer, M. Using 137Cs to estimate wind erosion and dust deposition on grassland in Inner Mongolia-selection of a reference site and description of the temporal variability. Plant Soil. 2012, 351, 293–307. [Google Scholar] [CrossRef]
  32. Chawla, F.; Steinmann, P.; Pfeifer, H.R.; Froidevaux, P. Atmospheric deposition and migration of artificial radionuclides in Alpine soils (Val Piora, Switzerland) compared to the distribution of selected major and trace elements. Sci. Total Environ. 2010, 408, 3292–3302. [Google Scholar] [CrossRef]
  33. Porto, P.; Walling, D.E.; Callegari, G. Using repeated 137Cs and 210Pbex measurements to establish sediment budgets for different time windows and explore the effect of connectivity on soil erosion rates in a small experimental catchment in Southern Italy. Land Degrad. Dev. 2018, 29, 1819–1832. [Google Scholar] [CrossRef]
  34. Mabit, L.; Benmansour, M.; Walling, D.E. Comparative advantages and limitations of the fallout radionuclides 137Cs, 210Pbex and 7Be for assessing soil erosion and sedimentation. J. Environ. Radioact. 2008, 99, 1799–1807. [Google Scholar] [CrossRef]
  35. Olley, J.; Burton, J.; Smolders, K.; Pantus, F.; Pietsch, T. The application of fallout radionuclides to determine the dominant erosion process in water supply catchments of subtropical south-east Queensland, Australia. Hydrol. Process. 2013, 27, 885–895. [Google Scholar] [CrossRef]
Figure 1. The geographical location of the study area.
Ijerph 16 01371 g001
Figure 2. The land use types in Liangshan Town catchment.
Ijerph 16 01371 g002
Figure 3. The depth distribution of 137Cs reference inventories (where 1600 m, 2200 m, and 2600 m represent the elevations of 137Cs reference locations).
Ijerph 16 01371 g003
Figure 4. The variability of the reference inventory and the area activity density of 137Cs under different land use types.
Ijerph 16 01371 g004
Figure 5. The soil erosion modulus under different land use types.
Ijerph 16 01371 g005
Table 1. The background of the 137Cs reference inventory sampling location at different vertical zones.
Elevation (m)Rainfall (mm)Soil TypeLand Use Actual Sample Size (n)CV (%)Minimum Number of Samples (n’)137Cs Reference Inventory (Bq/m2)
2600914.9Yellow-brownForest511.064.96705.54
2200783.8Purple soilTerrace1015.417.97632.68
1600652.2Purple soilTerrace611.655.51573.51
Table 2. The soil erosion modulus of the Liangshan Town catchment.
Land Use TypesHigh-Elevation ForestlandSloping FarmlandLow-Elevation ForestlandTotal
Surface area (km2)2.280.811.254.4
Average erosion modulus (t·km−2·a−1)400.327711756.21216.5
The surface area of the village was 0.06 km2, and the soil erosion of the village was neglected.

