Biological Composition of Respirable Particulate Matter in an Industrial Vicinity in South Africa

 ,
,
Abstract
:1. Introduction
2. Materials and Methods
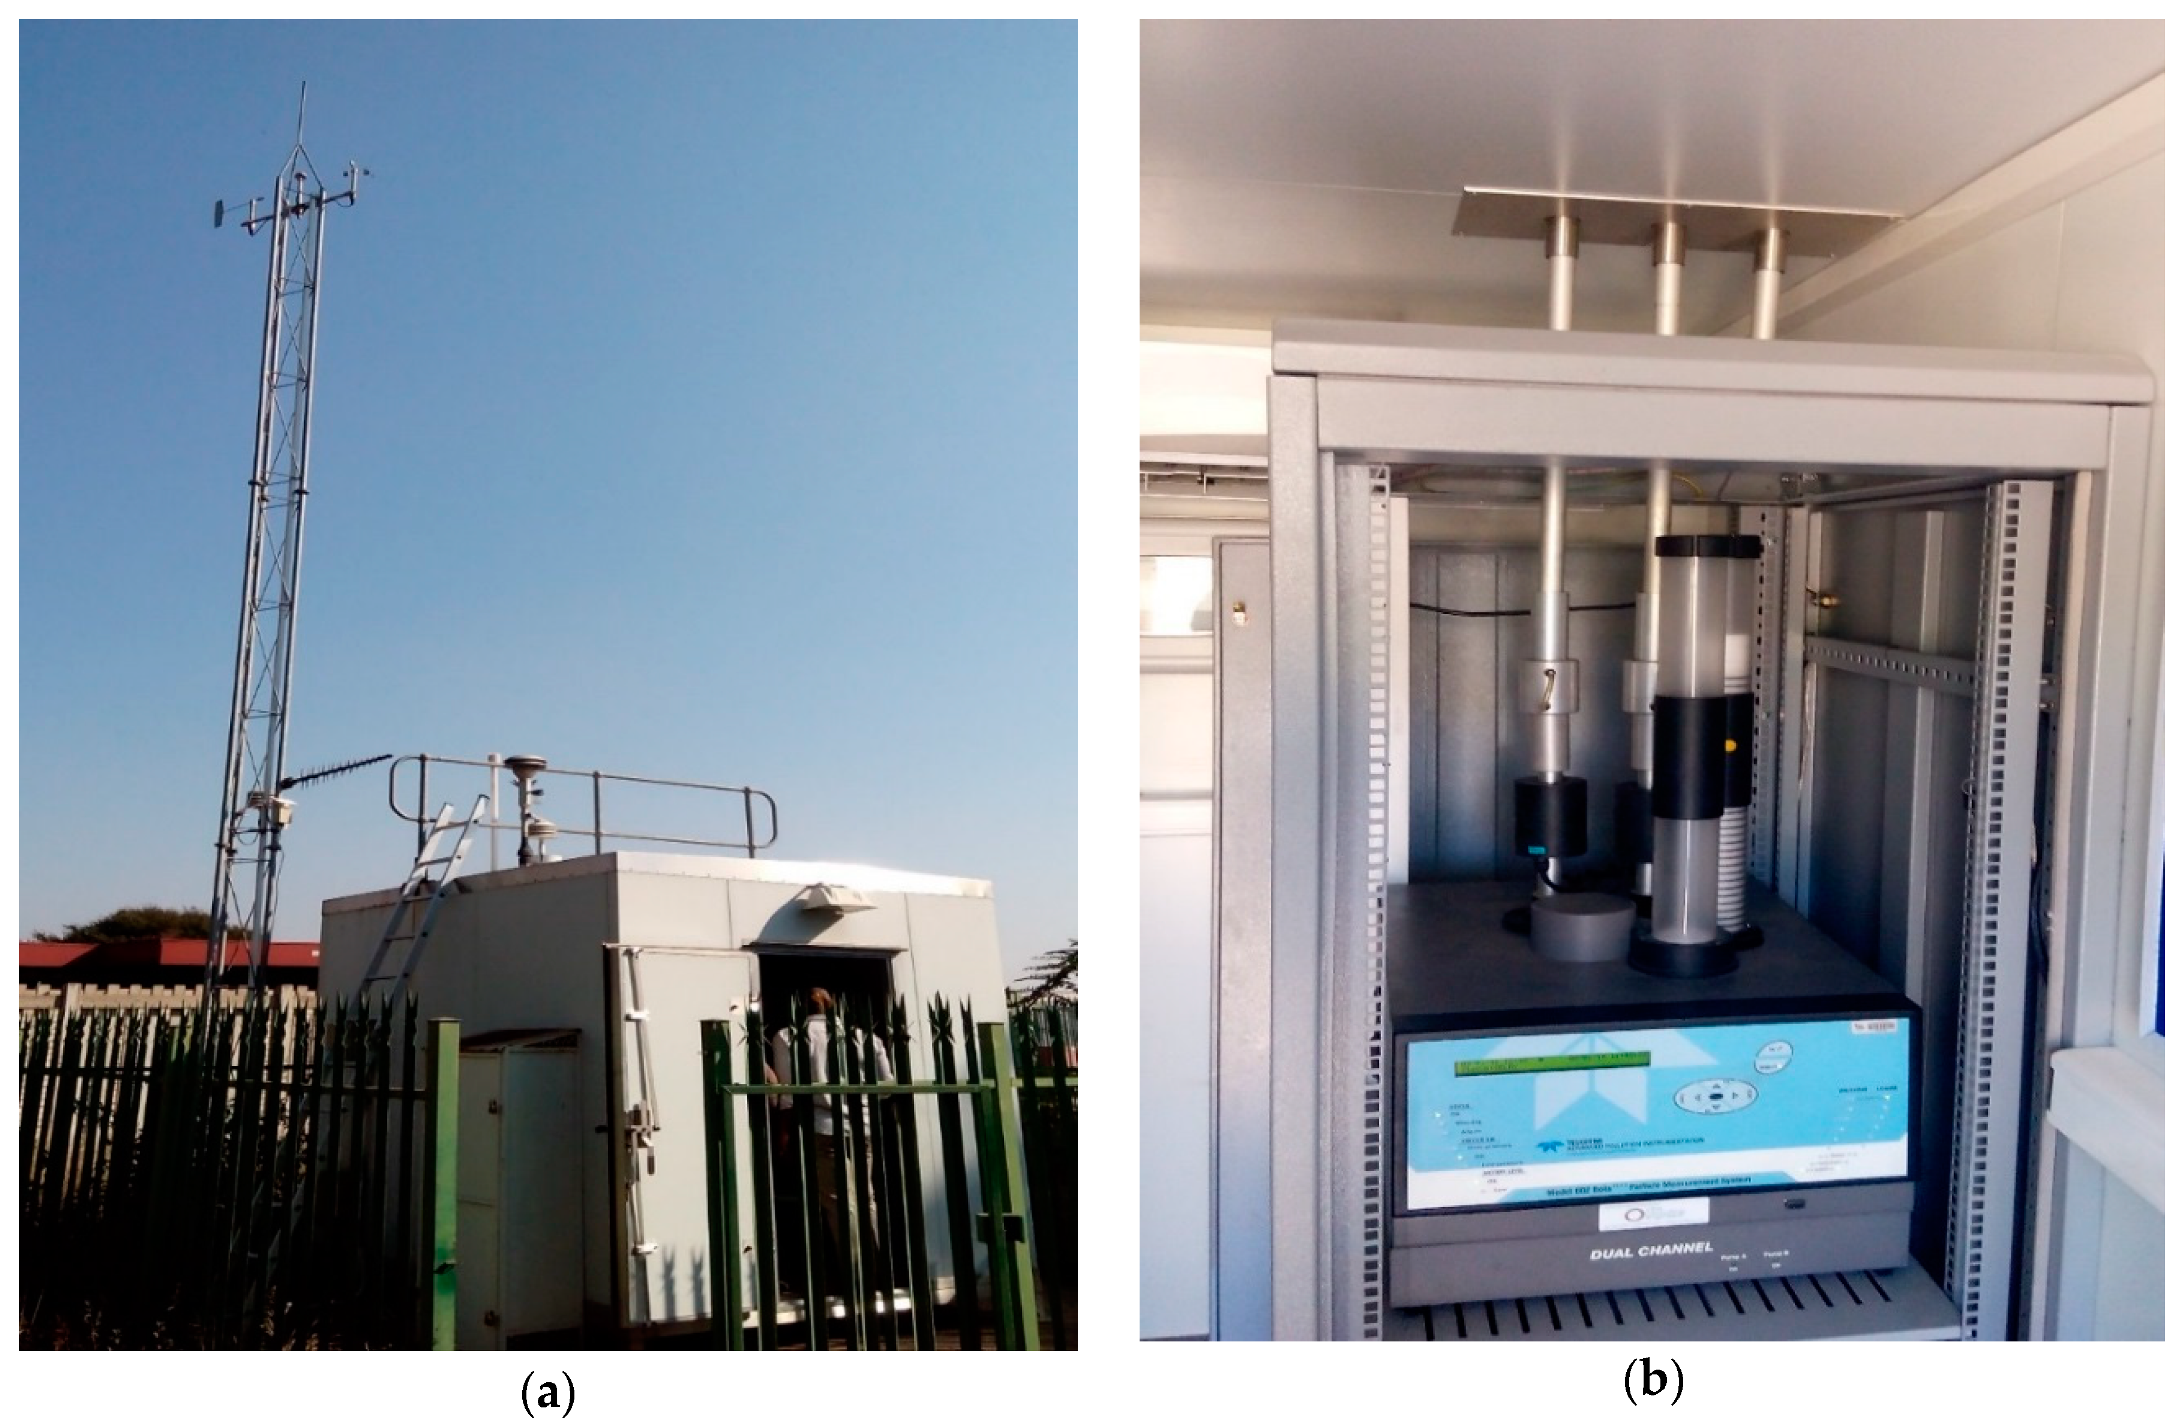
2.1. Description of Study Area
2.2. Sample Collection
2.3. Filter Analysis
2.4. Dose Rate Estimation
- C is the bacterial and fungal aerosol concentration (CFU/m3);
- InhR is the inhalation rate (m3/day);
- ET is the exposure time (h/day);
- BW is the body weight (kg).
2.5. Data Analysis
3. Results and Discussion
3.1. Frequency of Wind Speed and Direction
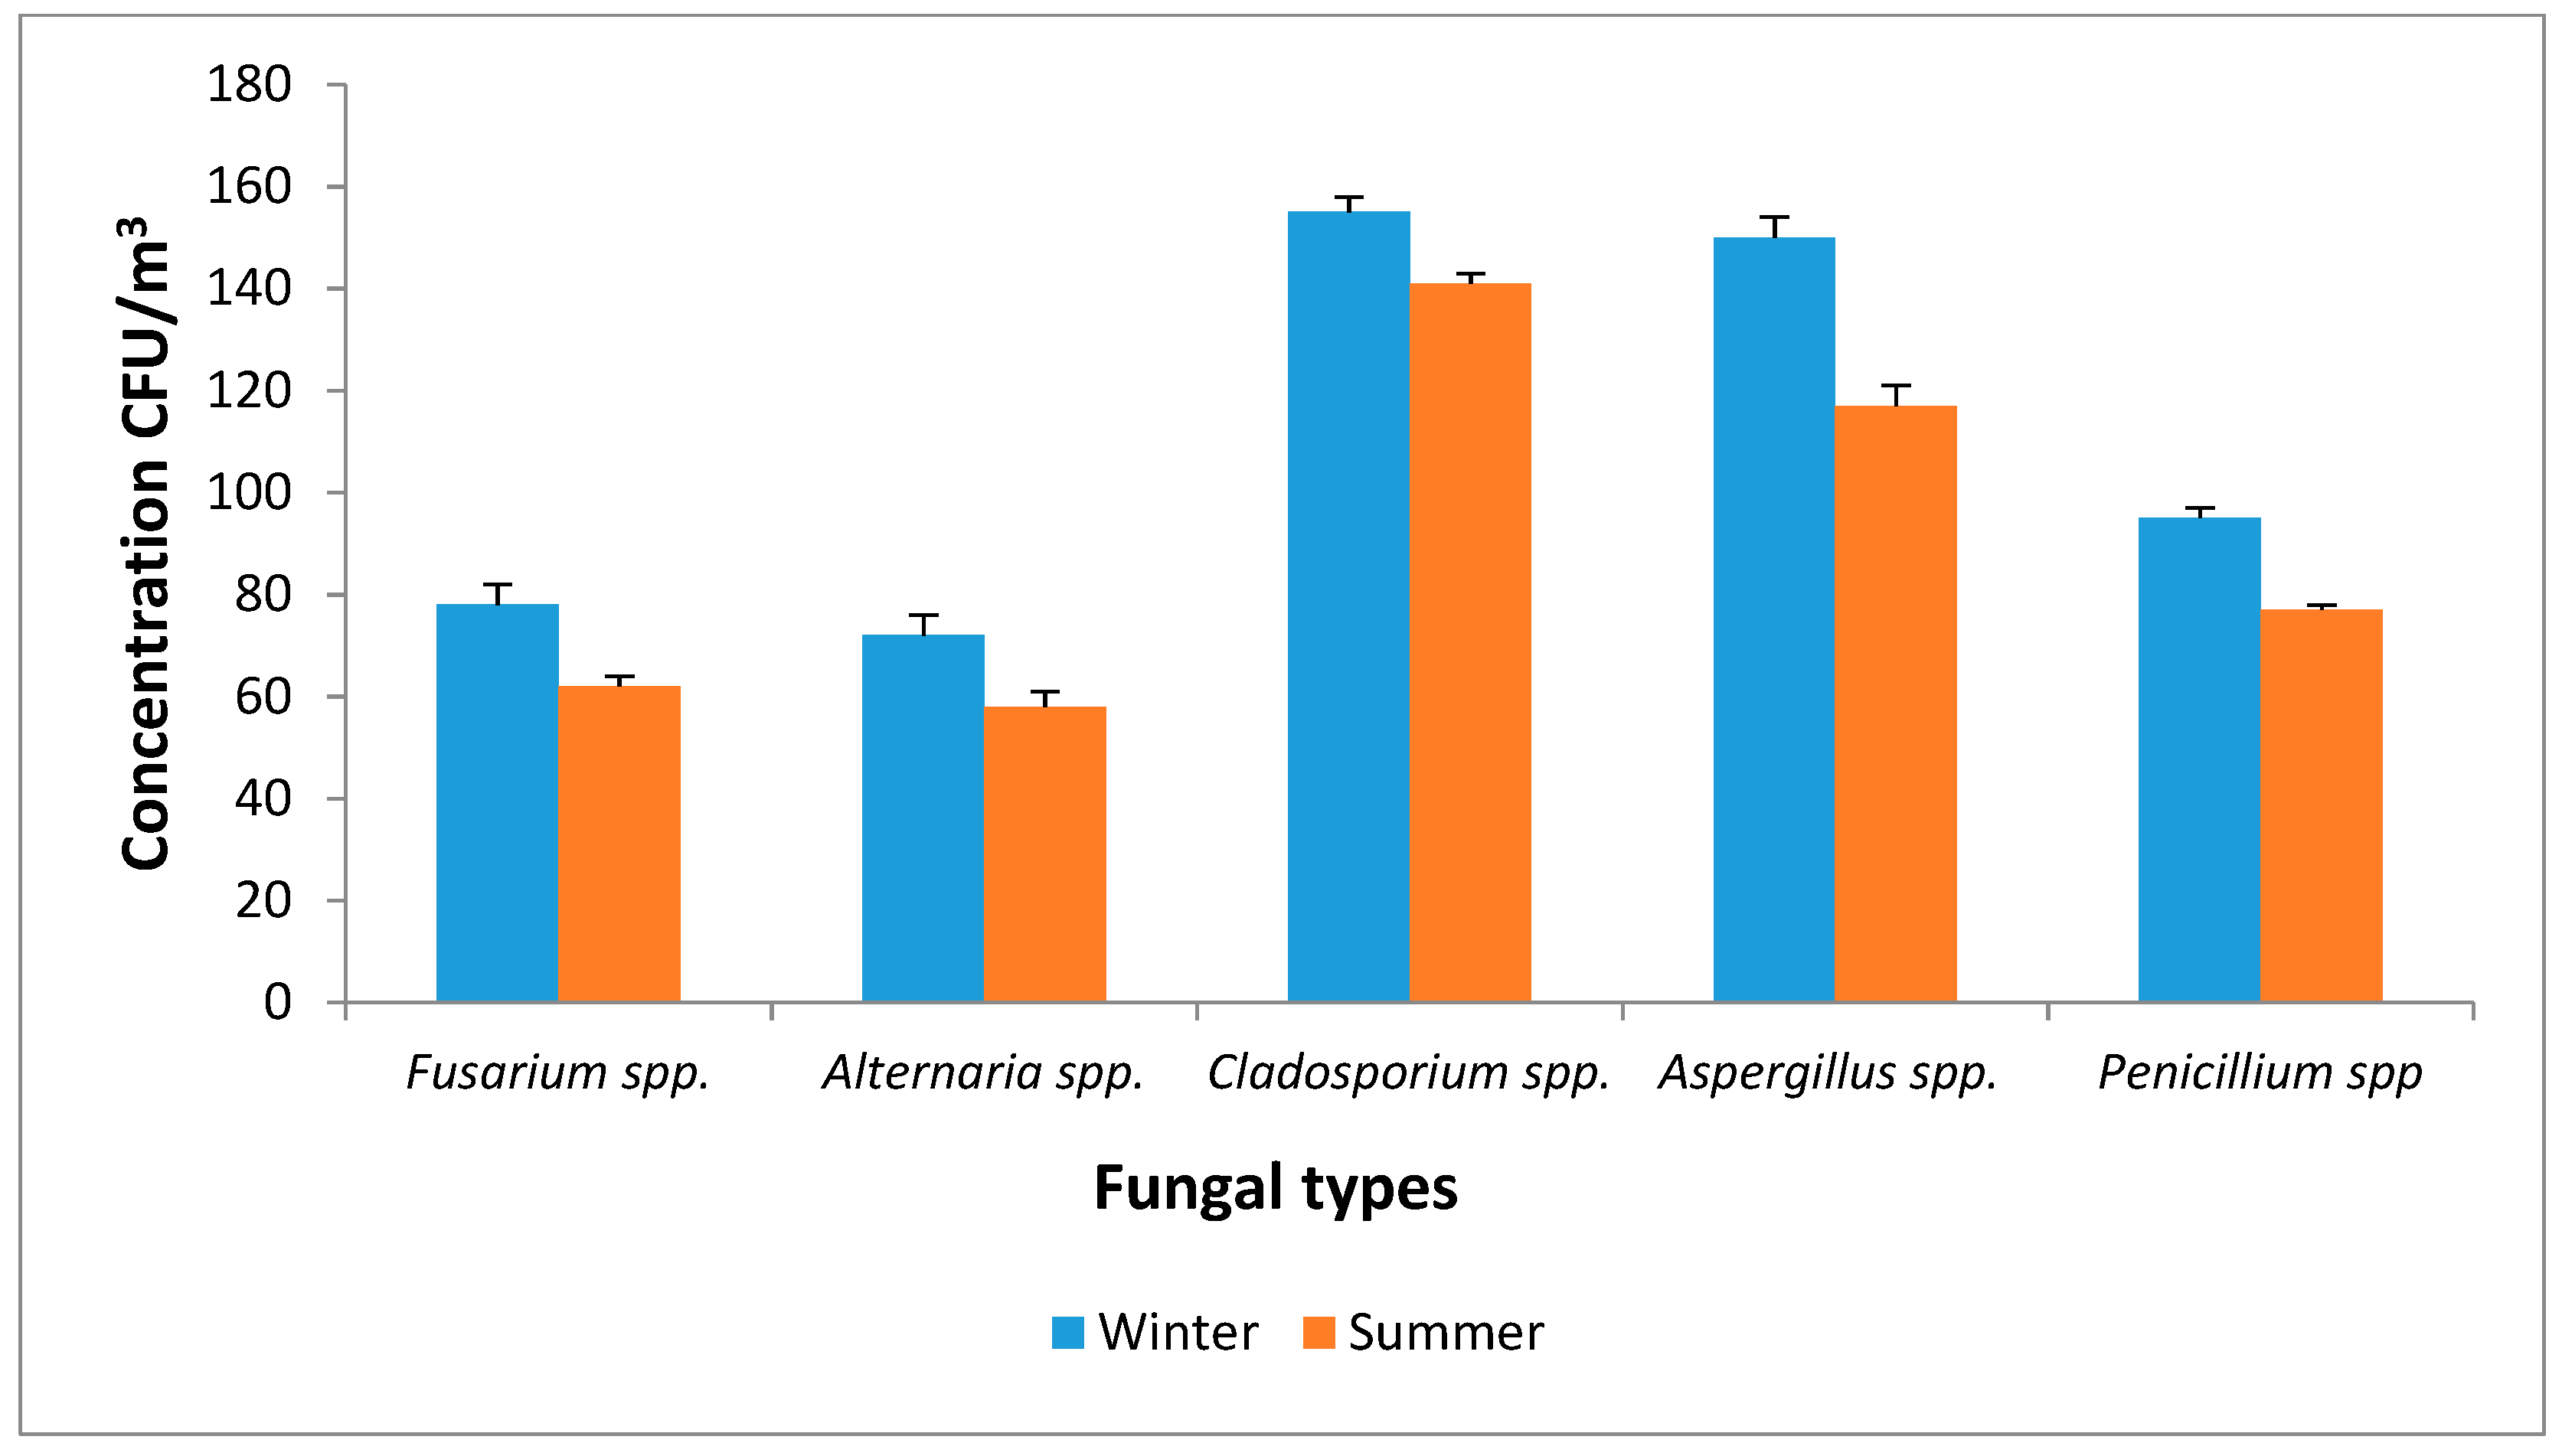
3.2. Bacterial and Fungal Concentrations Associated with PM2.5
3.3. Dose Rate Estimation
4. Conclusions
Author Contributions
Funding
Acknowledgments
Conflicts of Interest
References
- Brauer, M.; Amann, M.; Burnett, R.T.; Cohen, A.; Dentener, F.; Ezzati, M.; Henderson, S.B.; Krzyzanowski, M.; Martin, R.V.; Dingenen, R.V.; et al. Exposure assessment for estimation of the global burden of disease attributable to outdoor air pollution. Environ. Sci. Technol. 2012, 46, 652–660. [Google Scholar] [CrossRef] [PubMed]
- Rorich, R.P.; Galpin, J.S. Air quality in the Mpumalanga Highveld region, South Africa. S. Afr. J. Sci. 1998, 94, 109–114. [Google Scholar]
- OECD. OECD Environmental Performance Reviews: South Africa; OECD: Paris, France, 2013. [Google Scholar]
- Department of Environmental Affairs and Tourism (DEAT), South Africa. PM2.5 as an Emerging Priority Pollutant in South Africa–Impacts on Human Health; Paper prepared for Department of Environmental Affairs, Directorate: Information Management; DEAT: Pretoria, South Africa, 2010. [Google Scholar]
- Terblanche, P.; Nel, R.; Golding, T. Household Energy Sources in South Africa: An Overview of the Impact of Air Pollution on Human Health; CSIR Environmental Services, Department of Mineral and Energy Affairs and EMSA (Pty) Ltd.: Pretoria, South Africa, 1994. [Google Scholar]
- Wells, R.B.; Lloyd, S.M.; Turner, C.R. National air pollution source inventory. In Air Pollution and Its Impacts on the South African Highveld; Held, G., Gore, B.J., Surridge, A.D., Tosen, G.R., Turner, C.R., Walmsley, R.D., Eds.; Environmental Scientific Association: Johannesburg, South Africa, 1996; pp. 3–9. [Google Scholar]
- Blignaut, J.; Zunckel, M. The cost of a decline in air quality. In Sustainable Options, Economic Development Lessons from Applied Environmental Resource Economics in South Africa; Blignaut, J.N., de Wit, M.P., Eds.; Juta and Company Ltd.: Cape Town, South Africa, 2004. [Google Scholar]
- South Africa Department of Environmental Affairs and Tourism. National Ambient Air Quality Standard for Particulate Matter with Aerodynamic Diameter less than 2.5 Micron Metres (PM2.5). In Government Gazette; National Environmental Management: Nairobi, Kenyan, 29 June 2012; pp. 7–9. [Google Scholar]
- Kelly, F.J.; Fussell, J.C. Size, source and chemical composition as determinants of toxicity attributable to ambient particulate matter. Atmos. Environ. 2012, 60, 504–526. [Google Scholar] [CrossRef]
- Billet, S.; Garçon, G.; Dagher, Z.; Verdin, A.; Ledoux, F.; Cazier, F.; Courcot, D.; Aboukais, A.; Shirali, P. Ambient particulate matter (PM2.5): Physicochemical characterization and metabolic activation of the organic fraction in human lung epithelial cells (A549). Environ. Res. 2007, 105, 212–223. [Google Scholar] [CrossRef]
- Cao, C.; Jiang, W.; Wang, B.; Fang, J.; Lang, J.; Tian, G.; Jiang, J.; Zhu, T.F. Inhalable microorganisms in Beijing’s PM2.5 and PM10 pollutants during a severe smog event. Environ. Sci. Technol. 2014, 48, 1499–1507. [Google Scholar] [CrossRef] [PubMed]
- Hoek, G.; Krishnan, R.M.; Beelen, R.; Peters, A.; Ostro, B.; Brunekreef, B.; Kaufman, J.D. Long-term air pollution exposure and cardio-respiratory mortality: A review. Environ. Health. 2013, 12, 43–57. [Google Scholar] [CrossRef] [PubMed]
- Mehta, S.; Shin, H.; Burnett, R.; North, T.; Cohen, A.J. Ambient particulate air pollution and acute lower respiratory infections: A systematic review and implications for estimating the global burden of disease. Air Qual. Atmos. Health 2013, 6, 69–83. [Google Scholar] [CrossRef] [PubMed]
- Rohr, A.C.; Wyzga, R.E. Attributing health effects to individual particulate matter constituents. Atmos. Environ. 2012, 62, 130–152. [Google Scholar] [CrossRef]
- Benbrahim-Tallaa, L.; Baan, R.A.; Grosse, Y.; Lauby-Secretan, B.; El Ghissassi, F.; Bouvard, V.; Guha, N.; Loomis, D.; Straif, K. Carcinogenicity of diesel-engine and gasoline-engine exhausts and some nitroarenes. Lancet Oncol. 2012, 13, 663–664. [Google Scholar] [CrossRef] [Green Version]
- World Health Organization. A Global Brief on Hypertension; WHO: Geneva, Switzerland, 2013; Available online: http://apps.who.int/iris/bitstream/10665/79059/1/WHO_DCO_WHD_2013.2_eng.pd (accessed on 5 October 2015).
- Pui, D.Y.H.; Chen, S.; Zuo, Z. PM2.5 in China: Measurements, sources, visibility and health effects, and mitigation. Particuology 2014, 13, 1–26. [Google Scholar] [CrossRef]
- Morakinyo, O.M.; Mokgobu, M.I.; Mukhola, M.S.; Hunter, R.P. Health outcomes of exposure to Biological and Chemical components of inhalable and respirable particulate matter. Int. J. Environ. Res. Public Health 2016, 13, 592. [Google Scholar] [CrossRef] [PubMed]
- Heederick, D.; Thorne, P.S.; Douwes, J. Biological agents monitoring and evaluation of bioaerosol exposure. In International Modern Industrial Hygiene, Volume 2: Biological Aspects; Perkins, J.L., Ed.; American Conference of Governmental Industrial Hygienists, Inc.: Cincinnati, OH, USA, 2003; pp. 93–327. [Google Scholar]
- Hargreaves, M.; Parappukkaran, S.; Morawska, L.; Hitchins, J.; He, C.; Gilbert, D. A pilot investigation into associations between indoor airborne fungal and non-biological particle concentrations in residential houses in Brisbane, Australia. Sci. Total Environ. 2003, 312, 89–101. [Google Scholar] [CrossRef] [Green Version]
- Ariya, P.A.; Amyot, M. New directions: The role of bioaerosols in atmospheric chemistry and physics. Atmos. Environ. 2004, 38, 1231–1232. [Google Scholar] [CrossRef]
- Lighthart, B. The ecology of bacteria in the alfresco atmosphere. FEMS Microbiol. Ecol. 1997, 23, 263–274. [Google Scholar] [CrossRef]
- Glikson, M.; Rutherford, S.; Simpson, R.W.; Mitchell, C.A.; Yago, A. Microscopic and submicron components of atmospheric particulate matter during high asthma periods in Brisbane, Queensland, Australia. Atmos. Environ. 1995, 29, 549–562. [Google Scholar] [CrossRef]
- Pillai, S.D.; Ricke, S.C. Review/Synthèse Bioaerosols from municipal and animal wastes: Background and contemporary issues. Can. J. Microbiol. 2002, 48, 681–696. [Google Scholar] [CrossRef] [PubMed]
- Kharangate-Lad, A. Bacteria Adhered to Particulate Matter and Their Role in Plant Litter Mineralization. In Bioprospects of Coastal Eubacteria; Springer International Publishing: Cham, Switzerland, 2015. [Google Scholar]
- Zhai, Y.; Li, X.; Wang, T.; Wang, B.; Li, C.; Zen, G. A review on airborne microorganisms in particulate matters: Composition, characteristics and influence factors. Environ. Int. 2018, 113, 74–90. [Google Scholar] [CrossRef]
- Żukiewicz-Sobczak, W.A. The role of fungi in allergic diseases. Adv. Dermatol. Allergol. 2013, 30, 42–45. [Google Scholar] [CrossRef]
- Crameri, R.; Garbani, M.; Rhyner, C.; Huitema, C. Fungi: The neglected allergenic sources. J. Allergy Clin. Immunol. 2014, 69, 176–185. [Google Scholar] [CrossRef]
- Peccia, J.; Milton, D.; Reponen, T.; Hill, J.A. Role for environmental engineering and science in preventing bioaerosol-related disease. Environ. Sci. Technol. 2008, 42, 4631–4637. [Google Scholar] [CrossRef]
- Moorman, J.E.; Zahran, H.; Truman, B.I.; Molla, M.T. Current asthma prevalence—United States, 2006–2008. MMWR 2011, 60, 84–86. [Google Scholar]
- Camatini, M.; Corvaja, V.; Pezzolato, E.; Mantecca, P.; Gualtieri, M. PM10-biogenic fraction drives the seasonal variation of proinflammatory response in A549 cells. Environ. Toxicol. 2012, 27, 63–73. [Google Scholar] [CrossRef] [PubMed]
- Longhin, E.; Pezzolato, E.; Mantecca, P.; Holme, J.A.; Franzetti, A.; Camatini, M.; Gualtieri, M. Season linked responses to fine and quasi-ultrafine Milan PM in cultured cells. Toxicol. In Vitro 2013, 27, 551–559. [Google Scholar] [CrossRef] [PubMed]
- Thorne, P.S.; Kulhankova, K.; Yin, M.; Cohn, R.; Arbes, S.J., Jr.; Zeldin, D.C. Endotoxin exposure is a risk factor for asthma. Am. J. Respir. Crit. Care Med. 2005, 172, 1371–1377. [Google Scholar] [CrossRef] [PubMed]
- Abbing-Karahagopian, V.; van der Gugten, A.C.; van der Ent, C.K.; Uiterwaal, C.; de Jongh, M.; Oldenwening, M.; Brunekreef, B.; Gehring, U. Effect of endotoxin and allergens on neonatal lung function and infancy respiratory symptoms and eczema. Pediatr. Allergy Immunol. 2012, 23, 448–455. [Google Scholar] [CrossRef] [PubMed]
- Rabinovitch, N.; Liu, A.H.; Zhang, L.; Rodes, C.E.; Foarde, K.; Dutton, S.J.; Murphy, J.R.; Gelfand, E.W. Importance of the personal endotoxin cloud in school-age children with asthma. J. Allergy Clin. Immunol. 2005, 116, 1053–1057. [Google Scholar] [CrossRef]
- Liebers, V.; Raulf-Heimsoth, M.; Brüning, T. Health effects due to endotoxin inhalation (review). Arch. Toxicol. 2008, 82, 203–210. [Google Scholar] [CrossRef]
- Schwartz, D.A. Inhaled endotoxin, a risk for airway disease in some people. Respir. Physiol. 2001, 128, 47–55. [Google Scholar] [CrossRef]
- Loh, L.C.; Vyas, B.; Kanabar, V.; Kemeny, D.M.; O’Connor, B.J. Inhaled endotoxin in healthy human subjects: A dose-related study on systemic effects and peripheral CD4+ and CD8+ T cells. Respir. Med. 2006, 100, 519–528. [Google Scholar] [CrossRef] [Green Version]
- Schwartz, D.A.; Donham, K.J.; Olenchock, S.A.; Popendorf, W.J.; Van Fossen, D.S.; Burmeister, L.F.; Merchant, J.A. Determinants of longitudinal changes in spirometric function among swine confinement operators and farmers. Am. J. Respir. Crit. Care Med. 1995, 151, 47–53. [Google Scholar] [CrossRef]
- Thorn, J. The inflammatory response in humans after inhalation of bacterial endotoxin: A review. Inflamm. Res. 2001, 50, 254–261. [Google Scholar] [CrossRef] [PubMed]
- World Health Organization. Top 10 Causes of Death. The 10 Leading Causes of Death by Broad Income Group. Factsheet No. 310. Available online: http://www.who.int/mediacentre/factsheets/fs310/en/index.html (accessed on 8 April 2015).
- Freemaptools. Elevation Finder. Elevation of the City Hall in Pretoria, 4 July 2014. Available online: https://www.freemaptools.com/elevation-finder.htm (accessed on 8 April 2015).
- Morakinyo, O.M.; Adebowale, S.A.; Mokgobu, M.I.; Mukhola, M.S. Health risk of inhalation exposure to sub-10 µm particulate matter and gaseous pollutants in an urban-industrial area in South Africa: An ecological study. BMJ Open 2017, 7, e013941. [Google Scholar] [CrossRef] [PubMed]
- Morakinyo, O.M.; Mokgobu, M.I.; Mukhola, M.S.; Engelbrecht, J.C. Health Risk assessment of exposure to ambient concentrations of Benzene, Toluene, and Xylene in Pretoria West, South Africa. Afr. J. Sci. Technol. Inn. Dev. 2017, 9, 489–496. [Google Scholar] [CrossRef]
- CEN. Ambient Air Quality—Standard Gravimetric Measurement Method for the Determination of the PM2.5 Mass Fraction of Suspended Particulate Matter. European; Committee for Standardization (EH/2/3); BSI Group: London, UK, 2005; EN 14907. [Google Scholar]
- Alghamdi, M.A.; Shamy, M.; Redal, M.A.; Khoder, M.; Awad, A.H.; Elserougy, S. Microorganisms associated particulate matter: A preliminary study. Sci. Total Environ. 2014, 479–480, 109–116. [Google Scholar] [CrossRef] [PubMed]
- Mentese, S.; Rad, A.Y.; Arısoy, M.; Güllü, G. Seasonal and spatial variations of bioaerosols in indoor urban environments, Ankara, Turkey. Indoor Built Environ. 2012, 21, 797–810. [Google Scholar] [CrossRef]
- Jensen, P.A.; Mohr, A.J.; Schafer, M.P. Instrumentation used with microbial bioaerosol. In Atmospheric Microbial Aerosols: Theory and Applications; Lighthart, B., Mohr, A.J., Eds.; Springer: Boston, MA, USA, 1994; pp. 226–284. [Google Scholar]
- Bragoszewska, E.; Mainka, A.; Pastuszka, J.S. Bacterial aerosols in an urban nursery school in Gliwice, Poland: A case study. Aerobiologica 2016, 32, 469–480. [Google Scholar] [CrossRef]
- Andersen, A.A. New sampler for the collection, sizing, and enumeration of viable airborne particles. J. Bacteriol. 1958, 76, 471–484. [Google Scholar] [PubMed]
- Madureira, J.; Paciência, I.; Rufo, J.C.; Pereira, C.; Teixeira, J.P.; De Oliveira Fernandes, E. Assessment and determinants of airborne bacterial and fungal concentrations in different indoor environments: Homes, child day-care centres, primary schools and elderly care centres. Atmos. Environ. 2015, 109, 139–146. [Google Scholar] [CrossRef]
- PN-EN 12322. In Vitro Diagnostic Medical Devices. Culture Media for Microbiology. Performance Criteria for Culture Media; PKN Polish Committee for Standardization (PKN): Warsaw, Poland, 2005. [Google Scholar]
- Menetrez, M.Y.; Foarde, K.K.; Esch, R.K.; Schwartz, T.D.; Dean, T.R.; Hays, M.D.; Cho, S.H.; Betancourt, D.A.; Moore, S.A. An evaluation of indoor and outdoor biological particulate matter. Atmos. Environ. 2009, 43, 5476–5483. [Google Scholar] [CrossRef]
- Brągoszewska, E.; Biedroń, I.; Kozielska, B.; Pastuszka, J.S. Microbiological indoor air quality in an office building in Gliwice, Poland: Analysis of the case study. Air Qual. Atmos. Health 2018, 11, 729–740. [Google Scholar] [CrossRef]
- Brągoszewska, E.; Mainka, A.; Pastuszka, J.; Lizończyk, K.; Desta, Y. Assessment of Bacterial Aerosol in a Preschool, Primary School and High School in Poland. Atmosphere 2018, 9, 87. [Google Scholar] [CrossRef]
- United States Environmental Protection Agency. Child-Specific Exposure Factors Handbook; EPA, Environmental Protection Agency: Washington, DC, USA, 2002.
- United States Environmental Protection Agency. Exposure Factors Handbook; EPA, Environmental Protection Agency: Washington, DC, USA, 2011.
- Johnson-Restrepo, B.; Kannan, K. An assessment of sources and pathways of human exposure to polybrominated diphenyl ethers in the United States. Chemosphere 2009, 76, 542–548. [Google Scholar] [CrossRef]
- Matooane, M.; Diab, R. Health risk assessment for sulfur dioxide pollution in South Durban, South Africa. Arch. Environ. Health Int. J. 2003, 58, 763–770. [Google Scholar] [CrossRef] [PubMed]
- United States Environmental Protection Agency (US EPA); National Center for Environmental Assessment, Office of Research and Development; U.S. Environmental Protection Agency. Exposure Factors Handbook. Available online: http://www.epa.gov/ncea/expofac.htm. (accessed on 20 June 2015).
- Mouzourides, P.; Kumar, P.; Neophytou, M.K.A. Assessment of long-term measurements of particulate matter and gaseous pollutants in South-East Mediterranean. Atmos. Environ. 2015, 107, 148–165. [Google Scholar] [CrossRef] [Green Version]
- Fröhlich-Nowoisky, J.; Burrows, S.M.; Xie, Z.; Engling, G.; Solomon, P.A.; Fraser, M.P.; Mayol-Bracero, O.L.; Artaxo, P.; Begerow, D.; Conrad, R.; et al. Biogeography in the air: Fungal diversity over land and oceans. Biogeosci. Discuss. 2011, 8, 7071–7096. [Google Scholar] [CrossRef]
- Handley, B.A.; Webster, A.J.F. Some factors affecting the airborne survival of bacteria outdoors. J. Appl. Bacteriol. 1995, 79, 368. [Google Scholar] [CrossRef] [PubMed]
- Fang, Z.; Ouyang, Z.Y.; Zheng, H.; Wang, X.; Hu, L. Culturable airborne bacteria in outdoor environments in Beijing, China. Microb. Ecol. 2007, 54, 487–496. [Google Scholar] [CrossRef]
- Aydogdu, H.; Asan, A.; Otkum, M.T. Indoor and outdoor airborne bacteria in child day-care centers in Edirne City (Turkey), seasonal distribution and influence of meteorological factors. Environ. Monit. Assess. 2010, 164, 53. [Google Scholar] [CrossRef] [PubMed]
- Menteşe, S.; Arisoy, M.; Rad, A.Y.; Güllü, G. Bacteria and fungi levels in various indoor and outdoor environments in Ankara, Turkey. Clean Soil Air Water 2009, 37, 487–493. [Google Scholar] [CrossRef]
- Ren, P.; Jankun, T.M.; Leaderer, B.P. Comparisons of seasonal fungal prevalence in indoor and outdoor air and in house dusts of dwellings in one Northeast American county. J. Expo. Sci. Environ. Epidemiol. 1999, 9, 560–568. [Google Scholar] [CrossRef]
- Pyrri, I.; Kapsanaki-Gotsi, E. Diversity and annual fluctuations of culturable airborne fungi in Athens, Greece: A 4-year study. Aerobiologia 2012, 28, 249–262. [Google Scholar] [CrossRef]
- Salonen, H.; Duchaine, C.; Mazaheri, M.; Clifford, S.; Morawska, L. Airborne culturable fungi in naturally ventilated primary school environments in a subtropical climate. Atmos. Environ. 2015, 106, 412–418. [Google Scholar] [CrossRef] [Green Version]
- AbdeLHameed, A.A.; Khoder, M.I.; Ibrahim, Y.H.; Saeed, Y.; Osman, M.E.; Ghanem, S. Study on some factors affecting survivability of airborne fungi. Sci. Total Environ. 2012, 414, 696–700. [Google Scholar] [CrossRef] [PubMed]
- Kuhn, D.M.; Ghannoum, M.A. Indoor mold, toxigenic fungi, and Stachybotrys chartarum: Infectious disease perspective. Clin. Microbiol. Rev. 2003, 16, 144–172. [Google Scholar] [CrossRef] [PubMed]
- Knutsen, A.P.; Bush, R.K.; Demain, J.G.; Denning, D.W.; Dixit, A.; Fairs, A.; Greenberger, P.A.; Kariuki, B.; Kita, H.; Kurup, V.P.; et al. Fungi and allergic lower respiratory tract diseases. J. Allergy Clin. Immunol. 2012, 129, 280–291. [Google Scholar] [CrossRef] [PubMed]
- Ege, M.J.; Mayer, M.; Normand, A.C.; Genuneit, J.; Cookson, W.O.; Braun-Fahrländer, C.; Heederik, D.; Piarroux, R.; Von Mutius, E. Exposure to environmental microorganisms and childhood asthma. N. Engl. J. Med. 2011, 364, 701–709. [Google Scholar] [CrossRef]
- Raisi, L.; Aleksandropoulou, V.; Lazaridis, M.; Katsivela, E. Size distribution of viable, cultivable, airborne microbes and their relationship to particulate matter concentrations and meteorological conditions in a Mediterranean site. Aerobiologia 2013, 29, 233–248. [Google Scholar] [CrossRef]
- Zhong, X.; Qi, J.; Li, H.; Dong, L.; Gao, D. Seasonal distribution of microbial activity in bioaerosols in the outdoor environment of the Qingdao coastal region. Atmos. Environ. 2016, 140, 506–513. [Google Scholar] [CrossRef]
- Lee, B.U.K.; Lee, G.; Heo, K.J. Concentration of culturable bioaerosols during winter. J. Aerosol Sci. 2016, 94, 1–8. [Google Scholar] [CrossRef]
- Li, Y.; Lu, R.; Li, W.; Xie, X.; Song, Y. Concentrations and size distributions of viable bioaerosols under various weather conditions in a typical semi-arid city of Northwest China. J. Aerosol Sci. 2017, 106, 83–92. [Google Scholar] [CrossRef]
- Gao, M.; Qiu, T.; Jia, R.; Han, M.; Song, Y.; Wang, X. Concentration and size distribution of viable bioaerosols during non-haze and haze days in Beijing. Environ. Sci. Pollut. Res. 2015, 22, 4359–4368. [Google Scholar] [CrossRef] [PubMed]
- Ulevicius, V.; Peciulyte, D.; Mordas, G.; Lugauskas, A. Field study on changes in viability of airborne fungal propagules exposed to solar radiation. J. Aerosol Sci. 2000, 31, 961–962. [Google Scholar] [CrossRef]
- Hwang, G.B.; Jung, J.H.; Jeong, T.G.; Lee, B.U. Effect of hybrid UV-thermal energy stimuli on inactivation of S. epidermidis and B. subtilis bacterial bioaerosols. Sci. Total Environ. 2010, 408, 5903–5909. [Google Scholar] [CrossRef] [PubMed]
- Bragoszewska, E.; Mainka, A.; Pastuszka, J.S. Bacterial and Fungal Aerosols in Rural Nursery Schools in Southern Poland. Atmosphere 2016, 7, 142. [Google Scholar] [CrossRef]
- Mainka, A.; Zajusz-Zubek, E. Indoor Air quality in urban and rural preschools in Upper Silesia, Poland: Particulate Matter and carbon dioxide. Int. J. Environ. Res. Public Health 2015, 12, 7697–7711. [Google Scholar] [CrossRef] [PubMed]
- Annesi-Maesano, I.; Baiz, N.; Banerjee, S.; Rudnai, P.; Rive, S. Indoor air quality and sources in schools and related health effects. J. Toxicol. Environ. Health B 2013, 16, 491–550. [Google Scholar] [CrossRef] [PubMed]
- Salvi, S. Health effects of ambient air pollution in children. Paediatr. Respir. Rev. 2007, 8, 275–280. [Google Scholar] [CrossRef] [PubMed]
- Schnabel, E.; Sausenthaler, S.; Brochow, I.; Liese, J.; Herbarth, O.; Michael, B.; Schaaf, B.; Kramer, U.; von Berg, A.; Wichmann, H.E.; et al. LISA Study Group. Burden of otitis media and pneumonia in children up to 6 years of age: Results of the LISA birth cohort. Eur. J. Pediatr. 2009, 168, 1251–1257. [Google Scholar] [CrossRef]
- Trasande, L.; Thurston, G.D. The role of air pollution in asthma and other pediatric morbidities. J. Allergy Clin. Immunol. 2005, 115, 689–699. [Google Scholar] [CrossRef]
- Oftedal, B.; Brunekreef, B.; Nystad, W.; Madsen, C.; Walker, S.; Nafstad, P. Residential outdoor air pollution and lung function in schoolchildren. Epidemiology 2008, 19, 129–137. [Google Scholar] [CrossRef]
- Gauderman, W.J.; McConnell, R.; Gilliland, F.; London, S.; Thomas, D.; Avol, E.; Vora, H.; Berhane, K.; Rappaport, E.B.; Lurmann, F.; et al. Association between air pollution and lung function growth in southern California children: Results from a second cohort. Am. J. Respir. Crit. Care Med. 2002, 166, 76–84. [Google Scholar] [CrossRef] [PubMed]
- Schwartz, J. Air pollution and children’s health. Pediatrics 2004, 113, 1037–1043. [Google Scholar] [PubMed]
- Wald, E.R. Recurrent and nonresolving pneumonia in children. Semin. Respir. Infect. 1993, 8, 46–58. [Google Scholar] [PubMed]
- Després, V.R.; Huffman, J.A.; Burrows, S.M.; Hoose, C.; Safatov, A.S.; Buryak, G.; Fröhlich-Nowoisky, J.; Elbert, W.; Andreae, M.O.; Pöschl, U. Primary biological aerosol particles in the atmosphere: A review. Tellus Ser. B Chem. Phys. Meteorol. 2012, 64, 15598. [Google Scholar] [CrossRef]
- Fang, Z.; Ouyang, Z.; Zheng, H.; Wang, X. Concentration and size distribution of culturable airborne microorganisms in outdoor environments in Beijing, China. Aerosol Sci. Technol. 2008, 42, 325–334. [Google Scholar] [CrossRef]
- Gao, M.; Jia, R.; Qiu, T.; Han, M.; Song, Y.; Wang, X. Seasonal size distribution of airborne culturable bacteria and fungi and preliminary estimation of their deposition in human lungs during non-haze and haze days. Atmos. Environ. 2015, 118, 203–210. [Google Scholar] [CrossRef]
- Hu, L.F.; Zhang, K.; Wang, H.B.; Li, N.; Wang, J.; Yang, W.H.; Yin, Z.; Jiao, Z.G.; Wen, Z.B.; Li, J.S. Concentration and Particle Size Distribution of Microbiological Aerosol During Haze Days in Beijing. Huan Jing Ke Xue 2015, 36, 3144–3149. [Google Scholar] [PubMed]
- Pitkäranta, M.; Meklin, T.; Hyvärinen, A.; Nevalainen, A.; Paulin, L.; Auvinen, P.; Lignell, U.; Rintala, H. Molecular profiling of fungal communities in moisture damaged buildings before and after remediation—A comparison of culture-dependent and culture-independent methods. BMC Microbiol. 2011, 11, 235. [Google Scholar] [CrossRef] [PubMed]
- Haas, D.; Galler, H.; Luxner, J.; Zarfel, G.; Buzina, W.; Friedl, H.; Marth, E.; Habib, J.; Reinthaler, F.F. The concentrations of culturable microorganisms in relation to particulate matter in urban air. Atmos. Environ. 2013, 65, 215–222. [Google Scholar] [CrossRef]
- Dybwad, M.; Skogan, G.; Blatny, J.M. Temporal variability of the bioaerosol background at a subway station: Concentration level, size distribution, and diversity of airborne bacteria. Appl. Environ. Microbiol. 2014, 80, 257–270. [Google Scholar] [CrossRef] [PubMed]


| Parameter | Definition | Value for Age Categories | Reference | |||
|---|---|---|---|---|---|---|
| Infant (0–1 year) | Child (2–5 years) | Child (6–12 years) | Adult (19–75 years) | |||
| C | Mean concentration of PM2.5 in ambient air (μg/m3) | |||||
| ET | Exposure time (h) | 1 | 8 | 6 | 3 | [59,60] |
| InhR | Inhalation rate (m3/day) | 9.2 | 16.74 | 21.02 | 21.4 | [60] |
| Season | Dose Rate of Bacterial Aerosols | Dose Rate of Fungal Aerosols | ||||||
|---|---|---|---|---|---|---|---|---|
| Infant (0–1 year) | Child (2–5 years) | Child (6–12 years) | Adult (19–75 years) | Infant (0–1 year) | Child (2–5 years) | Child (6–12 years) | Adult (19–75 years) | |
| Winter | 210.1 | 1528.8 | 718.3 | 230.7 | 49.7 | 361.5 | 169.8 | 54.5 |
| Summer | 233.7 | 1700.7 | 799.0 | 256.6 | 63.5 | 462.2 | 217.2 | 69.7 |
© 2019 by the authors. Licensee MDPI, Basel, Switzerland. This article is an open access article distributed under the terms and conditions of the Creative Commons Attribution (CC BY) license (http://creativecommons.org/licenses/by/4.0/).
Share and Cite
Morakinyo, O.M.; Mokgobu, M.I.; Mukhola, M.S.; Godobedzha, T. Biological Composition of Respirable Particulate Matter in an Industrial Vicinity in South Africa. Int. J. Environ. Res. Public Health 2019, 16, 629. https://doi.org/10.3390/ijerph16040629
Morakinyo OM, Mokgobu MI, Mukhola MS, Godobedzha T. Biological Composition of Respirable Particulate Matter in an Industrial Vicinity in South Africa. International Journal of Environmental Research and Public Health. 2019; 16(4):629. https://doi.org/10.3390/ijerph16040629
Chicago/Turabian StyleMorakinyo, Oyewale Mayowa, Matlou Ingrid Mokgobu, Murembiwa Stanley Mukhola, and Tshifhiwa Godobedzha. 2019. "Biological Composition of Respirable Particulate Matter in an Industrial Vicinity in South Africa" International Journal of Environmental Research and Public Health 16, no. 4: 629. https://doi.org/10.3390/ijerph16040629