Article

Seasonal Characteristics and Particle-size Distributions of Particulate Air Pollutants in Urumqi

1
College of Resources and Environmental Science, China Agricultural University (CAU), Beijing 100193, China
2
Department of Civil Engineering, The University of Hong Kong (HKU), Pokfulam 999077, Hong Kong, China
3
Department of Earth & Environmental Science, Xi’an Jiaotong University, Xi’an 710049, China
4
State Key Laboratory of Simulation and Regulation of Water Cycle in River Basin & China Institute of Water Resources and Hydropower Research (IWHR), Beijing 100011, China
5
School of Resources and Environment Science, Xinjiang University (XJU), Urumqi 830046, China
*
Authors to whom correspondence should be addressed.
Int. J. Environ. Res. Public Health 2019, 16(3), 396; https://doi.org/10.3390/ijerph16030396
Submission received: 22 October 2018 / Revised: 26 January 2019 / Accepted: 29 January 2019 / Published: 31 January 2019
(This article belongs to the Special Issue Air Quality Monitoring and Assessment)

Abstract

:
Urban particulate air pollution is a known cause of adverse human health effects worldwide. Urumqi is a large oasis city in which rapid urbanization has caused a series of eco-environmental problems including serious air pollution, water shortage, dense population, excess energy consumption, and the creation of an urban heat island, among others. Coal is the most important source of energy and air pollutants that are poorly dispersed into the natural surroundings are the main reasons for serious pollution in the Urumqi urban area. Using differential optical absorption spectroscopy (DOAS), aerosol levels were determined using the double optical path method. We found that aerosol concentrations in Urumqi increased rapidly in winter, and that the concentration of fine particles was much higher than that of coarse particles. The background aerosol concentration was highest in winter in the research area, and the air-flow speed had a significant impact on this because high speed surface winds that correspond to high air flows can transport the aerosol to other places. Some of the observed day-to-night differences may be caused by differing wind directions that transport air masses from different emission sources during the day and the night. Daily and seasonal differences in PM1.0 concentrations of different grades of polluted air were statistically analyzed using average daily concentration data for particles smaller than 10, 2.5 and 1.0 microns (PM10, PM2.5 and PM1.0), and meteorological observations for Urumqi, Tianshan District in 2010.

1. Introduction

Atmospheric aerosol particles are important air pollutants, and the level of aerosol particles is expressed by the mean concentration of fine particulate matter (PM10 and PM2.5, i.e., the particles are smaller than 10 or 2.5 microns, respectively) [1,2]. The apportionment of the source of airborne particulate matter is important in the field of environmental administration. In many cities, PM10 has become the primary pollutant [3]. Since the mid-90s, the Chinese government has adopted increasingly stringent standards for abating emissions and for improving the air quality. As a consequence, a general improvement of air quality has been recorded in the last decade. The development of methods for monitoring and controlling PM10 in atmospheric pollution is now a major focus [4]. The influence of aerosols on the city environment impacts in several ways. Firstly, hygroscopic aerosols (such as black carbon and sulfates) in conditions of high relative humidity easily form fog. As air turbidity increases, this fog mixes with dust to become smog, enhancing the scattering and absorption of solar radiation, in turn weakening the influence of solar radiation at ground level, and affecting the regional radiation balance and visibility in the city [5]. Secondly, fine particles can easily adsorb toxic substances (polycyclic aromatic hydrocarbons can easily be adsorbed on the surface of PM10). Because of the small size of these aerosol particles, these toxic compounds are able to pass through the respiratory tract, depositing in the alveoli, potentially causing great harm to human health [6]. Because of their different chemical compositions and concentrations, the survival time of particles of various sizes is different [7]. Hygroscopic particles tend to form condensed nuclei. As a consequence, there is an increased possibility of cloud precipitation, resulting in relatively short particle life while the life of non-hygroscopic particles is relatively long. Therefore, it is of great importance to understand the characteristics of atmospheric aerosol pollution and their impact on the environment by studying the particle size, spectral distribution and chemical composition of atmospheric aerosols [8]. In recent years, with the acceleration of climate change and the expansion of urbanization, various environmental problems and their impact on human health have also received the attention of the scientific community [9,10,11,12,13,14,15,16,17,18,19,20,21].
Ambient air quality monitoring stations provide large quantities of temporal data. These data are conveyed to the public as air quality index (AQI) values or other meaningful indices that depend on purpose and time scale, as well as a range of sub-indices that are based on epidemiological studies. The US Environmental Protection Agency (US EPA) initially implemented the use of AQI in 1999, and the methodology was later updated and defined in terms of six key air pollutants: carbon monoxide (CO), nitrogen dioxide (NO2), ozone (O3), coarse particulate matter (PM10), fine particulate matter (PM2.5), and sulfur dioxide (SO2) [22].
AQI values vary from 0 to 500 and their magnitudes are proportional to pollutant concentration in ambient air; greater AQI values have more serious health implications. If the AQI is greater than 100, then the air quality is unhealthy for certain groups. The air pollution categories based on AQI are listed in Table S1 (Supplementary Materials). For each color coded AQI, a unique association exists between the AQI level and its health implications.

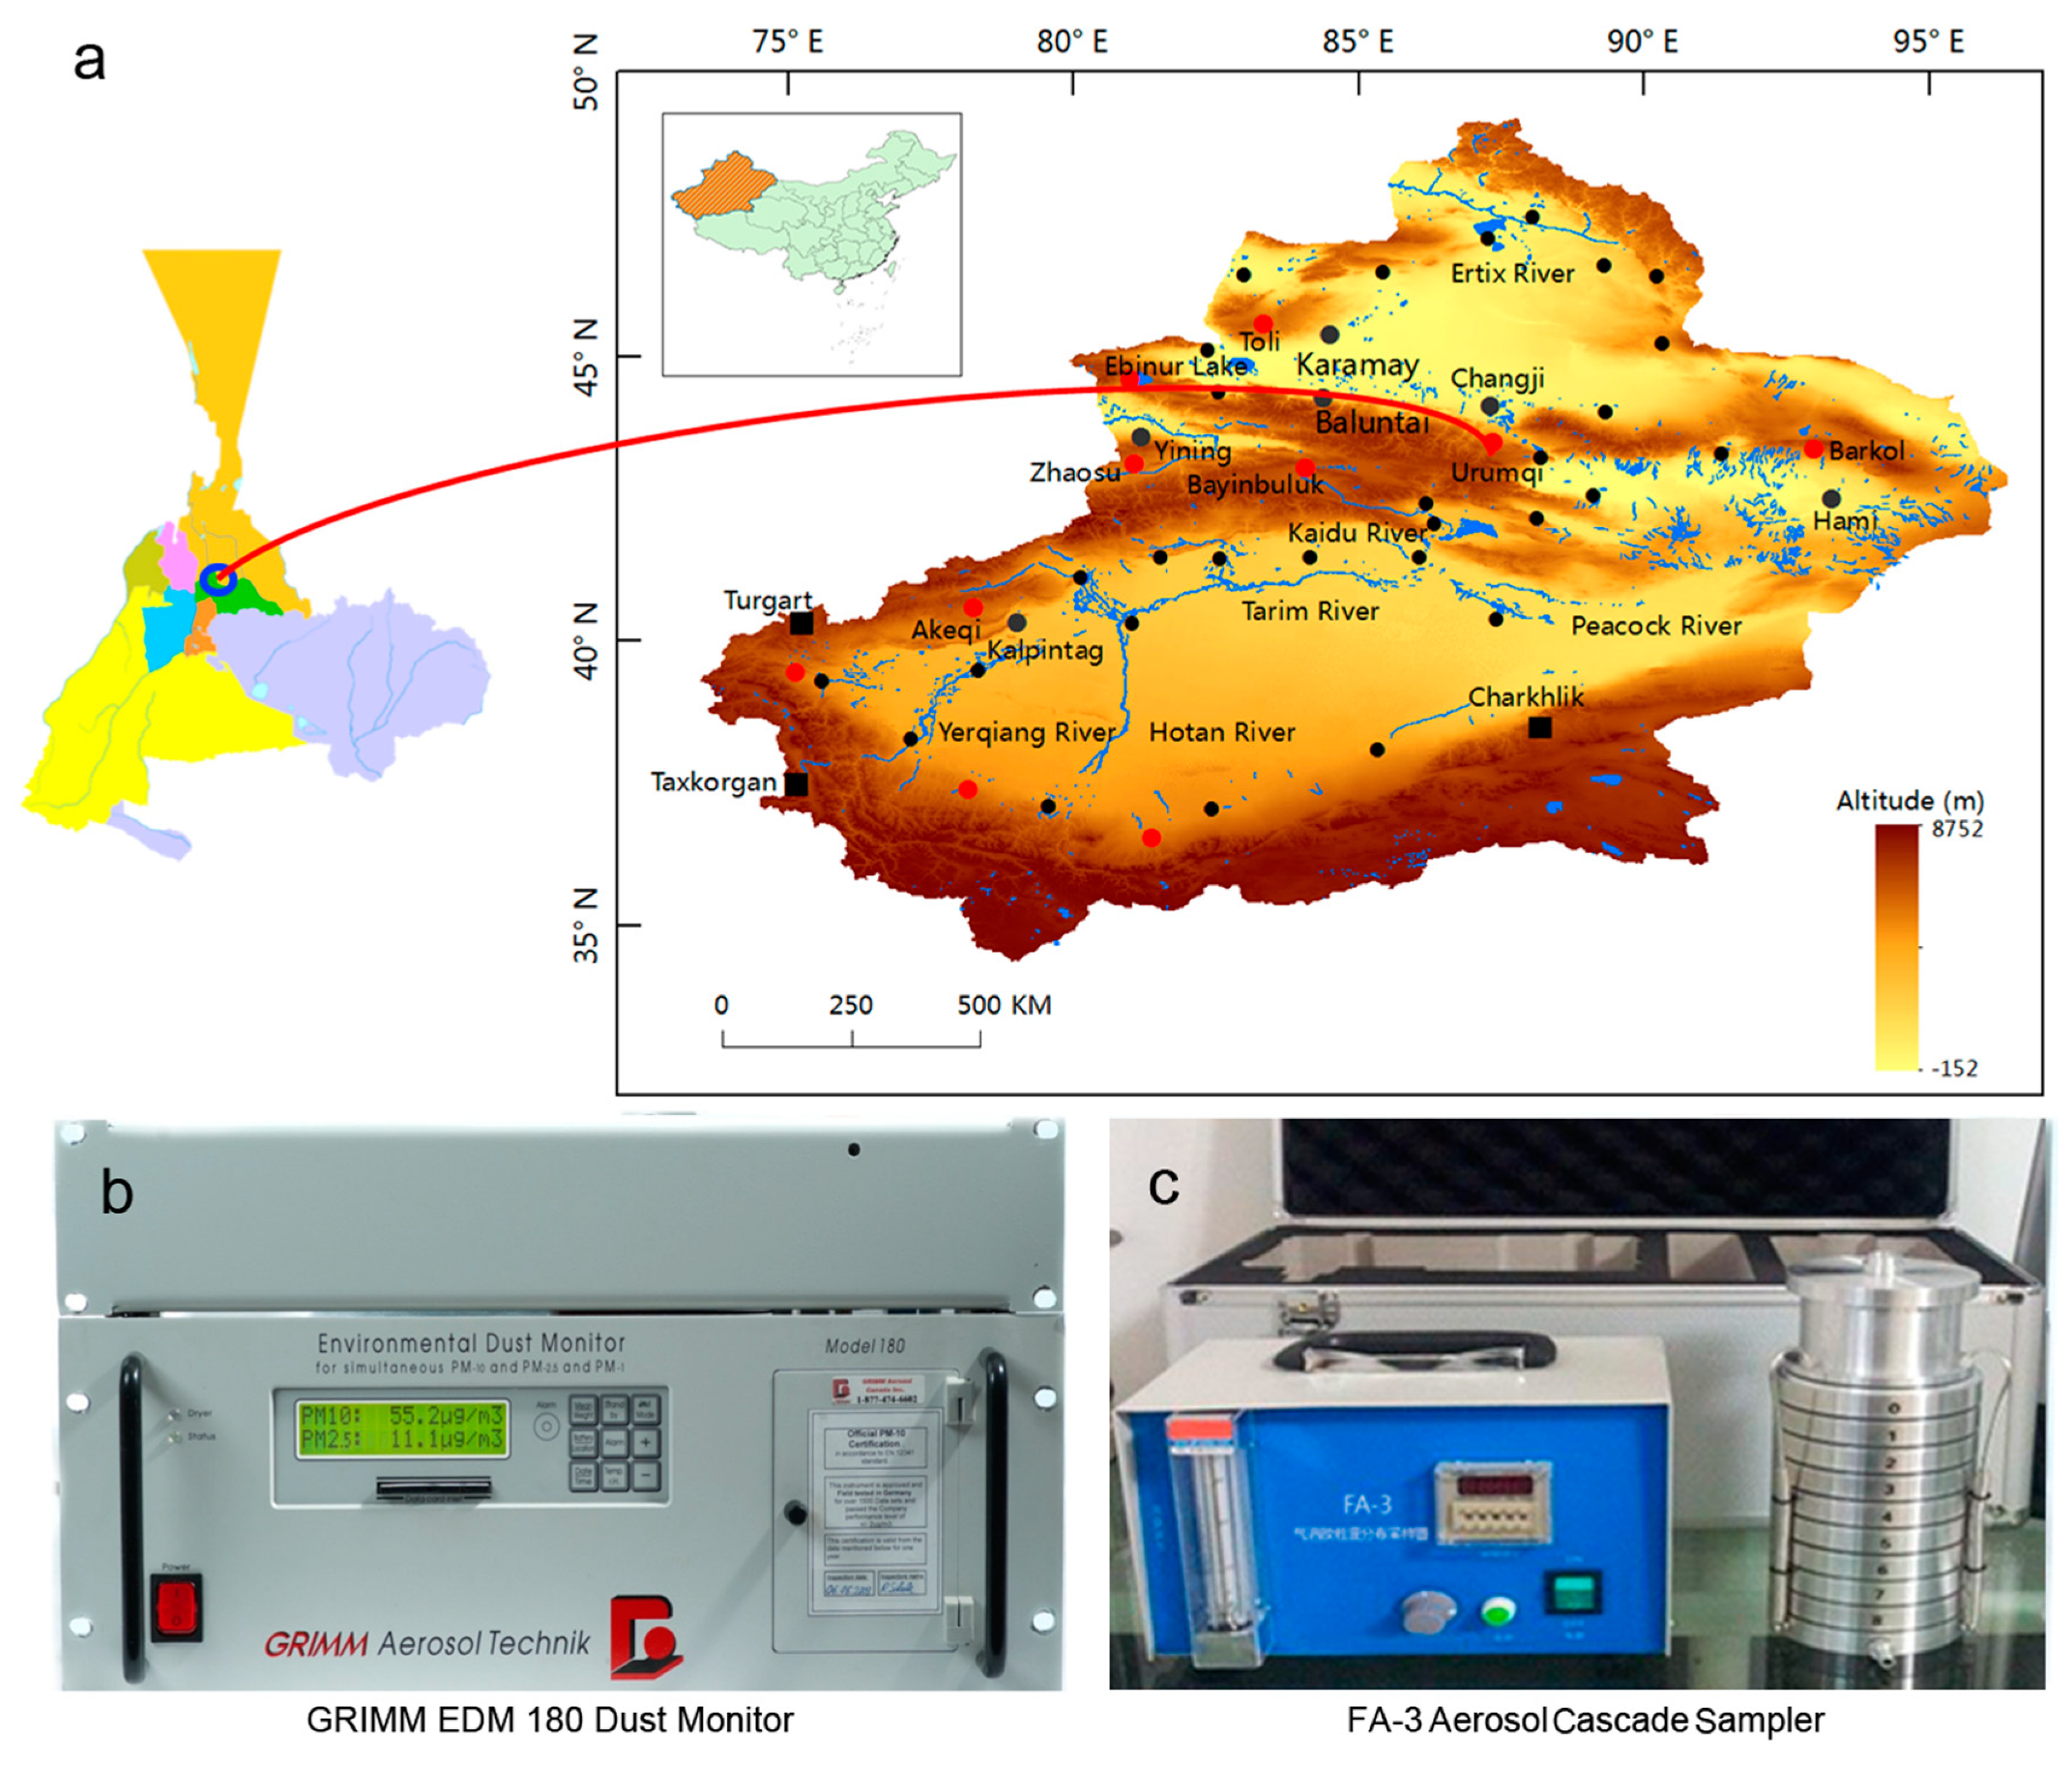
2. Material and Methods

The sampling station, an air-conditioned container, is located in Urumqi (43.48° N, 87.39° E, Elevation: 935 meters) (Figure 1). According to the January 2013 National Environmental Analysis, Urumqi is among the top ten most air-polluted cities in the world. Heavy haze is extremely common in winter, and frequently affects air traffic. Officials believe that severe winter air pollution in Urumqi is mainly caused by energy intensive industries and outdated coal burning in winter heating systems. According to a report by the Department of Environmental Science and Engineering of Fudan University, the average PM2.5 and total suspended particle (TSP) concentrations in the winter of 2007 were 12 times higher than the USA standard for PM2.5, and three times the National Ambient Air Quality Standard of China for TSPs. Sulfur dioxide from industrial emissions mixed with local anthropogenic aerosols and transported soil dust from outside the city were the main sources of the high sulfate concentration, one of the main factors responsible for the heavy air pollution over Urumqi.
Air pollutants emitted from power plants and chemical factories, that are located upwind from the urban area, can affect the air quality over the city area [3]. Because of the southern prevailing wind and the higher elevation of the southern part, it is difficult for pollutions in the urban area to diffuse. Small boilers, without measures for controlling smoke and dust form the main mode of heating in the city’s suburbs. This heating method consumes high amounts of energy and causes serious pollution, with emitted pollutants such as soot and sulfur dioxide increasing greatly during their use. Open-air barbecue stalls are another important source of air pollution in Urumqi, as the city has nearly one million barbecue grills while NO2 emitted by motor vehicles reached 0.025 mg·m−3 in Urumqi city in 2007. With the rapid growth in the number of vehicles in the downtown area, emissions from motor vehicle exhausts together with sewage from catering services and reduced air flow due to buildings, result in poor air quality. As a result, air pollution is a serious problem in Urumqi today. With the increasing problem of air pollution in Urumqi, the Urumqi government promulgated measures for the prevention and control of air pollution in Urumqi in November 2008 [23], which were used to relieve the pressure of air pollution in Urumqi.
By measuring concentration data and the optical properties of Urumqi air, between December 2009 and October 2010, and by determining the physicochemical properties of aerosol samples over two winters, this research investigated the city’s aerosol pollution characteristics. Using the back-trajectory method, we analyzed the mechanism for how weather conditions influence aerosol pollution in the Urumqi area and investigated the influence of the physicochemical properties of particles with varying diameters on the atmospheric extinction of sunlight. Though similar studies have been reported for other areas [24,25,26,27], such detailed data are quite new for the Urumqi area.
Airborne particles were collected from urban areas of Urumqi using an FA-3 aerosol cascade sampler (Figure 1c) (ZHRX, Beijing, China). The size of the aerosol particles in the samples were measured. Particulate matter includes particles from molecular size to greater than 10 mm in diameter. The particle diameter range was divided into 9 levels. The total measuring time was about one week. After sampling, a high-precision electronic balance was used to weigh the sampling filter membrane. The average mass concentration of aerosol particles in the various size fractions can be calculated as follows [28]:
ρi = (mi2mi1)/Vs
In this formula: ρi is the mass concentration of particles of size i (g m−3), mi2(g) is the membrane weight after sampling, mi1(g) is the membrane weight before sampling, and Vs is the sampling volume (m3) under standard conditions.
Liquid ion chromatography, using a Dixon ICS-3000 ion chromatograph (TechMax, New north city, Taiwan), was used for the determination of water-soluble ions in the various particle size fractions [29].
The diameters of the particles were divided into 9 grades: level 11, 9.0–10 μm; level 2, 5.8–9.0 μm; level 3, 4.7–5.8 μm; level 4, 3.3–4.7 μm; level 5, 2.1–3.3 μm; level 6, 1.1–2.1 μm; level 7, 0.65–1.1 μm; level 8, 0.43–0.65μm; and level 9, submicron. Seven sampling times, of different duration, between December 2010 and March 2011 were employed. Sampling volumes were calculated according to the sampling time and the sampling flow rate. The aerosol mass concentration was obtained by dividing the aerosol weight by the sample volume; the mass concentration is the average concentration of the aerosol over the sampling duration.

3. Results and Discussion

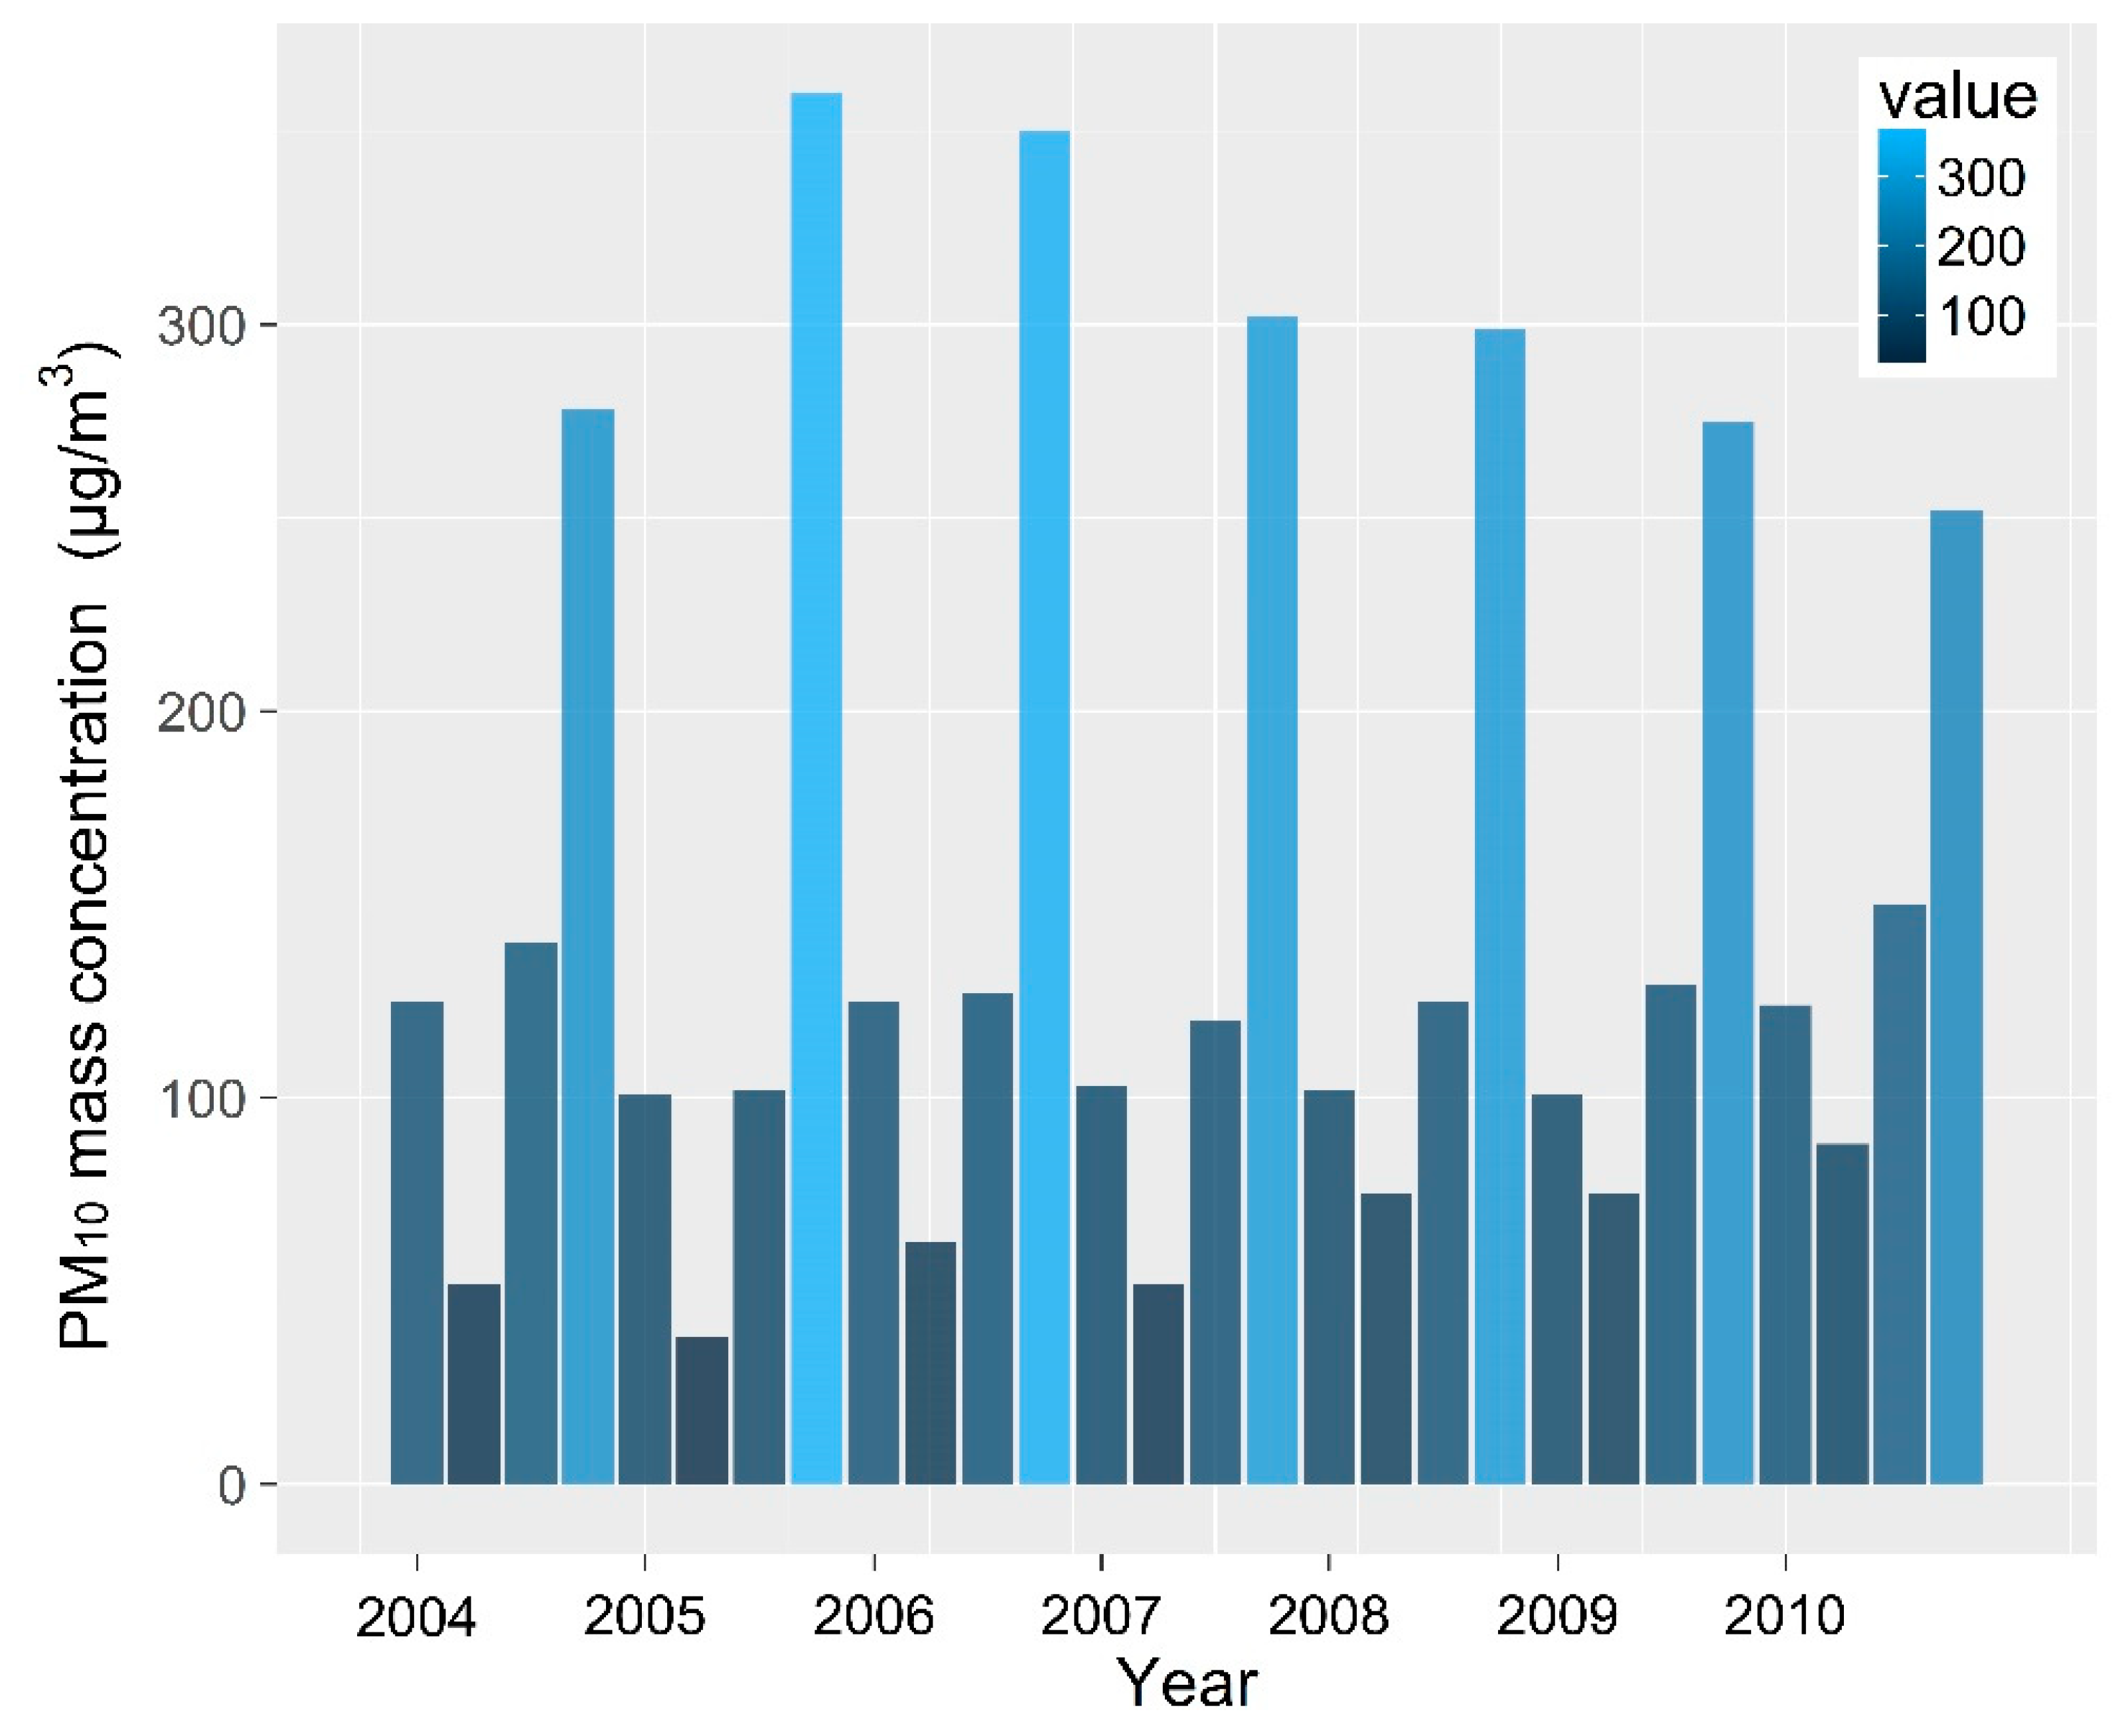
3.1. Annual Variations in PM10 Concentration

Based on the daily air pollution index (API) promulgated by the China Ministry of Environmental Protection (MEP) in June 2000 [30], air quality can be divided into five air quality grades: excellent, good, light pollution, moderate pollution and severe pollution [30,31]. The mass concentration of PM10, which is the main air pollutant during the winter season in Urumqi can be estimated from the API value (see Table 1).
While the daily maximum concentration of PM10 in Urumqi was greater than or equal to 600 μg·m−3 during the period 2004–2009, the API in Urumqi was set to no greater than 500 (i.e., the maximum), and the minimum daily average concentration of PM10 (from 2004–2009) was taken from the real-time air quality index (AQI) monitoring network [32]. The average daily maximum concentration of PM10 dropped to 536 μg·m−3 in 2010, which was lower than that for the previous year. This is because Urumqi implemented an energy structure improvement policy aimed at energy conservation, emission reduction and motor vehicle exhaust control. The average annual concentration experienced fluctuating growth during this period, as shown in Table 2. Despite this, air pollution in the city reached the “severe pollution” level. It can be seen that there is an obvious year-to-year variation in the PM10 pollution characteristics in Urumqi.

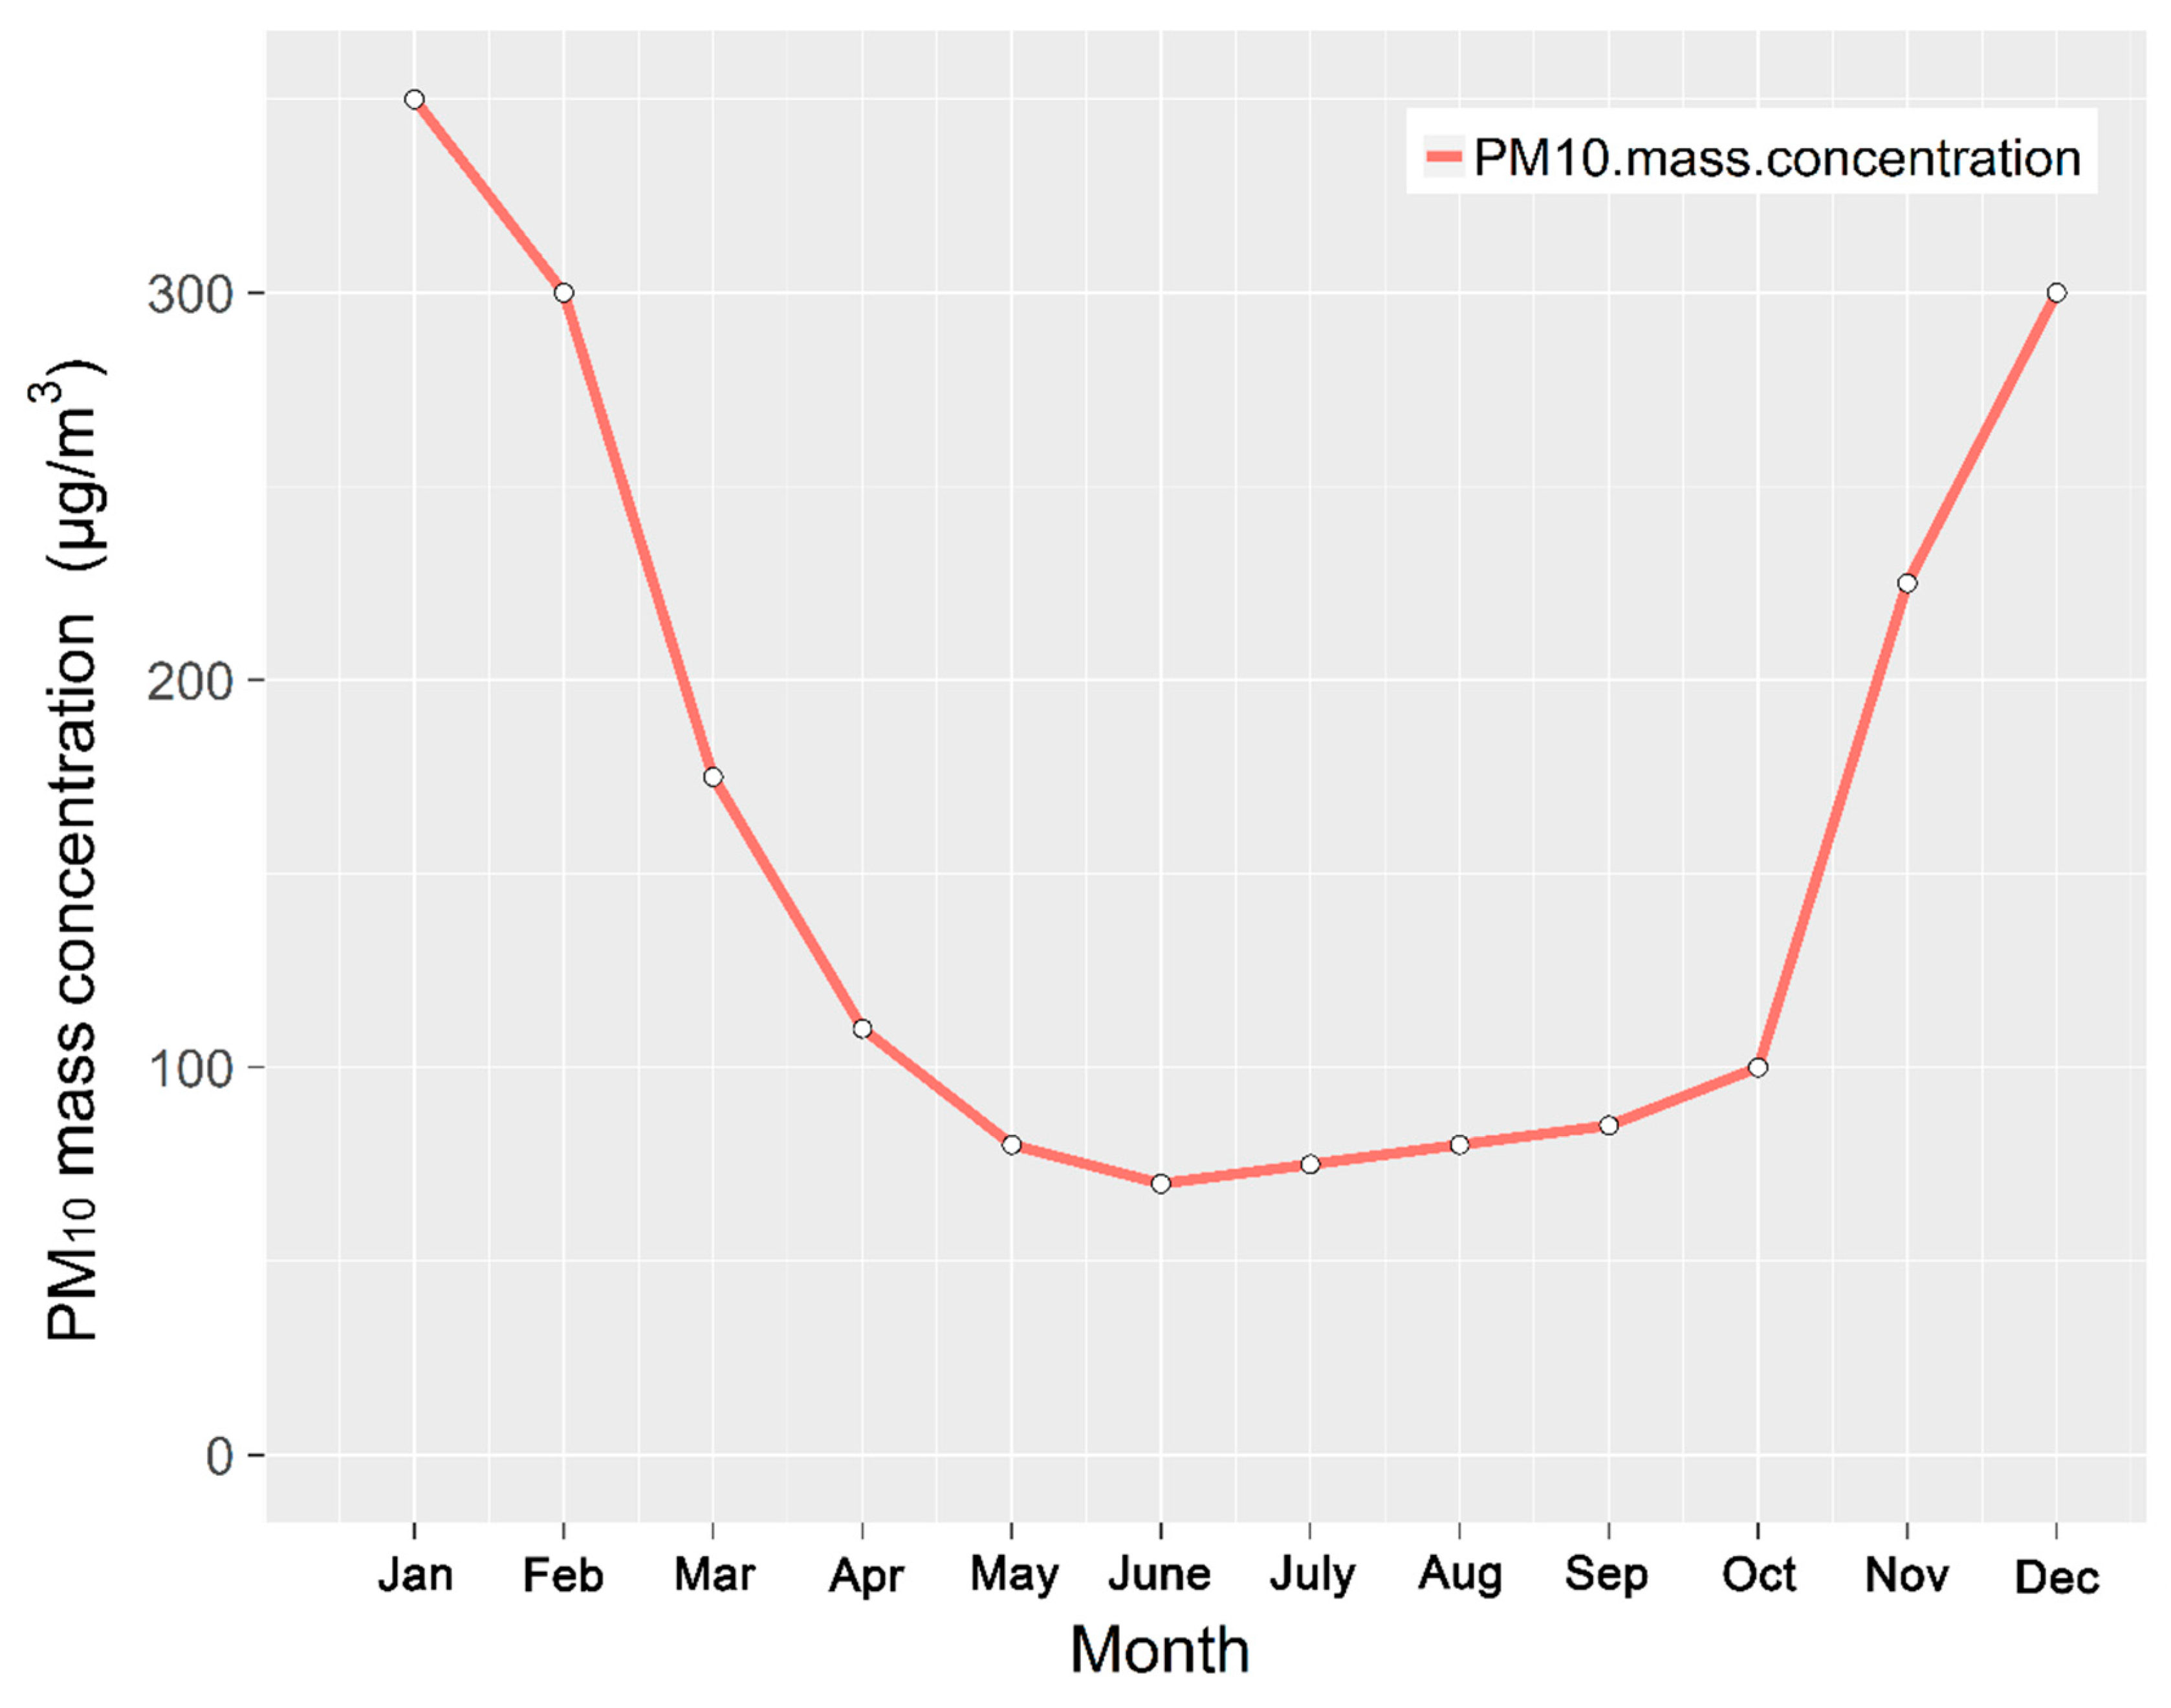
3.2. Average Monthly Variations in PM10 Concentration

Figure 2 and Figure 3 show the average monthly PM10 mass concentration and the percentage of PM10 over the period 2004–2010, respectively. The average PM10 concentration exceeded national air quality standards in January, February, March, November and December. The highest average value of 338.2 μg·m−3 appeared in January and is close to that associated with “moderate pollution”. The second-highest PM value of 293.5 μg·m−3corresponded to December while the third, 210.7 μg·m−3, occurred in November. The contamination levels corresponded to “light pollution” in March and November, while the percentage of PM10 in the primary pollutants over the total number of days was also small over those two months (Figure 3). It is easy to generate an inversion layer at low temperature in winter, in a city that is located in a valley; a deep inversion layer hinders the diffusion and dilution of pollutants [33]. As coal heating is used during the colder months, air pollution emissions also increase significantly during those months. These pollutants include inhalable particulate matter such as PM10, while other gaseous pollutants, such as SO2 and NO2, reduce the number of PM10 pollution days. The ground is covered with snow in winter and this causes a significant reduction in dust aerosols [34], As a result, the number of days with PM10 as the primary pollutant as a proportion of the total number of days is less than 70%, and from Figure 3 we can observe that this proportion decreased from January to March with March having the least number of days when PM10 was the primary pollutant, accounting for only 46.2%.
The PM10 mass concentration was lower than that of the national quality standards in the months from April to October, with the minimum value of 60.9 μg·m−3 appearing in June, which is far below the national air quality requirements (150 μg·m−3). The average mass concentration was lower than 100 μg·m−3 in these seven months and the concentrations of PM10 met the national air quality standards II, and the air quality was generally good. According to the World Health Organization, the main components of particulate matter are sulfate, nitrate, ammonia, sodium chloride, carbon, mineral dust and water [35]. The proportion of PM10 in the primary pollutants exceeded 80% in these seven months, and even exceeded 95% from July to September, which is due to the disappearance of the inversion layer and the increase in rain [36]. The concentration of pollutants in the atmosphere decreased sharply due to erosion and diffusion dilution caused by rain. Soluble SO2 and NO2 emissions were lower than those observed in winter [37].

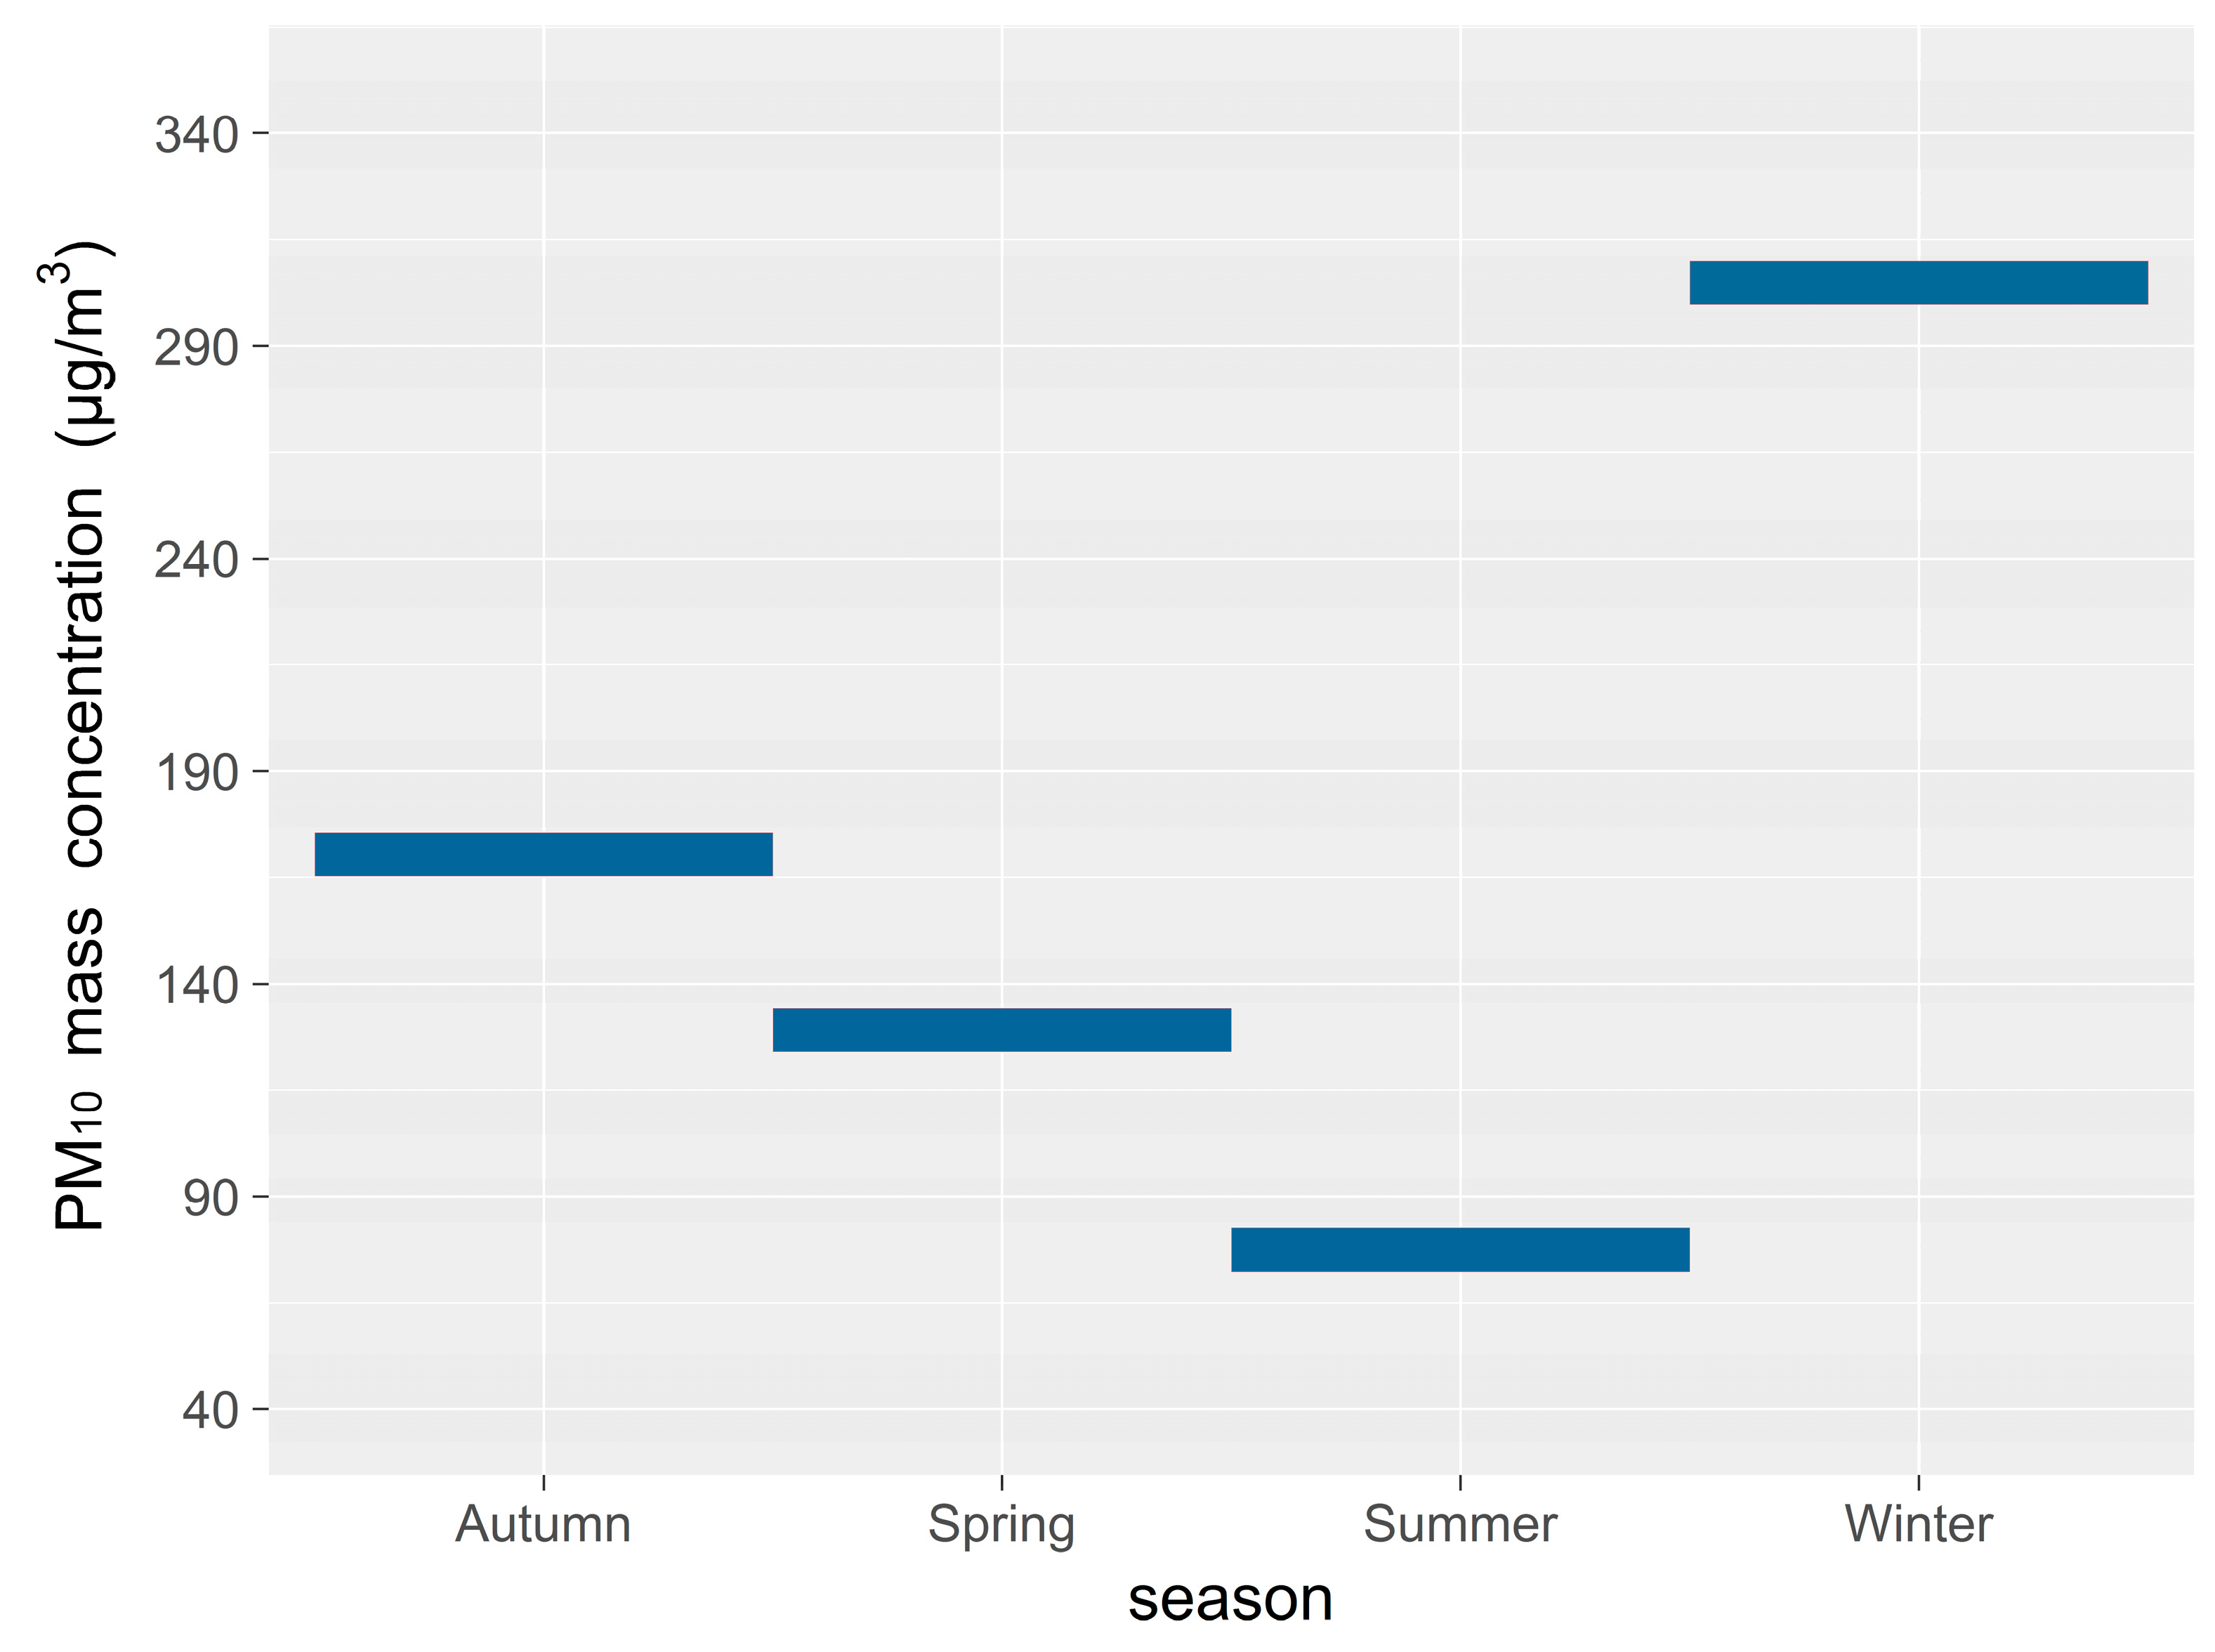
3.3. Seasonal Variations in PM10 Concentration

Seasonal variations need to take into account the division of the seasons for the city; namely spring (March, April and May), summer (June, July and August), autumn (September, October and November), and winter (December, January and February). Seasonal average mass concentrations of PM10 are displayed in Figure 4, which shows that the air quality is the clearest in summer when there is a minimum amount of inhalable particulate matter in the atmosphere. The seasonal average PM10 mass concentrations were less than 100 μg·m−3 and air quality over the non-heating period was good, but the PM10 mass concentration over summer shows a fluctuating, but increasing trend since 2005. As the number of motor vehicles increases year-by-year, so does the amount of inhalable particulate matter discharged into the air. Changes in meteorological conditions are also important factors that affect annual changes in pollutant levels [38]. Due to substantial increases in pollutant emissions and enduring low-altitude inversion layers over the city in winter, the air quality is the worst in winter. Average PM10 mass concentration in each season in Urumqi reached a maximum value of 358.9 μg·m−3 in the winter of 2005. Since 2005, the concentration of PM10 in the winter has been decreasing year-by-year, and has reached 255.2 μg·m−3; pollutant discharge has been effectively controlled through the introduction of central heating [39].
The local and regional distribution of pollutants is significantly influenced by weather patterns and their variability, along with spatial emission patterns. Heating periods decrease when there are warm winters. As less PM10 is discharged, less CO2 and SO2 are also produced, promoting improved environmental air quality. The data show that the winter concentration of PM10 has decreased year by year since 2006 (Figure 4); the average mass concentration of PM10 was 113.1 µg·m−3 in spring and 122.6 µg·m−3 in autumn, as shown in Figure 5. Periods of heating in spring are less than in autumn. We propose that the day-by-day accumulation of PM10, from its lowest value to its peak value, dropping back to the lowest value, is an environmental pollution process. The temperature inversion is strongest in winter and weakest in summer [40].

3.4. Diurnal Variations in PM10, PM2.5 and PM1.0 Mass Concentrations

PM mass concentrations from December 2009 to November 2010 were analyzed and the diurnal variations in the mass concentration of PM10, PM2.5 and PM1.0 are displayed in Figure 5. There are five fluctuations in PM mass concentration every day. Maximum concentrations occurred at 12 am, 5 am, 10 am, 3 pm and 8 pm while minimum values were observed at 3 am, 8 am, 12 pm, 4 pm, 9 pm and 10 pm. The minimum value observed corresponded to 3 am, while the maximum value occurred at 8 pm. The main conclusions are as follows: PM mass concentrations in Urumqi increase from 3 am to 8 pm, but also fluctuate; the air pollution problem, especially atmospheric air pollution mainly results from mass emissions from vehicles, and is becoming more serious with the continual increase in the number of automobiles, especially in winter. A steady stream of city traffic significantly contributes to air pollution in the daytime. Over the city area, the development of an inverse temperature layer is strong and thick and particulate air pollution is not easily dispersed, fluctuations in PM concentrations increase in the daytime [41].
According to the data accumulated by monitoring and analysis of atmospheric aerosols at the surface boundary layer over Urumqi city from 2009 to 2010, PM mass concentrations fluctuate according to changes in environmental conditions during the day. The formation of radiation inversion in the surface layer was largely due to the cooling effect of long-wave radiation at night. The average wind speed was low during the early morning hours in 2009 and 2010, therefore, it is difficult to eliminate air pollution [42]; consequently, peak aerosol concentrations were observed at 10 am.
There exists a clear and positive feedback mechanism between the intensity of the atmospheric inversion and pollutants. With ever-increasing temperatures, the inversion layer gradually diminishes. Upward vertical turbulent heat flux gradually increases, which improves the atmospheric diffusion process of these particulates. While the results show that the diurnal PM mass concentrations vary greatly, there is an obvious decreasing trend in which PM concentrations decrease due to enhanced air flow during the daytime. Automobile exhaust emissions are an important source of fine PM2.5 and PM10 particulate matter; thus, decreases in vehicle traffic clearly result in reduced PM concentrations from vehicle exhaust emissions.
Figure 6 reports data collected during diurnal cycles. As was observed for the seasonal patterns, daily cycles are also the result of the interplay between the intensity of various sources such as photochemical processes and meteorological factors. Although minor changes due to specific local conditions are observed, almost all sites exhibit similar daily and weekly cycles. CO and nitrogen oxides show typical daily cycles linked to road traffic, with two daily maxima corresponding to the morning and evening rush hours (7–9 am and 6–8 pm). The morning and evening maxima are split by a period of low emission, which is assumed to be the result of: (i) lower emissions (less traffic); (ii) larger availability of ozone driven by the daylight photolysis of NO2 and the oxidation of volatile organic compounds (VOC); and CO (iii) higher convective activity leading to a deeper mixed layer, which enhances atmospheric mixing. Weekly patterns are also linked to road traffic; generally, average levels increase from Mondays to Thursdays, while a significant drop is observed over the weekends, when road traffic reaches minimum volumes and heavy-duty vehicles over 7.5 tons are subject to restrictions.
Based on the Urumqi air quality index map [43], ozone and total oxidants (OX) show daily peaks in the mid-afternoon, i.e., the hours that experience higher solar radiation levels, and lower levels are experienced between 6 and 9 am local time (daylight-saving time corrected in summer). These patterns are also enhanced in summer due to generally higher levels of solar radiation. It is evident that daily peaks of OX are delayed by 2–3 h with respect to ozone, corresponding to increases in NO to NO2 oxidation and primary NO2 emissions during the evening rush hours [44]. This “flatter” pattern is likely to be related to the lack of anthropogenic sources of freshly emitted ozone precursors, and the presence of higher levels of biogenic ozone-precursors, which do not follow anthropogenic cycling [45]. However, the levels of ozone are also known to be strongly affected by the transport of polluted air masses by local wind systems [46]; nocturnal dry deposition is also less effective in city sites.
Generally, PM10 exhibits higher concentrations overnight with clear minima in the early afternoon. This pattern is consistent with the diurnal dynamics of the mixing layer [47]). However, a secondary cause may be related to the volatilization of the more volatile aerosol compounds (e.g., nitrate) during the early afternoon, i.e., when the air temperature is higher and relative humidity is lower. Minor PM10 concentration peaks are observed just before noon and can be caused by very different mission scenarios. The interpretation of these observations is not clear and may be related to the local characteristics of the observation sites.
Figure 6 shows the diurnal changes of PM2.5/PM10, PM1.0/PM10, PM1.0/PM2.5 mass concentrations over the four seasons in Urumqi. We found three maxima and three minima during all four seasons. Comparing the ratios of different seasons suggested that the three ratios in winter are higher than those in other seasons, which reflects the effect of the winter inversion layer on the atmosphere. For Winter (PM2.5/PM10), the maximum value appeared at 2 pm, 9 am, 10 pm and 3 am, the minimum value appeared at 6 pm, 8 pm, 11 am and 4 am. The maximum value of PM mass concentrations ratio appeared at 3 am, 12 am and 10 pm for Winter (PM1.0/PM10), the minimum value appeared at 9 pm. Unlike the above two ratios, the minimum value appeared at 5–7 am for Winter (PM1.0/PM25), the ratios show a smaller range of variations at other times. For spring, the minimum value appeared at 3–5 am for Spring (PM2.5/PM10), spring (PM1.0/PM10) and (PM1.0/PM2.5). The maximum value appeared at 11 am, 7 pm and 4 pm, respectively. In summer, the maximum values appeared at 6 am and 0 am, while the second maximum value appeared at 10 pm. With the disappearance of the inversion layer and reduction of traffic flow, the minimum of the PM mass concentration appeared at noon (from 11 am to 7 pm). With enhancements in atmospheric convection, the lowest values of particle concentration appeared at 6pm. With increases in traffic flow, the night time radiation inversion layer and automobile exhaust emissions, nitrogen dioxide, carbon monoxide and particulates increase dramatically, with the peak value of particle concentrations appearing at 10 pm. For Autumn (PM1.0/PM2.5), the maximum value appeared at 10 am in the morning, the next highest at 8 pm, with the third peak appearing at 0 am. The minimum value appeared at 2 pm, the next lowest at 5 pm, and the third lowest at 11 pm–3 am. For Autumn (PM2.5/PM10) and (PM1.0/PM10), the maximum value appeared at 5–7 am, the second highest at 10 pm with the third peak appearing at 10 pm and 0 am. The difference in the peak values was small and seasonal. Similar to the observations for autumn and summer, the maximum PM concentration ratio value appeared in the early morning for both Autumn (PM2.5/PM10) and (PM1.0/PM10).

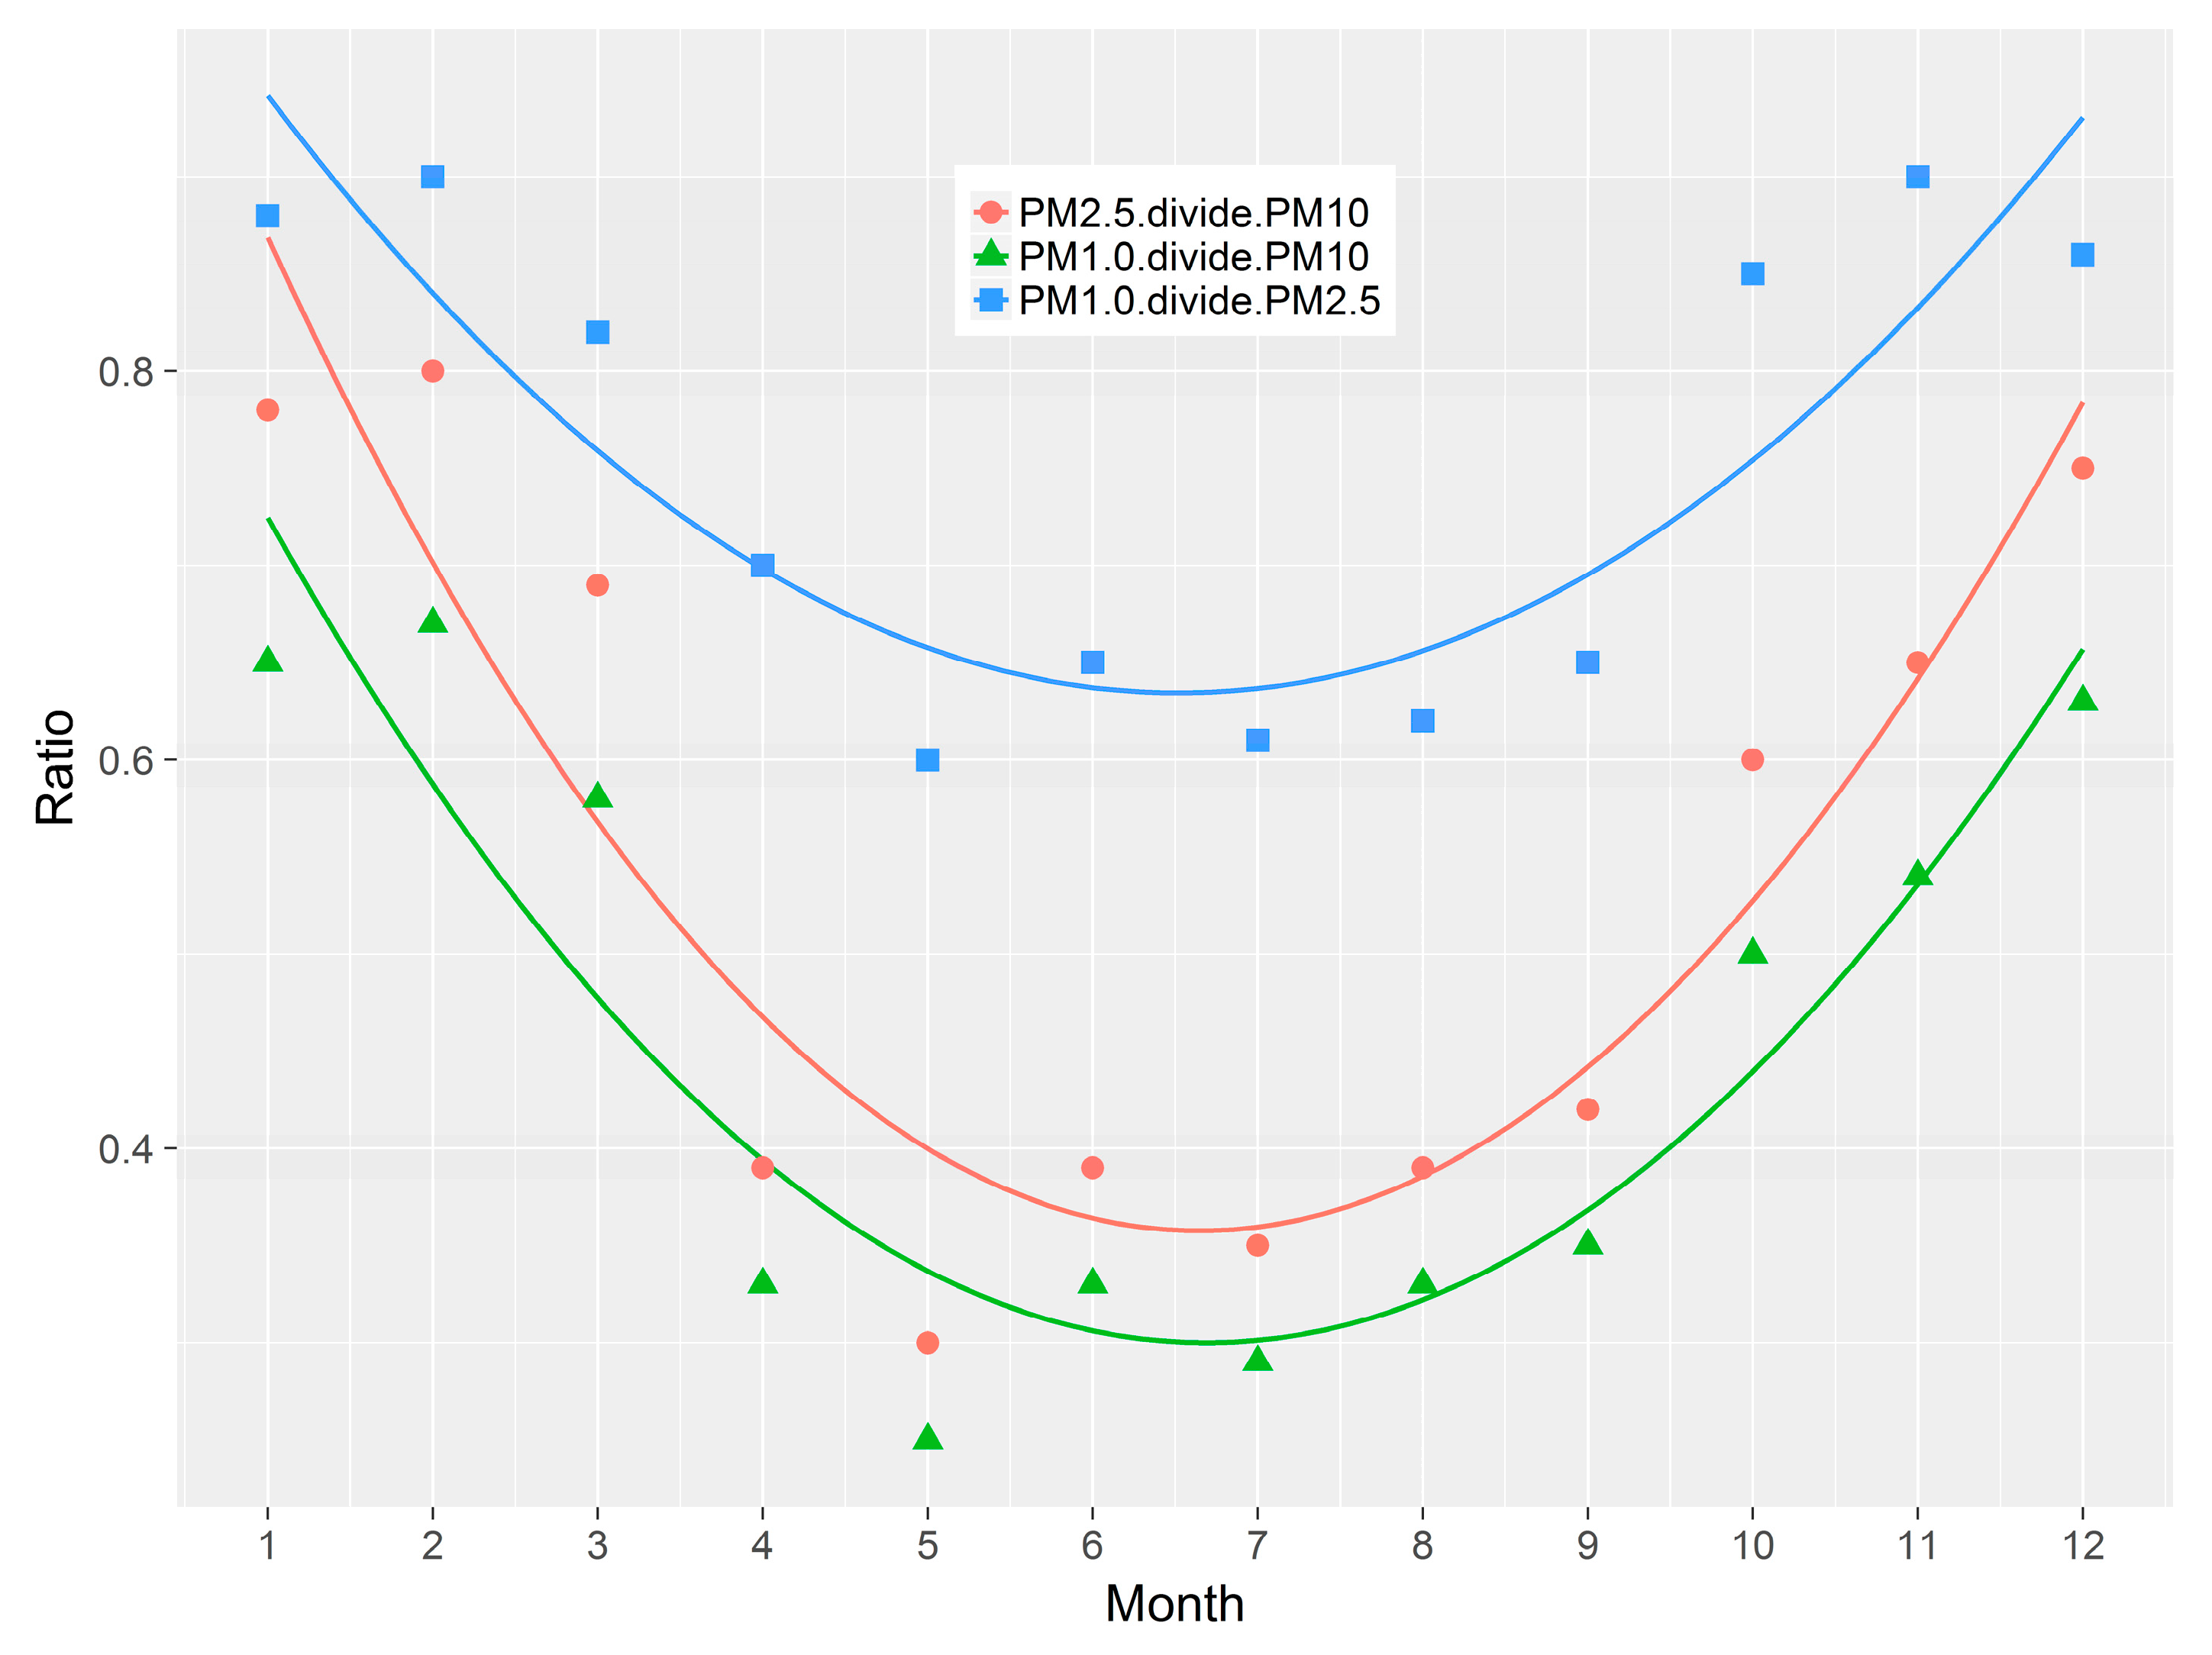
3.5. Seasonal and Monthly Average Ratios of PM2.5/PM10, PM1.0/PM10 and PM1.0/PM2.5

The ratio of PM2.5/PM10, PM1.0/PM10 and PM1.0/PM2.5 is a useful characterization tool that assists in the spatial and seasonal identification of the dominant aerosol types [48]). High ratios indicate the dominance of anthropogenic aerosols whereas low ratios indicate the dominance of dust aerosols. The dimensionless seasonal PM2.5/PM10 concentration ratios were calculated for winter, spring, summer and autumn to identify the dominant particulate matter pollution in Urumqi. Figure 7 and Figure 8 show the seasonal and monthly average ratios of PM2.5/PM10, PM1.0/PM10 and PM1.0/PM2.5.
The figures and data indicate that the PM10 concentrations are higher in winter in comparison to summer. The seasonal and 12-monthly variations in PM2.5/PM10, PM1.0/PM10 and PM1.0/PM2.5 in Urumqi show similar trends. However, the PM1.0/PM2.5 ratios were observed to be highest in winter indicating that fine particles arise predominately from anthropogenic sources, such as industrial activity and heavy traffic, during the winter period, in agreement with literature that confirms the prevalence of PM2.5 in the immediate proximity to industrial areas [49].

3.6. Distribution Characteristics of Aerosol Particles within Each Size Interval in Urumqi

Airborne particles were collected from urban areas of Urumqi using an FA-3 aerosol cascade sampler in winter 2010, as described in Section 2 (Materials and Methods). The size fractions of the aerosol particles in the various samples were measured.
Figure 9 shows the average aerosol concentration distribution across the nine particle diameter grades (Table 3) in winter. Because the 2.5 μm filter was not available for the sampler, we took the aerodynamic equivalent diameter of 2.1 μm (i.e., the 4th grade) to define the fine particle. The coarse particles are mostly dust and coal ash with a size of 2.1–10 μm, accounting for nearly 81% in terms of the size range, However, aerosol mass concentration account for only 42.5% of the total mass concentration of PM10. This suggested that the contribution of coarse particles (grade 0 to grade 4) was relatively low with grade 2 (4.7–5.8 μm) being the lowest (12.8 ± 9.1 μg·m−3). It was clear that the mass concentration of particles falling in grade 5 is the highest (23.0 ± 10.6 μg·m−3), followed by grade 6. As a whole, Figure 9 indicates that the particulate pollution was dominated by fine particles, a typical aerosol pollution type.

4. Conclusions

Based on the data for aerosol concentration and optical characteristics measured between December 2009 and March 2011 and the physical and chemical characteristics of aerosol samples collected in winter, the pollution characteristics of local aerosols were analyzed, and the influence of meteorological conditions on local pollution was analyzed by means of posterior trajectory clustering analysis. The effects of physicochemical properties of aerosol particles of different particle sizes on atmospheric extinction were also discussed. The results are as follows.
In spring, the aerosol concentration decreases as a result of air flow from the desert region, resulting in aerosol particles becoming coarser. In summer, clean air flow, through wind speed, influences aerosol concentration. In autumn, the aerosol mass concentration is greater than in summer and the air flowing from the desert region changes the aerosol concentration distribution, but the aerosol concentration does not change much, which indicates that the dust aerosol transported to this area is limited.
Seasonal pattern analyses reveal that PM1.0, PM2.5 and PM10 show significantly higher levels during the colder months, with minimum levels in summer. This pattern is mainly attributed to lower mixing-layer heights, limited potential for oxidation, and lower emissions from domestic heating. The volatilization of semi-volatile aerosol compounds during the warmer seasons is another reason for this PM behavior. On the contrary, ozone exhibits opposite seasonality, with maxima in the summer due to its increased generation through photochemical processes.
Because of the instability of the observation instrument, resulting in the lack or distortion of the data, there may be some deviation in the results of this study We will minimize the uncertainty caused by the observation instrument in the future, so as to obtain more accurate real analysis results.

Supplementary Materials

The following are available online at https://www.mdpi.com/1660-4601/16/3/396/s1, Table S1: Categories of air based on air quality index (AQI).

Author Contributions

X.M. and G.Y. worked together in forming the ideas for this paper; X.M., H.Z. and Y.W. worked together in calculating and writing this manuscript; X.M, Z.P. and H.W. provided supervision during the whole process.

Funding

This research was financially supported by the national key R&D program of China (No.2018YFA0606303) and the National Science Foundation of China (41701076).

Conflicts of Interest

The authors declare no conflict of interest.

References

  1. Porter, J.N.; Clarke, A.D. Aerosol size distribution models based on in situ measurements. J. Geophys. Res. Atmos. 1997, 102, 6035–6045. [Google Scholar] [CrossRef] [Green Version]
  2. Barthelmie, R.J.; Pryor, S.C. Implications of ammonia emissions for fine aerosol formation and visibility impairment: A case study from the Lower Fraser Valley, British Columbia. Atmos. Environ. 1998, 32, 345–352. [Google Scholar] [CrossRef]
  3. Sánchez-Ccoyllo, O.R.; Fátima Andrade, M. The influence of meteorological conditions on the behavior of pollutants concentrations in São Paulo, Brazil. Environ. Pollut. 2002, 116, 257–263. [Google Scholar] [CrossRef]
  4. Chow, J.C.; Watson, J.G.; Fujita, E.M. Temporal and spatial variations of PM2.5 and PM10 aerosol in the Southern California air quality study. Atmos. Environ. 1994, 28, 2061–2080. [Google Scholar] [CrossRef]
  5. Wang, Y.; Zhuang, G.; Sun, Y. The variation of characteristics and formation mechanisms of aerosols in dust, haze, and clear days in Beijing. Atmos. Environ. 2006, 40, 6579–6591. [Google Scholar] [CrossRef]
  6. Seaman, N.L. Meteorological modeling for air-quality assessments. Atmos. Environ. 2000, 34, 2231–2259. [Google Scholar] [CrossRef]
  7. Chan, Y.C.; Simpson, R.W.; Mctainsh, G.H.; Vowles, P.D.; Cohen, D.D.; Bailey, G.M. Source apportionment of PM2.5 and PM10 aerosols in Brisbane (Australia) by receptor modelling. Atmos. Environ. 1999, 33, 3251–3268. [Google Scholar] [CrossRef]
  8. Sawant, A.A.; Na, K.; Zhu, X.; Iii, D.R.C. Chemical characterization of outdoor PM2.5 and gas-phase compounds in Mira Loma, California. Atmos. Environ. 2004, 38, 5517–5528. [Google Scholar] [CrossRef]
  9. Lu, X.; Lin, C.; Li, W.; Chen, Y.; Huang, Y.; Fung, J.C.H. Analysis of the adverse health effects of PM2.5 from 2001 to 2017 in china and the role of urbanization in aggravating the health burden. Sci. Total Environ. 2019, 652, 683–695. [Google Scholar] [CrossRef]
  10. Roberto, S.R.; Luis, J.L.; Libia, P.; Maria, G.B.R. Effects of climate change on the health of citizens modelling urban weather and air pollution. Energy 2018, 165, 53–62. [Google Scholar]
  11. Zhang, C.; Quan, Z.Y.; Wu, Q.C.; Jin, Z.Z.; Joseph, H.; Lee, J.; Li, C.H.; Zheng, Y.X.; Cui, L.H. Association between Atmospheric Particulate Pollutants and Mortality for Cardio-Cerebrovascular Diseases in Chinese Korean Population: A Case-Crossover Study. Int. J. Environ. Res. Public Health 2018, 15, 2835. [Google Scholar] [CrossRef] [PubMed]
  12. Elmes, M.; Gasparon, M. Sampling and single particle analysis for the chemical characterisation of fine atmospheric particulates: A review. J. Environ. Manag. 2017, 202, 137–150. [Google Scholar] [CrossRef] [PubMed]
  13. Sungroul, K.; Sol, Y.; Dongmin, Y. Spatiotemporal association of real-time concentrations of black carbon (BC) with fine particulate matters (PM2.5) in urban hotspots of South Korea. Int. J. Environ. Res. Public Health 2017, 14, 1350. [Google Scholar]
  14. Li, L.; Lei, Y.; Pan, D.; Yu, C.; Si, C. Economic evaluation of the air pollution effect on public health in China’s 74 cities. SpringerPlus 2016, 5, 402. [Google Scholar] [CrossRef] [PubMed]
  15. Schiavon, M.; Redivo, M.; Antonacci, G. Assessing the air quality impact of nitrogen oxides and benzene from road traffic and domestic heating and the associated cancer risk in an urban area of Verona (Italy). Atmos. Environ. 2015, 120, 234–243. [Google Scholar] [CrossRef]
  16. Cristina, M.; Marco, C.; Emilio, G. Secondary particulate matter originating from an industrial source and its impact on population health. Int. J. Environ. Res. Public Health 2015, 12, 7667–7681. [Google Scholar]
  17. Schiavon, M.; Antonacci, G.; Rada, E.C.; Ragazzi, M.; Zardi, D. Modelling human exposure to air pollutants in an urban area. Rev. Chim. 2014, 65, 61–64. [Google Scholar]
  18. O’Connor, S.; O’Connor, P.F.; Feng, H.A.; Ashley, K. Gravimetric analysis of particulate matter using air samplers housing internal filtration capsules. Gefahrst. Reinhalt. Luft 2014, 74, 403–410. [Google Scholar] [PubMed]
  19. Vincenzo, T.; Massimo, R.; Sabrina, C.; Elena, C.; Marco, R.; Gabriela, I.; Tiberiu, A.; Adrian, B. Application of strategies for particulate matter reduction in urban areas: An Italian case. UPB Sci. Bull. Ser. D Mech. Eng. 2013, 75, 221–228. [Google Scholar]
  20. Gabriela, I.; Tiberiu, A.; Elena, C.; Rada, M.; Vincenzo, T. Critical analysis of strategies for PM reduction in urban areas. UPB Sci. Bull. Ser. D Mech. Eng. 2013, 75, 175–186. [Google Scholar]
  21. Clark, N.A.; Allen, R.W.; Hystad, P.; Wallace, L.; Dell, S.D.; Foty, R.; Dabek-Zlotorzynska, E.; Evans, G.; Wheeler, A.J. Exploring variation and predictors of residential fine particulate matter infiltration. Int. J. Environ. Res. Public Health 2010, 7, 3211–3224. [Google Scholar] [CrossRef] [PubMed]
  22. Mintz, D. Technical Assistance Document for the Reporting of Daily Air Quality—The Air Quality Index (AQI). Tech. Research Triangle Park, US Environmental Protection Agency. Catalogue of Rules and Regulations of Urumqi Municipal People’s Government. 2009. Available online: http://www.urumqi.gov.cn/gk/gzzd/gzzd/345058.htm (accessed on 17 April 2017).
  23. Royalty, T.M.; Phillips, B.N.; Dawson, K.W.; Reed, R.; Meskhidze, N.; Petters, M.D. Aerosol properties observed in the subtropical north pacific boundary layer. J. Geophys. Res. Atmos. 2017, 122, 9990–10012. [Google Scholar] [CrossRef]
  24. Shen, R.; Klaus, S.; Jürgen, S.K.; Shao, L.; Norra, S.; Kramar, U.; Bernhard, M.; Gülcin, A.; Thorsten, S.; Ralf, Z.; et al. Seasonal variability and source distribution of haze particles from a continuous one-year study in Beijing. Atmos. Pollut. Res. 2018, 9, 627–633. [Google Scholar] [CrossRef]
  25. Wang, G.; Deng, T.; Tan, H.; Liu, X.; Yang, H. Research on aerosol profiles and parameterization scheme in southeast China. Atmos. Environ. 2016, 140, 605–613. [Google Scholar] [CrossRef]
  26. Xia, Y.; Tao, J.; Zhang, L.; Zhang, R.; Li, S.; Wu, Y.K.; Xiong, Z. Impact of size distributions of major chemical components in fine particles on light extinction in urban Guangzhou. Sci. Total Environ. 2017, 587, 240–247. [Google Scholar] [CrossRef] [PubMed]
  27. Zhang, J.; Reid, J.S.; Alfaro-Contreras, R.; Xian, P. Has china been exporting less particulate air pollution over the past decade? Geophys. Res. Lett. 2017, 44, 2941–2948. [Google Scholar] [CrossRef]
  28. Sindosi, O.A.; Katsoulis, B.D.; Bartzokas, A. An objective definition of air mass types affecting Athens, Greece; the corresponding atmospheric pressure patterns and air pollution levels. Environ. Technol. 2003, 24, 947–962. [Google Scholar] [CrossRef] [PubMed]
  29. James, F.S.; Malm, W.C. The relative importance of soluble aerosols to spatial and seasonal trends of impaired visibility in the United States. Atmos. Environ. 1994, 28, 851–862. [Google Scholar]
  30. MEP. Technical Regulation on Ambient Air Quality Index (on Trial). Available online: http://kjs.mee.gov.cn/hjbhbz/bzwb/jcffbz/201203/W020120410332725219541.pdf (accessed on 1 January 2016).
  31. Jin, L.; Wei, Z. The influence of the environment and clothing on human exposure to ultraviolet light. PLoS ONE 2015, 10, e0124758. [Google Scholar]
  32. Real-Time Air Quality Index (AQI) Monitoring Network. Available online: http://aqicn.org/city/wulumuqi (accessed on 11 March 2003).
  33. Chow, J.C.; Watson, J.G.; Lowenthal, D.H.; Solomon, P.A.; Magliano, K.L.; Ziman, S.D.; Richards, L.W. PM10 and PM2.5 Compositions in California’s San Joaquin Valley. Aerosol Sci. Technol. 1993, 18, 105–128. [Google Scholar] [CrossRef]
  34. Chow, J.C.; Fairley, D.; Watson, J.G.; Demandel, R.; Fujita, E.M.; Lowenthal, D.H.; Lu, Z.Q.; Frazier, C.A.; Long, G.; Cordova, J. Source Apportionment of Wintertime PM 10 at San Jose, Calif. J. Environ. Eng. 1995, 121, 378–387. [Google Scholar] [CrossRef]
  35. Rattigan, O.V.; Hogrefe, O.; Felton, H.D.; Schwab, J.J.; Roychowdhury, U.K.; Husain, L.; Demerjian, K.L. Multi-year urban and rural semi-continuous PM2.5 sulfate and nitrate measurements in New York state: Evaluation and comparison with filter based measurements. Atmos. Environ. 2006, 40, 192–205. [Google Scholar] [CrossRef]
  36. Mamtimin, B.; Meixner, F.X. Air pollution and meteorological processes in the growing dryland city of Urumqi (Xinjiang, China). Sci. Total Environ. 2011, 409, 1277–1290. [Google Scholar] [CrossRef] [PubMed]
  37. Buchanan, C.M.; Beverland, I.J.; Heal, M.R. The influence of weather-type and long-range transport on airborne particle concentrations in Edinburgh, UK. Atmos. Environ. 2002, 36, 5343–5354. [Google Scholar] [CrossRef] [Green Version]
  38. Chow, J.C.; Watson, J.G.; Kuhns, H.; Etyemezian, V.; Lowenthal, D.H.; Crow, D.; Steven, D.K.; Johann, P.; Engelbrecht, M.C. Source profiles for industrial, mobile, and area sources in the Big Bend Regional Aerosol Visibility and Observational study. Chemosphere 2004, 54, 185–208. [Google Scholar] [CrossRef] [PubMed]
  39. Cheng, C.S.; Campbell, M.; Li, Q.; Li, G.; Auld, H.; Day, N. A synoptic climatological approach to assess climatic impact on air quality in south-central Canada. Part II: Future estimates. Water Air Soil Pollut. 2007, 182, 117–130. [Google Scholar] [CrossRef]
  40. Cheng, S.; Campbell, M.; Li, Q.; Li, G.; Auld, H.; Day, N.; Pengelly, D.; Gingrich, S.; Yap, D. Analysis of a summertime PM2.5 and haze episode in the mid-Atlantic region. J. Air Waste Manag. Assoc. 2003, 53, 946–956. [Google Scholar] [CrossRef]
  41. Zoras, S.; Triantafyllou, A.G.; Deligiorgi, D. Atmospheric stability and PM10 concentrations at far distance from elevated point sources in complex terrain: Worst-case episode study. J. Environ. Manag. 2006, 80, 295–302. [Google Scholar] [CrossRef]
  42. Batchvarova, E.; Gryning, S.E. Wind climatology, atmospheric turbulence and internal boundary-layer development in Athens during the MEDCAPHOT-TRACE experiment. Atmos. Environ. 1998, 32, 2055–2069. [Google Scholar] [CrossRef]
  43. Urumqi Air Quality Index Map. Available online: http://aqidb.org/us/city/wulumuqi/ (accessed on 12 April 2003).
  44. Kaiser, A. Origin of polluted air masses in the Alps. An overview and first results for MONARPOP. Environ. Pollut. 2009, 157, 3232–3237. [Google Scholar] [CrossRef]
  45. Petra, S.; Hendrik, F.; Bruno, N.; Baumle, M.; Trick, T. South foehn and ozone in the Eastern Alps—Case study and climatological aspects. Atmos. Environ. 2000, 34, 1379–1394. [Google Scholar]
  46. Wotawa, G.; Kroger, H.; Stohl, A. Transport of ozone towards the Alps—Results from trajectory analyses and photochemical model studies. Atmos. Environ. 2000, 34, 1367–1377. [Google Scholar] [CrossRef]
  47. Vingarzan, R. A review of surface ozone background levels and trends. Atmos. Environ. 2004, 38, 3431–3442. [Google Scholar] [CrossRef]
  48. Nobuo, S.; Atsushi, S.; Ichiro, M.; Masataka, N. A method for estimating the fraction of mineral dust in particulate matter using PM2.5-to-PM10 ratios. Particuology 2016, 28, 114–120. [Google Scholar]
  49. Ehrlich, C.; Noll, G.; Kalkoff, W.D.; Baumbach, G.; Dreiseidler, A. PM10, PM2.5 and PM1.0—Emissions from industrial plants—Results from measurement programmers in Germany. Atmos. Environ. 2007, 41, 6236–6254. [Google Scholar] [CrossRef]
Figure 1. The geographical location of the study area and the observation instruments placed in the study area. (a). Location of the Urumqi city (Xinjiang, China) sampling station. (b). The EDM 180 (GRIMM, Ainring, Germany), provide simultaneous measurement of PM1.0, PM10 and PM2.5 with low maintenance, fast response (6 sec), real-time monitoring, insensitivity to vibration (mobile) and lowest ownership cost for this research. (c). The FA-3 aerosol cascade sampler.
Ijerph 16 00396 g001
Figure 2. Average monthly PM10 mass concentration over the period 2004–2010.
Ijerph 16 00396 g002
Figure 3. Average monthly percentage of PM10 over the period 2004–2010.
Ijerph 16 00396 g003
Figure 4. Yearly average mass concentration of PM10 (2004–2010).
Ijerph 16 00396 g004
Figure 5. Seasonal average mass concentration of PM10.
Ijerph 16 00396 g005
Figure 6. Diurnal changes of PM2.5/PM10, PM1.0/PM10, PM1.0/PM2.5 mass concentrations over the four seasons.
Ijerph 16 00396 g006
Figure 7. Seasonal ratios of PM2.5/PM10, PM1.0/PM10, PM1.0/PM2.5.
Ijerph 16 00396 g007
Figure 8. Monthly ratios of PM2.5/PM10, PM1.0/PM10, and PM1.0/PM2.5.
Ijerph 16 00396 g008
Figure 9. The mass concentration distribution across the nine particle diameter grades in winter.
Ijerph 16 00396 g009
Table 1. Formulas for transforming API into PM10 mass concentrations.
API<5051–100101–200201–300301–400401–500
Air quality gradeexcellentgoodlight pollutionmoderate pollutionsevere pollutionsevere pollution
PM10
concentration
C = API
R2 = 1.0
C = 2API − 50
R2 = 1.0
C = 2API − 50
R2 = 0.98
C = 0.7API + 210
R2 = 0.99
C = 0.8API + 180
R2 = 0.69
C = API + 100
R2 = 1.0
Table 2. Annual variations in PM10 mass concentration.
YearPercentage of Total Number of Days *(%)Average Daily Minimum Concentration
(μg·m−3)
Average Daily Maximum Concentration
(μg·m−3)
Average Annual Concentration
(μg·m−3)
Standard Deviation
(μg·m−3)
200473.2%14600124.6123.3
200569.9%15600119.3140.6
200687.9%24600137.9127.8
200789.0%24600141.3124.7
200883.1%27600148.6117.4
200989.3%18600144.3116.9
201083.5%25536140.584.4
* Number of days of major air pollutant per year as a proportion of total days.
Table 3. Particle diameter grade.
Grades012345678
Range9.0–10 μm5.8–9.0 μm4.7–5.8 μm3.3–4.7 μm2.1–3.3 μm1.1–2.1 μm0.7–1.1 μm0.43–0.65 μm100–1000 nm

