Computed Tomography Assessment of Brain Atrophy in Centenarians


Abstract
:1. Introduction
2. Materials and Methods
3. Results
4. Discussion
5. Conclusions
Author Contributions
Funding
Conflicts of Interest
References
- Department of Economic and Social Affairs. World Population Prospects: The 2017 Revision; Population Division: New York, NY, USA, 2017. [Google Scholar]
- Robine, J.M.; Cubaynes, S. Worldwide demography of centenarians. Mech. Ageing Dev. 2017, 165, 59–67. [Google Scholar] [CrossRef] [PubMed]
- DeCarli, C.; Massaro, J.; Harvey, D.; Hald, J.; Tullberg, M.; Au, R.; Beiser, A.; D’Agostino, R.; Wolf, P.A. Measures of brain morphology and infarction in the framingham heart study: Establishing what is normal. Neurobiol. Aging 2005, 26, 491–510. [Google Scholar] [CrossRef] [PubMed]
- Wilson, R.S.; Beckett, L.A.; Bennett, D.A.; Albert, M.S.; Evans, D.A. Change in cognitive function in older persons from a community population: Relation to age and Alzheimer disease. Arch. Neurol. 1999, 56, 1274–1279. [Google Scholar] [CrossRef] [PubMed]
- Lockhart, S.; DeCarli, C. Structural Imaging Measures of Brain Aging. Neuropsychol. Rev. 2014, 24, 271–289. [Google Scholar] [CrossRef] [PubMed] [Green Version]
- Meese, W.; Kluge, W.; Grumme, T.; Hopfenmüller, W. CT evaluation of the CSF spaces of healthy persons. Neuroradiology 1980, 19, 131–136. [Google Scholar] [CrossRef] [PubMed]
- Goldstein, S.J.; Wekstein, D.R.; Kirkpatrick, C.; Lee, C.; Markesbery, W.R. Imaging the centenarian brain. A computed tomographic study. J. Am. Geriatr. Soc. 1985, 33, 579–584. [Google Scholar] [CrossRef] [PubMed]
- Horvath, S.; Mah, V.; Lu, A.T.; Woo, J.S.; Choi, O.W.; Jasinska, A.J.; Riancho, J.A.; Tung, S.; Coles, N.S.; Braun, J.; et al. The cerebellum ages slowly according to the epigenetic clock. Aging 2015, 7, 294–306. [Google Scholar] [CrossRef] [PubMed] [Green Version]
- Fraser, H.B.; Khaitovich, P.; Plotkin, J.B.; Pääbo, S.; Eisen, M.B. Aging and gene expression in the primate brain. PLoS Biol. 2005, 3, 1653–1661. [Google Scholar] [CrossRef] [PubMed]
- Fotenos, A.F.; Snyder, A.Z.; Girton, L.E.; Morris, J.C.; Buckner, R.L. Normative estimates of cross-sectional and longitudinal brain volume decline in aging and AD. Neurology 2005, 64, 1032–1039. [Google Scholar] [CrossRef] [PubMed]
- Raz, N.; Lindenberger, U.; Rodrigue, K.M.; Kennedy, K.M.; Head, D.; Williamson, A.; Dahle, C.; Gerstorf, D.; Acker, J.D. Regional brain changes in aging healthy adults: General trends, individual differences and modifiers. Cereb. Cortex 2005, 15, 1676–1689. [Google Scholar] [CrossRef] [PubMed]
- Lemaitre, H.; Goldman, A.L.; Sambataro, F.; Verchinski, B.A.; Meyer-Lindenberg, A.; Weinberger, D.R.; Mattay, V.S. Normal age-related brain morphometric changes: Nonuniformity across cortical thickness, surface area and gray matter volume? Neurobiol. Aging 2012, 33, 617–626. [Google Scholar] [CrossRef] [PubMed]
- van Velsen, E.F.; Vernooij, M.W.; Vrooman, H.A.; Lugt, A.; Breteler, M.M.; Hofman, A.; Niessen, W.J.; Ikram, M.A. Brain cortical thickness in the general elderly population: The Rotterdam Scan Study. Neurosci. Lett. 2013, 550, 189–194. [Google Scholar] [CrossRef] [PubMed]
- Jack, C.R., Jr.; Knopman, D.S.; Jagust, W.J.; Petersen, R.C.; Weiner, M.W.; Aisen, P.S.; Shaw, L.M.; Vemuri, P.; Wiste, H.J.; Weigand, S.D.; et al. Tracking pathophysiological processes in Alzheimer’s disease: An updated hypothetical model of dynamic biomarkers. Lancet Neurol. 2013, 12, 207–216. [Google Scholar] [CrossRef]
- Raz, N.; Gunning-Dixon, F.; Head, D.; Rodrigue, K.M.; Williamson, A.; Acker, J.D. Aging, sexual dimorphism, and hemispheric asymmetry of the cerebral cortex: Replicability of regional differences in volume. Neurobiol. Aging 2004, 25, 377–396. [Google Scholar] [CrossRef]
- Pfefferbaum, A.; Rohlfing, T.; Rosenbloom, M.J.; Chu, W.; Colrain, I.M.; Sullivan, E.V. Variation in longitudinal trajectories of regional brain volumes of healthy men and women (ages 10 to 85 years) measured with atlas-based parcellation of MRI. Neuroimage 2013, 65, 176–193. [Google Scholar] [CrossRef] [PubMed]
- Yang, Z.; Wen, W.; Jiang, J.; Crawford, J.D.; Reppermund, S.; Levitan, C.; Slavin, M.J.; Kochan, N.A.; Richmond, R.L.; Brodaty, H.; et al. Age-associated differences on structural brain MRI in nondemented individuals from 71 to 103 years. Neurobiol. Aging 2016, 40, 86–97. [Google Scholar] [CrossRef] [PubMed]
- Walhovd, K.B.; Westlye, L.T.; Amlien, I.; Espeseth, T.; Reinvang, I.; Raz, N.; Agartz, I.; Salat, D.H.; Greve, D.N.; Fischl, B.; et al. Consistent neuroanatomical age-related volume differences across multiple samples. Neurobiol. Aging 2011, 32, 916–932. [Google Scholar] [CrossRef] [PubMed] [Green Version]
- Braak, H.; Thal, D.R.; Ghebremedhin, E.; Del Tredici, K. Stages of the pathologic process in Alzheimer disease: Age categories from 1 to 100 years. J. Neuropathol. Exp. Neurol. 2011, 70, 960–969. [Google Scholar] [CrossRef] [PubMed]
- Gong, Z.; Lu, J.; Chen, J.; Wang, Y.; Yuan, Y.; Zhang, T.; Guo, L.; Miller, L.S. Ventricle Shape Analysis for Centenarians, Elderly Subjects, MCI and AD Patients. In Multimodal Brain Image Analysis. MBIA 2011. Lecture Notes in Computer Science; Springer: Berlin, Heidelberg, Germany, 2011; pp. 84–92. [Google Scholar]
- Ganz, A.B.; Beker, N.; Hulsman, M.; Sikkes, S.; Netherlands Brain Bank; Scheltens, P.; Smit, A.B.; Rozemuller, A.J.M.; Hoozemans, J.J.M.; Holstege, H. Neuropathology and cognitive performance in self-reported cognitively healthy centenarians. Acta. Neuropathol. Commun. 2018, 6, 64–77. [Google Scholar] [CrossRef] [PubMed]


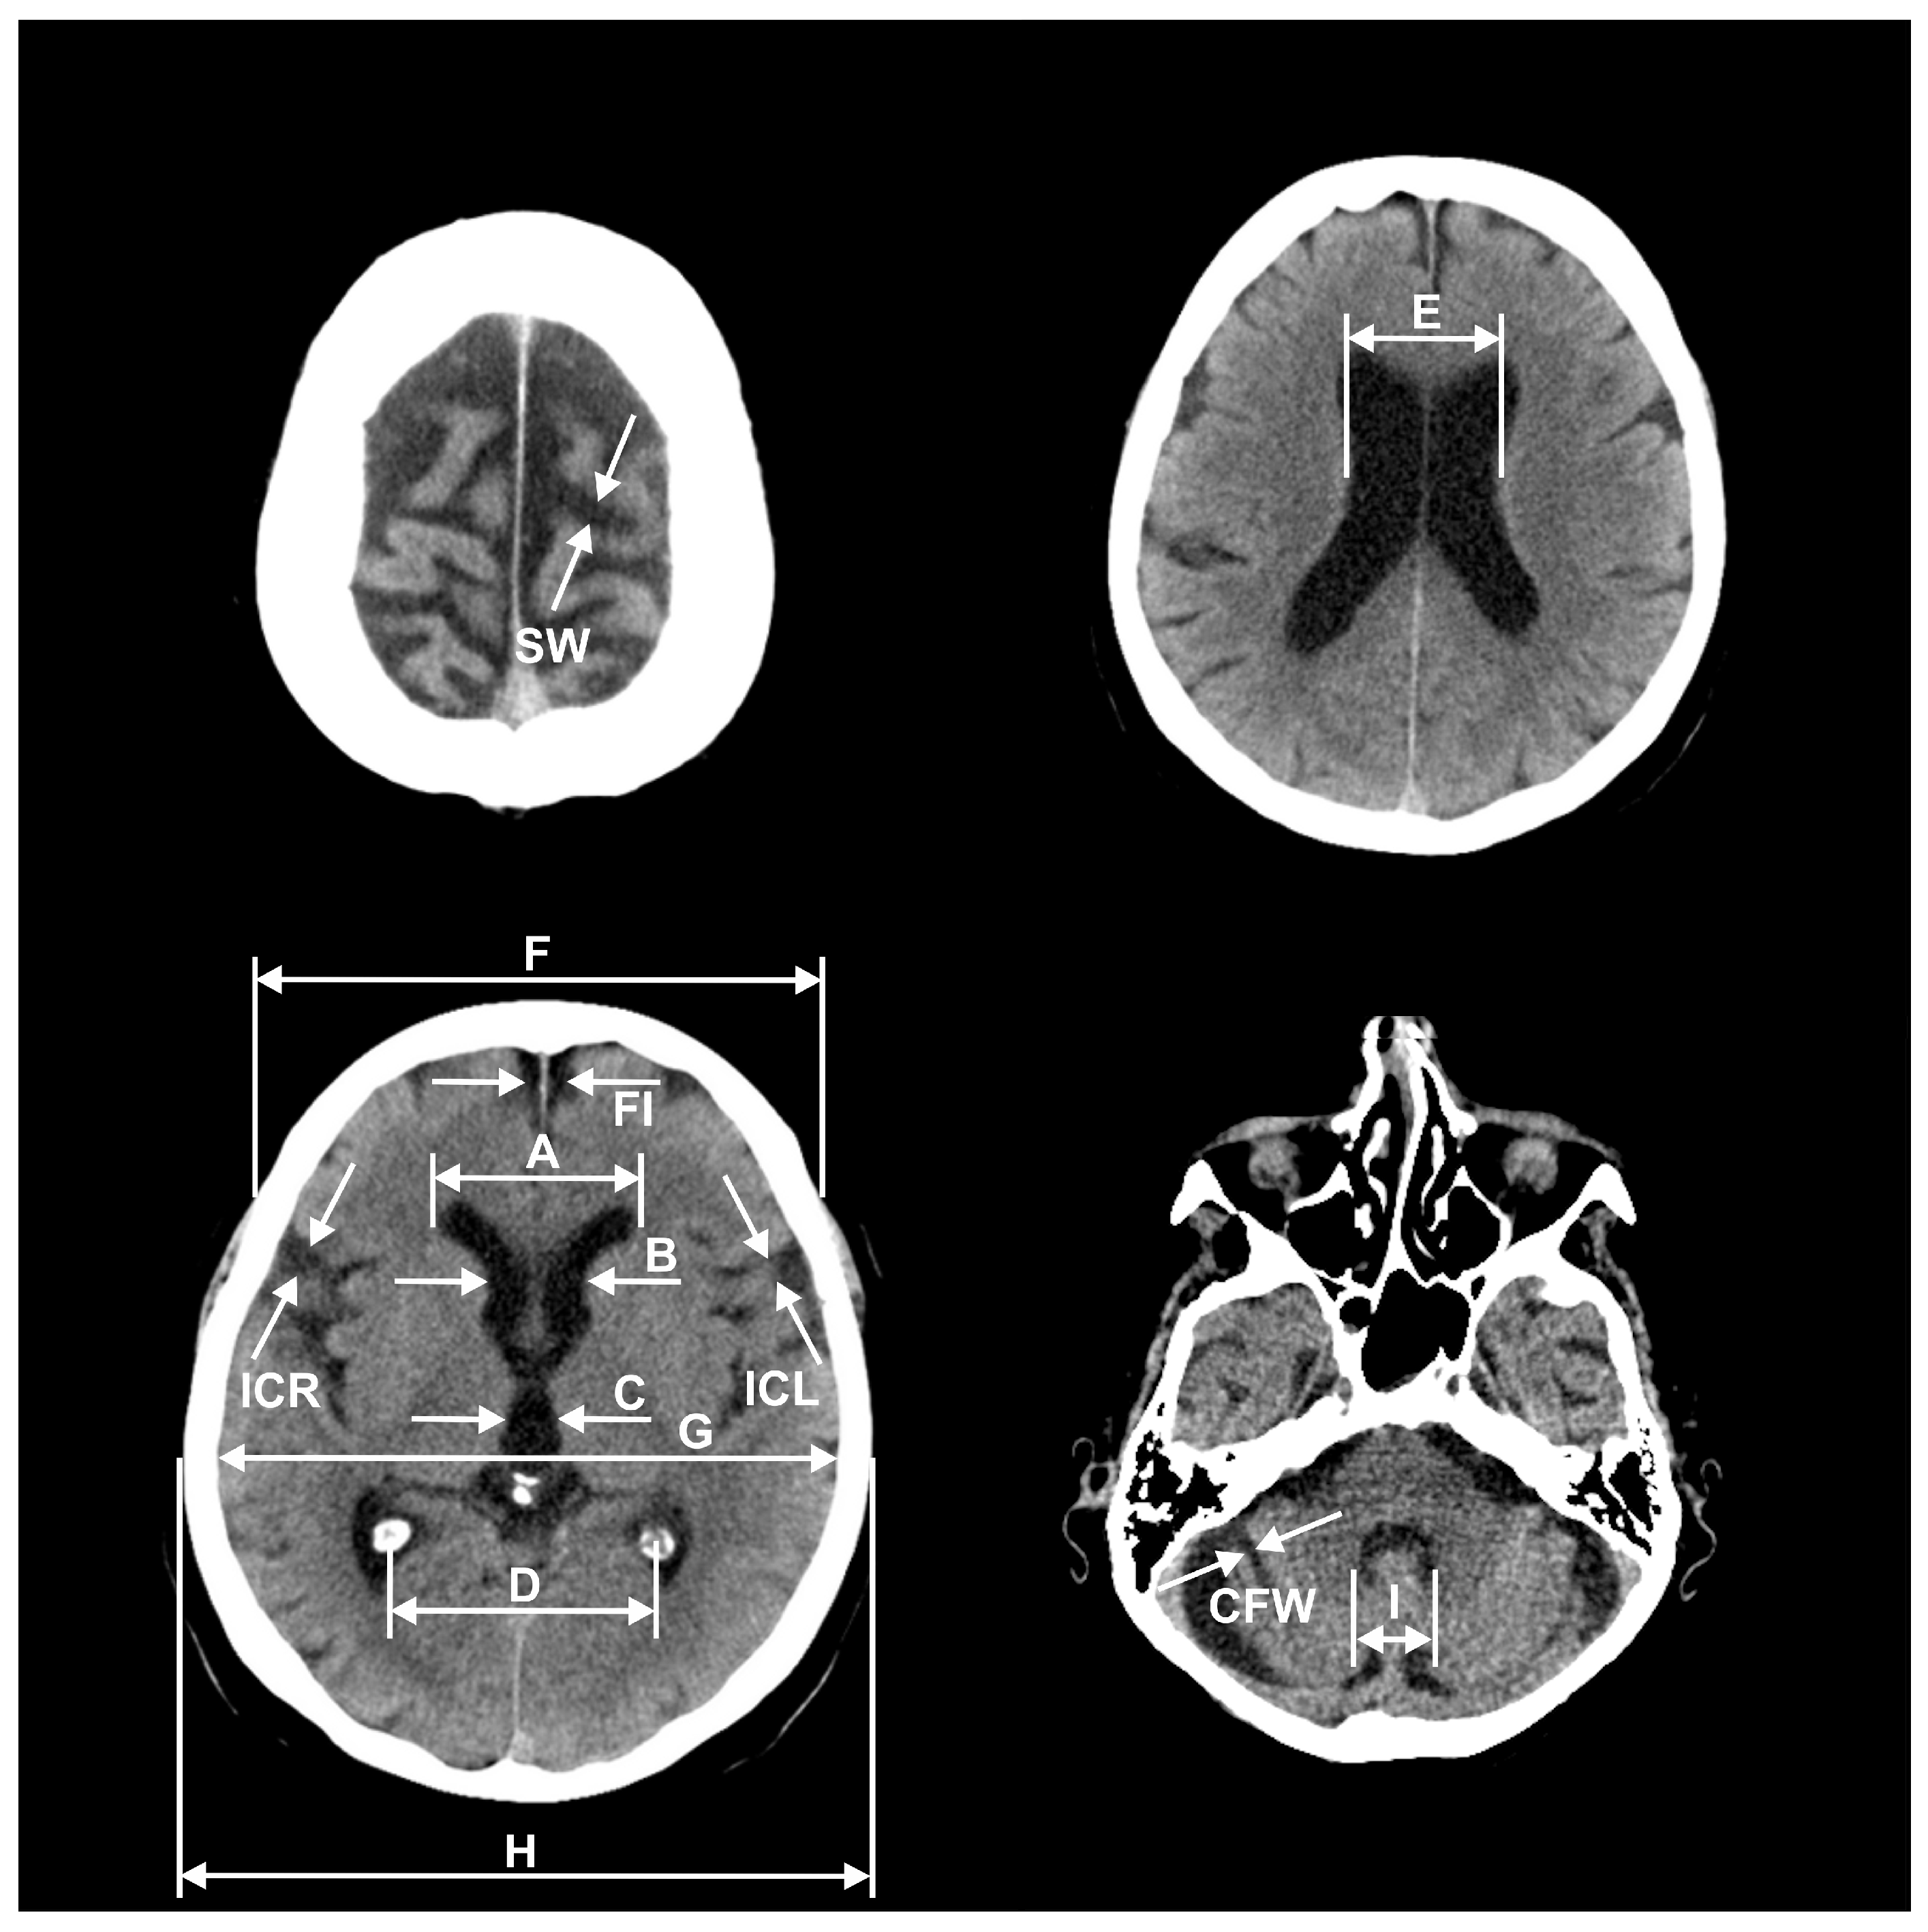
| Parameters | 100–106 Years Old | 90–99 Years Old | 80–89 Years Old | 70–79 Years Old | 70–99 Years Old |
|---|---|---|---|---|---|
| Age [years] | 101.52 (100–106, SD 1.75) | 92.63 (90–97, SD 2.24) | 83.63 (80–88, SD 2.77) | 74.33 (70–78, SD 2.56) | 83.53 (70–97, SD 7.92) |
| A [mm] | 43.00 (33–55, SD 6.13) | 38.77 (33–46, SD 3.80) | 38.17 (30–50, SD 5.27) | 37.20 (24–46, SD 5.41) | 38.04 (24–50, SD 4.87) |
| B [mm] | 25.74 (18–33, SD 4.17) | 24.80 (17–31, SD 3.77) | 22.43 (14–28, SD 3.60) | 20.70 (11–30, SD 4.68) | 22.64 (11–31, SD 4.34) |
| C [mm] | 11.48 (7–19, SD 2.71) | 11.80 (8–16, SD 2.59) | 10.77 (5–16, SD 2.84) | 8.70 (4–19, SD 3.34) | 10.42 (4–19, SD 3.18) |
| D [mm] | 57.43 (47–68, SD 6.01) | 58.67 (49–66, SD 4.60) | 59.07 (48–68, SD 5.36) | 58.37 (51–72, SD 4.99) | 58.70 (48–72, SD 4.94) |
| E [mm] | 34.91 (25–47, SD 5.58) | 35.73 (23–49, SD 5.97) | 35.97 (24–53, SD 7.14) | 29.53 (18–46, SD 6.46) | 33.74 (18–53, SD 7.13) |
| F [mm] | 124.43 (114–138, SD 5.17) | 125.90 (119–138, SD 5.09) | 125.03 (116–144, SD 6.67) | 126.67 (117–139, SD 5.47) | 125.87 (116–144, SD 5.75) |
| G [mm] | 132.87 (127–146, SD 5.26) | 134.97 (127–151, SD 5.25) | 132.97 (120–144, SD 6.67) | 135.80 (126–147, SD 6.44) | 134.58 (120–151, SD 6.20) |
| H [mm] | 147.35 (141–158, SD 4.84) | 149.70142–162, SD 5.40) | 146.57 (129–158, SD 7.21) | 150.23 (139–164, SD 7.05) | 148.83 (129–164, SD 6.73) |
| FI [mm] | 8.87 (4–14, SD 2.32) | 8.50 (4–13, SD 2.13) | 7.20 (3–13, SD 2.47) | 6.00 (3–12, SD 2.02) | 7.23 (3–13, SD 2.42) |
| ICR [mm] | 11.35 (7–16, SD 2.44) | 10.30 (7–15, SD 1.99) | 8.03 (4–14, SD 2.70) | 7.17 (3–12, SD 2.45) | 8.50 (3–15, SD 2.72) |
| ICL [mm] | 11.83 (8–17, SD 2.61) | 10.53 (7–15, SD 2.27) | 8.70 (4–15, SD 2.88) | 7.33 (4–11, SD 2.31) | 8.86 (4–15, SD 2.80) |
| SW [mm] | 7.30 (5–11, SD 1.77) | 6.57 (4–9, SD 1.43) | 5.60 (2–10, SD 1.85) | 5.47 (3–11, SD 1.87) | 5.88 (2–11, SD 1.78) |
| I [mm] | 16.48 (12–22, SD 2.31) | 16.53 (12–22, SD 2.50) | 16.80 (13–25, SD 2.70) | 15.80 (11–22, SD 2.81) | 16.38 (11–25, SD 2.68) |
| CFW [mm] | 3.83 (1–7, SD 1.70) | 3.37 (2–6, SD 1.13) | 2.87 (1–6, SD 1.41) | 2.60 (1–6, SD 1.52) | 2.94 (1–6, SD 1.39) |
| F/A frontal horn index | 2.94 (2.24–3.82, SD 0.40) | 3.27 (2.80–3.97, SD 0.30) | 3.33 (2.5–4.1, SD 0.40) | 3.47 (2.66–5, SD 0.52) | 3.36 (2.5–5, SD 0.42) |
| A/G Evans index | 0.32 (0.25–0.41, SD 0.04) | 0.29 (0.24–0.34, SD 0.03) | 0.29 (0.22–0.36, SD 0.04) | 0.27 (0.19–0.35, SD 0.04) | 0.28 (0.19–0.36, SD 0.03) |
| D/A ventricular index | 1.36 (1.06–2.00, SD 0.22) | 1.53 (1.16–1.82, SD 0.17) | 1.57 (1.24–1.91, SD 0.19) | 1.60 (1.18–2.33, SD 0.28) | 1.56 (1.16–2.33, SD 0.22) |
| H/E cella media Schiersmann index | 4.32 (3.24–5.80, SD 0.66) | 4.29 (3.29–6.39, SD 0.69) | 4.23 (2.83–6.08, SD 0.83) | 5.32 (3.26–8.11, SD 1.14) | 4.61 (2.83–8.11, SD 1.03) |
| A + B Huckman number [mm] | 68.74 (52–88, SD 10.01) | 63.57 (51–77, SD 7.07) | 60.60 (46–78, SD 7.98) | 57.90 (35–74, SD 9.64) | 60.69 (35–78, SD 8.53) |
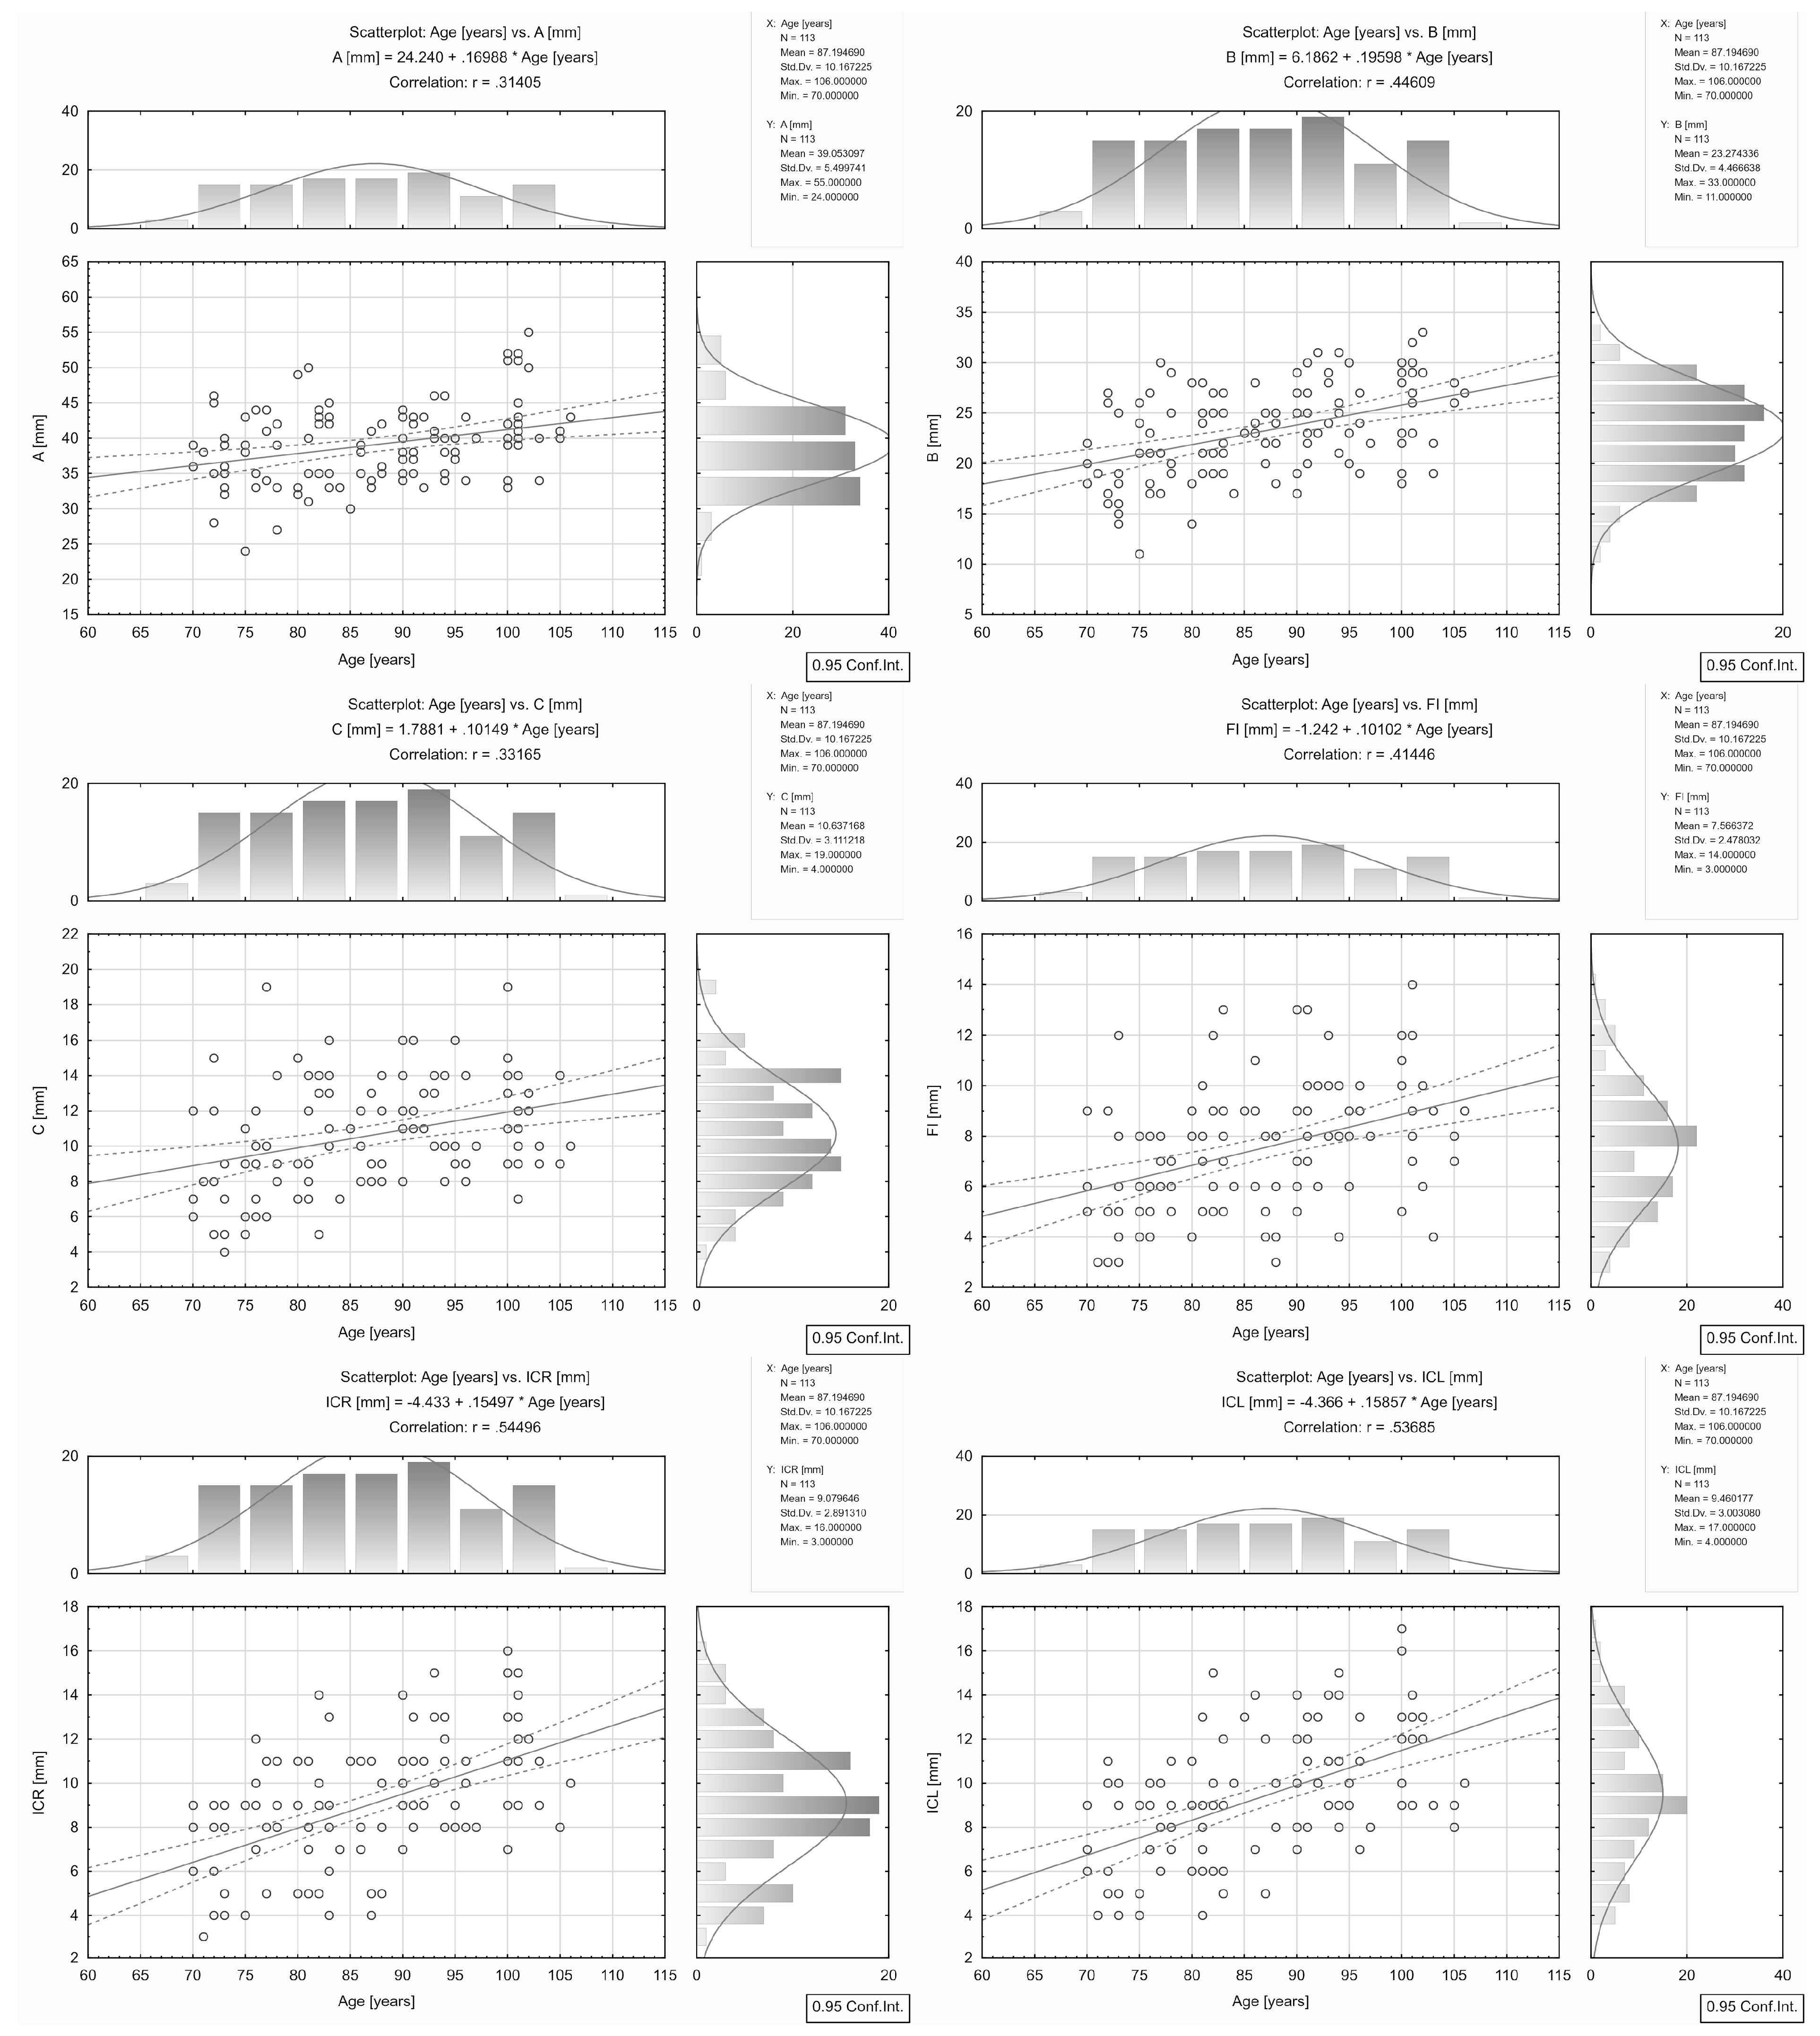
| Brain Atrophy Parameter/Index | Correlation Linear Formula | Correlation r Coefficient | p |
|---|---|---|---|
| A [mm] | 24.2400 + 0.1699 * Age | 0.31 | 0.001 |
| B [mm] | 6.1862 + 0.1960 * Age | 0.45 | 0.0001 |
| C [mm] | 1.7881 + 0.1015 * Age | 0.33 | 0.0001 |
| D [mm] | 63.9310 − 0.0629 * Age | −0.12 | 0.192 |
| E [mm] | 18.6610 + 0.1757 * Age | 0.26 | 0.005 |
| FI [mm] | −1.2420 + 0.1010 * Age | 0.41 | 0.0001 |
| ICR [mm] | −4.4330 + 0.1550 * Age | 0.54 | 0.0001 |
| ICL [mm] | −4.3660 + 0.1586 * Age | 0.54 | 0.0001 |
| SW [mm] | −0.0926 + 0.0718 * Age | 0.39 | 0.0001 |
| I [mm] | 14.6570 + 0.0200 * Age | 0.08 | 0.410 |
| CFW [mm] | −0.7417 + 0.0443 * Age | 0.30 | 0.001 |
| F/A frontal horn index | 4.7410 − 0.0168 * Age | −0.38 | 0.0001 |
| A/G Evans index | 0.1598 + 0.0015 * Age | 0.39 | 0.0001 |
| D/A ventricular index | 2.2436 − 0.0083 * Age | −0.36 | 0.0001 |
| H/E cella media Schiersmann index | 7.5399 − 0.0343 * Age | −0.36 | 0.0001 |
| A + B Huckman number [mm] | 30.4270 + 0.3659 * Age | 0.40 | 0.0001 |
© 2019 by the authors. Licensee MDPI, Basel, Switzerland. This article is an open access article distributed under the terms and conditions of the Creative Commons Attribution (CC BY) license (http://creativecommons.org/licenses/by/4.0/).
Share and Cite
Chrzan, R.; Gleń, A.; Bryll, A.; Urbanik, A. Computed Tomography Assessment of Brain Atrophy in Centenarians. Int. J. Environ. Res. Public Health 2019, 16, 3659. https://doi.org/10.3390/ijerph16193659
Chrzan R, Gleń A, Bryll A, Urbanik A. Computed Tomography Assessment of Brain Atrophy in Centenarians. International Journal of Environmental Research and Public Health. 2019; 16(19):3659. https://doi.org/10.3390/ijerph16193659
Chicago/Turabian StyleChrzan, Robert, Agnieszka Gleń, Amira Bryll, and Andrzej Urbanik. 2019. "Computed Tomography Assessment of Brain Atrophy in Centenarians" International Journal of Environmental Research and Public Health 16, no. 19: 3659. https://doi.org/10.3390/ijerph16193659
APA StyleChrzan, R., Gleń, A., Bryll, A., & Urbanik, A. (2019). Computed Tomography Assessment of Brain Atrophy in Centenarians. International Journal of Environmental Research and Public Health, 16(19), 3659. https://doi.org/10.3390/ijerph16193659