Global Associations of Air Pollution and Conjunctivitis Diseases: A Systematic Review and Meta-Analysis


 ,
,
Abstract
1. Introduction
2. Materials and Methods
2.1. Data Source
2.2. Study Selection
2.2.1. Selection Criteria
2.2.2. Data Extraction
2.2.3. Quality Assessment
2.3. Data Synthesis and Statistical Analysis
3. Results
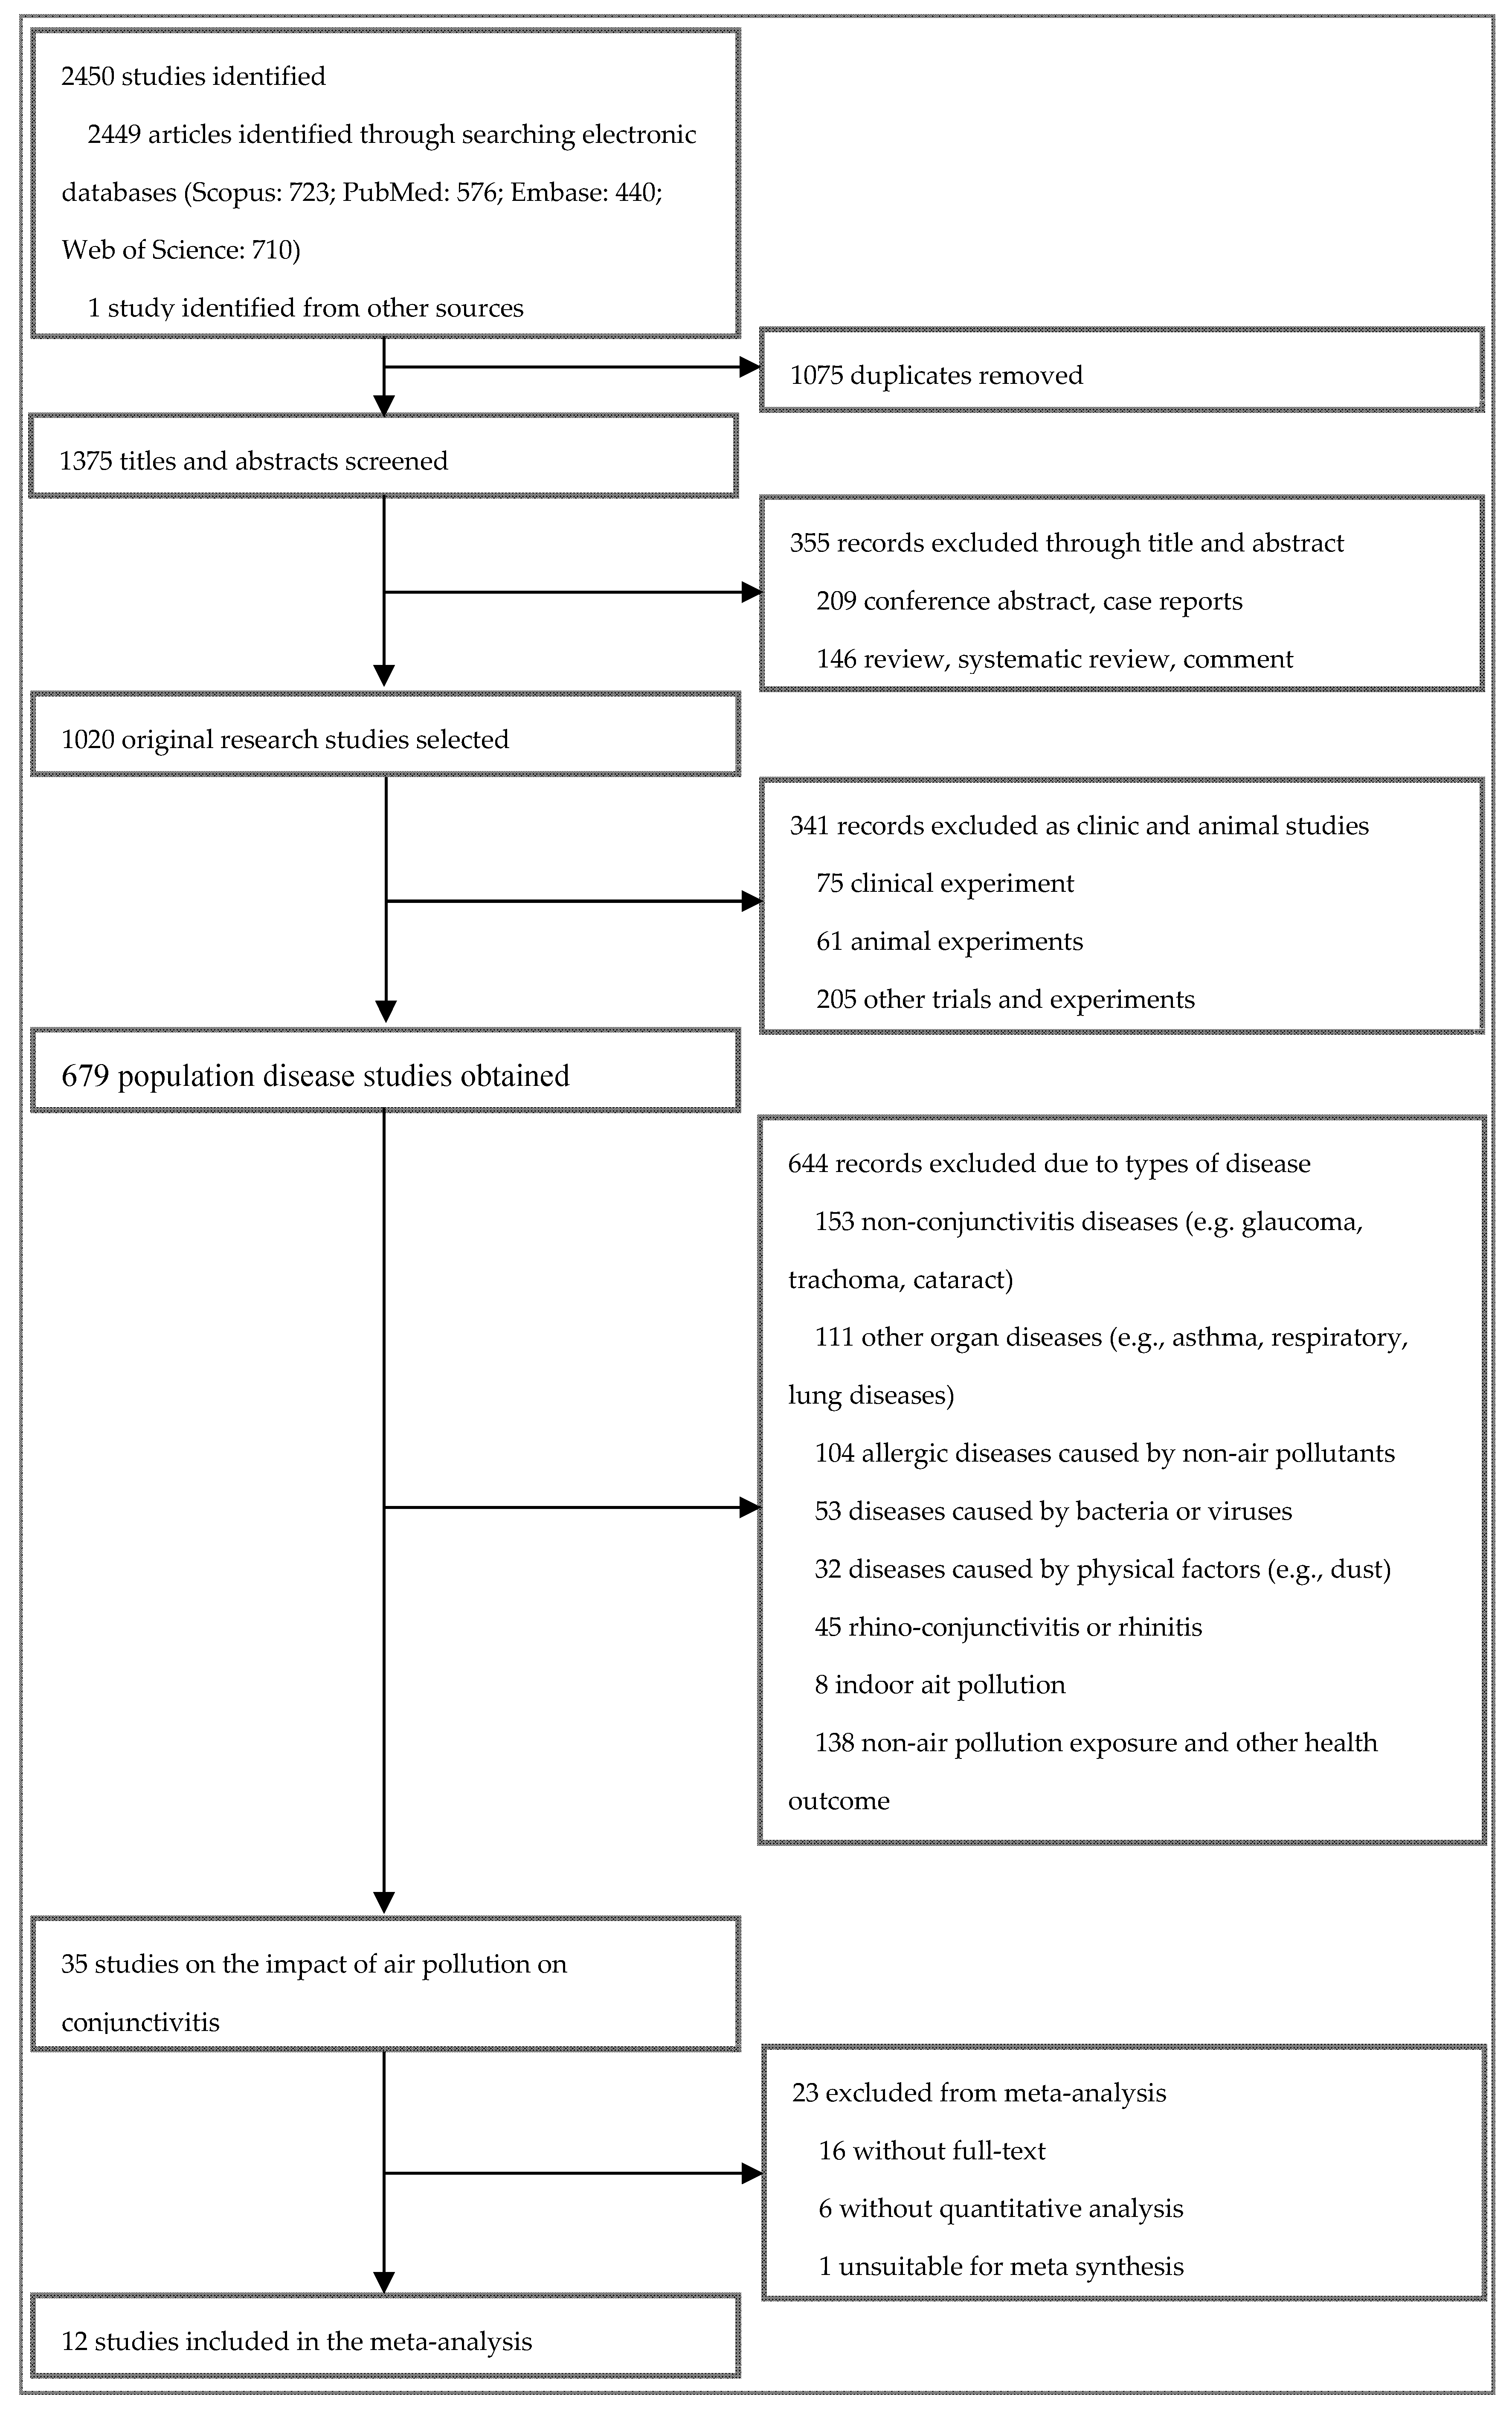
3.1. Search Results and Study Characteristics
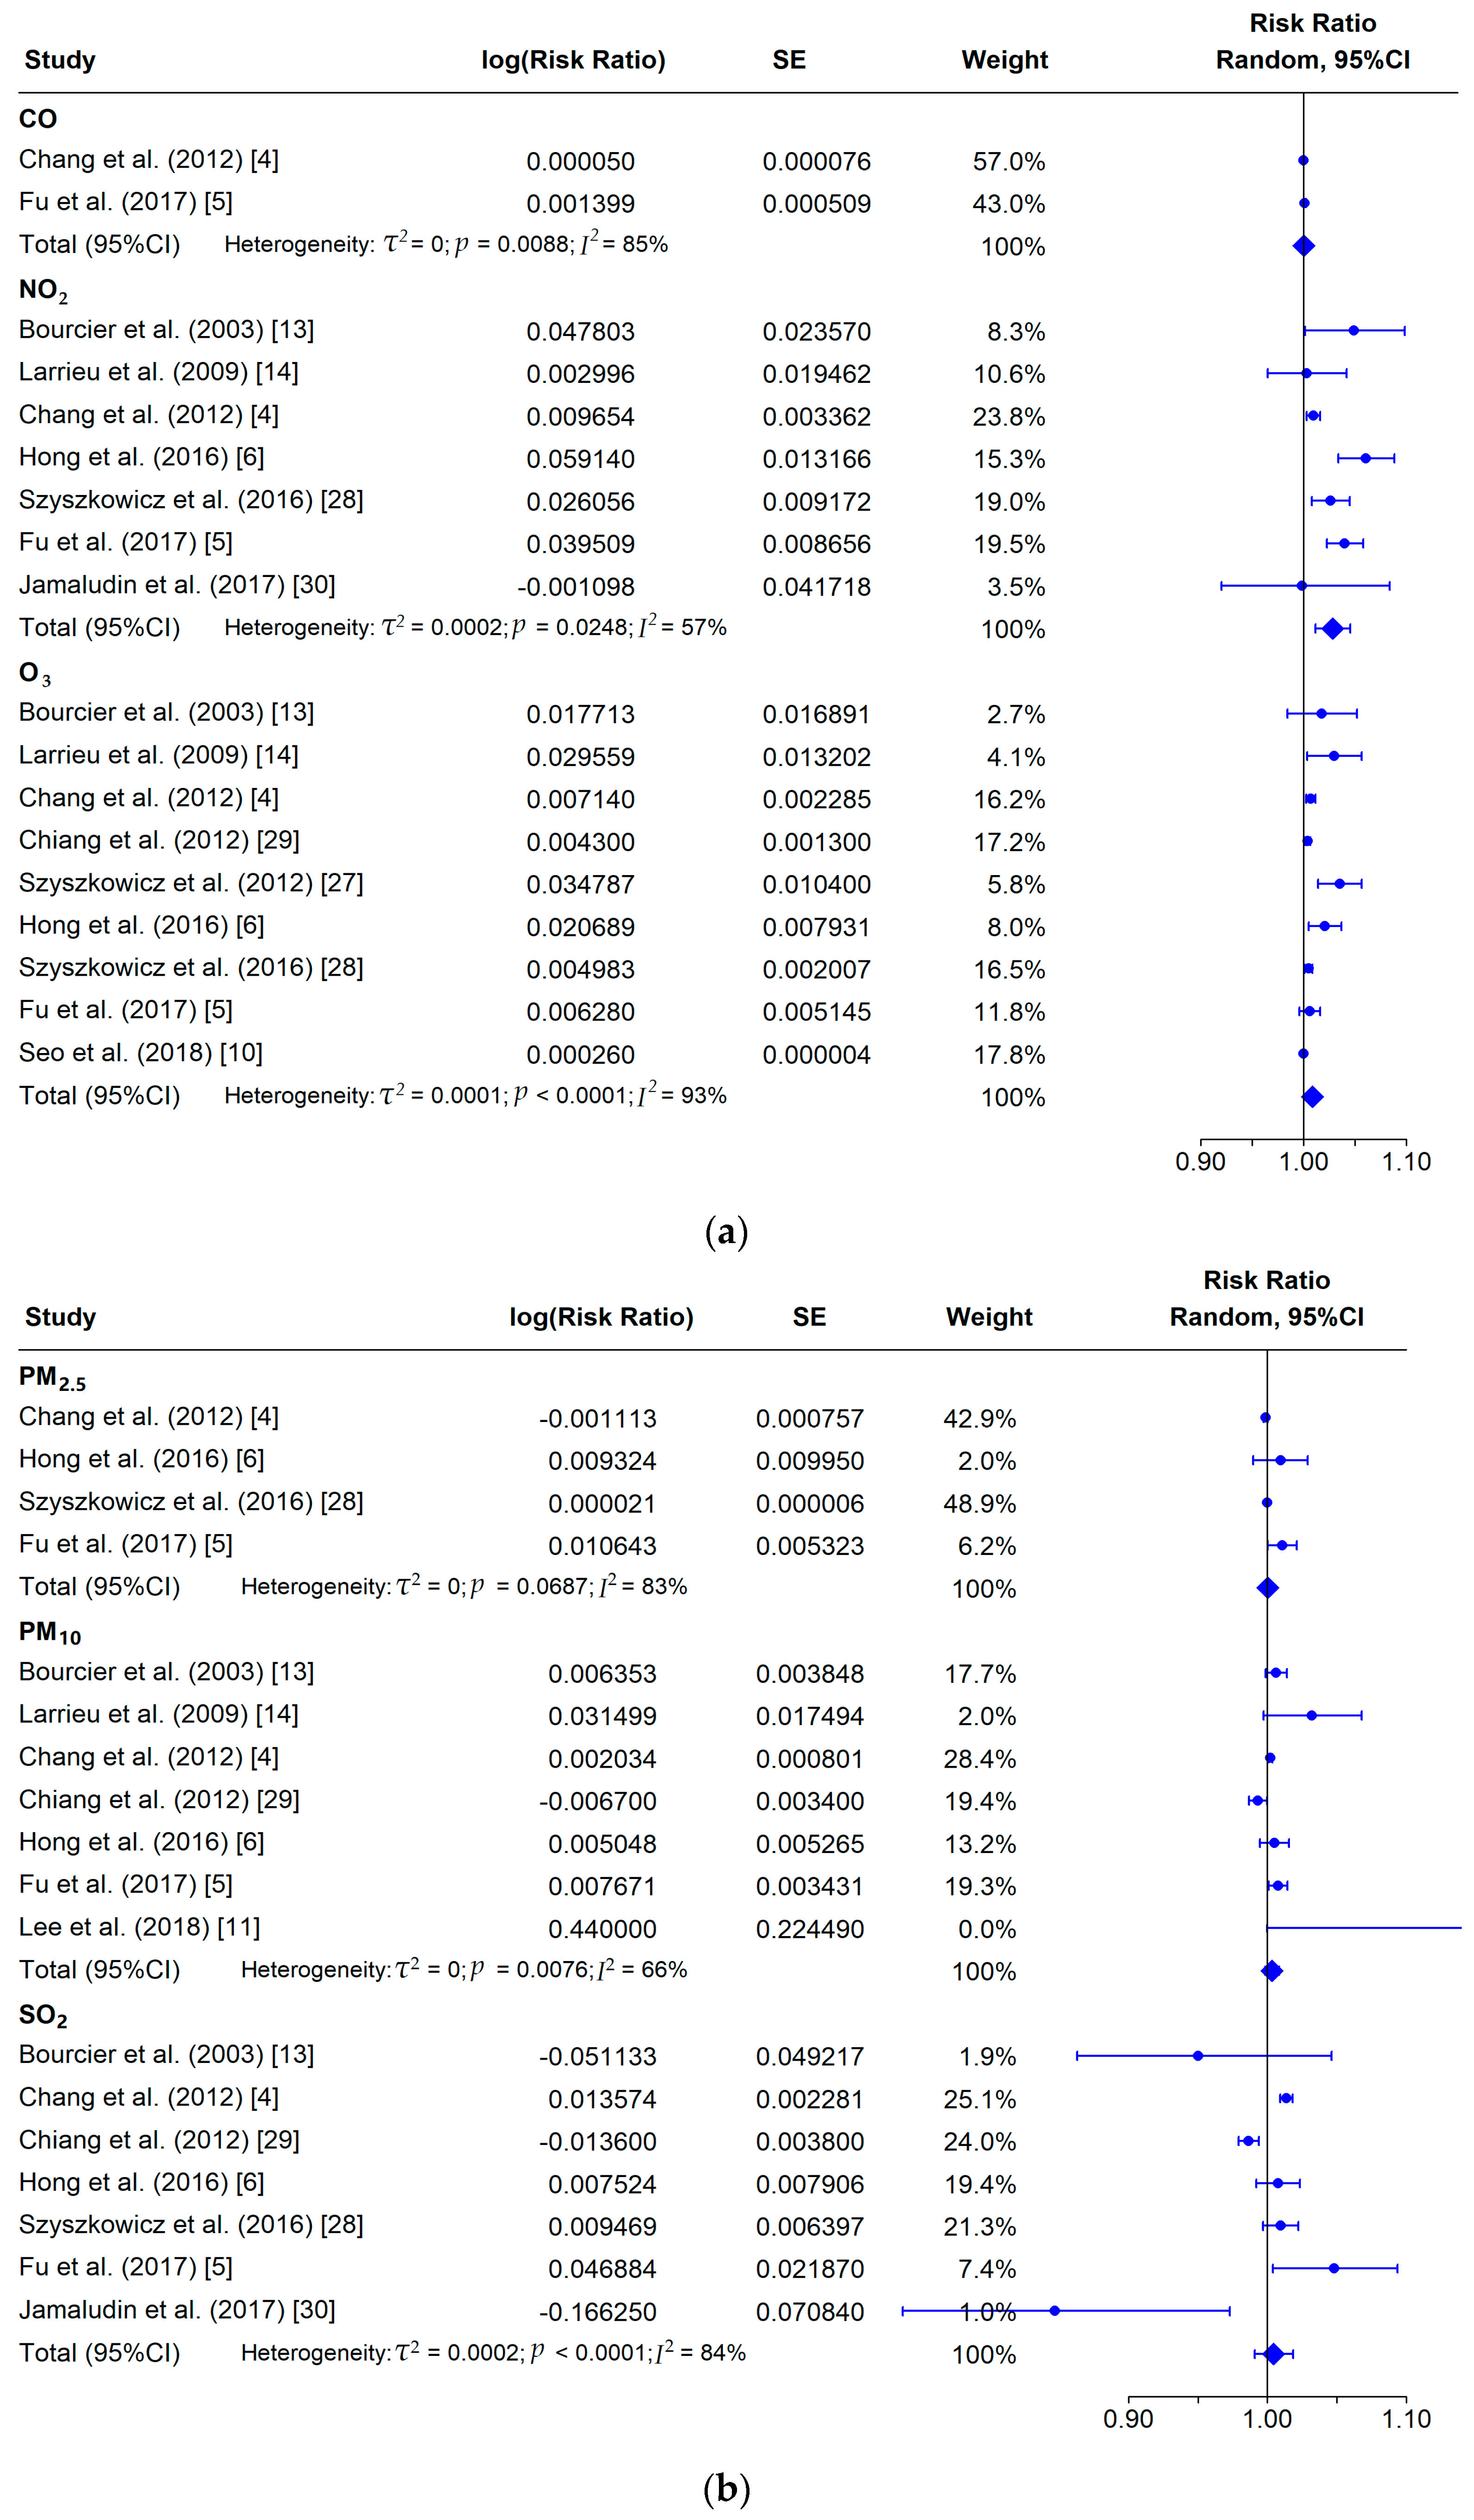
3.2. Overall Analysis
3.3. Subgroup Analysis
3.4. Meta-Regression
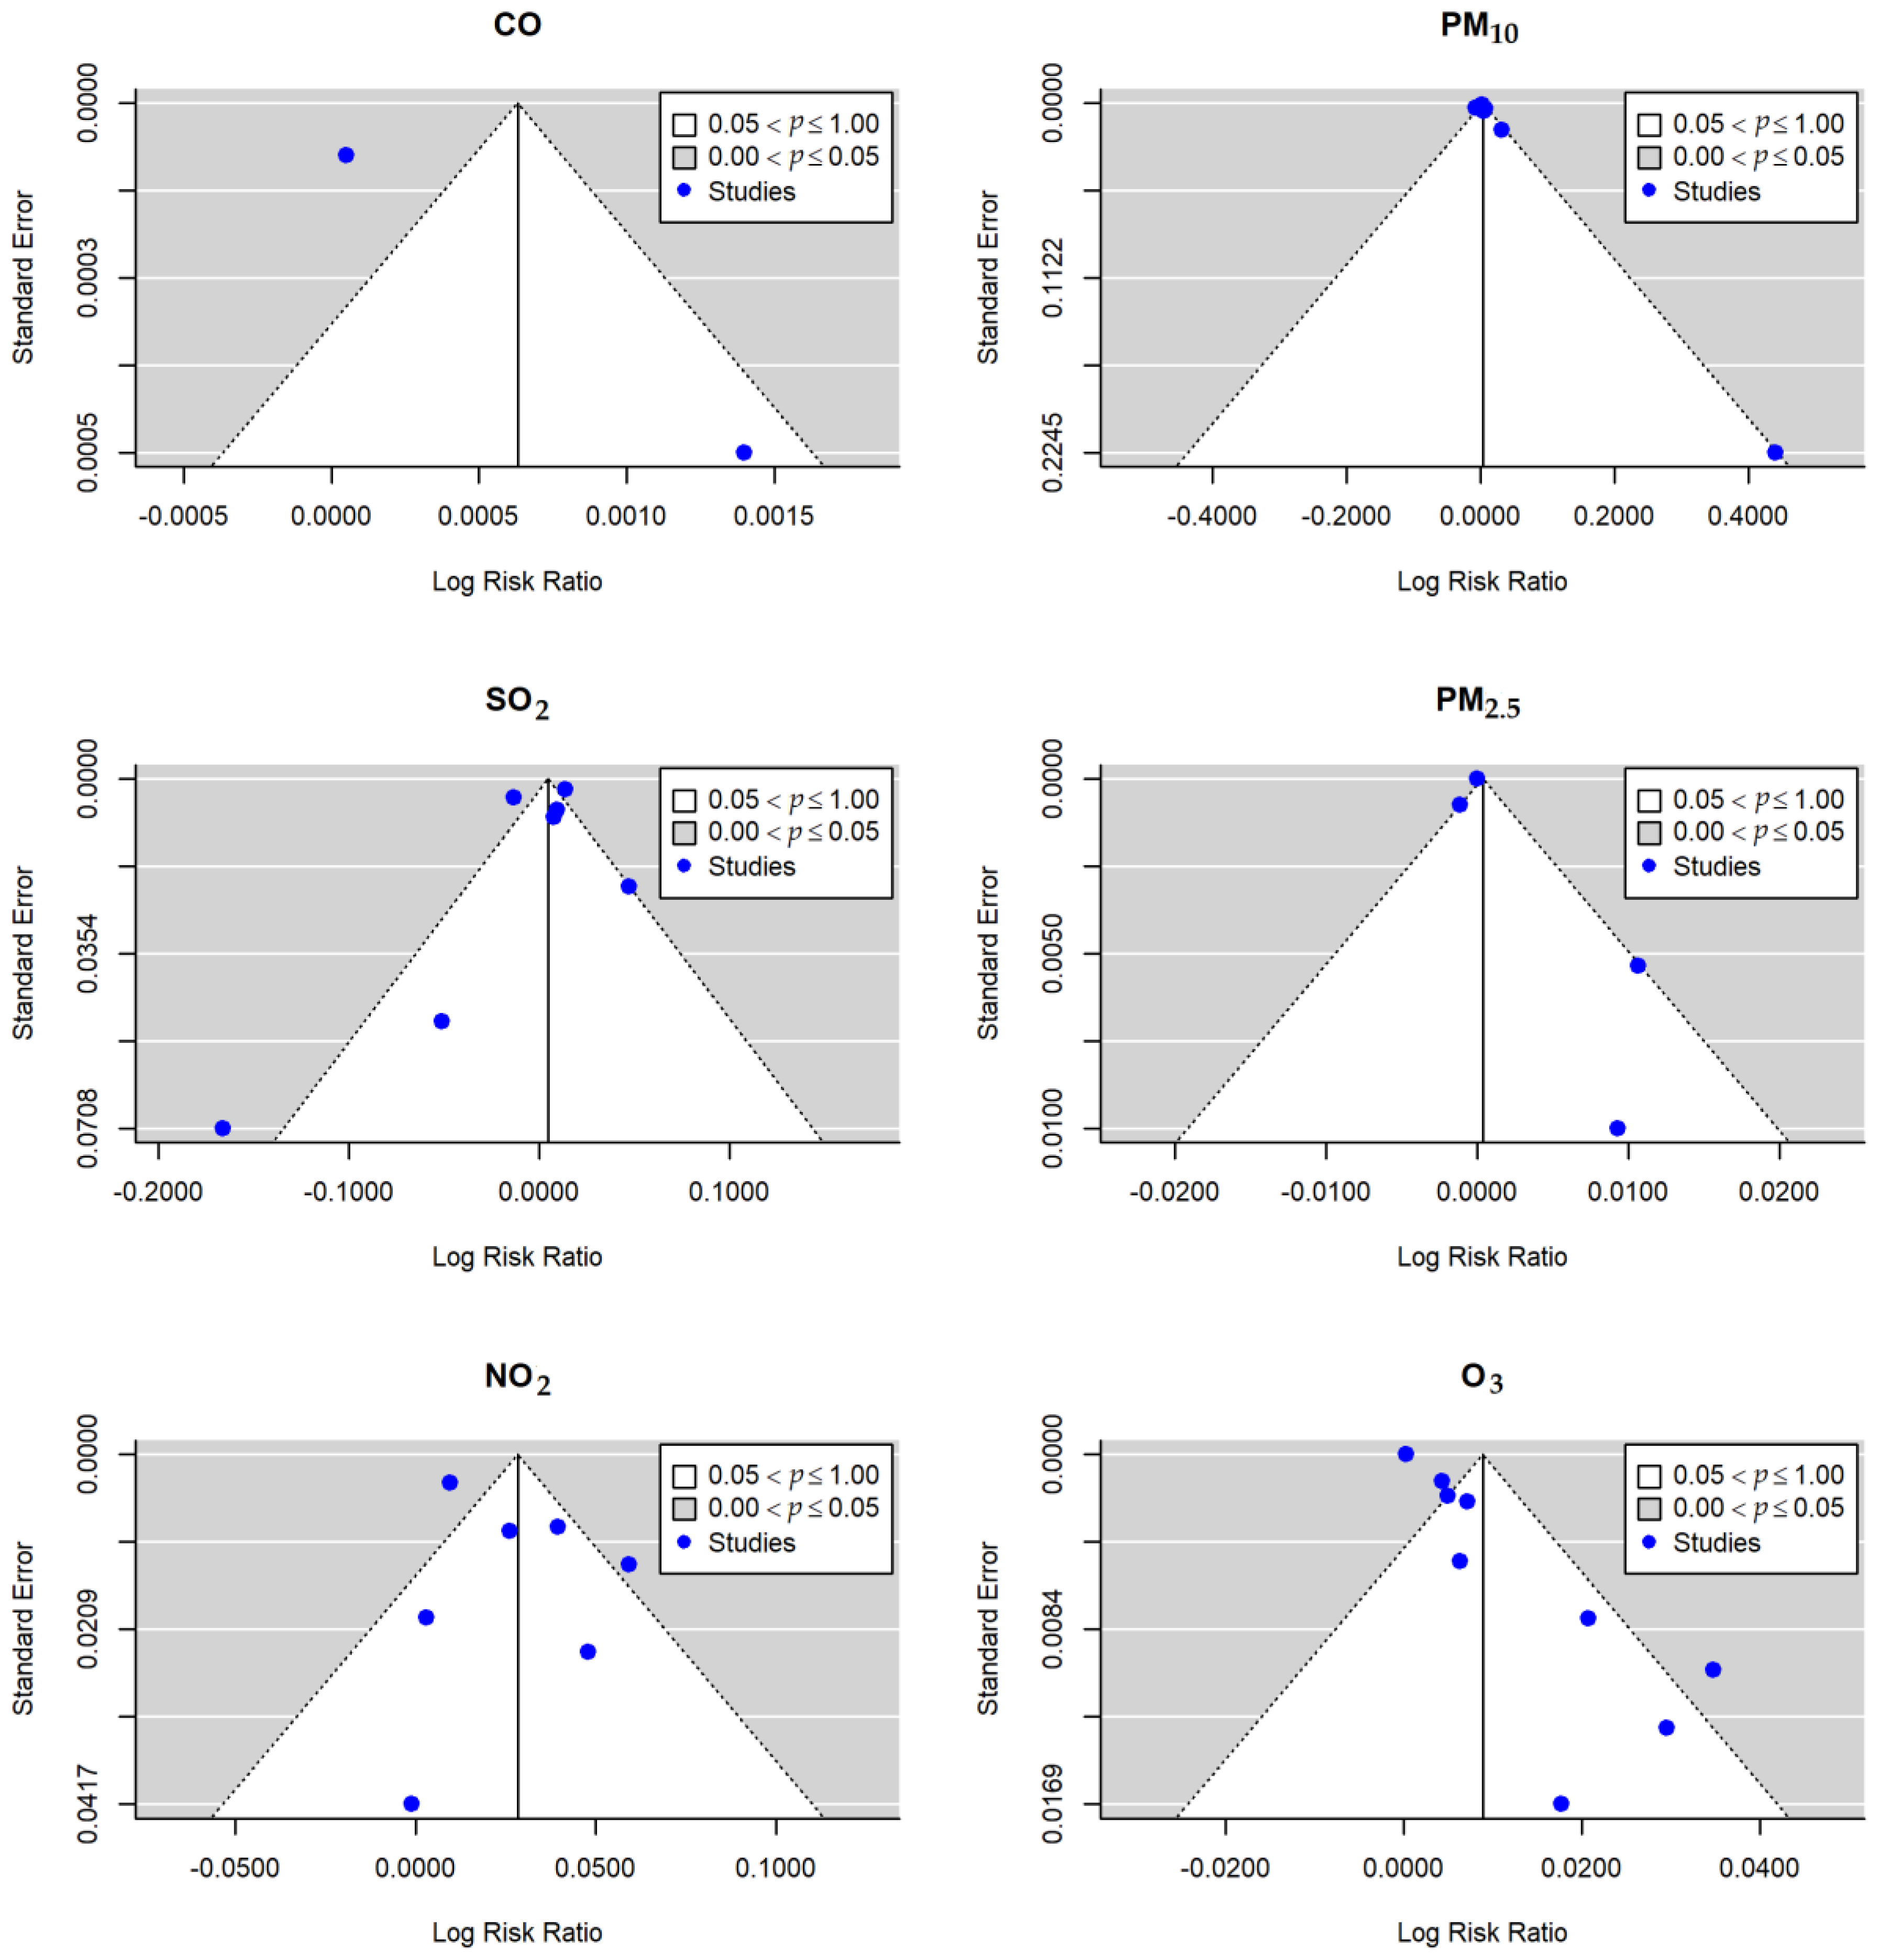
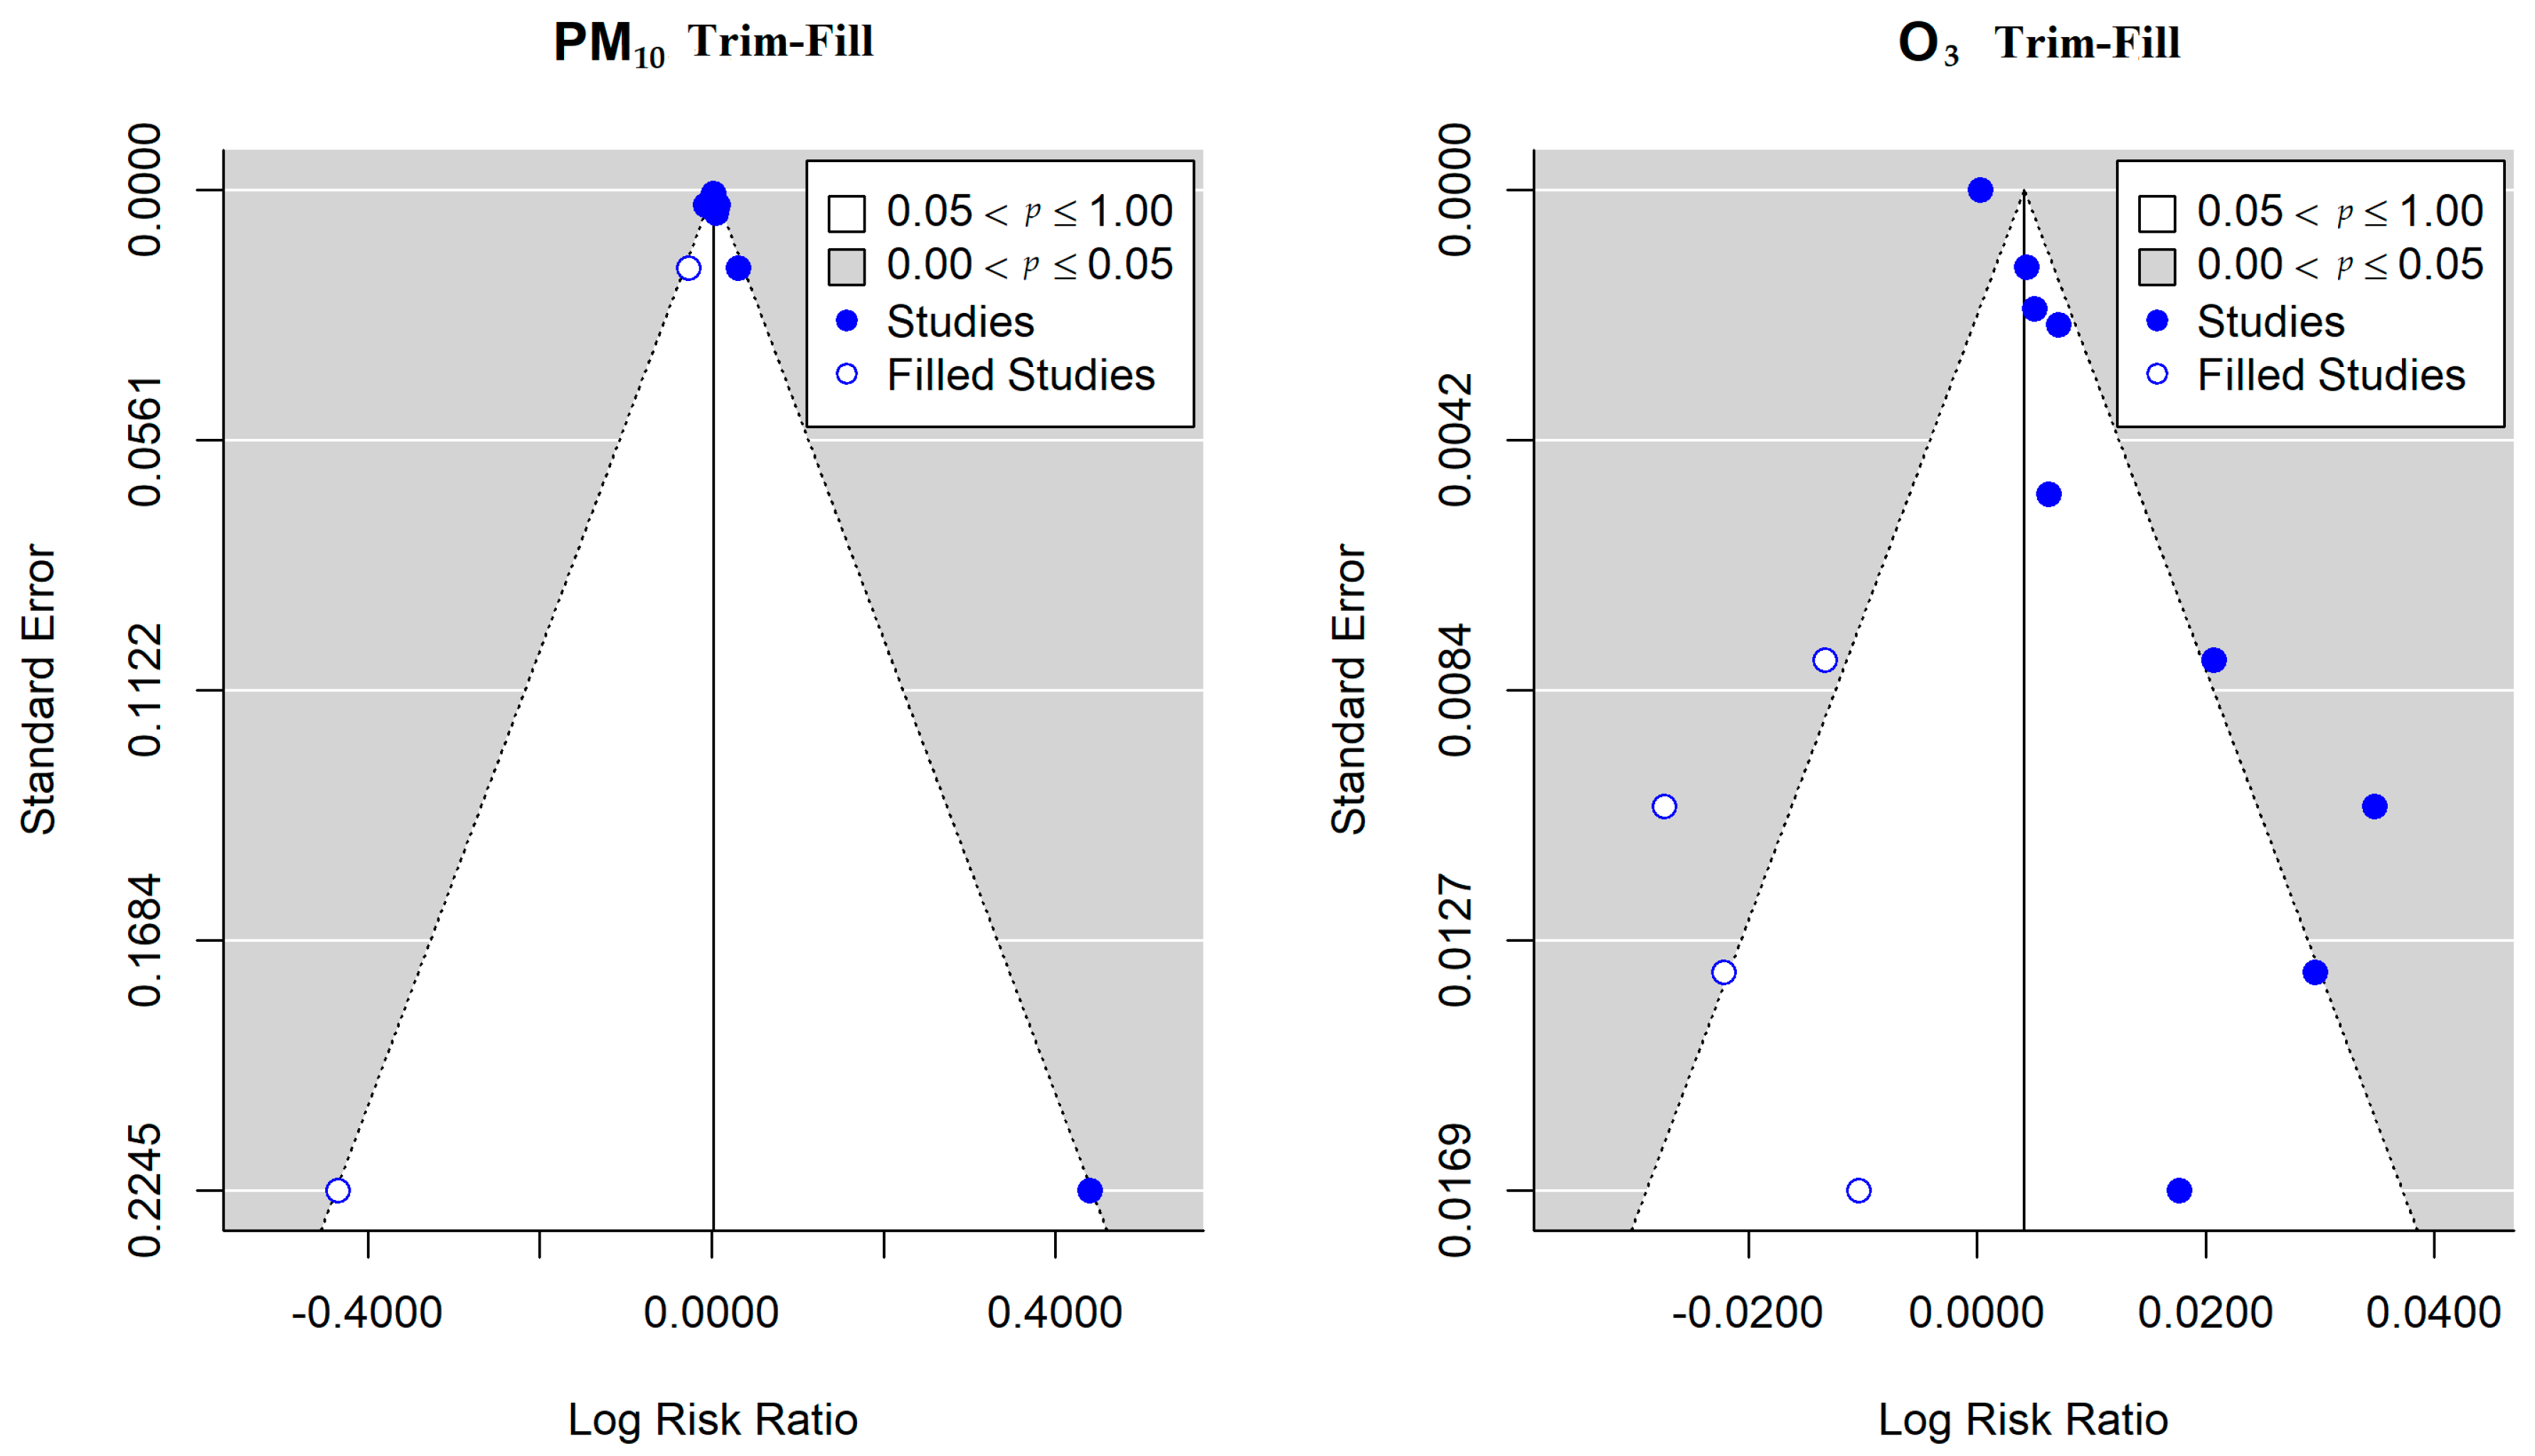
3.5. Publication Bias
3.6. Sensitivity Analysis
4. Discussion
4.1. Risk Analysis of Air Pollution and Conjunctivitis in the Whole Population
4.2. Risk Analysis of Air Pollution and Conjunctivitis in Subgroups
4.3. Source of Heterogeneity and Possible Bias
4.4. Possible Mechanisms Explaining the Relation between Conjunctivitis and Air Pollution
4.5. Limitations and Implications
5. Conclusions
Author Contributions
Funding
Acknowledgments
Conflicts of Interest
Abbreviations
| CO | carbon monoxide |
| NO2 | nitrogen dioxide |
| SO2 | sulfur dioxide |
| O3 | ozone |
| PM2.5 | particles smaller than 2.5 μm |
| PM10 | particles smaller than 10 μm |
| ER | excess rate |
| RR | relative risk |
| OR | odds ratio |
| β | regression coefficient |
| SE | standard error |
| CI | confidence interval |
| GLM | generalized linear model |
| GAM | generalized additive model |
| DLM | distributed lag model |
| ICD-9 | International Classification of Disease, Revision 9 |
| ICD-10 | International Classification of Disease, Revision 10 |
| ICPC-2 | Code(s) International Classification of Primary Care, Second Edition |
| GDP | gross domestic product; |
Appendix A

| Search Field | PubMed (MeSH terms & tiab search function) | Web of Science (TS & TI search function) | Scopus (TITLE-ABS-KEY search function) | Embase (ti,ab,kw search function) |
|---|---|---|---|---|
| [1] | (“conjunctivitis”[MeSH Terms] OR Conjunctivitis[Title/Abstract] OR “endophthalmitis”[MeSH Terms] OR ophthalmia[Title/Abstract] OR pinkeye[Title/Abstract] OR Pink eye[Title/Abstract]) | (TS=(“conjunctivitis” OR “endophthalmitis” OR “ophthalmia” OR “pinkeye” OR “conjunctivitis” OR “Pink eye”) OR TI=(“conjunctivitis” OR “endophthalmitis” OR “ophthalmia” OR “pinkeye” OR “conjunctivitis” OR “Pink eye”)) | TITLE-ABS-KEY(“conjunctivitis” OR “endophthalmitis” OR “ophthalmia” OR “pinkeye” OR “conjunctivitis” OR “Pink eye”) AND TITLE-ABS-KEY(“air pollution” OR “ambient air pollution” OR “outdoor air pollution” OR “atmospheric pollution”) | “conjunctivitis”:ti,ab,kw OR “endophthalmitis”:ti,ab,kw OR “ophthalmia”:ti,ab,kw OR “pinkeye”:ti,ab,kw OR “pink eye”:ti,ab,kw |
| [2] | (“air pollution”[MeSH Terms] OR air pollution[Title/Abstract] OR ambient air pollution[Title/Abstract] OR outdoor air pollution[Title/Abstract] OR atmospheric pollution[Title/Abstract]) | (TS=(“air pollution” OR “ambient air pollution” OR “outdoor air pollution” OR “atmospheric pollution”) OR TI=(“air pollution” OR “ambient air pollution” OR “outdoor air pollution” OR “atmospheric pollution”)) | TITLE-ABS-KEY(“conjunctivitis” OR “endophthalmitis” OR “ophthalmia” OR “pinkeye” OR “conjunctivitis” OR “Pink eye”) AND TITLE-ABS-KEY( “PM2.5” OR “Particulate Matter2.5” OR “particulate matter” OR “PM10” OR “Particulate Matter 10” OR “SO2” OR “Sulfur dioxide” OR “NO2” OR “Nitrogen dioxide” OR “NOx” OR “Nitrogen oxides” OR “O3” OR “ozone” OR “CO” OR “Carbon monoxide” OR “Smog” OR “black carbon”) | “air pollution”:ti,ab,kw OR “ambient air pollution”:ti,ab,kw OR “outdoor air pollution”:ti,ab,kw OR “atmospheric pollution”:ti,ab,kw |
| [3] | ( PM2.5[Title/Abstract] OR Particulate Matter2.5[Title/Abstract] OR particulate matter[MeSH Terms] OR particulate matter[Title/Abstract] OR PM10[Title/Abstract] OR Particulate Matter10[Title/Abstract] OR SO2[Title/Abstract] OR Sulfur dioxide[MeSH Terms] OR Sulfur dioxide[Title/Abstract] OR NO2[Title/Abstract] OR Nitrogen dioxide[MeSH Terms] OR Nitrogen dioxide[Title/Abstract] OR NOx[Title/Abstract] OR Nitrogen oxides[MeSH Terms] OR Nitrogen oxides[Title/Abstract] OR O3[Title/Abstract] OR ozone[MeSH Terms] OR ozone[Title/Abstract] OR CO[Title/Abstract] OR Carbon monoxide[MeSH Terms] OR Carbon monoxide[Title/Abstract] OR Smog[MeSH Terms] OR Smog[Title/Abstract] OR black carbon[MeSH Terms] OR black carbon[Title/Abstract]) | (TS=( “PM2.5” OR “Particulate Matter2.5” OR “particulate matter” OR “PM10” OR “Particulate Matter 10” OR “SO2” OR “Sulfur dioxide” OR “NO2” OR “Nitrogen dioxide” OR “NOx” OR “Nitrogen oxides” OR “O3” OR “ozone” OR “CO” OR “Carbon monoxide” OR “Smog” OR “black carbon”) OR TI=( “PM2.5” OR “Particulate Matter2.5” OR “particulate matter” OR “PM10” OR “Particulate Matter 10” OR “SO2” OR “Sulfur dioxide” OR “NO2” OR “Nitrogen dioxide” OR “NOx” OR “Nitrogen oxides” OR “O3” OR “ozone” OR “CO” OR “Carbon monoxide” OR “Smog” OR “black carbon”)) | TITLE-ABS-KEY(“conjunctivitis” OR “endophthalmitis” OR “ophthalmia” OR “pinkeye” OR “conjunctivitis” OR “Pink eye”) AND TITLE-ABS-KEY(“air pollution” OR “ambient air pollution” OR “outdoor air pollution” OR “atmospheric pollution”) AND TITLE-ABS-KEY( “PM2.5” OR “Particulate Matter2.5” OR “particulate matter” OR “PM10” OR “Particulate Matter 10” OR “SO2” OR “Sulfur dioxide” OR “NO2” OR “Nitrogen dioxide” OR “NOx” OR “Nitrogen oxides” OR “O3” OR “ozone” OR “CO” OR “Carbon monoxide” OR “Smog” OR “black carbon”) | “PM2.5”:ti,ab,kw OR “particulate matter2.5”:ti,ab,kw OR “particulate matter”:ti,ab,kw OR “PM10”:ti,ab,kw OR “particulate matter 10”:ti,ab,kw OR “SO2”:ti,ab,kw OR “sulfur dioxide”:ti,ab,kw OR “NO2”:ti,ab,kw OR “nitrogen dioxide”:ti,ab,kw OR “NOx”:ti,ab,kw OR “nitrogen oxides”:ti,ab,kw OR “O3”:ti,ab,kw OR “ozone”:ti,ab,kw OR “CO”:ti,ab,kw OR “carbon monoxide”:ti,ab,kw OR “smog”:ti,ab,kw OR “black carbon”:ti,ab,kw |
| Search strategy | ([1] AND [2]) OR ([1] AND [3]) | ([1] AND [2]) OR ([1] AND [3]) | ([1] AND [2]) OR ([1] AND [3]) | ([1] AND [2]) OR ([1] AND [3]) |
| Study | Location | Population | GDP (billion dollars) | Latitude, Longitude | Temperature (°C) | Humidity (%) | Duration of Sunshine (hours) |
|---|---|---|---|---|---|---|---|
| Bourcier et al. (2003) [13] | Paris, France | 2,125,851 | 459.20 | 48.86, 2.35 | 9.31–16.90 | 54.70–89.90 | 4.54 |
| Larrieu et al. (2009) [14] | Bordeaux, France | 600,000 | 17.70 | 44.84, −0.58 | — | — | 5.57 |
| Chang et al. (2012) [4] | Taiwan, China | 23,037,031 | 392.92 | 25.03, 121.52 | 24.09 | 75.24 | 5.26 |
| Chiang et al. (2012) [29] | Taiwan, China (four cities) a | 22,689,122 | 331.01 | 25.03, 121.52 | 23.78 | 77.25 | 4.95 |
| Szyszkowicz et al. (2012) [27] | Edmonton, Canada | 626,500 | 28.80 | 53.53, -113.50 | 3.90 | 66.00 | 6.40 |
| Hong et al. (2016) [6] | Shanghai, China | 23,030,000 | 244.90 | 31.27, 121.52 | 17.20 | 69.40 | 4.88 |
| Szyszkowicz et al. (2016) [28] | Ontario, Canada (nine cities) b | 12,760,000 | 657.20 | 50.00, -85.00 | 9.09 | 72.20 | 5.64 |
| Fu et al. (2017) [5] | Hangzhou, China | 9,018,000 | 145.93 | 30.25, 120.17 | 17.90 | 74.60 | 4.69 |
| Jamaludin et al. (2017) [30] | Johor Bahru, Malaysian | 848,000 | 20.06 | 1.46, 103.76 | 25.50–27.80 | — | 5.75 |
| Lee et al. (2018) [11] | Daegu, Korea | 2,279,000 | 45.387 | 35.87, 128.60 | — | — | 6.20 |
| Seo et al. (2018) [10] | Seoul, South Korea | 10,442,426 | 280.00 | 37.53,127.02 | (7–9 month): 24.70 (1–3 month): −0.80 | (7–9 month): 70.70 (1–3 month): 51.20 | 5.67 |
| Szyszkowicz et al. (2019) [9] | Edmonton, Canada | 626,500 | 28.8025 | 53.53, -113.50 | — | — | 6.40 |
| No. | Study | Conjunctivitis Disease Occurrence Verification (1 point) | Quality of Air Pollutant Measurement (1 point) | Adjustment Degree of Confounders (3 point) | Total Score (5 point) | Quality Category |
|---|---|---|---|---|---|---|
| 1 | Bourcier et al. (2003) [13] | 0 | 1 | 3 | 4 | Low quality |
| 2 | Larrieu et al. (2009) [14] | 1 | 1 | 2 | 4 | Medium quality |
| 3 | Chang et al. (2012) [4] | 1 | 1 | 2 | 4 | Medium quality |
| 4 | Chiang et al. (2012) [29] | 1 | 1 | 3 | 5 | High quality |
| 5 | Szyszkowicz et al. (2012) [27] | 1 | 1 | 2 | 4 | Medium quality |
| 6 | Hong et al. (2016) [6] | 1 | 1 | 3 | 5 | High quality |
| 7 | Szyszkowicz et al. (2016) [28] | 1 | 1 | 2 | 4 | Medium quality |
| 8 | Fu et al. (2017) [5] | 1 | 1 | 1 | 3 | Medium quality |
| 9 | Jamaludin et al. (2017) [30] | 0 | 0 | 2 | 2 | Low quality |
| 10 | Lee et al. (2018) [11] | 1 | 0 | 0 | 1 | Low quality |
| 11 | Seo et al. (2018) [10] | 1 | 0 | 1 | 2 | Low quality |
| 12 | Szyszkowicz et al. (2019) [9] | 1 | 1 | 1 | 3 | Medium quality |
| Literature | RR(95% CI) | Z-test | p-value | Q-test | Q-p | τ2 | I2 | H2 |
|---|---|---|---|---|---|---|---|---|
| CO-3 | 1.0010(0.9990-1.0030) | 2.747 | 0.006 | 0.000 | 1.000 | 0.000000 | 0.000 | 1.000 |
| CO-8 | 1.0000(1.0000-1.0000) | 0.656 | 0.512 | 0.000 | 1.000 | 0.000000 | 0.000 | 1.000 |
| PM10-1 | 1.0030(0.9971-1.0089) | 0.873 | 0.382 | 16.265 | 0.006 | 0.000031 | 70.778 | 3.422 |
| PM10-2 | 1.0030(0.9971-1.0089) | 1.052 | 0.293 | 14.681 | 0.012 | 0.000020 | 66.979 | 3.028 |
| PM10-3 | 1.0040(0.9962-1.0119) | 1.129 | 0.259 | 17.34 | 0.004 | 0.000040 | 62.007 | 2.632 |
| PM10-4 | 1.0050(1.0011-1.0090) | 2.293 | 0.022 | 10.376 | 0.065 | 0.000009 | 40.147 | 1.671 |
| PM10-6 | 1.0030(0.9971-1.0089) | 1.006 | 0.314 | 17.192 | 0.004 | 0.000033 | 74.577 | 3.933 |
| PM10-8 | 1.0020(0.9961-1.0079) | 0.757 | 0.449 | 14.793 | 0.011 | 0.000025 | 64.491 | 2.816 |
| PM10-10 | 1.0030(0.9971-1.0089) | 1.226 | 0.220 | 13.695 | 0.018 | 0.000024 | 70.384 | 3.377 |
| SO2-1 | 1.0060(0.9923-1.0199) | 0.789 | 0.430 | 47.145 | 0.000 | 0.000193 | 86.342 | 7.322 |
| SO2-3 | 1.0010(0.9835-1.0188) | 0.155 | 0.877 | 24.433 | 0.000 | 0.000287 | 78.076 | 4.561 |
| SO2-4 | 1.0131(1.0091-1.0171) | 5.303 | 0.000 | 11.336 | 0.045 | 0.000002 | 3.03 | 1.031 |
| SO2-6 | 1.0030(0.9835-1.0229) | 0.330 | 0.742 | 48.521 | 0.000 | 0.000345 | 90.725 | 10.782 |
| SO2-7 | 1.0030(0.9835-1.0229) | 0.268 | 0.789 | 48.338 | 0.000 | 0.000348 | 90.073 | 10.073 |
| SO2-8 | 1.0020(0.9883-1.0158) | 0.224 | 0.823 | 45.144 | 0.000 | 0.000160 | 83.838 | 6.187 |
| SO2-10 | 1.0060(0.9923-1.0199) | 0.887 | 0.375 | 42.562 | 0.000 | 0.000180 | 85.515 | 6.904 |
| PM2.5-3 | 1.0050(0.9972-1.0129) | 1.051 | 0.293 | 4.856 | 0.088 | 0.000033 | 60.187 | 2.512 |
| PM2.5-6 | 1.0000(1.0000-1.0000) | 3.459 | 0.001 | 6.228 | 0.044 | 0.000000 | 0.000 | 1.000 |
| PM2.5-7 | 1.0040(0.9942-1.0139) | 0.904 | 0.366 | 5.827 | 0.054 | 0.000042 | 65.186 | 2.872 |
| PM2.5-8 | 1.0000(1.0000-1.0000) | -0.527 | 0.598 | 3.121 | 0.210 | 0.000000 | 36.356 | 1.571 |
| NO2-1 | 1.0274(1.0094-1.0457) | 2.943 | 0.003 | 23.445 | 0.000 | 0.000308 | 77.501 | 4.445 |
| NO2-2 | 1.0315(1.0134-1.0498) | 3.501 | 0.000 | 24.636 | 0.000 | 0.000293 | 76.202 | 4.202 |
| NO2-3 | 1.0356(1.0195-1.0520) | 4.463 | 0.000 | 8.329 | 0.139 | 0.000135 | 41.196 | 1.701 |
| NO2-6 | 1.0222(1.0083-1.0364) | 3.020 | 0.003 | 14.466 | 0.013 | 0.000158 | 61.183 | 2.576 |
| NO2-7 | 1.0294(1.0094-1.0498) | 2.779 | 0.005 | 24.110 | 0.000 | 0.000393 | 76.376 | 4.233 |
| NO2-8 | 1.0263(1.0064-1.0467) | 2.591 | 0.010 | 17.646 | 0.003 | 0.000341 | 72.691 | 3.662 |
| NO2-9 | 1.0294(1.0114-1.0477) | 3.392 | 0.001 | 24.980 | 0.000 | 0.000298 | 77.506 | 4.446 |
| O3-1 | 1.0090(1.0031-1.0150) | 2.783 | 0.005 | 48.211 | 0.000 | 0.000053 | 94.372 | 17.768 |
| O3-2 | 1.0070(1.0011-1.0130) | 2.802 | 0.005 | 44.353 | 0.000 | 0.000032 | 90.828 | 10.903 |
| O3-3 | 1.0101(1.0022-1.0180) | 2.622 | 0.009 | 40.214 | 0.000 | 0.000080 | 95.42 | 21.834 |
| O3-4 | 1.0111(1.0032-1.0190) | 2.793 | 0.005 | 39.621 | 0.000 | 0.000074 | 91.511 | 11.78 |
| O3-5 | 1.0050(1.0011-1.0090) | 2.982 | 0.003 | 38.258 | 0.000 | 0.000013 | 80.072 | 5.018 |
| O3-6 | 1.0070(1.0011-1.0130) | 2.648 | 0.008 | 42.643 | 0.000 | 0.000033 | 91.017 | 11.132 |
| O3-7 | 1.0111(1.0032-1.0190) | 2.745 | 0.006 | 43.741 | 0.000 | 0.000076 | 94.879 | 19.529 |
| O3-8 | 1.0101(1.0022-1.0180) | 2.689 | 0.007 | 47.910 | 0.000 | 0.000077 | 95.903 | 24.405 |
| O3-11 | 1.0111(1.0051-1.0170) | 3.218 | 0.001 | 16.862 | 0.018 | 0.000050 | 83.291 | 5.985 |

References
- Samet, J.M.; Gruskin, S.J.T.L.R.M. Air pollution, health, and human rights. Lancet Respir. Med. 2015, 3, 98–100. [Google Scholar] [CrossRef]
- Sun, Z.; Zhu, D. Exposure to outdoor air pollution and its human health outcomes: A scoping review. PLoS ONE 2019, 14, e0216550. [Google Scholar] [CrossRef] [PubMed]
- Yang, J.; Ou, C.Q.; Song, Y.F.; Li, L.; Chen, P.Y.; Liu, Q.Y. Estimating years of life lost from cardiovascular mortality related to air pollution in Guangzhou, China. Sci. Total Environ. 2016, 573, 1566–1572. [Google Scholar] [CrossRef] [PubMed]
- Chang, C.J.; Yang, H.H.; Chang, C.A.; Tsai, H.Y. Relationship between Air Pollution and Outpatient Visits for Nonspecific Conjunctivitis. Investig. Ophthalmol. Vis. Sci. 2012, 53, 429–433. [Google Scholar] [CrossRef] [PubMed]
- Fu, Q.; Mo, Z.; Lyu, D.; Zhang, L.; Qin, Z.; Tang, Q.; Yin, H.; Xu, P.; Wu, L.; Lou, X.; et al. Air pollution and outpatient visits for conjunctivitis: A case-crossover study in Hangzhou, China. Environ. Pollut. 2017, 231, 1344–1350. [Google Scholar] [CrossRef]
- Hong, J.; Zhong, T.; Li, H.; Xu, J.; Ye, X.; Mu, Z.; Lu, Y.; Mashaghi, A.; Zhou, Y.; Tan, M.; et al. Ambient air pollution, weather changes, and outpatient visits for allergic conjunctivitis: A retrospective registry study. Sci. Rep. 2016, 6. [Google Scholar] [CrossRef]
- Schneider, J.; Scheibling, C.; Segall, D.; Sambursky, R.; Ohsfeldt, R.; Lovejoy, L. Epidemiology and economic burden of conjunctivitis: A managed care perspective. J. Manag. Care Med. 2014, 17, 78–83. [Google Scholar]
- Michailopoulos, P.; Almaliotis, D.; Georgiadou, I.; Papakosta, D.; Gougoulias, K.; Giouleka, P.; Gioulekas, D.; Siempis, T.; Karampatakis, V. Allergic conjunctivitis in patients with respiratory allergic symptoms; a retrospective study in Greece. Med. Hypothesis Discov. Innov. Ophthalmol. 2017, 6, 3. [Google Scholar]
- Szyszkowicz, M.; Gordon Shaag, A.; Shneor, E. Conjunctivitis and Exposure to Ambient Ozone. Preprints 2019. [Google Scholar] [CrossRef]
- Seo, J.W.; Youn, J.S.; Park, S.; Joo, C.K. Development of a Conjunctivitis Outpatient Rate Prediction Model Incorporating Ambient Ozone and Meteorological Factors in South Korea. Front. Pharmacol. 2018, 9. [Google Scholar] [CrossRef]
- Lee, J.Y.; Kim, J.W.; Kim, E.J.; Lee, M.Y.; Nam, C.W.; Chung, I.S. Spatial analysis between particulate matter and emergency room visits for conjunctivitis and keratitis. Ann. Occup. Environ. Med. 2018, 30. [Google Scholar] [CrossRef] [PubMed]
- Nucci, P.; Sacchi, M.; Pichi, F.; Allegri, P.; Serafino, M.; Dello Strologo, M.; De Cilla, S.; Villani, E. Pediatric Conjunctivitis and Air Pollution Exposure: A Prospective Observational Study. Semin. Ophthalmol. 2017, 32, 407–411. [Google Scholar] [CrossRef] [PubMed]
- Bourcier, T.; Viboud, C.; Cohen, J.C.; Thomas, F.; Bury, T.; Cadiot, L.; Mestre, O.; Flahault, A.; Borderie, V.; Laroche, L. Effects of air pollution and climatic conditions on the frequency of ophthalmological emergency examinations. Br. J. Ophthalmol. 2003, 87, 809–811. [Google Scholar] [CrossRef] [PubMed]
- Larrieu, S.; Lefranc, A.; Gault, G.; Chatignoux, E.; Couvy, F.; Jouves, B.; Filleul, L. Are the Short-term Effects of Air Pollution Restricted to Cardiorespiratory Diseases? Am. J. Epidemiol. 2009, 169, 1201–1208. [Google Scholar] [CrossRef] [PubMed]
- Peterson, J.; Welch, V.; Losos, M.; Tugwell, P. The Newcastle-Ottawa Scale (NOS) for Assessing the Quality of Nonrandomised Studies in Meta-Analyses; Ottawa Hospital Research Institute: Ottawa, ON, Canada, 2011. [Google Scholar]
- Higgins, J.P.; Altman, D.G.; Gøtzsche, P.C.; Jüni, P.; Moher, D.; Oxman, A.D.; Savović, J.; Schulz, K.F.; Weeks, L.; Sterne, J.A. The Cochrane Collaboration’s tool for assessing risk of bias in randomised trials. BMJ 2011, 343, d5928. [Google Scholar] [CrossRef] [PubMed]
- Mustafić, H.; Jabre, P.; Caussin, C.; Murad, M.H.; Escolano, S.; Tafflet, M.; Périer, M.C.; Marijon, E.; Vernerey, D.; Empana, J.P. Main air pollutants and myocardial infarction: A systematic review and meta-analysis. JAMA 2012, 307, 713–721. [Google Scholar] [CrossRef] [PubMed]
- Li, J.; Woodward, A.; Hou, X.Y.; Zhu, T.; Zhang, J.; Brown, H.; Yang, J.; Qin, R.; Gao, J.; Gu, S. Modification of the effects of air pollutants on mortality by temperature: A systematic review and meta-analysis. Sci. Total Environ. 2017, 575, 1556–1570. [Google Scholar] [CrossRef] [PubMed]
- Yang, W.S.; Wang, X.; Deng, Q.; Fan, W.Y.; Wang, W.Y. An evidence-based appraisal of global association between air pollution and risk of stroke. Int. J. Cardiol. 2014, 175, 307–313. [Google Scholar] [CrossRef] [PubMed]
- World Organization of Family Doctors. ICPC-2: International Classification of Primary Care, 2nd ed.; Oxford University Press: York, NY, USA, 1998. [Google Scholar]
- Turner, L.R.; Barnett, A.G.; Connell, D.; Tonga, S. Ambient temperature and cardiorespiratory morbidity: A systematic review and meta-analysis. Epidemiology 2012, 23, 594–606. [Google Scholar] [CrossRef]
- Lee, W.S.; Kim, W.S.; Lim, Y.H.; Hong, Y.C. High Temperatures and Kidney Disease Morbidity: A Systematic Review and Meta-analysis. J. Prev. Med. Public Health 2019, 52, 1. [Google Scholar] [CrossRef]
- Borenstein, M.; Hedges, L.V.; Higgins, J.P.; Rothstein, H.R. A basic introduction to fixed-effect and random-effects models for meta-analysis. Res. Synth. Methods 2010, 1, 97–111. [Google Scholar] [CrossRef] [PubMed]
- Higgins, J.P.T.; Thompson, S.G.; Deeks, J.J.; Altman, D.G. Measuring inconsistency in meta-analyses. BMJ 2003, 327, 557–560. [Google Scholar] [CrossRef] [PubMed]
- Begg, C.B.; Mazumdar, M. Operating characteristics of a rank correlation test for publication bias. Biometrics 1994, 50, 1088–1101. [Google Scholar] [CrossRef] [PubMed]
- Egger, M.; Davey Smith, G.; Schneider, M.; Minder, C. Bias in meta-analysis detected by a simple, graphical test. BMJ 1997, 315, 629–634. [Google Scholar] [CrossRef] [PubMed]
- Szyszkowicz, M.; Porada, E.; Searles, G.; Rowe, B.H. Ambient ozone and emergency department visits for skin conditions. Air Qual. Atmos. Health 2012, 5, 303–309. [Google Scholar] [CrossRef]
- Szyszkowicz, M.; Kousha, T.; Castner, J. Air Pollution and Emergency Department Visits for Conjunctivitis: A Case-Crossover Study. Int. J. Occup. Med. Environ. Health 2016, 29, 381–393. [Google Scholar] [CrossRef] [PubMed]
- Chiang, C.C.; Liao, C.C.; Chen, P.C.; Tsai, Y.Y.; Wang, Y.C. Population study on chronic and acute conjunctivitis associated with ambient environment in urban and rural areas. J. Expo. Sci. Environ. Epidemiol. 2012, 22, 533–538. [Google Scholar] [CrossRef] [PubMed]
- Jamaludin, A.R.B.; Yusof, F.; Lokoman, R.M.; Noor, Z.Z.; Alias, N.; Aris, N.M. Correlational study of air pollution-related diseases (asthma, conjunctivitis, URTI and dengue) in Johor Bahru, Malaysia. Malays. J. Fundam. Appl. Sci. 2017, 13, 354–361. [Google Scholar] [CrossRef]
- Higgins, J.P.; Green, S. Cochrane Handbook for Systematic Reviews of Interventions; John Wiley & Sons: Hoboken, NJ, USA, 2011; Volume 4. [Google Scholar]
- Dzhambov, A.M.; Dimitrova, D.D. Residential road traffic noise as a risk factor for hypertension in adults: Systematic review and meta-analysis of analytic studies published in the period 2011–2017. Environ. Pollut. 2018, 240, 306–318. [Google Scholar] [CrossRef]
- Sahebkar, A.; Cicero, A.F.; Simental-Mendia, L.E.; Aggarwal, B.B.; Gupta, S.C. Curcumin downregulates human tumor necrosis factor-α levels: A systematic review and meta-analysis ofrandomized controlled trials. Pharmacol. Res. 2016, 107, 234–242. [Google Scholar] [CrossRef] [PubMed]
- Sahebkar, A. Are curcuminoids effective C-reactive protein-lowering agents in clinical practice? Evidence from a meta-analysis. Phytother. Res. 2014, 28, 633–642. [Google Scholar] [CrossRef] [PubMed]
- Mimura, T.; Ichinose, T.; Yamagami, S.; Fujishima, H.; Kamei, Y.; Goto, M.; Takada, S.; Matsubara, M. Airborne particulate matter (PM2.5) and the prevalence of allergic conjunctivitis in Japan. Sci. Total Environ. 2014, 487, 493–499. [Google Scholar] [CrossRef] [PubMed]
- Li, Z.; Bian, X.; Yin, J.; Zhang, X.; Mu, G. The Effect of Air Pollution on the Occurrence of Nonspecific Conjunctivitis. J. Ophthalmol. 2016. [Google Scholar] [CrossRef] [PubMed]
- Hamming, W.J.; MacPhee, R.D. Relationship of nitrogen oxides in auto exhaust to eye irritation--further results of chamber studies. Atmos. Environ. 1967, 1, 577–584. [Google Scholar] [CrossRef]
- Krishnan, M.A.; Jawahar, K.; Perumal, V.; Devaraj, T.; Thanarasu, A.; Kubendran, D.; Sivanesan, S. Effects of ambient air pollution on respiratory and eye illness in population living in Kodungaiyur, Chennai. Atmos. Environ. 2019, 203, 166–171. [Google Scholar] [CrossRef]
- Hwang, S.H.; Choi, Y.H.; Paik, H.J.; Wee, W.R.; Kim, M.K.; Kim, D.H. Potential Importance of Ozone in the Association Between Outdoor Air Pollution and Dry Eye Disease in South KoreaOutdoor Ozone Air Pollution and Dry Eye Disease in South KoreaOutdoor Ozone Air Pollution and Dry Eye Disease in South Korea. JAMA Ophthalmol. 2016, 134, 503–510. [Google Scholar] [CrossRef] [PubMed]
- Han, H.K.; Luk, S.M.; Kinsella, M.T. A case report of ocular chemical injury secondary to ozone gas. Acta Ophthalmol. 2017, 95, e348–e349. [Google Scholar] [CrossRef] [PubMed]
- Weschler, C.J. Ozone in Indoor Environments: Concentration and Chemistry. Indoor Air 2000, 10, 269–288. [Google Scholar] [CrossRef]
- Depayras, S.; Kondakova, T.; Heipieper, H.J.; Feuilloley, M.G.; Orange, N.; Duclairoir-Poc, C. The Hidden Face of Nitrogen Oxides Species: From Toxic Effects to Potential Cure? Emerg. Pollut. Some Strateg. Qual. Preserv. Environ. 2018, 19. [Google Scholar] [CrossRef]
- Rietjens, I.M.; Poelen, M.C.; Hempenius, R.A.; Gijbels, M.J.; Alink, G.M. Toxicity of ozone and nitrogen dioxide to alveolar macrophages: Comparative study revealing differences in their mechanism of toxic action. J. Toxicol. Environ. Health 1986, 19, 555–568. [Google Scholar] [CrossRef]
- Mustafa, M.G.; Elsayed, N.M.; von Dohlen, F.M.; Hassett, C.M.; Postlethwait, E.M.; Quinn, C.L.; Graham, J.A.; Gardner, D.E. A comparison of biochemical effects of nitrogen dioxide, ozone, and their combination in mouse lung. Toxicol. Appl. Pharmacol. 1984, 72, 82–90. [Google Scholar] [CrossRef]
- Miller, A.E.; MacDougall, J.D.; Tarnopolsky, M.A.; Sale, D.G. Gender differences in strength and muscle fiber characteristics. Eur. J. Appl. Physiol. Occup. Physiol. 1993, 66, 254–262. [Google Scholar] [CrossRef] [PubMed]
- Brasche, S.; Bischof, W. Daily time spent indoors in German homes – Baseline data for the assessment of indoor exposure of German occupants. Int. J. Hyg. Environ. Health 2005, 208, 247–253. [Google Scholar] [CrossRef] [PubMed]
- Buonanno, G.; Stabile, L.; Morawska, L. Personal exposure to ultrafine particles: The influence of time-activity patterns. Sci. Total Environ. 2014, 468–469, 903–907. [Google Scholar] [CrossRef] [PubMed]
- Jones, A.L.; Kramer, R.S.S. Facial Cosmetics and Attractiveness: Comparing the Effect Sizes of Professionally-Applied Cosmetics and Identity. PLoS ONE 2016, 11, e0164218. [Google Scholar] [CrossRef] [PubMed]
- Volpe, M.G.; Nazzaro, M.; Coppola, R.; Rapuano, F.; Aquino, R.P. Determination and assessments of selected heavy metals in eye shadow cosmetics from China, Italy, and USA. Microchem. J. 2012, 101, 65–69. [Google Scholar] [CrossRef]
- Koffuor, G.; Anto, B.; Afari, C.; Kyei, S.; Gyanfosu, L. Ocular discomforts following eyelash extension. J. Med. Biomed. Sci. 2012, 1, 55–61. [Google Scholar]
- Nichols, J.J.; Sinnott, L.T. Tear film, contact lens, and patient-related factors associated with contact lens–related dry eye. Investig. Ophthalmol. Vis. Sci. 2006, 47, 1319–1328. [Google Scholar] [CrossRef] [PubMed]
- Velasco, M.J.; Bermúdez, F.J.; Romero, J.; Hita, E. Variations in corneal sensitivity with hydrogel contact lenses. Acta Ophthalmol. 1994, 72, 53–56. [Google Scholar] [CrossRef] [PubMed]
- Kan, H.; Heiss, G.; Rose, K.M.; Whitsel, E.; Lurmann, F.; London, S.J. Traffic exposure and lung function in adults: The Atherosclerosis Risk in Communities study. Thorax 2007, 62, 873. [Google Scholar] [CrossRef] [PubMed]
- Bhatia, S. Automobile Exhaust Emmision Control—A Review; SAE Technical Paper; SAE International: Pittsburgh, PA, USA, 2019; ISBN 0148-7191. [Google Scholar]
- Csavina, J.; Field, J.; Félix, O.; Corral-Avitia, A.Y.; Sáez, A.E.; Betterton, E.A. Effect of wind speed and relative humidity on atmospheric dust concentrations in semi-arid climates. Sci. Total Environ. 2014, 487, 82–90. [Google Scholar] [CrossRef] [PubMed]
- Wang, X.; Zhang, R.; Yu, W. The effects of PM2. 5 concentrations and relative humidity on atmospheric visibility in Beijing. J. Geophys. Res. Atmos. 2019, 124, 2235–2259. [Google Scholar] [CrossRef]
- Van Setten, G.; Labetoulle, M.; Baudouin, C.; Rolando, M. Evidence of seasonality and effects of psychrometry in dry eye disease. Acta Ophthalmol. 2016, 94, 499–506. [Google Scholar] [CrossRef] [PubMed]
- Chen, R.; Hu, B.; Liu, Y.; Xu, J.; Yang, G.; Xu, D.; Chen, C. Beyond PM2.5: The role of ultrafine particles on adverse health effects of air pollution. Biochim. Biophys. Acta (BBA) Gen. Subj. 2016, 1860, 2844–2855. [Google Scholar] [CrossRef] [PubMed]
- Gao, Z.X.; Song, X.L.; Li, S.S.; Lai, X.R.; Yang, Y.L.; Yang, G.; Li, Z.J.; Cui, Y.H.; Pan, H.W. Assessment of DNA damage and cell senescence in corneal epithelial cells exposed to airborne particulate matter (PM2. 5) collected in Guangzhou, China. Investig. Ophthalmol. Vis. Sci. 2016, 57, 3093–3102. [Google Scholar] [CrossRef] [PubMed]
- Li, J.; Tan, G.; Ding, X.; Wang, Y.; Wu, A.; Yang, Q.; Ye, L.; Shao, Y. A mouse dry eye model induced by topical administration of the air pollutant particulate matter 10. Biomed. Pharmacother. 2017, 96, 524–534. [Google Scholar] [CrossRef] [PubMed]
- Krishna, M.; Springall, D.; Frew, A.; Polak, J.; Holgate, S. Mediators of inflammation in response to air pollution: A focus on ozone and nitrogen dioxide. J. R. Coll. Physicians Lond. 1996, 30, 61–66. [Google Scholar] [PubMed]
- Coles, W.H.; Jaros, P.A. Dynamics of ocular surface pH. Br. J. Ophthalmol. 1984, 68, 549–552. [Google Scholar] [CrossRef]
- Callejo, G.; Castellanos, A.; Castany, M.; Gual, A.; Luna, C.; Acosta, M.C.; Gallar, J.; Giblin, J.P.; Gasull, X. Acid-sensing ion channels detect moderate acidifications to induce ocular pain. Pain 2015, 156, 483–495. [Google Scholar] [CrossRef]
- Singh, P.; Tyagi, M.; Kumar, Y.; Gupta, K.; Sharma, P. Ocular chemical injuries and their management. Oman J. Ophthalmol. 2013, 6, 83. [Google Scholar] [CrossRef]


| Study | Location | Study Design Time-span | Study Population | Pollutant | Controlled Variables | Total Events | Lag (d/w) | Main Findings |
|---|---|---|---|---|---|---|---|---|
| Bourcier et al. (2003) [13] | Paris, France | Logistic regression 31/1/1999–31/12/1999 | All | NO, NO2, O3, SO2, PM10 | Temperature, pressure, humidity, wind speed, day of the week | 1272 | d: 0–2 | A strong relation between NO, NO2, and conjunctivitis was observed. Atmospheric pressure, minimal humidity, and wind speed may increase the incidence of ocular surface complaints. |
| Larrieu et al. (2009) [14] | Bordeaux, France | Time series Poisson regression model 2000–2006 | All | NO2, PM10, O3 | Long-term trends, seasonality, days of the week, holidays, temperature, influenza epidemics | 179,142 | d: 0–3 | There was a much higher effect of nitrogen dioxide on visits for conjunctivitis when delayed effects were considered. Conjunctivitis was also significantly associated with PM10 and ozone levels. |
| Chang et al. (2012) [4] | Taiwan, China | Case-crossover Meta-analysis 2007–2009 | All | CO, NO2, SO2, O3, PM10, PM2.5 | Temperature, rainfall, humidity | 26,314,960 | d: 0, 0–1 to 0–5 | The effects on outpatient visits for nonspecific conjunctivitis were strongest for O3 and NO2. In winter, PM10 and SO2 had a more prominent impact on the risk of conjunctivitis. |
| Chiang et al. (2012) [29] | Taiwan, China (four cities) | Time series Generalized linear model 2000–2007 | All | PM10, SO2, NOx, O3 | Relative humidity, wind speed, rainfall, public holiday, calendar months and years. | 234,366 | d: 0 | There were higher risks of conjunctivitis in rural areas, but higher sensitization to air pollutants in urban cities. Children, females, and the older population were at higher risks for both types of conjunctivitis. |
| Szyszkowicz et al. (2012) [27] | Edmonton, Canada | Case-crossover Logistic regression Time-stratification 1/4/1992–31/3/2002 | All, Sex: male, female | O3 | Long-term trends, seasonal effects, day-of-week and month-of-year effects | 7526 | d: 3–8 | For conjunctivitis, associations of these conditions with ozone exposure were observed only in females. |
| Hong et al. (2016) [6] | Shanghai, China | Time series Generalized least squares 2008–2012 | All, Sex: male, female Age: <18, 19–40, 41–60, >60 years | SO2, NO2, PM10, PM2.5, O3 | Periodic trends | 3,211,820 | w: 1, 3 | Research revealed that higher levels of ambient NO2, O3, and temperature increased the chances of outpatient visits for allergic conjunctivitis. Meanwhile, those older than 40 years were only affected by NO2 levels. |
| Szyszkowicz et al. (2016) [28] | Ontario, Canada (nine cities) | Case-crossover Time-stratified Apr 2004–Dec 2011 | All, Sex: male, female Age: ≤17, ≥18 years | NO2, O3, SO2, PM2.5 | Temperature, humidity | 77,439 | d: 0–8 | There were positive associations between air pollution and ED visits for conjunctivitis, with different temporal trends and strength of association by age, sex, and season. Children and young adults were more vulnerable to conjunctivitis infections. |
| Fu et al. (2017) [5] | Hangzhou, China | Time-stratified Case-crossover Logistic regression 1/7/2014–30/6/2016 | All, Sex: male, female Age: 0–1, 2–5, 6–18, 19–64, >65 years | PM10, PM2.5, SO2, NO2, O3, CO | Temperature, humidity, atmospheric pressure | 9737 | d: 0, 0–1 | PM10, PM2.5, SO2, NO2, and CO were associated with the risk of conjunctivitis. SO2 was significantly associated with conjunctivitis patients between 2 and 5 years old and male. PM10 and NO2 were significantly associated with female conjunctivitis patients. |
| Jamaludin et al. (2017) [30] | Johor Bahru, Malaysian | Time series Poisson generalized linear model, negative binomial model 1/1/2012–31/12/2013 | All | NO2, PM10, SO2 | Rainfall, temperature, humidity | 1396 | w: 14,19,20 | SO2 was the most abundant source that contributed to the eye diseases. |
| Lee et al. (2018) [11] | Daegu, Korea | Spatial analysis 1/6/2006–31/12/2014 | All | PM10 | SO2, NO2, O3, CO | 769 | d: 0 | Incidence of conjunctivitis and keratitis varied from region to region. |
| Seo et al. (2018) [10] | Seoul, South Korea | Multi-level regression model 1/1/2011–31/12/2013 | All | O3 | Temperature, humidity sex, age | 48,344 | d: 0 | The outpatient incidence of conjunctivitis was increased by O3. |
| Szyszkowicz et al. (2019) [9] | Edmonton, Canada | Case-crossover Time-stratified Logistic regression Apr 1992–Mar 2002 | Sex: male, female | O3 | Temperature, humidity | 17,211 | d: 0–9 | Significant association was observed for air pollution at lag 5 day for males, and lag 1 day and lag 3 day for females. |
| Pollutant | Groups | No. of the Studies | Heterogeneity, τ2 | Heterogeneity, p-value | Heterogeneity, I2 (%) | Summary RR (95%CI) | p-Value |
|---|---|---|---|---|---|---|---|
| PM2.5 | Male | 2 | 0.000013 | 0.2131 | 35.5 | 1.0016(0.9951–1.0081) | 0.6357 |
| Female | 2 | 0.000028 | 0.1102 | 60.8 | 1.0030(0.9943–1.0117) | 0.5050 | |
| <18year | 2 | 0.000224 | 0.0940 | 64.3 | 1.0086(0.9845–1.0332) | 0.4877 | |
| ≥18year | 2 | 0.000018 | 0.1356 | 55.1 | 1.0022(0.9952–1.0093) | 0.5324 | |
| NO2 | Male | 3 | 0.010419 | 0.0001 | 98.4 | 1.0784(0.9571–1.2151) | 0.2152 |
| Female | 3 | 0.032345 | 0.0001 | 99.6 | 1.1401(0.9233–1.4077) | 0.2231 | |
| <18year | 3 | 0.000161 | 0.2031 | 42.4 | 1.0472(1.0249–1.0700) | <0.0001 | |
| ≥18year | 3 | 0.021135 | 0.0011 | 99.5 | 1.1128(0.9371–1.3214) | 0.2228 | |
| O3 | Male | 5 | 0.000874 | 0.0083 | 88.2 | 1.0321(1.0000–1.0653) | 0.0503 |
| Female | 4 | 0.003334 | 0.0004 | 88.8 | 1.0694(0.9970–1.1471) | 0.0606 | |
| <18year | 3 | 0.000200 | 0.0160 | 72.1 | 1.0357(1.0156–1.0561) | 0.0005 | |
| ≥18year | 3 | 0.000581 | 0.0259 | 93.3 | 1.0178(0.9879–1.0487) | 0.2458 |
| Air pollutants | Covariant | IQR | Estimate | p-Value | τ2 | I2 | R2 |
|---|---|---|---|---|---|---|---|
| NO2 | GDP | 343.07 | 0.24 (−2.69, 3.26) | 0.873 | 0.000385 | 78.586981 | 0.00 |
| Latitude | 19.21 | 0.57 (−2.25, 3.47) | 0.695 | 0.000350 | 72.085796 | 0.00 | |
| Longitude | 119.96 | 0.44 (−2.19, 3.14) | 0.745 | 0.000383 | 75.242153 | 0.00 | |
| Temperature | 4.28 | −0.43 (−2.25, 1.42) | 0.644 | 0.000497 | 85.336819 | 0.00 | |
| Humidity Duration of sunshine | 3.26 0.82 | −2.02 (−4.35, 0.37) −2.77 (−5.60, 0.16) | 0.097 0.063 | 0.000194 0.000188 | 75.394247 63.712071 | 44.37 33.48 | |
| O3 | GDP | 246.99 | −0.65 (−1.46, 0.17) | 0.120 | 0.000054 | 92.101803 | 0.00 |
| Latitude | 18.61 | 0.70 (−0.51, 1.91) | 0.259 | 0.000068 | 93.591351 | 0.00 | |
| Longitude | 122.10 | −0.55 (−1.37, 0.28) | 0.193 | 0.000056 | 93.062946 | 0.00 | |
| Temperature | 11.19 | −0.70 (−1.83, 0.44) | 0.227 | 0.000056 | 84.472565 | 0.00 | |
| Humidity Duration of sunshine | 4.98 0.76 | −0.76 (−1.42, −0.10) 0.42 (−0.67, 1.52) | 0.023 0.455 | 0.000009 | 45.134099 90.739265 | 0.00 | |
| 0.000073 | 0.00 | ||||||
| PM2.5 | GDP | 238.83 | −0.40 (−1.06, 0.27) | 0.238 | 0.000018 | 66.205320 | 0.00 |
| Latitude | 7.01 | −0.07 (−0.58, 0.44) | 0.786 | 0.000047 | 63.714683 | 0.00 | |
| Longitude | 52.65 | 0.11 (−0.29, 0.51) | 0.600 | 0.000042 | 65.152911 | 0.00 | |
| Temperature | 4.28 | 0.00 (−0.55, 0.55) | 0.995 | 0.000049 | 62.464757 | 0.00 | |
| Humidity Duration of sunshine | 3.26 0.53 | −0.17 (−1.32, 0.99) −0.52 (−1.25, 0.21) | 0.771 0.163 | 0.000030 0.000013 | 63.120757 69.255955 | 0.00 0.00 | |
| PM10 | GDP | 266.31 | −0.71 (−2.00, 0.60) | 0.284 | 0.000033 | 69.797637 | 0.00 |
| Latitude | 12.71 | 0.51 (−0.21, 1.22) | 0.165 | 0.000021 | 59.017623 | 8.35 | |
| Longitude | 60.26 | -0.38 (−1.05, 0.30) | 0.278 | 0.000027 | 67.965036 | 0.00 | |
| Temperature | 6.13 | −0.73 (−1.77, 0.32) | 0.171 | 0.000020 | 67.213050 | 23.38 | |
| Humidity Duration of sunshine | 2.44 0.63 | −0.32 (−0.85, 0.21) 0.04 (−1.34, 1.44) | 0.240 0.951 | 0.000020 0.000039 | 76.922096 64.984042 | 20.53 0.00 | |
| SO2 | GDP | 230.65 | 0.20 (−2.13, 2.59) | 0.865 | 0.000314 | 89.692112 | 0.00 |
| Latitude | 15.03 | 0.99 (−1.43, 3.47) | 0.425 | 0.000319 | 89.037967 | 0.00 | |
| Longitude | 68.46 | 0.01 (−1.43, 1.47) | 0.994 | 0.000358 | 90.307176 | 0.00 | |
| Temperature | 6.58 | −0.47 (−2.26, 1.35) | 0.608 | 0.000268 | 91.617762 | 0.00 | |
| Humidity | 3.04 | −0.52 (−2.10, 1.08) | 0.523 | 0.000221 | 90.558627 | 0.00 | |
| Duration of sunshine | 0.66 | −0.71 (−4.23, 2.93) | 0.698 | 0.000380 | 89.840483 | 0.00 |
| Air Pollutants | Begg’s Test | Egger’s Test | Trim-Fill-Begg’s Test | Trim-Fill-Egger’s Test | ||||
|---|---|---|---|---|---|---|---|---|
| τ | p-Value | Z-value | p-Value | τ | p-Value | Z-value | p-Value | |
| CO | 1.0000 | 1.0000 | — | — | ||||
| PM10 | 0.6190 | 0.0690 | 2.4238 | 0.0154 | 0.1715 | 0.5271 | 0.0964 | 0.9232 |
| SO2 | −0.3333 | 0.3813 | −1.6210 | 0.1050 | ||||
| PM2.5 | 0.0000 | 1.0000 | 1.8371 | 0.0662 | ||||
| NO2 | 0.0476 | 1.0000 | 0.0266 | 0.9788 | ||||
| O3 | -0.0556 | 0.9195 | 5.4884 | < 0.0001 | −0.1316 | 0.5388 | −0.0208 | 0.9834 |
© 2019 by the authors. Licensee MDPI, Basel, Switzerland. This article is an open access article distributed under the terms and conditions of the Creative Commons Attribution (CC BY) license (http://creativecommons.org/licenses/by/4.0/).
Share and Cite
Chen, R.; Yang, J.; Zhang, C.; Li, B.; Bergmann, S.; Zeng, F.; Wang, H.; Wang, B. Global Associations of Air Pollution and Conjunctivitis Diseases: A Systematic Review and Meta-Analysis. Int. J. Environ. Res. Public Health 2019, 16, 3652. https://doi.org/10.3390/ijerph16193652
Chen R, Yang J, Zhang C, Li B, Bergmann S, Zeng F, Wang H, Wang B. Global Associations of Air Pollution and Conjunctivitis Diseases: A Systematic Review and Meta-Analysis. International Journal of Environmental Research and Public Health. 2019; 16(19):3652. https://doi.org/10.3390/ijerph16193652
Chicago/Turabian StyleChen, Renchao, Jun Yang, Chunlin Zhang, Bixia Li, Stéphanie Bergmann, Fangfang Zeng, Hao Wang, and Boguang Wang. 2019. "Global Associations of Air Pollution and Conjunctivitis Diseases: A Systematic Review and Meta-Analysis" International Journal of Environmental Research and Public Health 16, no. 19: 3652. https://doi.org/10.3390/ijerph16193652
APA StyleChen, R., Yang, J., Zhang, C., Li, B., Bergmann, S., Zeng, F., Wang, H., & Wang, B. (2019). Global Associations of Air Pollution and Conjunctivitis Diseases: A Systematic Review and Meta-Analysis. International Journal of Environmental Research and Public Health, 16(19), 3652. https://doi.org/10.3390/ijerph16193652