Article

Sun Exposure of Body Districts: Development and Validation of an Algorithm to Predict the Erythemal Ultra Violet Dose

1
Department of Energy, Systems, Territory and Constructions Engineering, University of Pisa, 56122 Pisa, Italy
2
Department of Astronautical, Electrical and Energy Engineering, Sapienza University, 00184 Rome, Italy
*
Author to whom correspondence should be addressed.
Int. J. Environ. Res. Public Health 2019, 16(19), 3632; https://doi.org/10.3390/ijerph16193632
Submission received: 31 August 2019 / Revised: 20 September 2019 / Accepted: 24 September 2019 / Published: 27 September 2019
(This article belongs to the Special Issue Solar UV Radiation: A Neglected Occupational Risk)

Abstract

:
Solar Ultra-Violet (UV) radiation has positive and negative effects on human body tissues. Small doses of solar UV radiation are needed by the human skin for the activation of the vitamin D production. Overexposure to solar UV radiation can produce acute and long-term negative effects, such as sunburns and, in the worst cases, cataracts and skin cancers. For this reason, knowing the amount of UV doses received by people is essential to evaluate their risk to UV overexposure and to evaluate the adequate countermeasure to avoid the negative effects. The original contribution of the present study consists in having searched, collected, adapted and processed a series of technical information and analytical relations, developing an algorithm suitable for the calculation of the erythemal UV dose on sloped surfaces exposed to solar radiation, which at the moment is not present in the scientific literature. The results obtained by the algorithm have been compared to the results of a field measurements campaign, carried out in three different Italian sites. Results comparison indicated that measured and calculated values show a sufficient level of agreement, with a mean absolute error equal to 20%.

1. Introduction

Solar radiation is a part of the electromagnetic spectrum, mainly emitted in the wavelengths of the infrared (IR), of the visible and of the ultra-violet (UV) [1]. Because of the Earth’s atmosphere, the spectral distribution of the solar radiation is different at the extra-atmospheric level with respect to the sea level. Due to the filtering effect of the stratospheric ozone, the solar radiation at the sea level is mainly distributed in the IR (45%) and in the visible (50%), while the UV radiation covers only the 5% of the Sun’s spectrum [2,3]. Even if the UV radiation represents a minimal percentage of the whole solar radiation reaching the Earth’s surface, it can be considered the main risk factor for human health among the photobiological factors [4,5]. The interaction between UV solar radiation and human tissues may induce several effects, some positive but mostly negative [6]. For example, overexposure to UV radiation may produce acute, chronic and long-term adverse effects on the skin and on the eye, such as sunburns (erythemas), skin ageing, photo-dermatoses and in the most serious cases, skin cancers and cataracts [7,8]. On the other hand, UV radiation has also positive effects for the human body. For example, UV radiation is crucial in vitamin D production and, as consequence, it is important for the prevention of diseases such as osteoporosis and rickets [9]. For UV radiation exposure, the turning point is reaching an exposure level that maintains acceptable production rate of vitamin D, minimizing the adverse risks due to overexposure [10,11].
The effectiveness of UV radiation on human body for the acute effects is accounted by biologic efficiency curves, which represent the spectral weighting functions of the solar radiation on human tissues. The Commission Internationale de l’Eclairage indicated the curve to evaluate the erythemal effects [12]. People’s sensitivity to UV radiation differs on the basis of the personal self-ability defence of the skin. Six skin phototypes, ranging from extremely sensitive (I) to very resistant (VI), were individuated according to the Fitzpatrick scale [13]. For each phototype, the cutaneous response to UV (qualitatively expressed), the cancer risk (expressed on a rising risk scale from +/− to ++++) and the lowest UV dose that causes sunburn (expressed by the Minimal Erythema Dose, MED) are also identified, as summarized in Table 1.
In addition to the MED, which depends on the phototype [1,13], other parameters have been introduced at international level to quantify the risk from exposure to UV radiation for the human skin. The Standard Erythemal Dose (SED) is a parameter introduced in order to define an erythemally-weighted dose equal for all the skin sensitivities [1]. One SED is equivalent to an erythemal radiant exposure of 100 J/m2 [1]; it is independent of skin type, and a particular exposure dose in SED may cause erythema in fair skin but none in darker skin. The values of MED can be considered limit values not to be exceeded to ensure the health of workers, while the values of SED are used to assess the actual exposure of workers. For example, a worker with a skin phototype I (extremely sensitive) who is exposed to UV radiation for 1.5 SED reaches his MED, while a worker with a skin phototype VI (very resistant) can be exposed up to 9 SED to reach his relative MED. The UV Index (UVI) is a parameter promoted by the World Health Organization (WHO) to indicate the risk level for skin damage [14]. It is a dimensionless number, ranging from 1 (low) to 11+ (extreme), based on the Erythemal UV irradiance at the ground [15].
People are exposed to UV solar radiation mainly in their own leisure time, but outdoor workers can be exposed to the Sun also during their working activities, and for this reason special attention is posed to this category of people. Some categories of workers (e.g., agricultural and horticultural workers, fishermen, workers in the constructions field, lifeguards, ski resort guides, etc.) can be often overexposed to UV solar radiation, as demonstrated in [16,17]. Given the importance of receiving the right daily dose of UV radiation and in order to reduce the risk of skin damages, it is very important to monitor or to predict the daily UV radiation dose that people receive. For example, if the Erythemal UV dose received by a worker (usually expressed by SED value) is monitored or predicted, it can be compared with the limit values indicated in the literature [18,19], to highlight possible overexposures and take corrective actions in advance.
With reference to the monitoring, personal dosimeters are currently available, they perform direct solar measurements using polysulphone (PS) or polyphenylene oxide (PPO) detectors, which have been calibrated to erythemal exposure [20,21,22,23]. With reference to the analytical prediction, some algorithms for assessing the daily, monthly or yearly erythemal dose in outdoor workers can be found in the literature. Wittlich et al. [24] developed an algorithm for the assessment of the occupational exposure to UV radiation based on time, geographical and personal factors, but with two main limitations: the algorithm provides a retrospective estimation of the solar exposure occurred over a past year, and it requires the use of scientific instruments (such as electronic data loggers) to complete the assessment. The retrospective assessment does not consent to monitor the UV exposure in real time and to prevent overexposure; the use of scientific instruments requires technical knowledge and data post processing. Borra et al. [25] proposed an algorithm for assessing the annual dose of UV solar radiation: it is based on satellite data and personal information acquired by questionnaires; anyway, also in this case, it allows to calculate the dose in the aftermath and not in real time. Park et al. [26] also developed an UV exposure calculation algorithm to support peoples’ daily required UV dose. In this case, the algorithm was used in combination with a UVB LED lighting system and a smartphone’s app, with a very different aim than the overexposure estimation, i.e., to increase the erythemal dose for people who spend too much time indoor environments.
The original contribution of the present study consists in having searched, collected, adapted and processed a series of technical information and analytical relations, developing an algorithm suitable for the calculation of the SED on sloped surfaces (anywhere located on the Earth, anyhow oriented with respect to the south and inclined with respect to the horizontal plane), at the moment not present in the scientific literature. Since the human body districts (i.e., head, torso, arms, legs) can be schematized as a series of prisms, the developed algorithm can be very useful for the assessment of the SED received by the most exposed body surface of a worker engaged in outdoor operations, whatever its posture and orientation are [27]. In this paper, the basic principles used for the development of the algorithm are described together with the calculation method of the Erythemal UV dose on sloped surfaces. Moreover, details are provided for the use of algorithm based on the known input data, and some numerical examples of real cases are shown. Finally, the results of a measurements campaign are shown and discussed in order to provide an experimental validation of the algorithm.

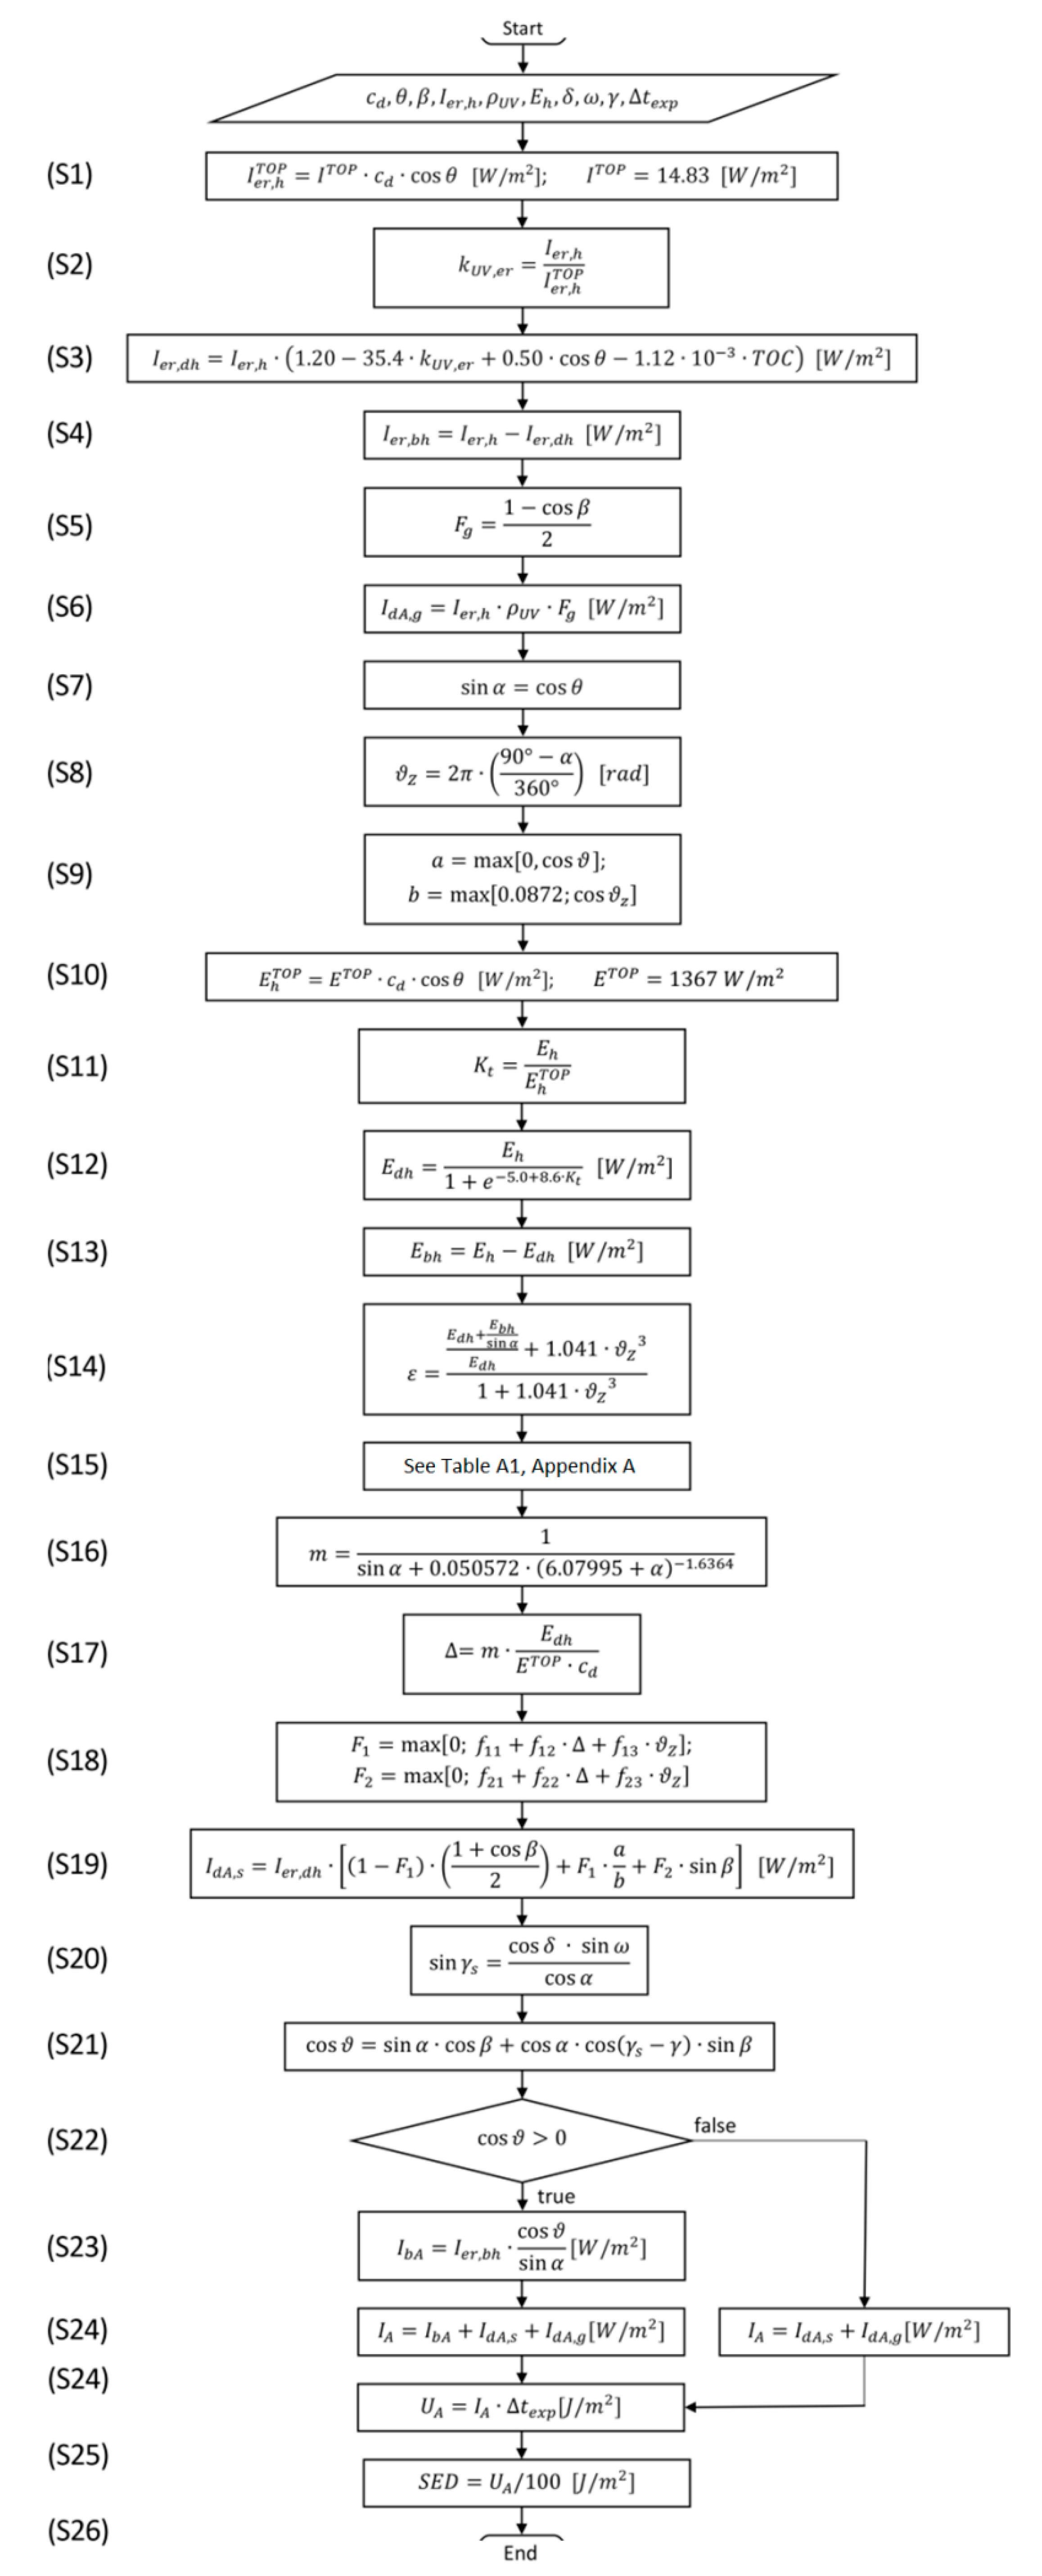
2. Algorithm for the Calculation of the Erythemal UV Dose on Sloped Surfaces

The environmental factors are the main elements influencing the exposure to UV radiation of outdoor workers [25,28]. According to the literature [6], the environmental factors that have the most influence on the spectral composition and the amount of UV radiation reaching the Earth’s surface are listed below.
(a) Atmospheric composition: the presence of gaseous or pollutant particles in the Earth’s atmosphere may induce phenomena of absorption, reflection, refraction and/or diffusion of UV radiation. These phenomena influence the amount and the spectral composition of the UV radiation reaching the Earth’s surface. In particular, the stratospheric ozone [29] occurring for the most between 10 and 30 km above the sea level, is able to absorb all the wavelengths lower than 290 nm providing an effective filter function against UV radiation.
(b) Altitude: UV exposure increases of the 8% every kilometre [30,31].
(c) Clouds coverage: UV solar radiation is scattered when passing through the clouds, since they are formed by small water droplets. The effect of clouds is (in general) an attenuation of the UV solar radiation on the surface [32]. Clouds are highly variable in time and space, so there is great difficulty in their specification, and in the quantification of the attenuation effect. This attenuation effect depends on different clouds properties: such as amount, optical thickness, relative position respect to the Sun, their number of layers, etc. Sometimes UV radiation at the ground level may be affected by clouds in such a manner that it may be higher than UV radiation in cloudless conditions. This effect, known as cloud enhancement, is described for example by [33,34].
(d) Reflectance of the ground (or albedo, ρUV): usually in the UV wavelengths, the percentage of radiation reflected by a surface is low (less than the 12%) [35,36], but in some cases, it may be relevant as for example for the fresh snow (ρUV ≥ 0.80).
Considered the listed environmental factors, an algorithm for the calculation of the Erythemal UV irradiance on sloped surfaces has been developed (see Figure 1).
The actual UV exposure of a surface is influenced by direct, diffuse and reflected radiation, so it depends on its relative position respect to the Sun, source of the direct component, to the Sky, source of the diffuse component, and to the ground, main source of the reflection. The necessary input data for the developed algorithm are the location of the working site (expressed by latitude and longitude), the inclination angle (β) with respect to the horizontal plane and the azimuth angle (γ) with respect to the south of the considered surface, the Erythemal UV irradiance arriving on a horizontal surface (Ier,h), the albedo of the ground (ρUV), the time (day and hour) and the duration (Δtexp) of the exposure to UV radiation. With the knowledge of the Erythemal UV irradiance on a horizontal surface (Ier,h), it is possible to calculate its direct and diffuse components according to the method proposed by Reindl et al. [37]. To apply this method to the UV range, the Total Ozone Column (TOC) data (expressed in Dobson Unit, DU) have been considered in the calculations, to take into account its strong impact on the attenuation of the UV radiation [38]. The diffuse (Ier,dh) and the direct (Ier,bh) components of Ier,h can be evaluated by Equations (1) and (2) respectively [38]:
I er , dh = I er , h · ( 1.20 35.4 · k UV , er + 0.50 · cos θ 1.12 · 10 3 · TOC )
I er , bh = I er , h I er , dh
where kUV,er is the clearness index for the UV irradiance erythemally weighted, and θ is the solar zenith angle. kUV,er is defined as the ratio between Ier,h and the UV irradiance erythemally weighted at the top of the atmosphere, according to Equation (3) [38]:
k UV , er = I er , h / ( I TOP · c d · cos θ )
where ITOP is the erythemally weighted UV solar constant equal to 14.83 W/m2, and cd is the eccentricity correction factor of the Earth-Sun distance (the mean Earth-Sun distance is 1.495 × 10¹¹ m).
The Erythemal UV irradiance arriving on a sloped surface (characterized by an inclination β and an azimuth γ) can be calculated, as the sum of the direct component (IbA), the reflected component by the ground (IdA,g) and the diffuse component by the sky (IdA,s), using Equation (4):
I A = I bA + I dA , s + I dA , g
The direct component IbA can be calculated as the product between the direct Erythemal UV irradiance on a horizontal surface and the ratio between the direct irradiance on the sloped surface and the direct irradiance on a horizontal plane, according to Equation (5) [39]:
I bA = I er , bh · ( cos ϑ / sin α )
where ϑ is the incidence angle, and α is the height of the Sun on the horizon, for example, calculated according to technical standards on climatic data [40]. The reflected component by the ground IdA,g, on the sloped surface, can be expressed by Equation (6) [41]:
I dA , g = I er , h · ρ UV · F g = I er , h · ρ UV · ( 1 cos β ) / 2
where ρUV is the ground albedo, and Fg is the view-factor between the visible portion of the ground and the sloped surface, in the case of a horizontal ground with an unlimited extension and without other reflective surfaces. Typical values of the ground albedo in the UV wavelengths for common materials can be found in the literature [35,36].
The diffuse component by the sky IdA,s can be calculated according to the method proposed by Perez et al. [42,43], considering an anisotropic sky. The Perez-sky model was originally designed to reproduce the diffuse global solar radiation but it has been also applied to reproduce the diffuse Erythemal UV radiation on sloped surface with good results [39,41,44,45]. Once the Erythemal UV irradiance on the sloped surface (IA) is known, the radiant exposure (i.e., the energy received by the surface per unit area, UA) during the duration of the exposure (Δtexp) can be calculated with the Equation (7):
U A = I A · Δ t exp
The SED received by the sloped surface can be calculated with the Equation (8):
SED A = U A / 100
The complete algorithm for the calculation of the Erythemal UV dose on sloped surfaces is shown in the form of a flow chart in Figure 1. The algorithm can be applied to the most exposed surface of each body district, considering it as a tilted plane with respect to the ground.
If the diffuse and direct components of the Erythemal UV irradiance (Ier,bh, Ier,dh) are known, it is possible to calculate the Erythemal UV irradiance on a sloped surface skipping the first four steps of the algorithm (see steps S1–S4 of Figure 1). In this case, the Ier,h and the TOC values are not required among the input data.

3. Use of the Algorithm: Numerical Examples

With the aim of discussing the use of the algorithm, numerical examples are shown for the calculation of the Erythemal UV dose on vertical surfaces facing the four cardinal points (case A) and on sloped surfaces facing south and north directions (case B). The calculations are performed for the summer solstice (i.e., 21 June). The Erythemal UV doses are determined for the location of Pisa (43.72° N, 10.39° E, 4.0 m a.s.l.), considering an exposure of one hour, from a half hour before to a half hour after the solar noontime, in the day of the summer solstice and in clear sky conditions. The necessary input data for the calculation of the Erythemal UV dose on the different surfaces are summarized in Table 2. The calculation examples given in the following subsections have the purpose to show the use of the algorithm on surfaces that can be considered as reference. However, the algorithm allows the calculation for surfaces with any orientation (with respect to the south) and inclination (with respect to the horizontal). Since some important body districts can be represented (as a first approximation) as flat surfaces oriented and inclined according to the posture of the worker (e.g., of the front and back of the human torso), important information about the hourly or daily dose received by the worker can be obtained by the use of the algorithm.

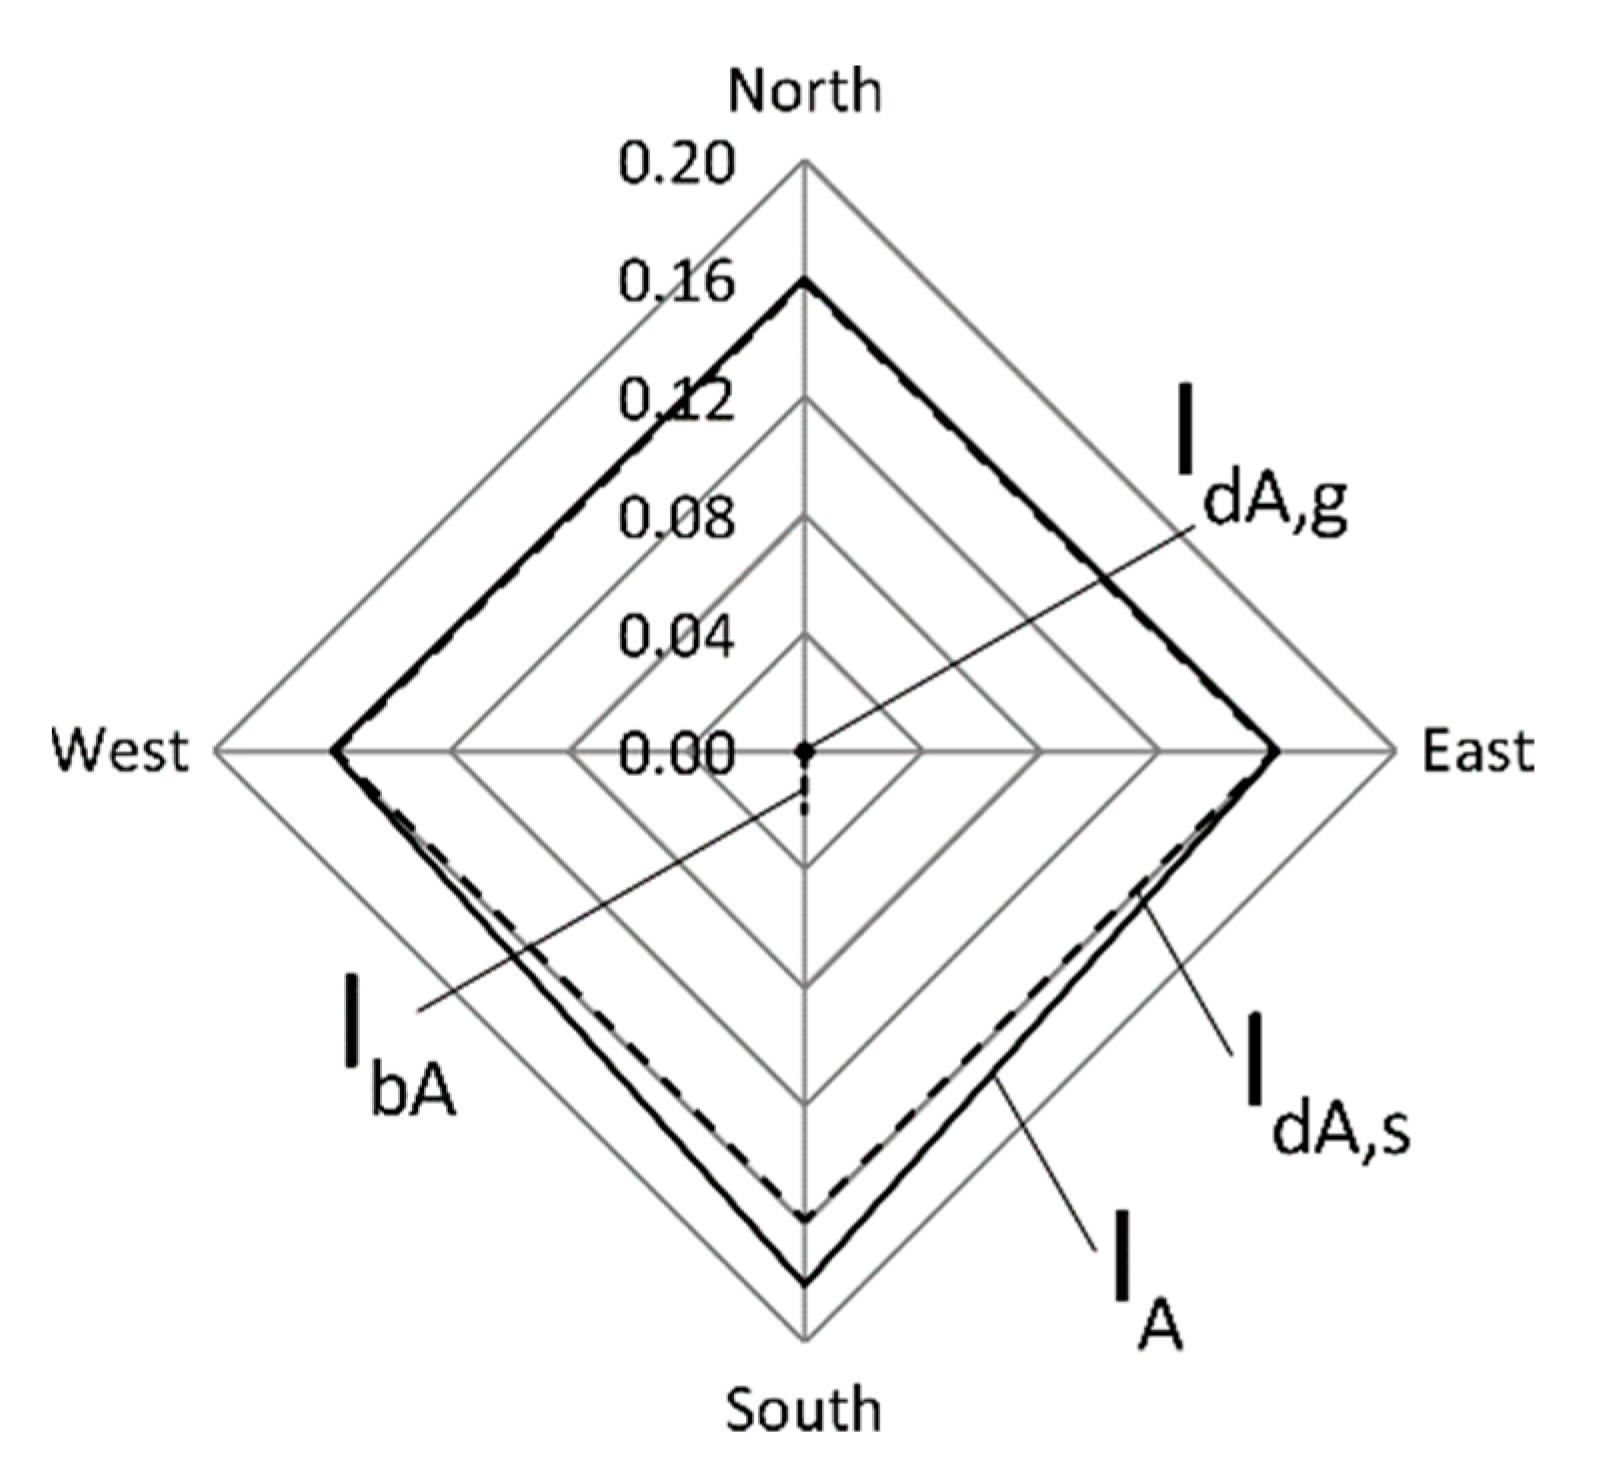
3.1. Case A: Assessment of Erythemal UV Dose on Different Vertical Surfaces Facing the Four Cardinal Points

Considering the input data indicated in Table 2, the calculation procedure for the Case A starts with the evaluation of the clearness index kUV,er (according to the steps S1 and S2 of Figure 1), and it ends with the calculation of the SED value received by a vertical surface facing one of the four cardinal points (according to the step S26 of Figure 1). The procedure has been applied four times to obtain the SED values for vertical surfaces facing the four different cardinal points. The calculation results obtained with the use of the algorithm are summarized in Table 3. As it can be noticed from Table 3, the Erythemal UV dose values (UA) vary from a minimum of 576 J/m2 to a maximum of 652 J/m2, this latter obtained for the vertical surface facing south. The UA values calculated for the vertical surfaces facing west, east and north are the same; this is in line with the hypotheses of having considered a rather narrow interval of time cantered on the solar noontime, which involves negligible values of direct component of Erythemal UV solar radiation for the vertical surfaces with different exposures from the south and having neglected the presence of reflecting surfaces apart from the horizontal surface of the ground. The SED values obtained from the calculations are obviously proportional to the respective UA values. In particular, if the UA and SED values calculated for the vertical surface facing south are considered, it can be noticed how they are higher than the MED values for phototypes from I to V (see Table 1).
With the aim of highlighting the relative weights of the various components that contribute to global Erythemal UV radiation IA, according to step S24 of Figure 1, a radar chart is shown in Figure 2.
In the radar chart, the contributions IbA, IdA,s, IdA,g are indicated for the four analysed vertical surfaces (each of which facing one of the cardinal points). Comparing the values of Table 3 and the chart of Figure 2, it can be observed that the IdA,g values are negligible for all the four vertical surfaces considered, accounting for less than 1% to the respective IA values. The IdA,s values are clearly predominant for all the considered surfaces. For the analysed conditions, the IbA values represent a significant contribution to IA exclusively for the surface facing south, accounting for the 11% to the respective IA value.

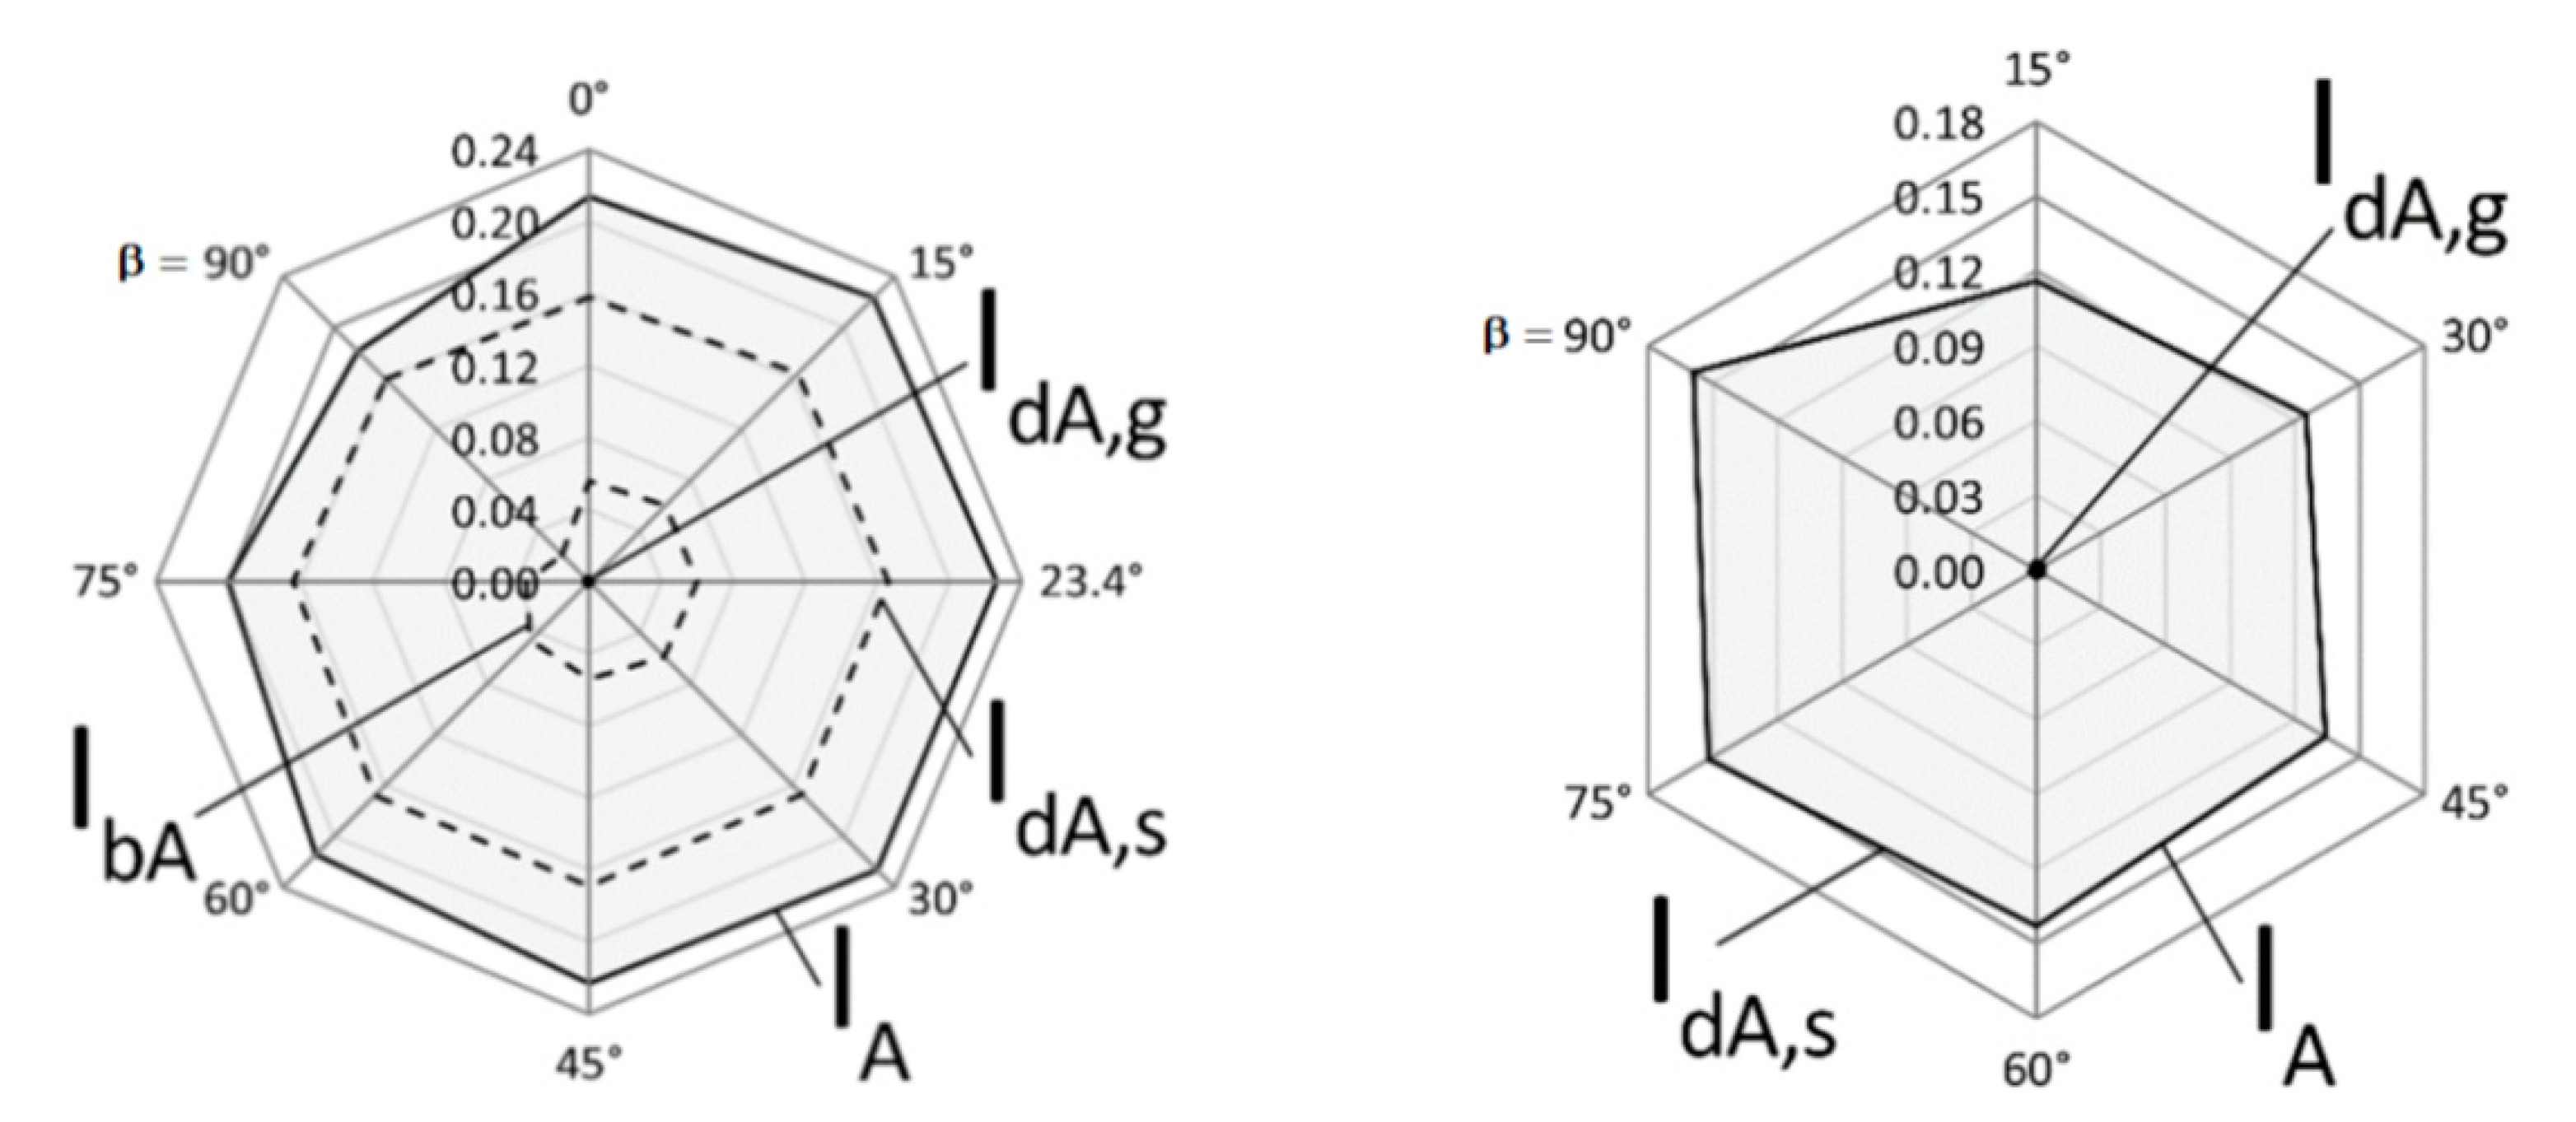
3.2. Case B: Assessment of Erythemal UV Dose on Different Sloped Surfaces Facing South and North

For the Case B also, considering the input data indicated in Table 2, the calculation procedure follows the steps from S1 to S26 shown in Figure 1. In this case, the Erythemal UV doses are assessed for seven surfaces with different inclination β (with respect to the horizontal plane) from β = 0° to β = 90° with increments of 15° (0°, 15°, 30°, 90°). The procedure has been repeated considering the surfaces facing the south and the north directions. An additional surface with β = 23.4° has been considered for the south exposure because being orthogonal to the Sun direction, it is the one characterized by the maximum values of the direct component of the Erythemal UV irradiance. The calculation results, obtained with the use of the algorithm, are summarized in Table 4 and Table 5 for the surfaces facing south and north directions, respectively. Considering the horizontal surface (β = 0°), the calculation results are indicated only in Table 4, since they do not change with the direction.
Table 4 and Table 5 provide a direct comparison of the UA values obtained for sloped surfaces facing south and north respectively; as it can be noticed, the UA values for the surfaces facing south are on average 1.5 times higher than the respective values for the surfaces facing north with the same β. In fact, in the simulated time conditions, the sloped surfaces facing north are exposed only to reflected and diffuse solar radiation, and the algorithm correctly considers equal to 0 W/m2 the direct component (IbA). The maximum difference between south and north exposure, in the analysed conditions, is obtained for the sloped surface with β = 15° for which the UA value facing south is 1.9 times higher than the respective value facing north; for this angle of inclination, the reflected component of the ground is minimal. This difference decreases with the increase of β; in fact, for the vertical surface (β = 90°), the UA value facing south is about 1.1 times higher than the respective value facing north. With reference to the UA values for the surfaces facing south, potentially more dangerous for the exposure risks, in the analysed conditions they vary from a minimum of 652 J/m2 (obtained for β = 90°) to a maximum of 814 J/m2 (obtained for β = 30°). It is interesting to observe that the sloped surfaces facing south, with β till to 60°, have UA values higher than the horizontal surface (β = 0°); for 15° < β < 30° the algorithm considers a higher direct component than for β = 0°, since their inclination is more orthogonal to the Sun position, while for 45° < β < 60° the algorithm results are correctly affected by the reflected component. It can be also observed that the sloped surface with β = 23.4° facing south, despite having the higher value of IbA (0.060 W/m2), is characterized by an UA value similar to the one of the surface with β = 30°. However, the UA values for sloped surfaces facing south with β in the range 15°–45° are, in the analysed conditions, very similar (percentage difference lower than 1.4). The SED values obtained from the calculations are, as for the previously discussed Case A, proportional to the respective UA values. In particular, if the UA and SED values calculated for the sloped surfaces facing south are considered, it can be noticed how they are higher than the MED values for phototypes from I to V (see Table 1).
With the aim of highlighting the relative weights of the various components that contribute to global Erythemal UV radiation IA, according to step S24 of Figure 1, radar charts are shown in Figure 3. In the radar charts, the contributions IbA, IdA,s, IdA,g are indicated for the analysed sloped surfaces facing south (left side chart) and north (right side chart). Comparing the values of Table 4 and Table 5 and the charts of Figure 3, it can be observed that the IdA,g values are negligible for all the four vertical surfaces considered, accounting for less than 1% to the respective IA values. The IdA,s values are clearly predominant for all the considered surfaces. For the analysed conditions, the IbA values represent a significant contribution to IA exclusively for the surface facing south, accounting from the 12% (obtained for β = 90°) till to the 27% (obtained for β = 23.4°) of the IA respective values.

4. Validation of the Algorithm

4.1. Field Measurements of Erythemal UV Dose

A campaign of field measurements has been carried out for recording the Erythemal UV doses on several sloped surfaces; the results have been used to validate the algorithm. In order to test different conditions, also considering some typical locations where outdoor workers act, the measurements have been performed in three sites having different features and location: the upper terrace of the Faculty of Engineering of Sapienza University in Rome (41.89° N, 12.49° E, 21 m a.s.l.), a parking area in the little town of Guadagnolo located in the centre of Italy (41.91° N, 12.93° E, 1218 m a.s.l.) and a parking area near the School of Engineering in Pisa (43.72° N, 10.39° E, 4 m a.s.l.). The measurements have been carried out in the time band from 11:30 a.m. to 1:30 p.m., which represents the most critical period for the solar radiation exposure.
In Rome, the measurements have been carried out on 21 February, on the upper terrace (floor at 10 m above the ground level) inside the cloister of the ancient building of the Sapienza University. A GigaHertz Radiometer X1-1, placed at a height of 150 cm from the floor, has been used for recording the Erythemal UV irradiance on a horizontal surface (Ier,h, W/m2). The radiometer is equipped with a XD-9506 probe, composed of two different sensors (operating range of wavelengths of 250–325 nm and 325–400 nm respectively), that is able to measure Ier,h according to the UV action spectrum [12].
In Guadagnolo, the measurements have been carried out on 25 February, in a parking area (ground level) away from buildings and other reflective surfaces (except the ground). The measurement equipment has been the same used for the measurements made in Rome. In this case (in addition to Ier,h), values of UA on a horizontal surface, vertical surfaces facing the four cardinal points, sloped (β = 30° and β = 60°) surfaces facing north and south, have been recorded always at a height h = 1.5 m from the ground.
In Pisa, the measurements have been carried out the 16 May 2019, in a park area away from buildings and other reflective surfaces (except the ground). Measurements have been performed with the photo radiometer Delta Ohm HD2102, equipped with a LP471A-UVeff probe. The probe can measure (resolution of 0.001 W/m2) the erythemal irradiance (Ier, W/m2) weighted according to the UV action spectrum [12]. The probe is equipped with a diffuser for the correct measure according to the cosine law. The measurement chain (photo radiometer and probe) has been subjected to regular annual calibration (calibration uncertainty lower than 5%) at the manufacturer’s laboratories. The photo radiometer has been used to measure erythemal irradiances on a horizontal surface, a vertical surface facing the four cardinal points, sloped (β = 45°) surfaces facing north and south, always at a height of h = 1.5 m from the ground. By integrating the irradiance values over time, it has been possible to obtain the dose values for all the surfaces.
The recordings have been made with a sample rate of 60 s, evaluating the Erythemal UV dose received by the surfaces every 600 s; these values have been unchanged for the measurements taken in all the sites. The exposure time Δtexp 600 s has been considered adequate for the validation of the algorithm as the variations of the UV irradiance, due to the Sun positions, in this time interval can be considered negligible. The main characteristics of the measurement activity are summarized in Table 6 for the three considered sites. The results of the irradiance values measured in the three sites are shown in Table 7. The Erythemal UV exposure doses have been calculated from the measured irradiance values considering an exposure time Δtexp = 600 s with the relations of steps 25 and 26 of Figure 1.

4.2. Application of the Algorithm to the Measured Conditions

By using the developed algorithm and the TOC, Eh, ρUV values acquired from the cited references (see Table 2), the UA values have been analytically calculated for all the conditions (site, day, hour, β, γ and Δtexp) previously considered for the measurement. The Eh values, used as input data for the algorithm, are shown in Table 8.
For the site of Rome, the UA values have been calculated considering the following input data: n = 52; φ = 41.54° N; ψ = 12.28° E; TOC = 345 DU; ρUV = 0.057. For the site of Guadagnolo, the UA values have been calculated considering the following input data: n = 56; φ = 41.91° N; ψ = 12.92° E; TOC = 320 DU; ρUV = 0.018. For the site of Pisa, the UA values have been calculated considering the following input data: n = 136; φ = 43.72° N; ψ = 10.39° E; TOC = 363 DU; ρUV = 0.055. For the three sites, the values adopted as input data of β and γ were the same of the measurement surfaces (see Table 6 and Table 7). The complete results obtained from the application of the algorithm are shown in Table 9.

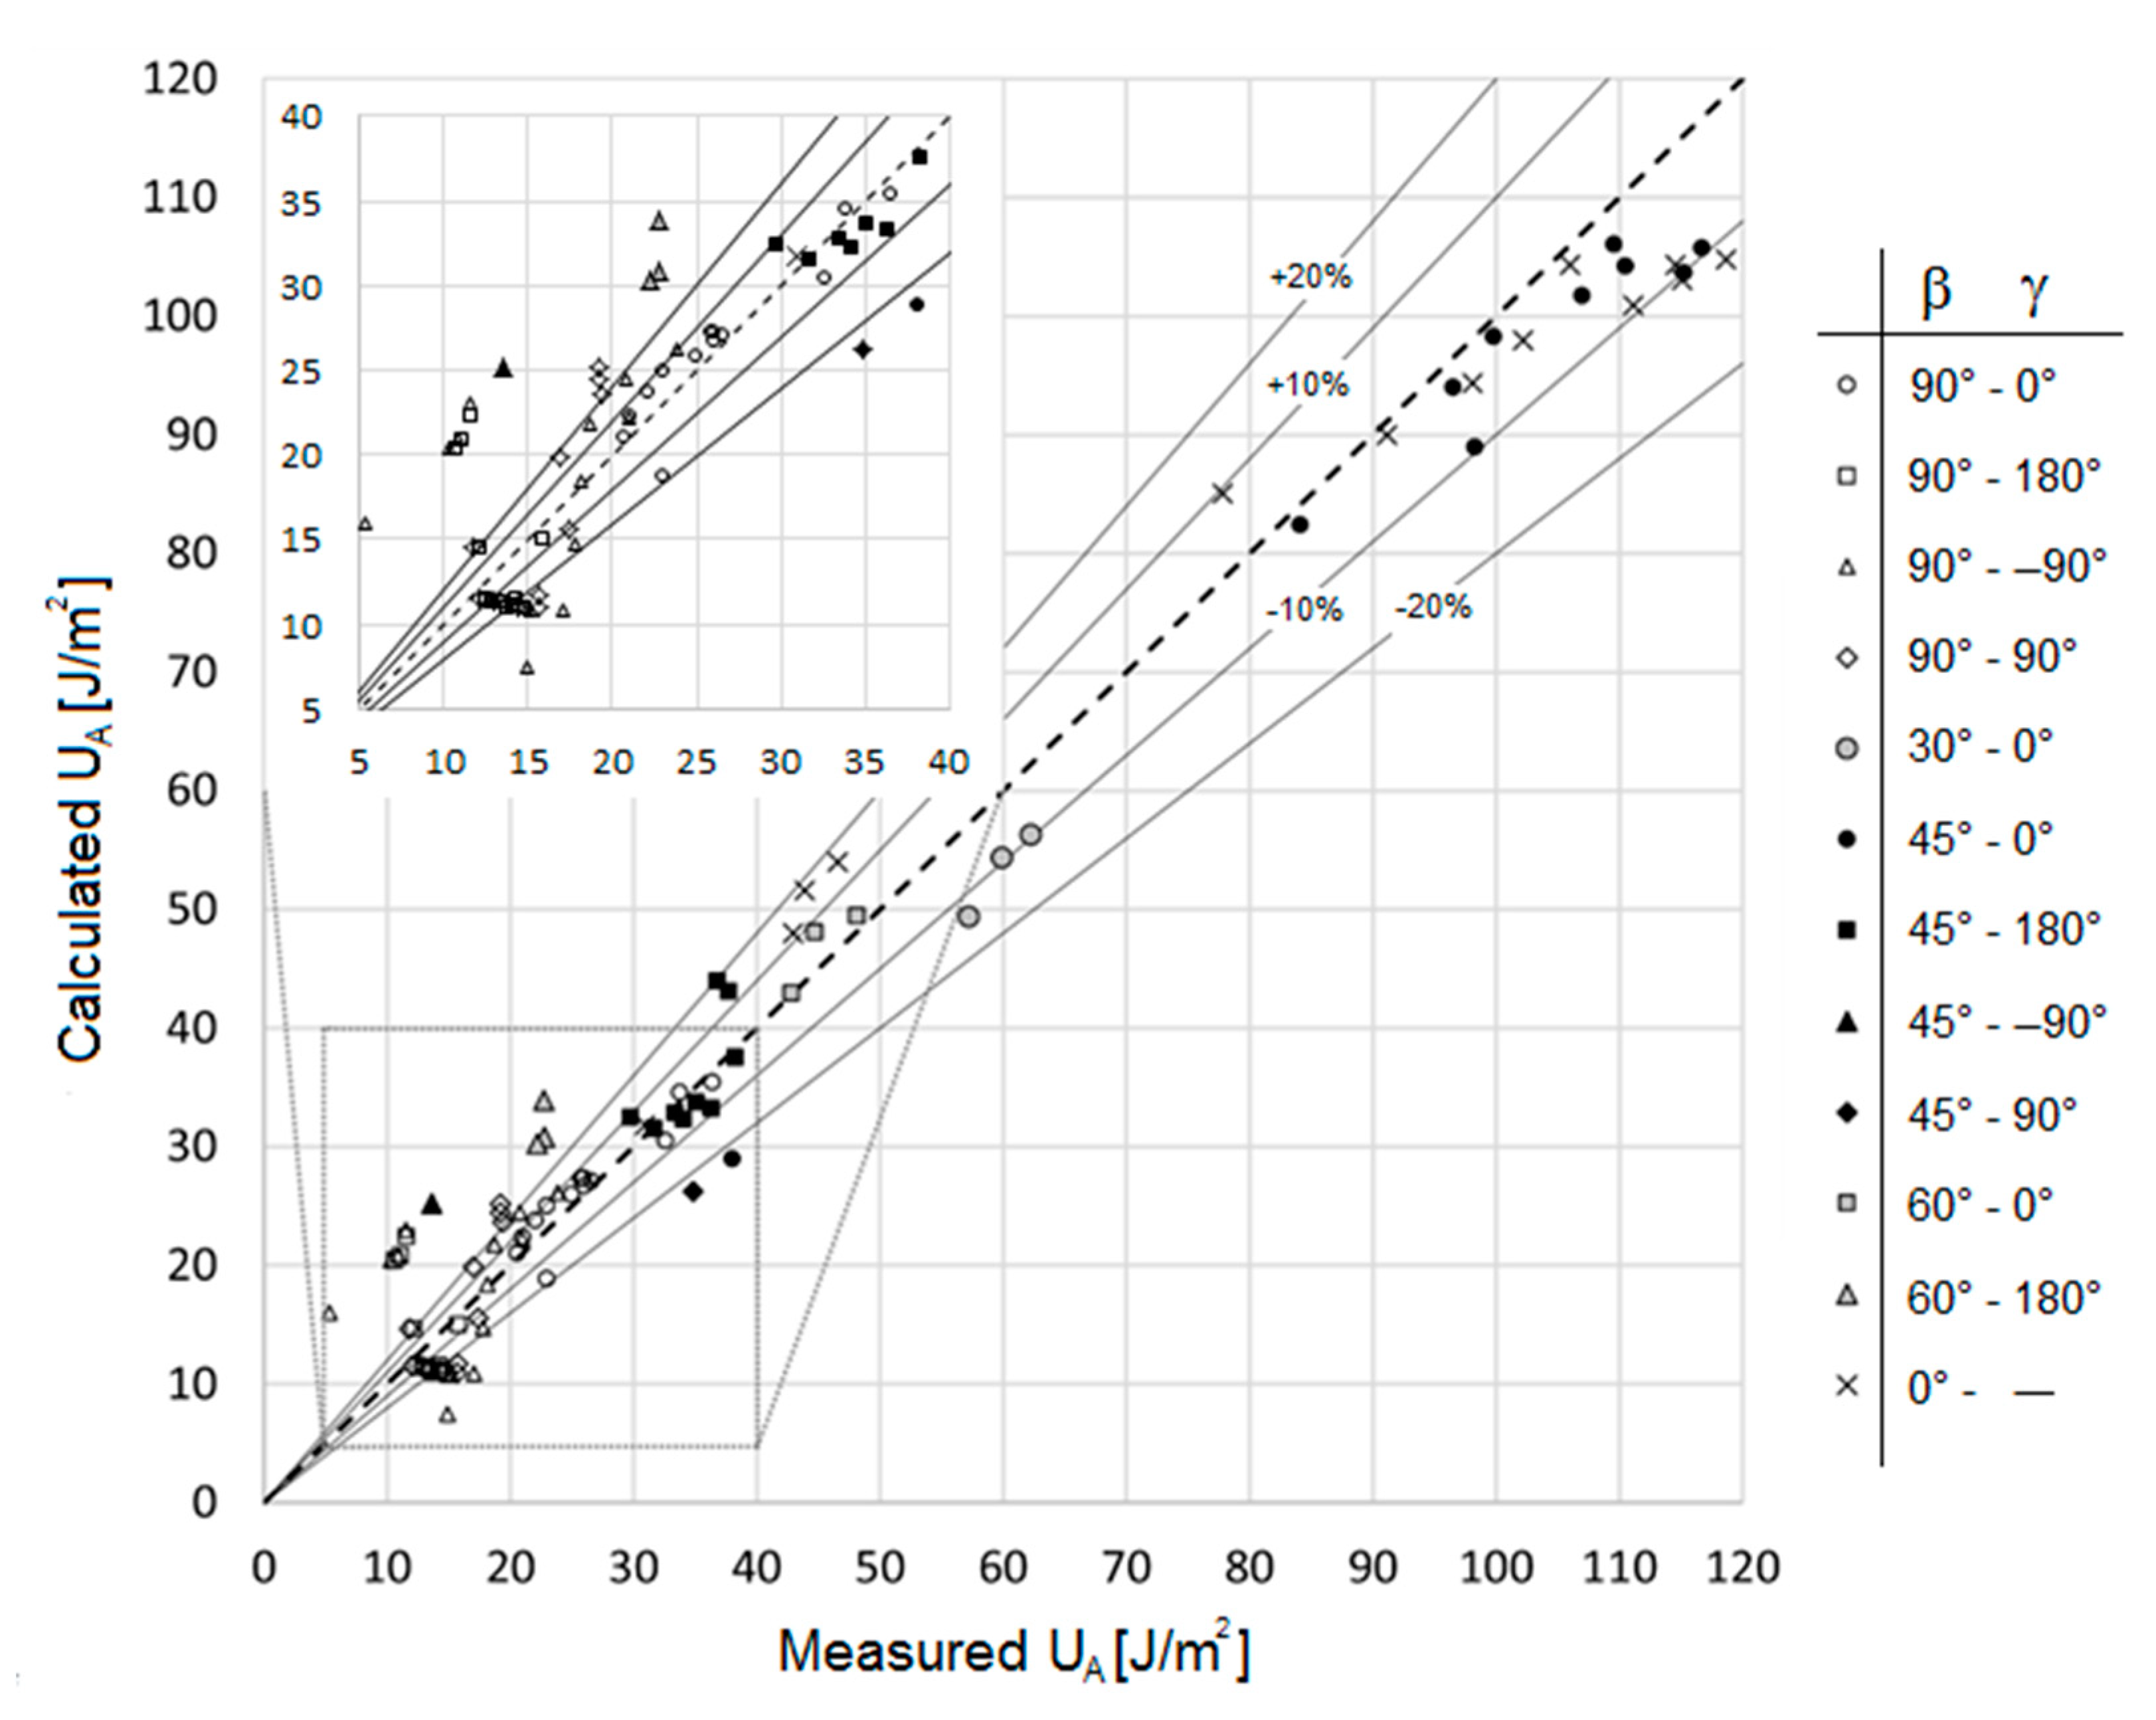
4.3. Comparison between Measured and Calculated Values of the Erythemal UV Dose

In order to evaluate the accuracy of the algorithm in calculating the Erythemal UV dose for surfaces with different inclinations and directions, the results obtained applying the algorithm have been compared with the measurement results. The comparison, carried out on the basis of the parameter UA, is graphically shown in Figure 4; as it can be observed, the measured and calculated data show a sufficient level of agreement, also in light of the complexity of the problem. The value of the mean absolute error, between calculated and measured data, is 20%. The 50% of the measured values are predicted by the algorithm with a deviation lower than 10%, and the 75% of the measured values are predicted by the algorithm with a deviation lower than 18%. It is useful to note that the higher values of the deviations are observed for low values of UA (see Figure 4), for which also the exposure risks are less significant. If only UA values higher than 40 J/m2 are considered, the value of the mean absolute error, between calculated and measured data, is 7%. The highest deviations were observed for the measurements taken in the site of Guadagnolo, in particular for the vertical surfaces (β = 90°) facing north and east (γ = 180° and γ = −90° respectively), for which the calculated values are higher than the measured ones. This is probably due to the fact that the forecasting algorithm cautiously does not consider the reductions in the contribution of solar radiation produced by the presence of mountains and hills in the horizon height, more significant in this site with respect to the other analysed sites, which diminished the visible surface of the sky. In Figure 5, average values of the percentage deviations are shown; they were derived by grouping the data (measured and calculated) obtained for the same β values (left side chart) and for the same γ values (right side chart). From the charts of Figure 5, it is possible to observe that the deviations are very low for surfaces with low inclination with respect to the horizontal plane (β ≤ 45°) and for surfaces facing south (γ = 0°), with values of about 10% and 7%, respectively. This is probably due to the fact that in these surfaces the direct component, which is easier to compute respect to the diffuse one, is predominant.

5. Conclusions

In this paper, an original algorithm developed for the calculation of the Erythemal UV dose on sloped surfaces (anywhere located on the Earth’s surface, anyhow oriented with respect to the south and inclined with respect to the horizontal plane) has been described, and then it has been applied to some vertical and sloped surfaces facing the different cardinal points. Finally, the algorithm has been validated by comparing the calculated values of Erythemal UV dose (using the algorithm) with those obtained from a measurements campaign in three different sites, located in central Italy.
The numerical examples of the use of the algorithm have been proposed in the paper in order to show the potential of the algorithm. With the algorithm, the values of the Erythemal UV dose and the Standard Erythemal Dose can be estimated in addition to the relative weights of the various components (beam, diffused, reflected) that contribute to global Erythemal UV radiation received by surfaces. The previous values can be calculated for surfaces with any location, orientation and inclination, which can represent different body districts of people. The algorithm provides information of fundamental importance for the estimation of the exposure conditions to solar radiation of outdoor workers. It allows the determination of the worker’s personal exposures, highlighting for example the exceeding of the MED values fixed for a specific phototype, foreseeing any risks of overexposure and allowing to intervene with preventive and protective actions able to reduce the risks of tissue damage.
From the activity conduced for the validation of the algorithm, it has been possible to observe that the measured and the calculated data show a sufficient level of agreement. Considering the differences in the environments of measure, the results show that the algorithm estimates the Erythemal UV dose in good accordance with the field measurements. Assuming the exposure duration of 600 s, as discussed in the paper, the mean absolute error between calculated and measured data is 20%. If only the UA values higher than 40 J/m2 are considered, the mean absolute error decreases to 7%; in fact, the higher values of the deviations are observed for low values of UA, for which also the exposure risks are less significant. The accuracy of the algorithm could be increased taking into account the reductions in the contribution of solar radiation produced by the presence, in the horizon height, of mountains and hills.

Author Contributions

All the authors contributed in equal parts to the research activity and to the paper writing. In particular, the measurement activity carried out in the sites of Rome and Guadanolo and the post processing of the relative acquired data were developed by the research group of Sapienza University (C.B., L.G., F.B.); the measurement activity carried out in the site of Pisa, the post processing of the relative acquired data and the analytical structure of the algorithm were developed by the group of the University of Pisa (G.S., D.L., F.L.).

Funding

This research was partially supported by the National Institute for Insurance against Accidents at Work (INAIL) within the 2016–2018 Research Activity Plan, Collaboration Research Call INAIL-BRIC (Project ID 14/2016).

Conflicts of Interest

The authors declare no conflict of interest. The funders had no role in the design of the study; in the collection, analyses, or interpretation of data; in the writing of the manuscript or in the decision to publish the results.

Appendix A

Table A1. Table for the selection of the coefficients f in function of the coefficient of transparency of the sky according to the Perez method (see step S15 of Figure 1).
ε1.000–1.0651.065–1.2301.230–1.5001.500–1.9501.950–2.8002.800–4.5004.500–6.200>6.200
f11−0.00830.12990.32970.56820.87301.13261.06020.6777
f120.58770.68260.48690.1875−0.3920−1.2367−1.5999−0.3273
f13−0.0621−0.1514−0.2211−0.2951−0.3616−0.4118−0.3589−0.2504
f21−0.0596−0.01890.05540.10890.22560.28780.26420.1561
f220.07210.0660−0.0640−0.1519−0.4620−0.8230−1.1272−1.3765
f23−0.0220−0.0289−0.0261−0.01400.00120.05590.13110.2506
Table A2. List of used symbols.
SymbolUnitDescription
a, b-coefficients considering the angle of incidence of Sun rays on the investigated surface
cd-eccentricity correction factor of Earth’s orbit
EbhW/m2direct component of the solar total irradiance on a horizontal surface
EdhW/m2diffuse component of the solar total irradiance on a horizontal surface
EhW/m2solar total irradiance on a horizontal surface
ETOPW/m2solar total irradiance at the top of the atmosphere, equal to 1367 W/m2
Fg-view-factor between the visible portion of the ground and the considered surface
F1-coefficient for the circumsolar irradiance
F2-coefficient for the horizon irradiance
IAW/m2Erythemal UV irradiance arriving on the investigated surface
IbAW/m2direct component of Erythemal UV irradiance
Ier,hW/m2Erythemal UV irradiance on a horizontal surface
IdA,gW/m2Erythemal UV irradiance reflected from the ground
IdA,sW/m2Erythemal UV irradiance diffused from the sky
Ier,bhW/m2direct component of the Erythemal UV irradiance on a horizontal surface
Ier,dhW/m2diffuse component of the Erythemal UV irradiance on a horizontal surface
Ier,hTOPW/m2Erythemal UV irradiance at the top of the atmosphere
ITOPW/m2UV solar constant erythemally weighted, equal to 14.83 W/m2
Kt-Clearness index
kUV,er-UV clearness index
m-air optic mass
SEDJ/m2Standard Erythemal Dose received by a plane during the time of exposure Δtexp
UAJ/m2Erythemal UV dose arriving on the investigated surface during an exposure time of Δtexp
α°angle of elevation of the Sun
β°inclination angle (angle between the horizontal and the investigated surface)
γ°azimuth angle (angle between the perpendicular projection on a horizontal plane of the investigated surface and the south direction, positive in the direction from south to west)
γs°solar azimuth angle
δ°solar declination angle
Δ-coefficient of brightness
Δtexpstime of exposure of the investigated surface between the instant ti and the instant ti+1
ε-coefficient of transparency of the sky
θ°solar zenith angle
ϑZradsolar zenith angle
ϑ°angle of incidence of the Sun rays on the investigated surface
ρUV-ground albedo in the UV wavelengths
ω°hour angle

References

  1. CIE 209. Rationalizing Nomenclature for UV Doses and Effects on Humans; International Commission of Illumination: Wien, Austria, 2014. [Google Scholar]
  2. Ghetti, F.; Checcucci, G.; Bornman, J.F. Environmental UV Radiation: Impact on Ecosystems and Human Health and Predictive Models, 1st ed.; Springer: Dordrecht, The Netherlands, 2001; pp. 1–288. [Google Scholar]
  3. Militello, A.; Borra, M.; Bisegna, F.; Burattini, C.; Grandi, C. Smart technologies: Useful tools to assess the exposure to solar ultra violet radiation for general population and outdoor workers. In Proceedings of the Fotonica 2016—18th Italian National Conference on Photonic Technologies, Rome, Italy, 6–8 June 2016; pp. 1–4. [Google Scholar]
  4. IARC 55. Evaluation of Carcinogenic Risks to Humans—Solar and Ultraviolet Radiation; International Agency for Research on Cancer: Lyon, France, 1992. [Google Scholar]
  5. International Commission on Non-Ionizing Radiation Protection (ICNIRP). Guidelines on limits of exposure to Ultraviolet Radiation of wavelengths between 180 nm and 400 nm (incoherent optical radiation). Health Phys. 2004, 87, 171–186. [Google Scholar] [CrossRef] [PubMed]
  6. International Commission on Non-Ionizing Radiation Protection (ICNIRP). Statement on protection of workers against ultraviolet radiation. Health Phys. 2010, 99, 66–87. [Google Scholar] [CrossRef] [PubMed]
  7. Modenese, A.; Bisegna, F.; Borra, M.; Grandi, C.; Gugliermetti, F.; Militello, A.; Gobba, F. Outdoor work and solar radiation exposure: Evaluation method for epidemiological studies. Med. Pr. 2016, 26, 577–587. [Google Scholar] [CrossRef] [PubMed]
  8. Modenese, A.; Korpinen, L.; Gobba, F. Solar radiation exposure and outdoor work: An underestimated occupational risk. Int. J. Environ. Res. Public Health 2018, 15, 2063. [Google Scholar] [CrossRef] [PubMed]
  9. Chubarova, N.; Zhdanova, Y. Ultraviolet resources over Northern Eurasia. J. Photochem. Photobiol. B Biol. 2013, 127, 38–51. [Google Scholar] [CrossRef] [PubMed]
  10. Lucas, R.; McMichael, T.; Smith, W.; Armstrong, B. Solar Ultraviolet Radiation: Global Burden of Disease from Solar Ultraviolet Radiation; Environmental Burden of Disease Series, No. 13; World Health Organization: Geneva, Switzerland, 2006. [Google Scholar]
  11. WHO. INTERSUN—The Global UV Project: A Guide and Compendium; World Health Organization: Geneva, Switzerland, 2003; pp. 1–258. [Google Scholar]
  12. ISO/CIE 17166. Erythema Reference Action Spectrum and Standard Erythema Dose; International Organization for Standardization: Geneva, Switzerland, 2019. [Google Scholar]
  13. D’Orazio, J.; Jarrett, S.; Amaro-Ortiz, A.; Scott, T. UV Radiation and the Skin. Int. J. Mol. Sci. 2013, 14, 12222–12248. [Google Scholar] [CrossRef] [PubMed] [Green Version]
  14. WHO. Global Solar UV Index: A Practical Guide; World Health Organization: Geneva, Switzerland, 2002. [Google Scholar]
  15. Leccese, F.; Salvadori, G.; Lista, D.; Burattini, C. Outdoor workers exposed to UV radiation: Comparison of UV Index forecasting methods. In Proceedings of the IEEE 2018—18th International Conference on Environment and Electrical Engineering, Palermo, Italy, 12–15 June 2018; pp. 1–5. [Google Scholar]
  16. Siani, A.M.; Casale, G.R.; Sisto, R.; Colosimo, A.; Lang, C.A.; Kimlin, M.G. Occupational Exposures to Solar Ultraviolet Radiation of Vineyard Workers in Tuscany (Italy). Photochem. Photobiol. 2011, 87, 925–934. [Google Scholar] [CrossRef] [PubMed]
  17. Serrano, M.A.; Cañada, J.; Moreno, J.C. Erythemal Ultraviolet Exposure in two Groups of Outdoor workers in Valencia, Spain. Photochem. Photobiol. 2009, 85, 1468–1473. [Google Scholar] [CrossRef] [PubMed]
  18. De Backer, H.; Koepke, P.; Bais, A.; de Cabo, X.; Frei, T.; Gillotay, D. Comparison of measured and modelled UV indices for the assessment of health risks. Meteorol. Appl. 2001, 8, 267–277. [Google Scholar] [CrossRef]
  19. Jacklitsch, B.; Williams, J.; Musolin, K.; Coca, A.; Kim, J.H.; Turner, N. Occupational Exposure to Heat and Hot Environments; U.S. Department of Health and Human Services, Centers for Disease Control and Prevention, NIOSH: Cincinnati, OH, USA, 2016; pp. 1–159.
  20. Marini, A.; Ciribolla, C.; Lazzeri, L.; d’Errico, F. Redox-Phen solution: A water equivalent dosimeter for UVA, UVB and Xrays radiation. Radiat. Phys. Chem. 2018, 147, 7–12. [Google Scholar] [CrossRef]
  21. Wainwright, L.; Parisi, A.V.; Downs, N. Dual calibrated dosimeter for simultaneous measurements of erythemal and vitamin D effective solar ultraviolet radiation. J. Photochem. Photobiol. B Biol. 2016, 157, 15–21. [Google Scholar] [CrossRef] [PubMed]
  22. Wainwright, L.; Parisi, A.V. Characterisation and evaluation of a miniaturised polyphenylene oxide dosimeter for ultraviolet exposures. J. Photochem. Photobiol. B Biol. 2013, 120, 98–103. [Google Scholar] [CrossRef] [PubMed] [Green Version]
  23. Schouten, P.W.; Parisi, A.V.; Turnbull, D.J. Usage of the polyphenylene oxide dosimeter to measure annual solar erythemal exposures. Photochem. Photobiol. 2010, 86, 706–710. [Google Scholar] [CrossRef] [PubMed]
  24. Wittlich, M.; Westerhausen, S.; Kleinespel, P.; Rifer, G.; Stöppelmann, W. An approximation of occupational lifetime UVR exposure: Algorithm for retrospective assessment and current measurements. J. Eur. Acad. Dermatol. Venereol. 2016, 30, 27–33. [Google Scholar] [CrossRef] [PubMed]
  25. Borra, M.; Grandi, C.; Militello, A.; Burattini, C.; Gugliermetti, L.; Mangione, A.; Bisegna, F.; Modenese, A.; Gobba, F. Developing an algorithm to assess the Erythemal UV dose for outdoor workers. In Proceedings of the IEEE 2018—18th International Conference on Environment and Electrical Engineering, Palermo, Italy, 12–15 June 2018; pp. 1–5. [Google Scholar]
  26. Park, D.H.; Oh, S.T.; Lim, J.H. Development of UVB LED Lighting System Based on UV Dose Calculation Algorithm to Meet Individual Daily UV Dose. Appl. Sci. 2019, 9, 2479. [Google Scholar] [CrossRef]
  27. Gugliermetti, L.; Burattini, C.; Militello, A.; Asdrubali, F.; Salvadori, G.; Leccese, F.; Bisegna, F. Real time UV erythemal personal exposure monitoring in outdoor workplaces. In Proceedings of the IEEE 2019–19th International Conference on Environment and Electrical Engineering, Genoa, Italy, 11–14 June 2019; pp. 1–5. [Google Scholar]
  28. Vanicek, K.; Frei, T.; Litynska, Z.; Schmalwieser, A. UV Index for the Public, COST-713 Action Final Report, Brusselles. 1999. Available online: https://publications.europa.eu/en/publication-detail/-/publication/ed2d6032-860f-4237-bb16-c34a7daceb17/language-en (accessed on 17 September 2019).
  29. Al-Mostafa, Z.A.; Elminir, H.K.; Abulwfa, A.; Al-Shehri, S.M.; Alshehri, F.A.; Al-Rougy, I.M.; Bazyad, A.A. Evaluation of erythemal ultraviolet solar radiation over Saudi Arabia. Sol. Energy 2015, 113, 258–271. [Google Scholar] [CrossRef]
  30. Piazena, H. The effect of altitude upon the solar UV-B and UV-A Irradiance in the tropical Chilean Andes. Sol. Energy 1996, 57, 133–140. [Google Scholar] [CrossRef]
  31. Dvorkin, A.Y.; Steinberger, E.H. Modelling the altitude effect on solar UV radiation. Sol. Energy 1999, 65, 181–187. [Google Scholar] [CrossRef]
  32. Calbó, J.; Pagès, D.; González, J.A. Empirical studies of cloud effects on UV radiation: A review. Rev. Geophys. 2004, 43, 1–28. [Google Scholar] [CrossRef]
  33. Lovengreen, C.; Fuenzalida, H.A.; Videla, L. On the spectral dependency of UV radiation enhancements due to clouds in Valdivia, Chile. J. Geophys. Res. Atmos. 2005, 110, 1–7. [Google Scholar] [CrossRef]
  34. Tiba, C.; da Silva Leal, S. Enhancement of UV radiation by cloud effect in NE of Brazil. Int. J. Photoenergy 2017, 2017, 8107435. [Google Scholar] [CrossRef]
  35. Chadyšienė, R.; Girgždys, A. Ultraviolet radiation albedo of natural surfaces. J. Environ. Eng. Landsc. Manag. 2008, 16, 83–88. [Google Scholar] [CrossRef]
  36. De Paula Corrêa, M.; Ceballos, J.C. UVB surface albedo measurements using biometers. Revis. Bras. Geofís. 2008, 26, 411–416. [Google Scholar] [CrossRef]
  37. Reindl, D.T.; Beckman, W.A.; Duffie, J.A. Diffuse fraction correlations. Sol. Energy 1990, 45, 1–7. [Google Scholar] [CrossRef]
  38. Sanchez, G.; Serrano, A.; Cancillo, M.L. Modelling the erythemal surface diffuse irradiance fraction for Badajoz, Spain. Atmos. Chem. Phys. 2017, 17, 12697–12708. [Google Scholar] [CrossRef]
  39. Serrano, D.; Marín, M.J.; Utrillas, M.P.; Tena, F.; Martinez-Lozano, J.A. Measurement and modelling of global erythemal irradiance on inclined planes. J. Mediterr. Meteorol. Climatol. 2010, 7, 57–66. [Google Scholar] [CrossRef]
  40. UNI 10349-1. Heating and Cooling of Buildings—Climatic Data—Part 1: Monthly Means for Evaluation of Energy Need for Space Heating and Cooling and Methods for Splitting Global Solar Irradiance into the Direct and Diffuse Parts and for Calculate the Solar Irradiance on Tilted Planes; Ente Nazionale Italiano di Unificazione: Milan, Italy, 2016. (In Italian) [Google Scholar]
  41. Serrano, D.; Marín, M.J.; Utrillas, M.P.; Tena, F.; Martinez-Lozano, J.A. Modelling of the UV Index on vertical and 40° tilted planes for different orientations. Photochem. Photobiol. Sci. 2012, 11, 333–344. [Google Scholar] [CrossRef]
  42. Perez, R.; Seals, R.; Ineichen, P.; Stewart, R.; Menicucci, D. A new simplified version of the Perez diffuse irradiance model for tilted surfaces. Sol. Energy 1987, 39, 221–231. [Google Scholar] [CrossRef]
  43. Perez, R.; Stewart, R.; Seals, R.; Guertin, T. The Development and Verification of the Perez Diffuse Radiation Model; SAND88-7030 Contractor Report; Sandia National Laboratories: Albuquerque, NM, USA, 1988; pp. 1–176. [Google Scholar]
  44. Utrillas, M.P.; Martínez-Lozano, J.A. Performance evaluation of several versions of the Perez tilted diffuse irradiance model. Sol. Energy 1994, 53, 155–162. [Google Scholar] [CrossRef]
  45. Utrillas, M.P.; Marín, M.J.; Esteve, A.R.; Estellés, V.; Tena, F.; Cañada, J.; Martínez-Lozano, J.A. Diffuse ultraviolet erythemal irradiance on inclined planes: A comparison of experimental and modelled data. Photochem. Photobiol. 2009, 85, 1245–1253. [Google Scholar] [CrossRef]
Figure 1. Flow-chart representation of the developed algorithm (the steps are sequentially numbered; for a complete list of used symbols, see Table A2 in Appendix A).
Ijerph 16 03632 g001
Figure 2. Erythemal UV irradiances received, in the analysed conditions, by vertical surfaces facing the four cardinal points.
Ijerph 16 03632 g002
Figure 3. Comparison of the Erythemal UV irradiances received by sloped surfaces facing south (on the left) and north (on the right).
Ijerph 16 03632 g003
Figure 4. Comparison between measured and calculated Erythemal UV irradiance for the three sites.
Ijerph 16 03632 g004
Figure 5. Average values of the percentage deviations, derived by grouping the data (measured and calculated) obtained for the same β values (left side chart) and for the same γ values (right side chart).
Ijerph 16 03632 g005
Table 1. Skin phototypes and related cutaneous responses to UV, cancer risks and MEDs.
Skin PhototypeCutaneous Response to UVCancer RiskMED (J/m2)
I—Extremely sensitiveAlways burns++++150
II—Very sensitiveBurns easily+++/++++250
III—SensitiveBurns moderately+++300
IV—Mildly sensitiveBurns minimally++400
V—Resistant skinRarely burns+600
VI—Very resistantAlmost never burns+/−900
Note. Minimal Erythema Dose (MED, J/m2) is defined as the least amount of UV radiation that causes reddening and inflammation on a single individual’s previously unexposed skin; the MED value can vary also within the same phototype, on a precautionary basis the lower value for each phototype is given in the Table.
Table 2. Required input data for the numerical examples.
TOC = 329 DUTotal Ozone Column (Value from: https://ozoneaq.gsfc.nasa.gov)
β = 90°inclination angle of the vertical surface (case A)
β = variablefrom 0° to 90° (case B)
Ier,h = 0.214 W/m2Erythemal UV irradiance on a horizontal surface, estimated with the TUV software
(https://www2.acom.ucar.edu/modeling/tropospheric-ultraviolet-and-visible-tuv-radiation-model)
δ = 23.45°solar declination angle (value from [40])
ω = 0°hour angle (value from [40])
θ = 20.27°solar zenith angle (value from [40])
ρUV = 0.011ground albedo in the UV wavelengths (e.g., green grass, value from [35])
Eh = 931.6 W/m2solar total irradiance (value from: http://soda-pro.com/web-services)
γ = −90°, 0°, 90°, 180°azimuth angles of the surfaces facing east, south, west, north directions respectively
Δtexp = 3600 stime of exposure
Table 3. Calculation results for vertical surfaces facing the four cardinal points (21 June, solar noontime).
SouthWestEastNorth
Ier,dh[W/m2]0.1580.1580.1580.158
Ier,bh[W/m2]0.0560.0560.0560.056
IdA,g[W/m2]0.0010.0010.0010.001
IdA,s[W/m2]0.1590.1590.1590.159
cosϑ-0.34600−0.346
IbA[W/m2]0.021000
IA[W/m2]0.1810.1600.1600.160
UA[J/m2]652576576576
SED-6.55.85.85.8
Table 4. Calculation results for sloped surfaces facing the south direction (21 June, solar noontime).
β[°]015304560759023.4
Ier,dh[W/m2]0.1580.1580.1580.1580.1580.1580.1580.158
Ier,bh[W/m2]0.0560.0560.0560.0560.0560.0560.0560.056
IdA,g[W/m2]04.01 × 10−51.58 × 10−43.45 × 10−45.89 × 10−48.72 × 10−41.18 × 10−39.72 × 10⁻⁵
IdA,s[W/m2]0.1580.1640.1670.1690.1680.1640.1590.166
cosϑ-0.9380.9960.9860.9080.7690.5770.3461.000
IbA[W/m2]0.0560.0590.0590.0540.0460.0350.0210.060
IA[W/m2]0.2140.2230.2260.2230.2140.2000.1810.226
UA[J/m2]770803814803770720652814
SED-7.78.08.18.07.77.26.58.1
Table 5. Calculation results for sloped surfaces facing the north direction (21 June, solar noontime).
β[°]153045607590
Ier,dh[W/m2]0.1580.1580.1580.1580.1580.158
Ier,bh[W/m2]0.0560.0560.0560.0560.0560.056
IdA,g[W/m2]2.31 × 10−32.20 × 10−32.01 × 10−31.77 × 10−31.48 × 10−31.02 × 10−3
IdA,s[W/m2]0.1160.1250.1340.1430.1520.159
cosϑ-−0.996−0.986−0.908−0.769−0.577−0.346
IbA[W/m2]000000
IA[W/m2]0.1190.1270.1360.1450.1530.160
UA[J/m2]428457490522551576
SED-4.34.64.95.25.55.8
Table 6. Characteristics of the measurement activity for the three considered sites.
RomeGuadagnoloPisa
Day21 February 201925 February 201916 May 2019
Time band (GMT+1)11:30–13:0013:00–13:3011:30–13:30
Solar Zenith Angle [°]58.62–52.7551.26–51.0532.95–24.83
WeatherSunnySunny with some cloudsSunny
Type of floorRed brickGravelAsphalt
Surface of measureβ [°]90450906030090450
γ [°]90
0
−90
90
0
−90
-180
90
0
−90
180
0
0-180
90
0−90
180
0
-
h [m]1.5
Table 7. UA values obtained from the measurement activity in the three considered sites for horizontal and sloped surfaces facing the four cardinal points.
Site (Day)Hourβ [°]γ [°]UA [J/m2]Site (Day)Hourβ [°]γ [°]UA [J/m2]
Rome (2019-02-21)11:3090012.96Pisa (2019-05-16)12:009018012.90
11:459017.409012.96
12:00−9015.31022.02
12:150-30.93−9020.94
12:3045038.024518034.08
12:459034.82096.54
13:00−9022.610-98.10
Guadagnolo (2019-02-25)13:009018011.5912:159018013.38
9019.219013.32
036.42022.98
−9011.51−9018.72
6018022.714518033.36
048.11099.78
30062.270-102.18
0-46.5812:309018014.10
13:159018011.109014.34
9019.21024.96
033.77−9018.12
−9010.914518036.30
6018022.750106.98
044.700-111.12
30058.9012:459018013.68
0-43.889014.40
13:309018010.66025.98
9019.37−9017.76
032.574518037.74
−9010.300110.52
6018022.200-115.08
042.7913:009018014.82
30057.229015.66
0-42.96026.58
Pisa (2019-05-16)11:309018012.18−9017.04
9011.824518035.10
020.580116.70
−9023.820-114.54
4518029.7613:159018014.22
084.129015.72
0-77.82025.74
11:459018012.42−9014.88
9012.064518036.78
021.000109.56
−9020.760-118.68
4518031.6813:309018015.78
098.289016.98
0-91.14025.92
−9015.18
4518038.28
0115.26
0-106.02
Notes. The γ values are obviously not indicated for horizontal surfaces (β = 0°). The UA values are referred to an exposure time Δtexp = 600 s.
Table 8. Eh values of the three considered sites used as input data for the algorithm.
HourEh [W/m2]
RomeGuadagnoloPisa
11:30160.99-851.92
11:45159.60874.68
12:00157.04894.84
12:15153.27911.96
12:30148.57925.72
12:45142.96935.56
13:00136.48100.08940.20
13:15-102.12922.20
13:30103.77911.88
Table 9. UA values calculated with the algorithm in the three considered sites for horizontal and sloped surfaces facing the four cardinal points.
Site (Day)Hourβ [°]γ [°]UA [J/m2]Site (Day)Hourβ [°]γ [°]UA [J/m2]
Rome (2019-02-21)11:3090018.85Pisa (2019-05-16)12:009018011.42
11:459015.579011.42
12:00−9015.99023.79
12:150-31.80−9022.23
12:3045028.964518032.26
12:459026.22094.02
13:00−9025.200-94.34
Guadagnolo (2019-02-25)13:009018022.3912:159018011.27
9025.159011.28
035.43024.98
−9022.99−9021.74
6018033.894518032.82
049.48098.24
30056.280-97.95
0-54.0012:309018011.11
13:159018020.869011.15
9024.46025.96
034.54−9018.39
−9014.864518033.24
6018030.790101.70
048.070-100.89
30054.3212:459018010.97
0-51.609011.02
13:309018020.44026.67
9023.61−9014.73
030.514518043.11
−9020.440104.23
6018030.220-103.02
042.9413:009018010.92
30049.349010.98
0-48.00027.11
Pisa (2019-05-16)11:309018014.62−9010.89
9014.624518033.72
021.040105.76
−9026.140-104.33
4518032.4813:159018011.51
082.419011.70
0-85.05027.28
11:459018011.52−907.48
9011.524518043.96
022.370106.05
−9024.430-104.76
4518031.5013:309018014.99
088.989019.86
0-89.97027.33
−9010.83
4518037.52
0103.68
0-104.31
Notes. The γ values are obviously not indicated for horizontal surfaces (β = 0°). The UA values are referred to an exposure time Δtexp = 600 s.

