Dementia Patient Segmentation Using EMR Data Visualization: A Design Study


Abstract
:1. Introduction
1.1. Research Background
1.2. Study Goals and Research Process
- (a)
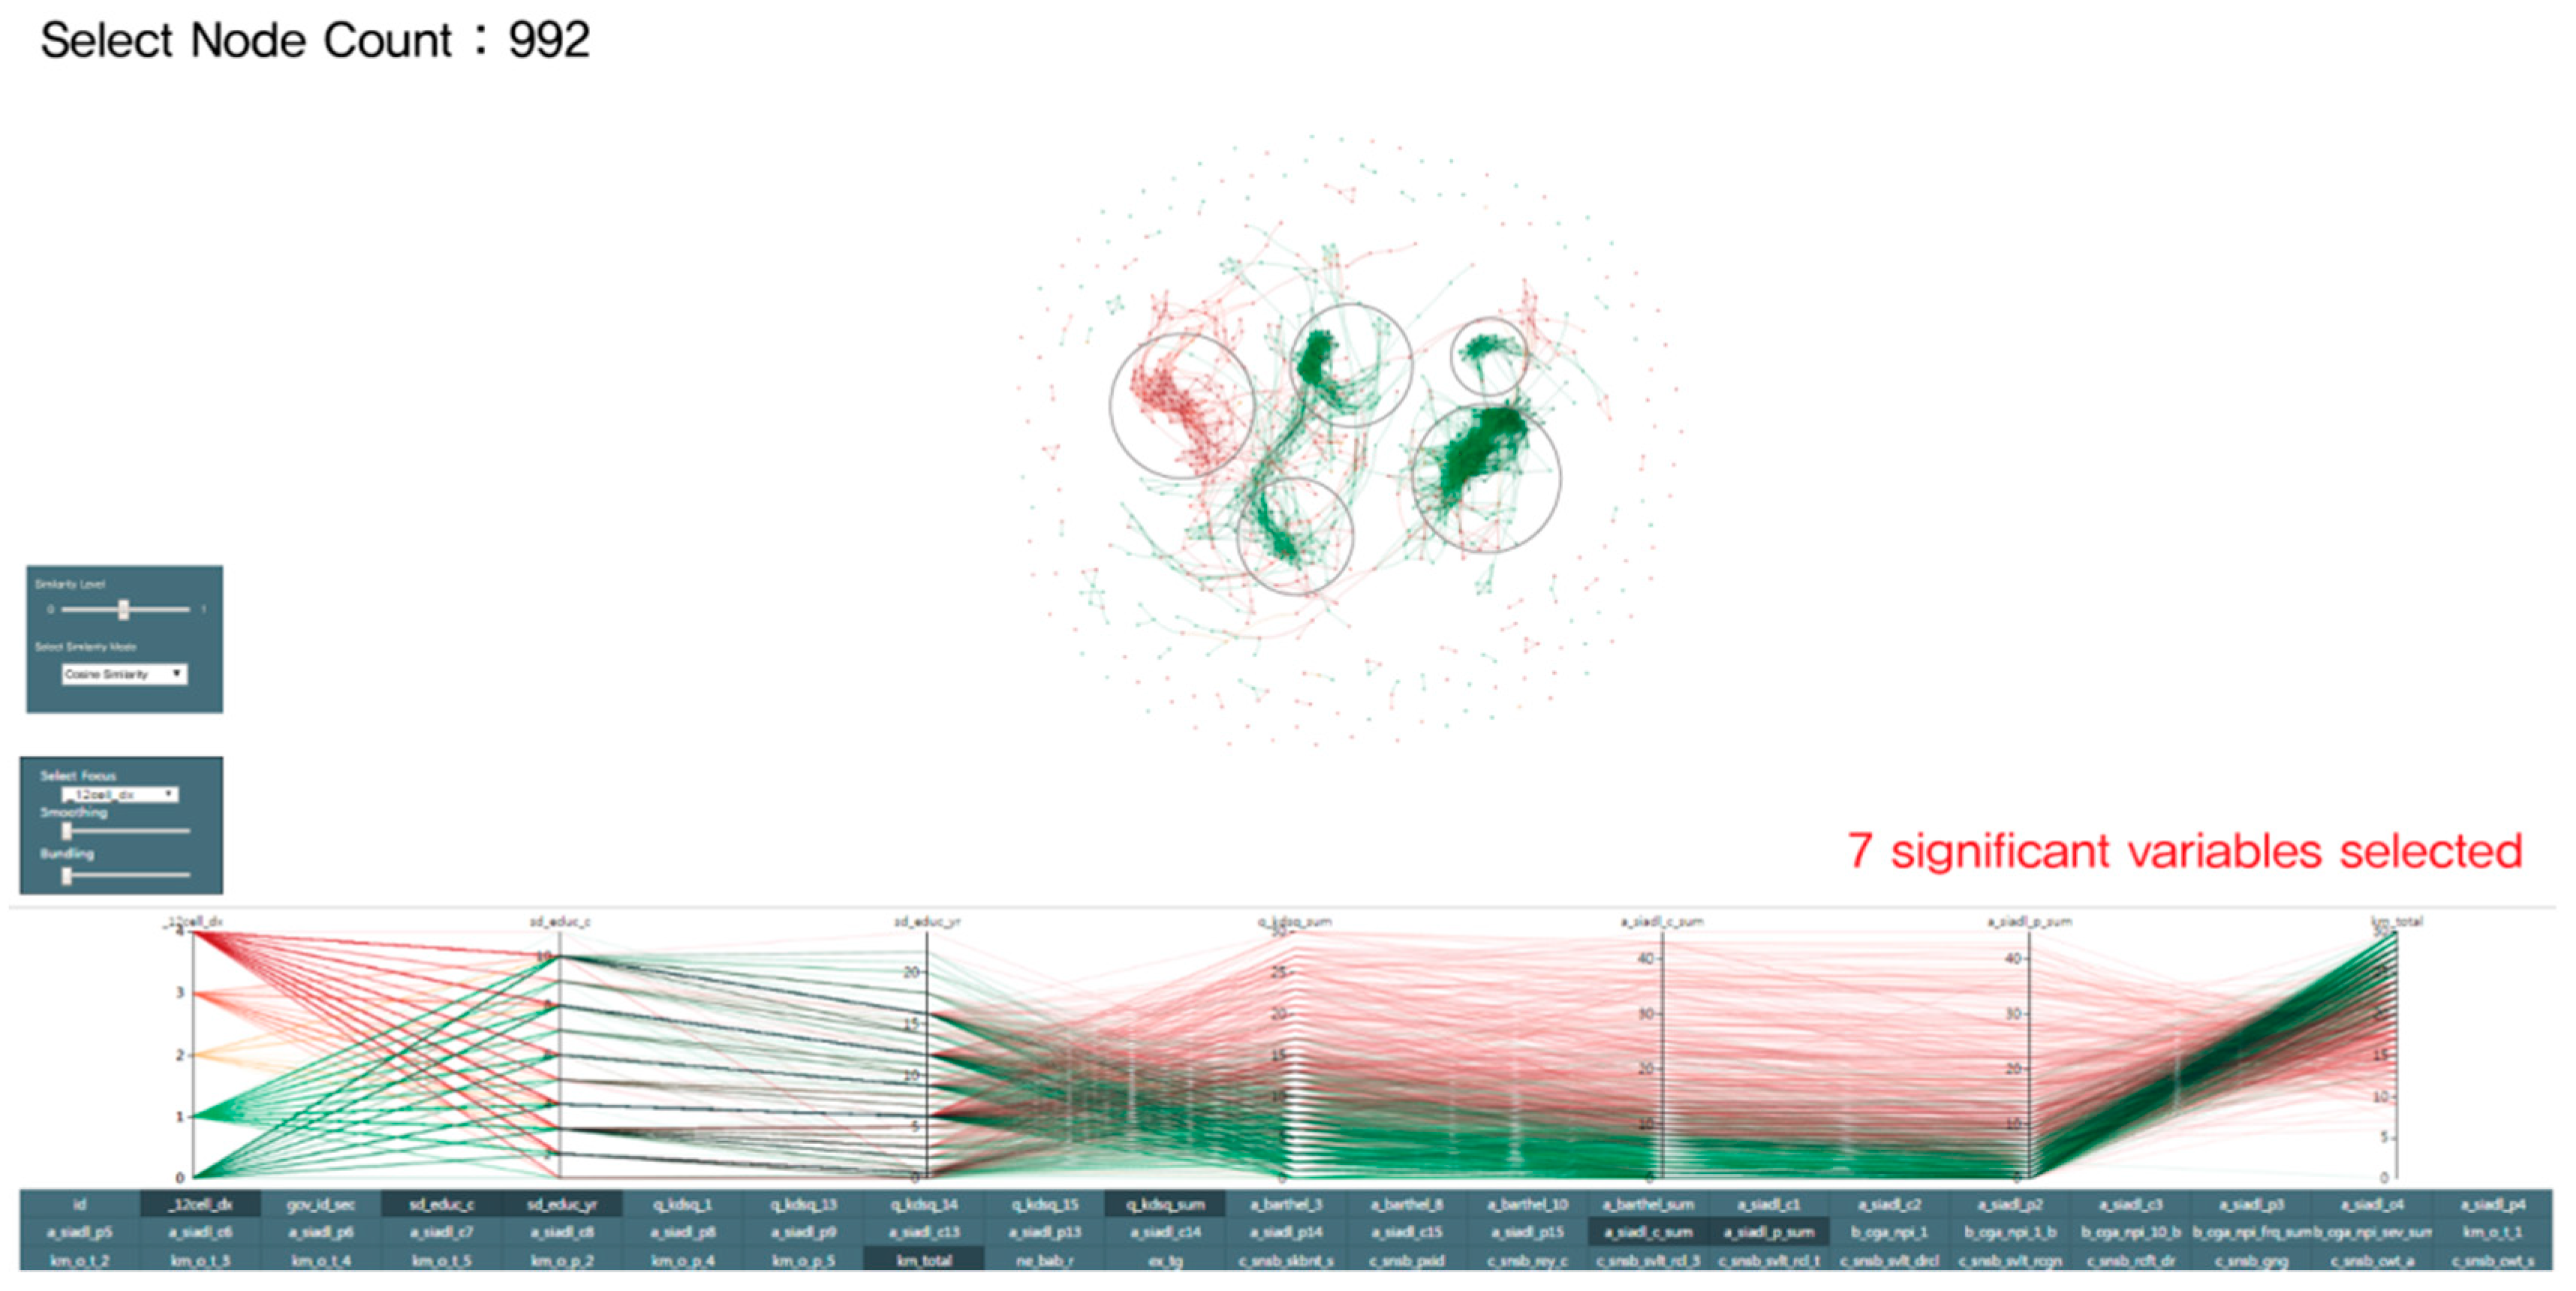
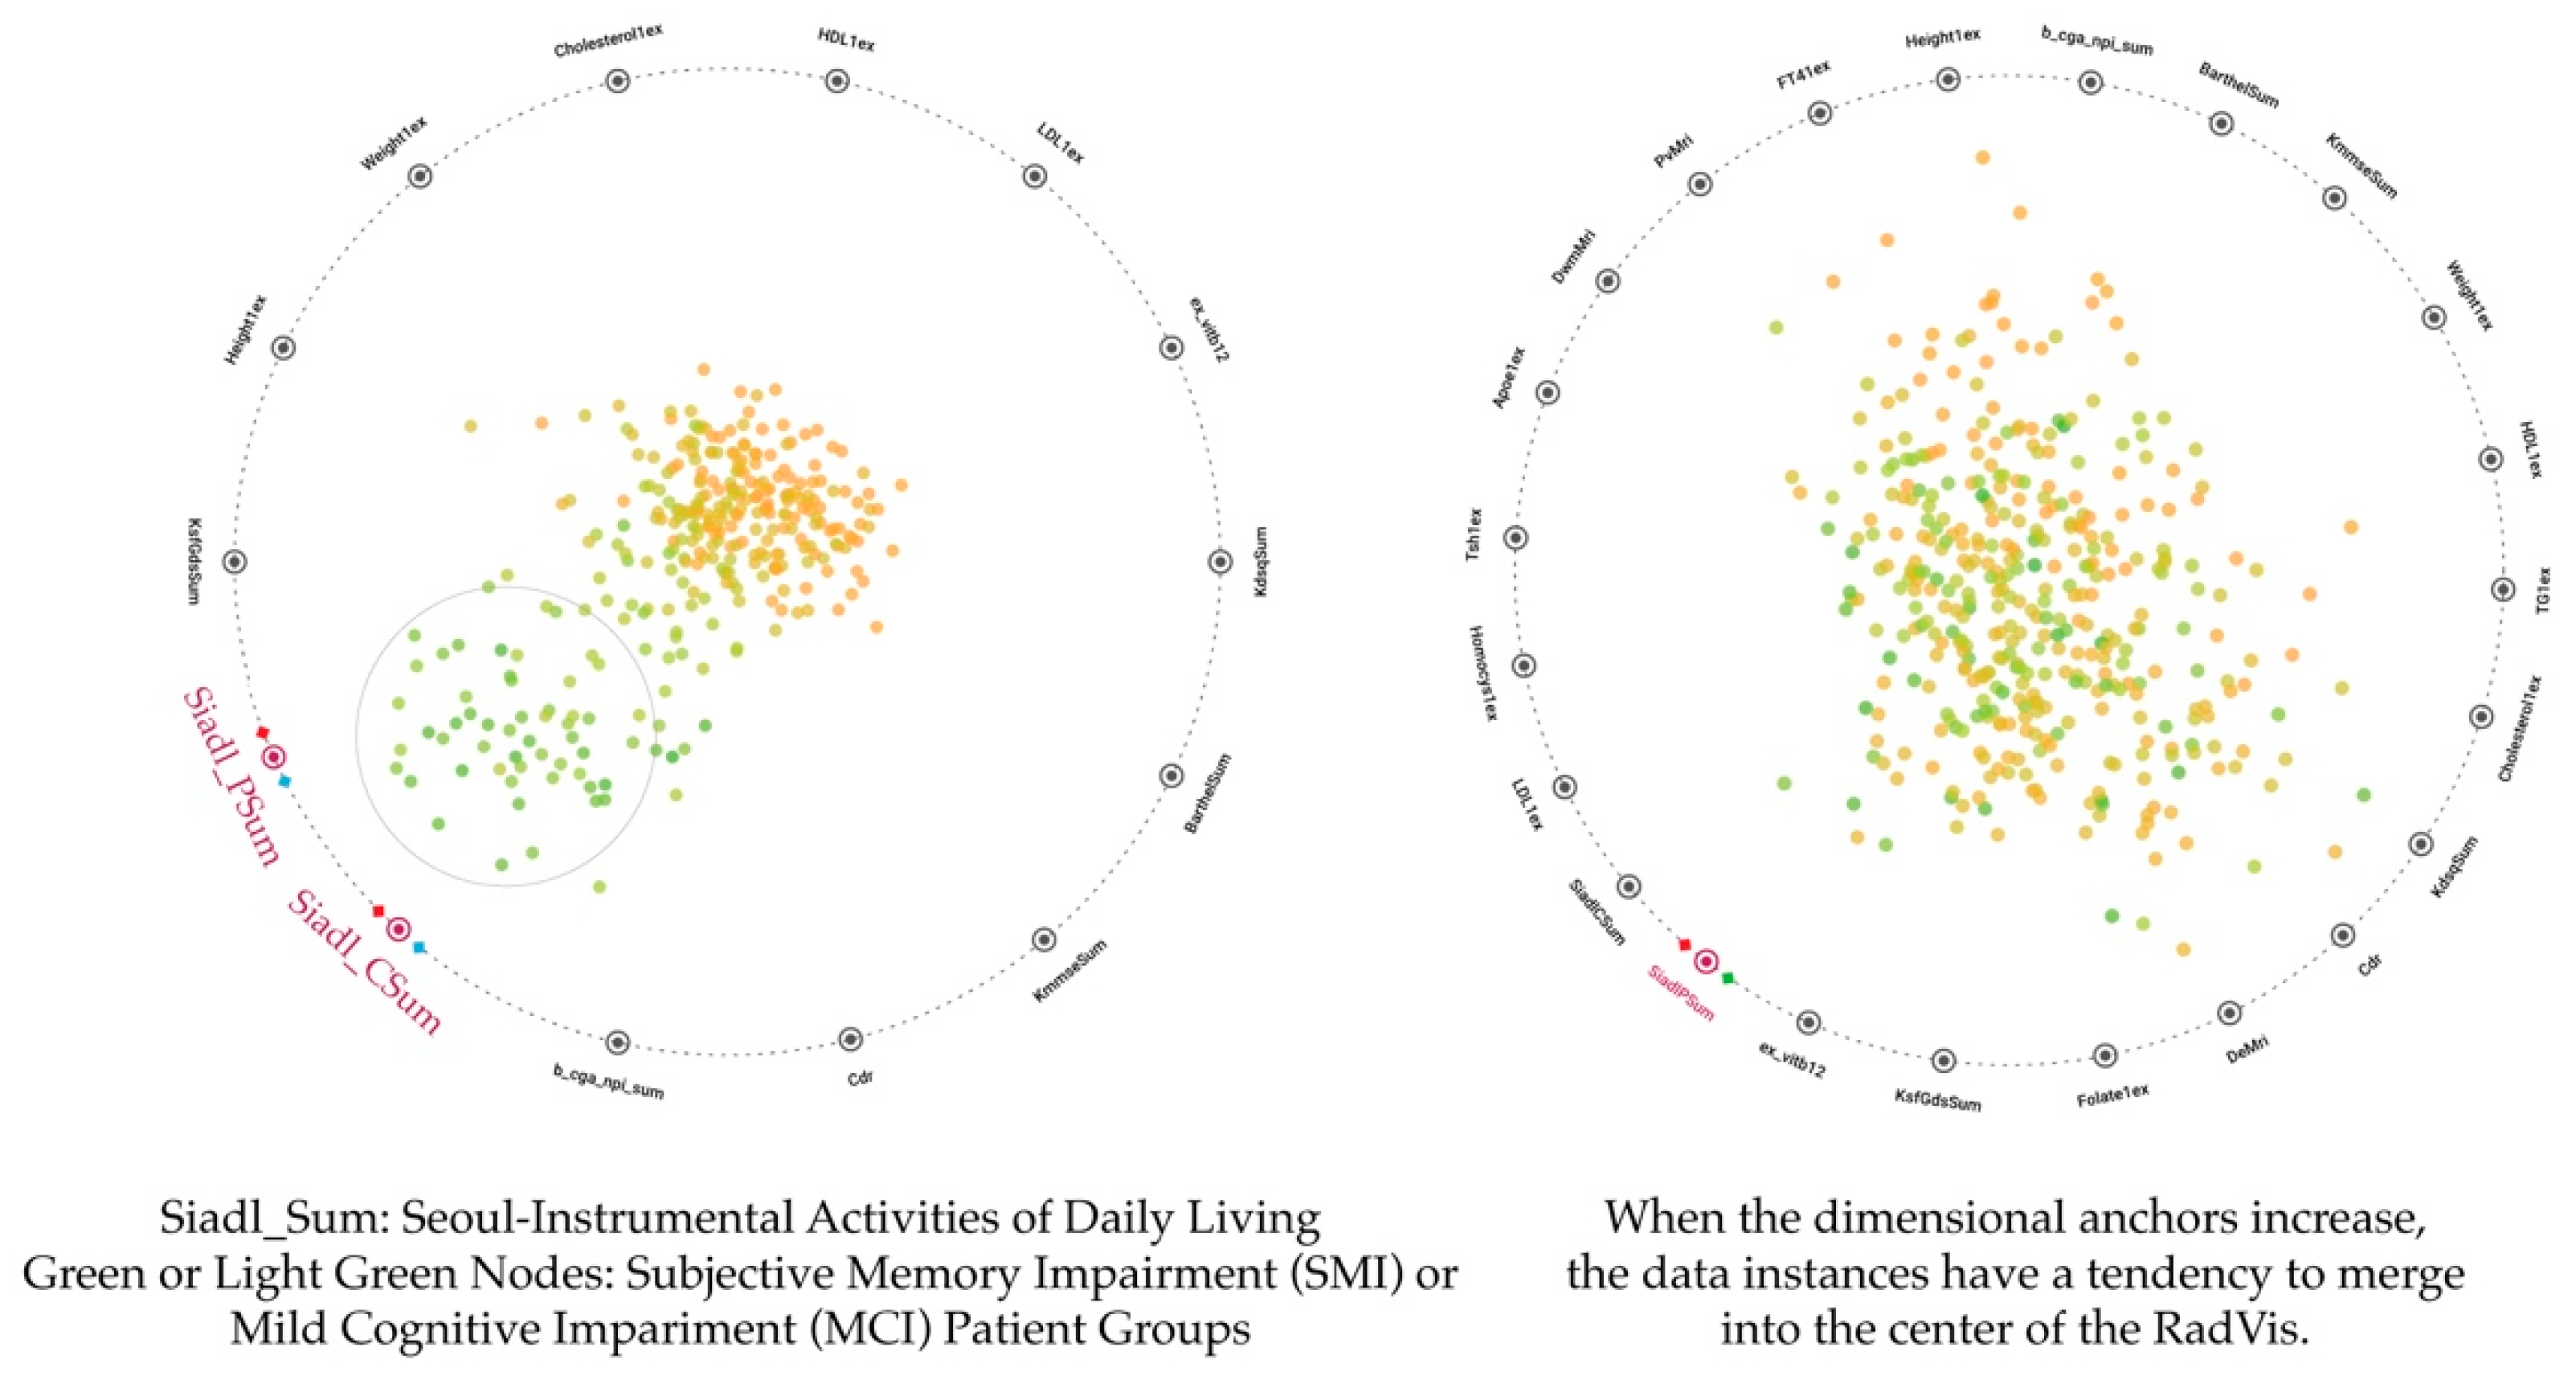
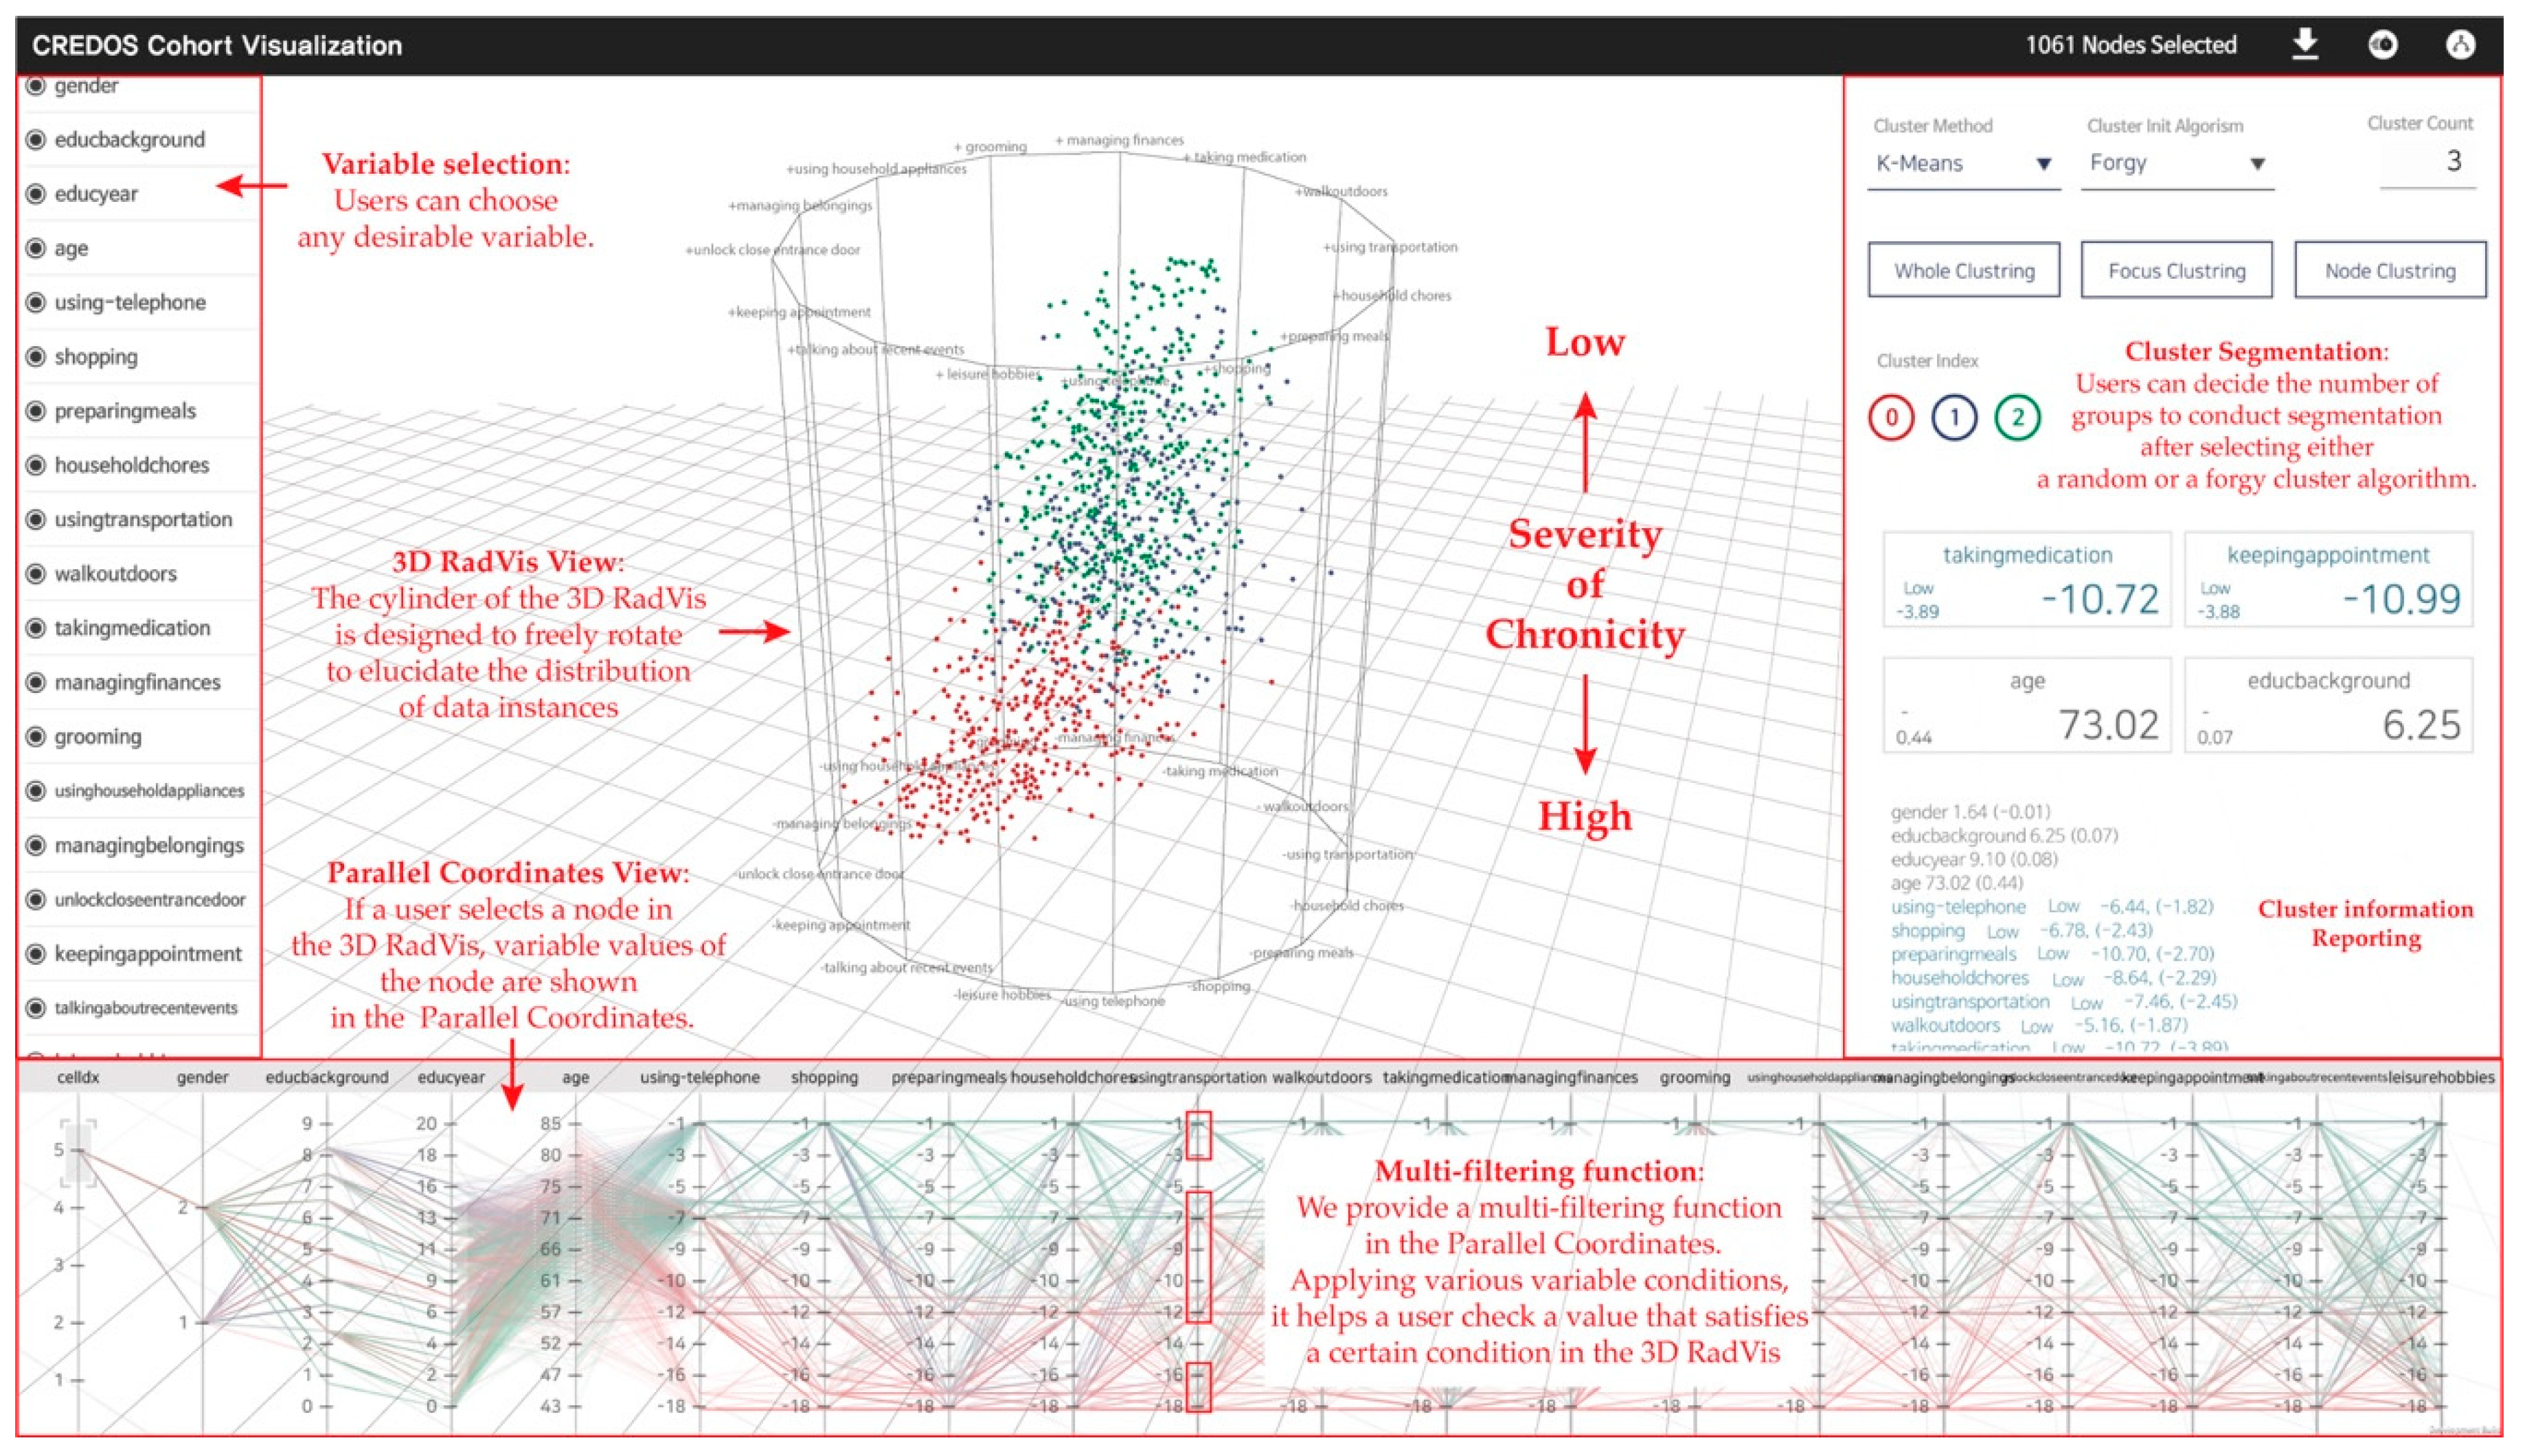
- We designed a 3D RadVis to support the analysis of multidimensional datasets and segmentation of patient clusters. We also presented Parallel Coordinates to present patients’ data.
- (b)
- We verified the 3D RadVis visualization tool via qualitative evaluation and case studies.
2. Related Work
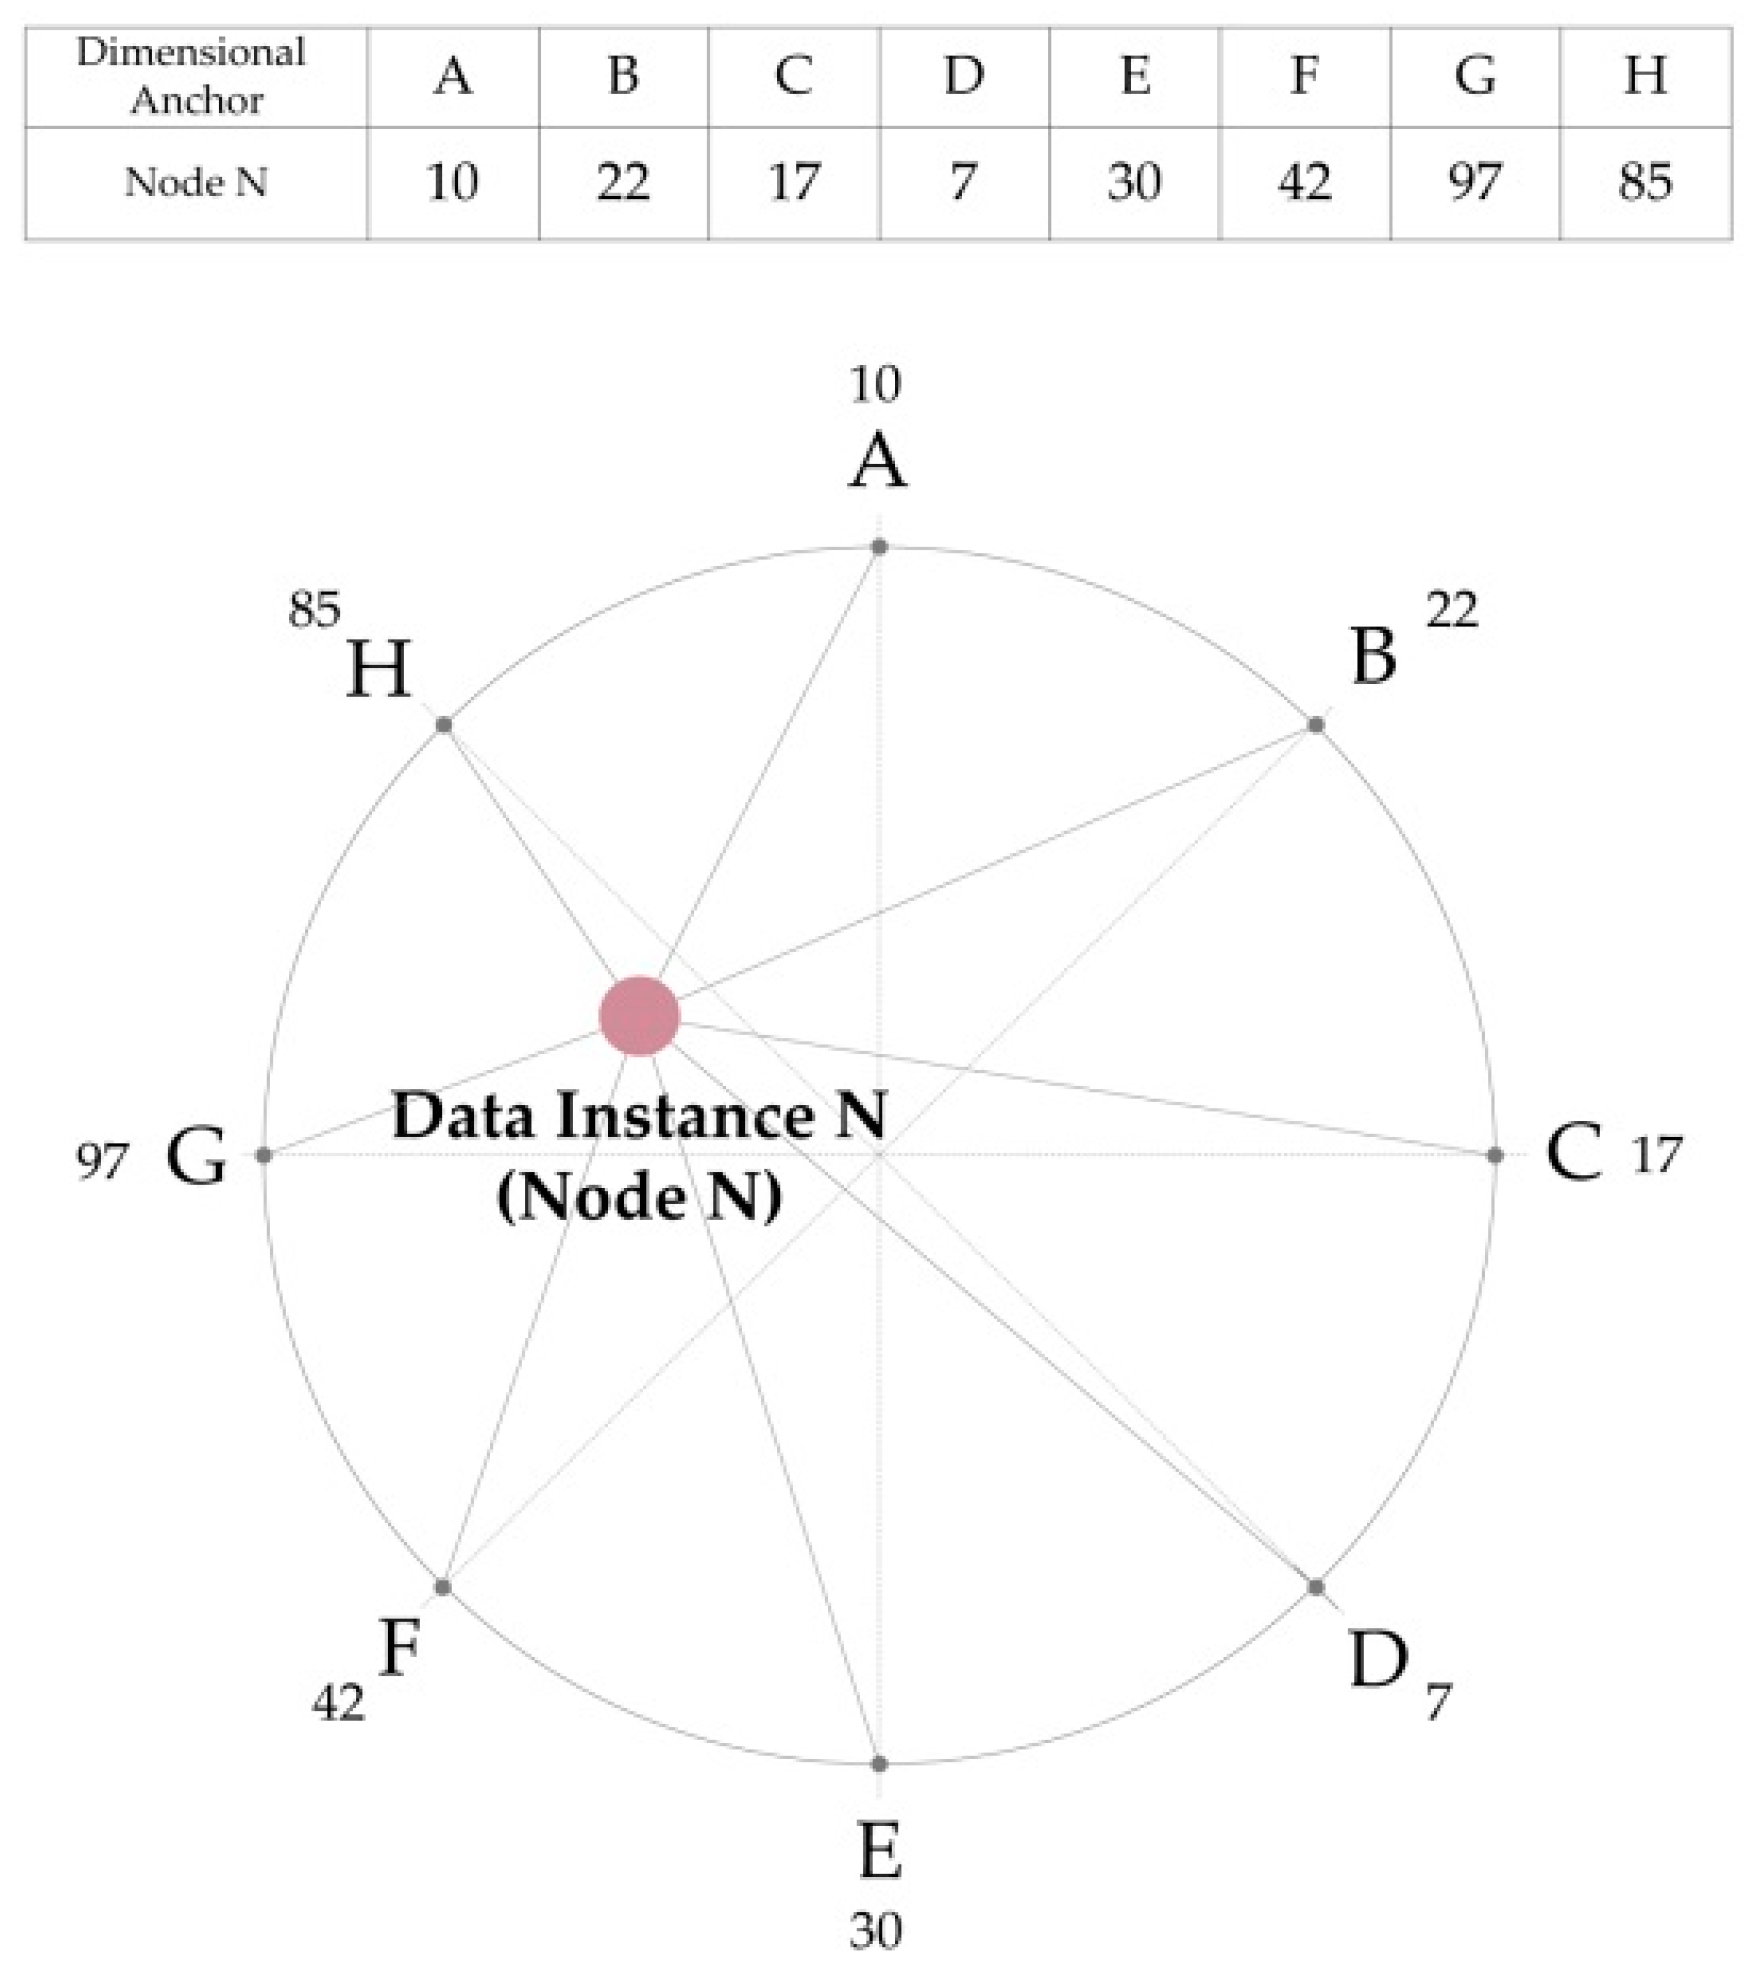
2.1. RadVis and Parallel Coordinates
2.2. Cluster Analysis
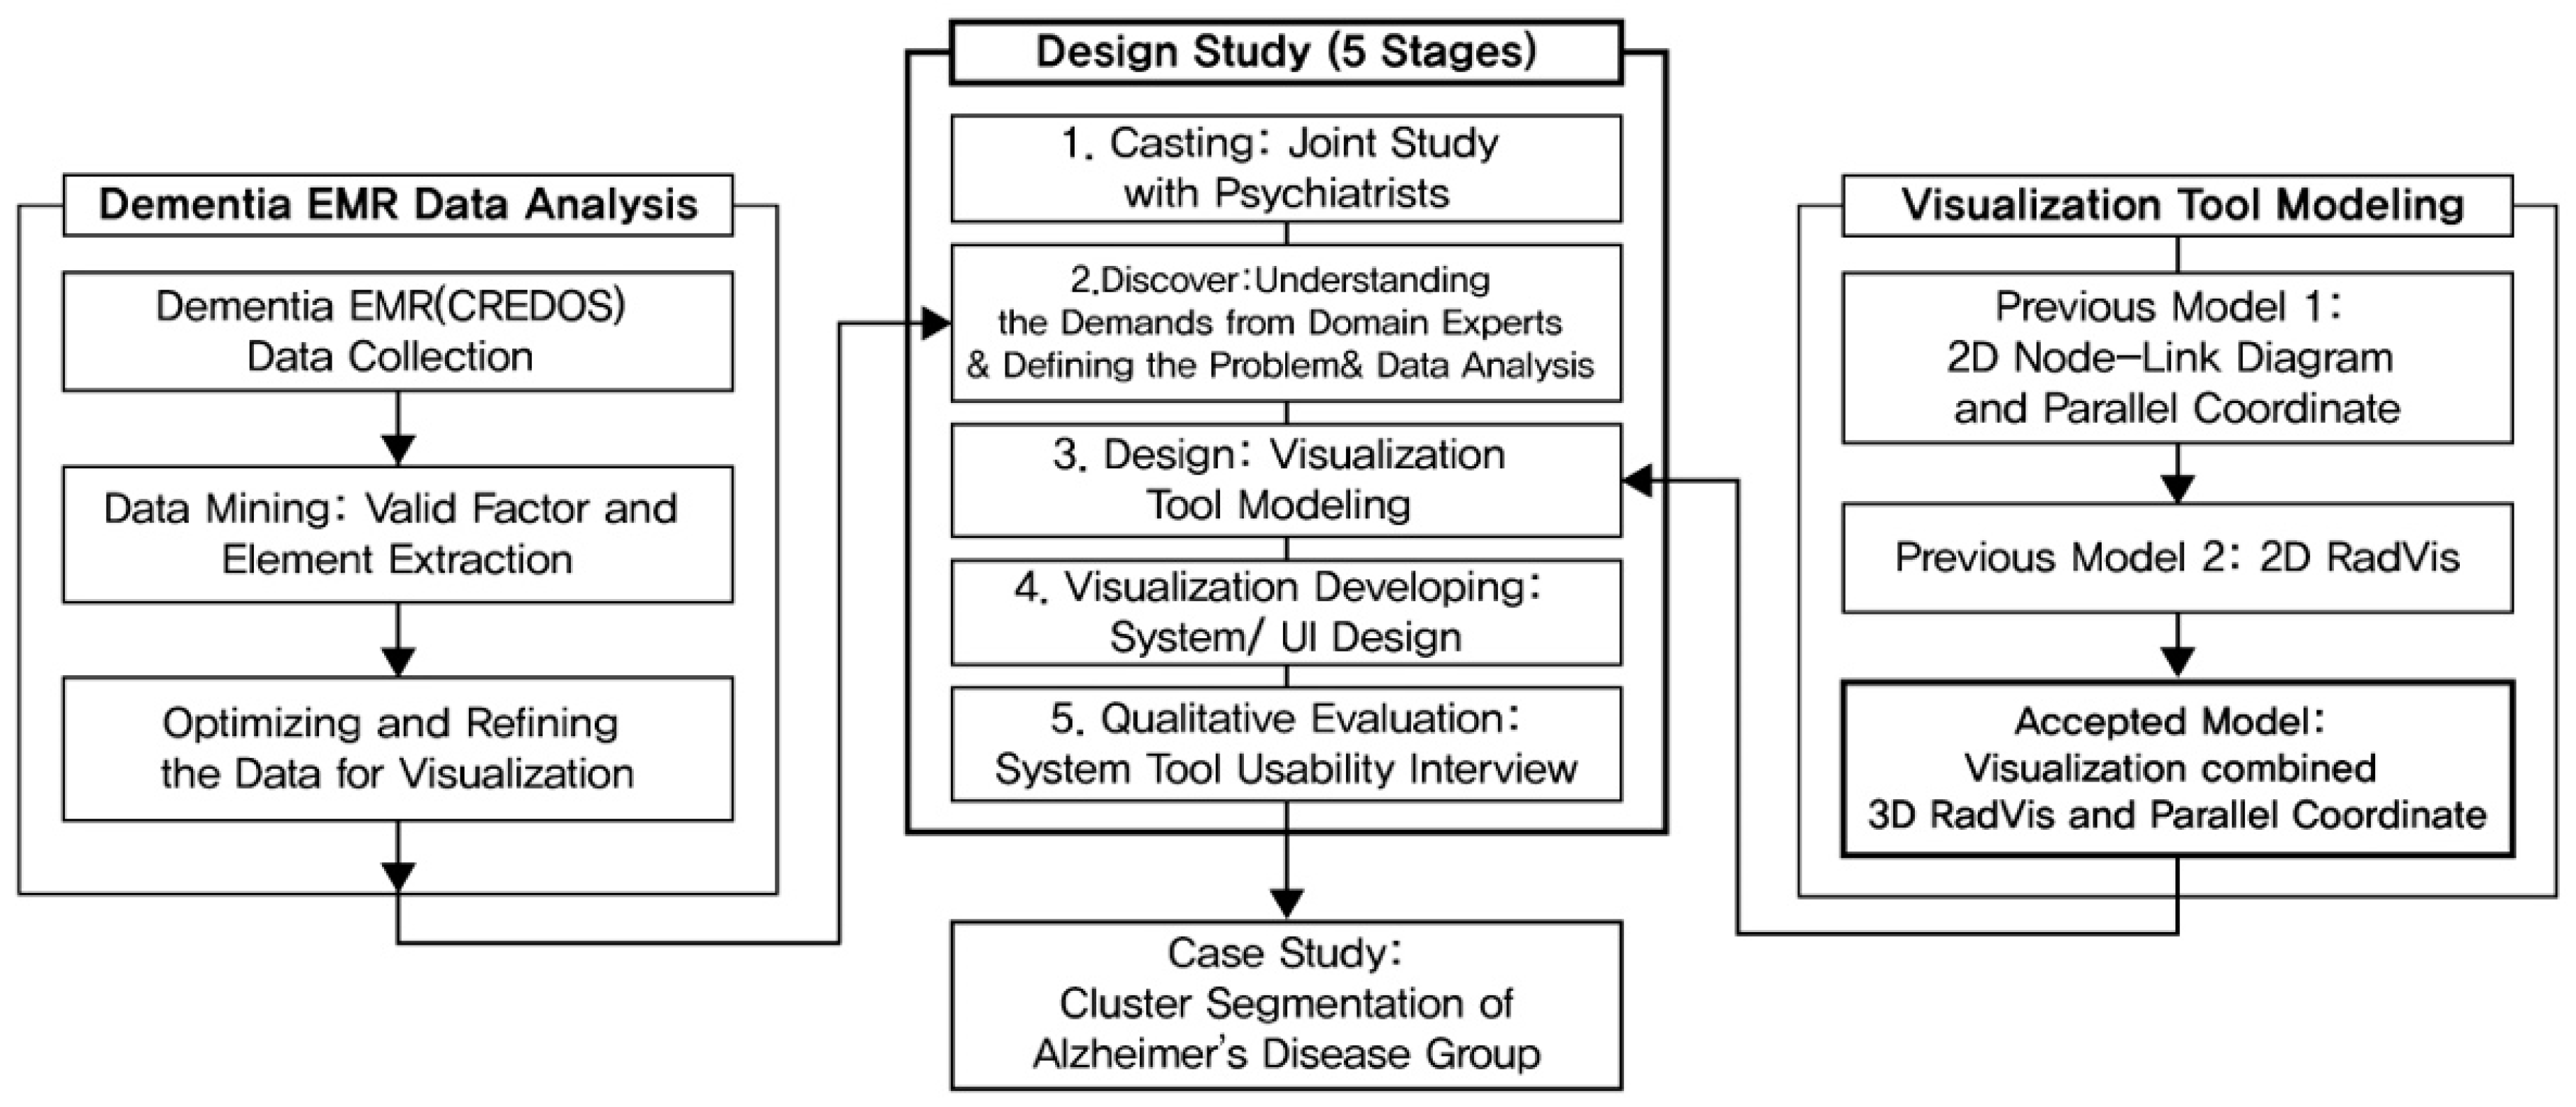
3. Research Process
3.1. Casting
3.2. Discovery
3.2.1. Understanding the Demands from Domain Experts
3.2.2. Design Guideline
3.2.3. Analysis System Subject Data: CREDOS
3.3. Design
3.3.1. Previous Model 1: 2D Node-Link Diagram and Parallel Coordinates
3.3.2. Previous Model 2: 2D RadVis
3.3.3. Accepted Model: Visualization Combined 3D RadVis and Parallel Coordinates
3.4. Visualization
3.4.1. The Developing Process of Visualization
3.4.2. Visualization Interaction
3.5. Qualitative Evaluation (Implimentation of Visualization System)
4. Case Study
5. Conclusions
Author Contributions
Funding
Conflicts of Interest
References
- Wang, C.F.; Li, J.; Ma, K.L.; Huang, C.W.; Li, Y.C. A visual analysis approach to cohort study of electronic patient records. In Proceedings of the Bioinformatics and Biomedicine, Belfast, UK, 2–5 November 2014; pp. 521–528. [Google Scholar]
- Plaisant Mushlin, R.; Snyder, A.; Li, J.; Heller, D.; Shneiderman, B. LifeLines: Using visualization to enhance navigation and analysis of patient records. In Proceedings of the AMIA Symposium, Lake Buena Vista, FL, USA, 7–11 November 1998; pp. 76–80. [Google Scholar]
- Lhuillier, A.; Hurter, C.; Jouffrais, C.; Barbeau, E.; Amieva, H. Visual analytics for the interpretation of fluency tests during Alzheimer evaluation. In Proceedings of the 2015 Workshop on Visual Analytics in Healthcare, Chicago, IL, USA, 25 October 2015; pp. 3:1–3:8. [Google Scholar]
- Loorak, M.H.; Perin, C.; Kamal, N.; Hillm, M.; Carpendale, S. TimeSpan: Using visualization to explore temporal multi-dimensional data of stroke patients. IEEE Trans. Vis. Comput. Graph. 2016, 22, 409–418. [Google Scholar] [CrossRef] [PubMed]
- Everi, B.; Landau, S.; Leese, S.; Stahl, D. Cluster Analysis, 5th ed.; Wiley Series in Probability and Statistics; Wiley: Hoboken, NJ, USA, 2011; pp. 71–110. [Google Scholar]
- Petrovic, M.; Hurt, C.; Collins, D.; Burns, A.; Camus, V.; Liperoti, R.; Marriott, A.; Nobili, F.; Robert, P.; Tsolaki, M.; et al. Clustering of behavioural and psychological symptoms in dementia (BPSD): A European Alzheimer’s disease consortium (EADC) study. Acta Clin. Belg. 2007, 62, 426–432. [Google Scholar] [CrossRef] [PubMed]
- Ha, H.; Han, H.; Bae, S.; Lee, J.H.; Son, S.; Hong, C.; Shin, H.; Lee, K. A Study on Visualization Methods of Semantic Clustering for Multidimensional data. Commun. Korean Inst. Inf. Sci. Eng. 2016, 34, 51–61. [Google Scholar]
- Ha, H.; Lee, J.H.; Han, H.; Bae, S.; Lim, S.; Son, S.; Hong, C.; Shin, H.; Lee, K. A Visualization System to subdivide Dementia Diagnosis Stages. In Proceedings of the Intelligent Systems for Molecular Biology and the 16th European Conference on Computational Biology (IEEE BIOVIS 2017), Prague, Czech Republic, 21–25 July 2017; p. 227. [Google Scholar]
- Lee, J.H.; Ha, H.; Han, H.; Bae, S.; Son, S.; Hong, C.; Shin, H.; Lee, K. Visual analytics for biomedical cluster subdivision: A design study with psychiatrists. In Proceedings of the Computer Graphics International Conference, Yokohama, Japan, 27–30 June 2017; p. 17. [Google Scholar]
- Lee, J.H. Development of Visual Analysis Tool for Cluster Analysis of Multi-Dimensional Dementia Data: A Design Study with Psychiatrists. Master’s Thesis, Ajou University, Suwon, Korea, August 2017. [Google Scholar]
- Hoffman, P.; Grinstein, G.; Marx, K.; Grosse, I.; Stanley, E. DNA visual and analytic data mining. In Proceedings of the Visualization’97, Phoenix, AZ, USA, 19–24 October 1997; pp. 437–441. [Google Scholar]
- Bertini, E.; Dell’Aquila, L.; Santucci, G. SpringView: Cooperation of radviz and parallel coordinates for view optimization and clutter reduction. In Proceedings of the Coordinated and Multiple Views in Exploratory Visualization, London, UK, 5 July 2005; pp. 22–29. [Google Scholar]
- de Carvalho Pagliosa, L.; Telea, A.C. RadViz: Improvements on Radial-Based Visualizations++. Informatics 2019, 6, 16. [Google Scholar] [CrossRef]
- Inselberg, A. The plane with parallel coordinates. Vis. Comput. 1985, 1, 69–91. [Google Scholar] [CrossRef]
- Inselberg, A. Parallel Coordinates: Visual Multidimensional Geometry and Its Applications; Springer: Berlin/Heidelberg, Germany, 2009. [Google Scholar]
- Fua, Y.H.; Ward, M.O.; Rundensteiner, E.A. Hierarchical parallel coordinates for exploration of large datasets. In Proceedings of the Visualization’99, San Francisco, CA, USA, 24–29 October 1999; pp. 43–50. [Google Scholar]
- Zhou, H.; Yuan, X.; Qu, H.; Cui, W.; Chen, B. Visual clustering in Parallel Coordinates. Comput. Graph. Forum. 2008, 27, 1047–1054. [Google Scholar] [CrossRef]
- Tong, C.; Zhang, J.; Chowdhury, A.; Trost, S.G. An Interactive Visualization Tool for Sensor-based Physical Activity Data Analysis. In Proceedings of the Australasian Computer Science Week Multiconference, Sydney, Australia, 29–31 January 2019; p. 30. [Google Scholar]
- Sohail, M.N.; Ren, J.; Uba Muhammad, M. A Euclidean Group Assessment on Semi-Supervised Clustering for Healthcare Clinical Implications Based on Real-Life Data. Int. J. Environ. Res. Public Health 2019, 16, 1581. [Google Scholar] [CrossRef] [PubMed]
- Ankerst, M.; Berchtold, S.; Keim, D. Similarity clustering of dimensions for an enhanced visualization of multidimensional data. In Proceedings of the IEEE Symposium on Information Visualization, Research Triangle, CA, USA, 19–20 October 1998; pp. 52–60. [Google Scholar]
- Ismail, A.; Shehab, A.; El-Henawy, I.M. Healthcare Analysis in Smart Big Data Analytics: Reviews, Challenges and Recommendations, 1st ed.; Springer Nature Switzerland AG: Basel, Switzerland, 2019; pp. 27–45. [Google Scholar]
- Bisson, G.; Blanch, R. Improving visualization of large hierarchical clustering. In Proceedings of the 2012 16th International Conference on Information Visualisation, Montpellier, France, 10–13 July 2012; pp. 220–228. [Google Scholar]
- Martínez-Martínez, J.M.; Escandell-Montero, P.; Soria-Olivas, E.; Martín-Guerrero, J.D.; Martínez-Sober, M.; Gómez-Sanchis, J. Sectors on sectors (sons): A new hierarchical clustering visualization tool. In Proceedings of the IEEE Symposium on Computational Intelligence and Data Mining (CIDM), Paris, France, 11–15 April 2011; pp. 304–309. [Google Scholar]
- Sedlmair, M.; Meyer, M.; Munzner, T. Design study methodology: Reflections from the trenches and the stacks. IEEE Trans. Vis. Comput. Graph. 2012, 18, 2431–2440. [Google Scholar] [CrossRef] [PubMed]
- Ghani, S.; Kwon, B.C.; Lee, S.; Yi, J.S.; Elmqvist, N. Visual analytics for multimodal social network analysis: A design study with social scientists. IEEE Trans. Vis. Comput. Graph. 2013, 19, 2032–2041. [Google Scholar] [CrossRef] [PubMed]
- Choi, S.H.; Lee, J.; Kin, S.J.; Choi, J.Y.; Kwon, J.W.; Yoon, B.N.; Yang, Y.S.; Kim, S.Y.; Jeong, J.H. Driving in Patients with Dementia: A CREDOS (Clinical Research Center for Dementia of South Korea) Study. Dement. Neurocognitive Disord. 2014, 13, 83–88. [Google Scholar]
- Tan, P.N.; Steinbach, M.; Kumar, V. Introduction to Data Mining, 1st ed.; Addison-Wesley Longman Publishing Co.: Boston, MA, USA, 2006; pp. 487–568. [Google Scholar]
- Bang, S.; Son, S.; Roh, H.; Lee, J.H.; Bae, S.; Lee, K.; Hong, C.; Shin, H. Quad-phased data mining modeling for dementia diagnosis. BMC Med. Inform. Decis. Mak. 2017, 17, 60. [Google Scholar] [CrossRef] [PubMed]
- Beham, M.; Herzner, W.; Gröller, M.E.; Kehrer, J. Cupid: Cluster-based exploration of geometry generators with parallel coordinates and radial trees. IEEE Trans. Vis. Comput. Graph. 2014, 20, 1693–1702. [Google Scholar] [CrossRef] [PubMed]
- Ha, H.; Han, H.; Bae, S.; Lee, J.H.; Son, S.; Hong, C.; Shin, H.; Lee, K. A Visualization System for Clustering Dementia Patients based on Automated Similarity Analysis. In Proceedings of the IEEE VIS 2016, Baltimore, MD, USA, 23–28 October 2016; pp. 57–58. [Google Scholar]
- Ono, J.H.P.; Sikansi, F.; Corrêa, D.C.; Paulovich, F.V.; Paiva, A.; Nonato, L.G. Concentric radviz: Visual exploration of multi-task classification. In Proceedings of the 2015 28th SIBGRAPI Conference on Graphics, Patterns and Images, Salvador, Brazil, 26–29 August 2015; pp. 165–172. [Google Scholar]
- Zhou, F.; Huang, W.; Li, J.; Huang, Y.; Shi, Y.; Zhao, Y. Extending Dimensions in Radviz based on mean shift. In Proceedings of the 2015 IEEE Pacific Visualization Symposium, Hangzhou, China, 14–17 April 2015; pp. 111–115. [Google Scholar]
- Ibrahim, A.; Rahnamayan, S.; Martin, M.V.; Deb, K. 3D-RadVis: Visualization of Pareto front in many-objective optimization. In Proceedings of the Evolutionary Computation, Vancouver, BC, Canada, 24–29 July 2016; pp. 736–745. [Google Scholar]
- Ibrahim, A.; Rahnamayan, S.; Martin, M.V.; Deb, K. 3D-RadVis Antenna: Visualization and performance measure for many-objective optimization. Swarm Evol. Comput. 2018, 39, 157–176. [Google Scholar] [CrossRef]
- Sung, J.; Lee, D.; Kim, H. Difference of GUI Efficiency based on 3D and 2D Graphic -Imaginary 3D IPTV Interface Development Using Virtual Reality Theory-. J. Korea Contents Assoc. 2007, 7, 87–95. [Google Scholar] [CrossRef]


| Design Task | Explanation |
|---|---|
| Understanding the representitivness of clusters | 1. Can psychological test values of patients with general symptoms of MCI a represent the whole MCI groups? 2. What are the differences in daily living between MCI and AD b groups? |
| Efficiently exploring the closest nodes | 1. How can we find the patients with a daily living test score above N among SMI c patients? |
| Segmenting and parting dementia patient groups | 1. Is there a score difference between psychologic tests among the segmented groups? If so, which symptoms show the largest difference? |
| Variables | Explanation |
|---|---|
| Patient information | Cohort ID, personal information (gender, age, educational background), physical examination |
| Caregiver information | Caregiver’s information (gender, age, educational background, relationship between patient and caregiver) |
| Cognitive assessments | Caregiver-Administered Neuropsychiatric Inventory |
| (CGA-NPI), Seoul-Instrumental Activities of Daily Living (S-IADL), diagnosed disease (SMI a, MCI b, VCI c, SVD d, AD e) |
| Topic (Based on Design Task) | Questionnaire List |
|---|---|
| Understanding the representitivness of clusters | 1. (Based on k-means cluster (forgy) analysis, who is a typical patient carrying the most general test results in the MCI a cluster? 2. Assume that you have selected one of the clusters analyzed via k-means (forgy). Based on your empirical experiences, can the selected group represent the traits of MCI patients? |
| Efficiently exploring the closest nodes | 1. Based on the selection of a certain cluster, what can you tell about the nodal traitsdistributed on each pole of a cluster? |
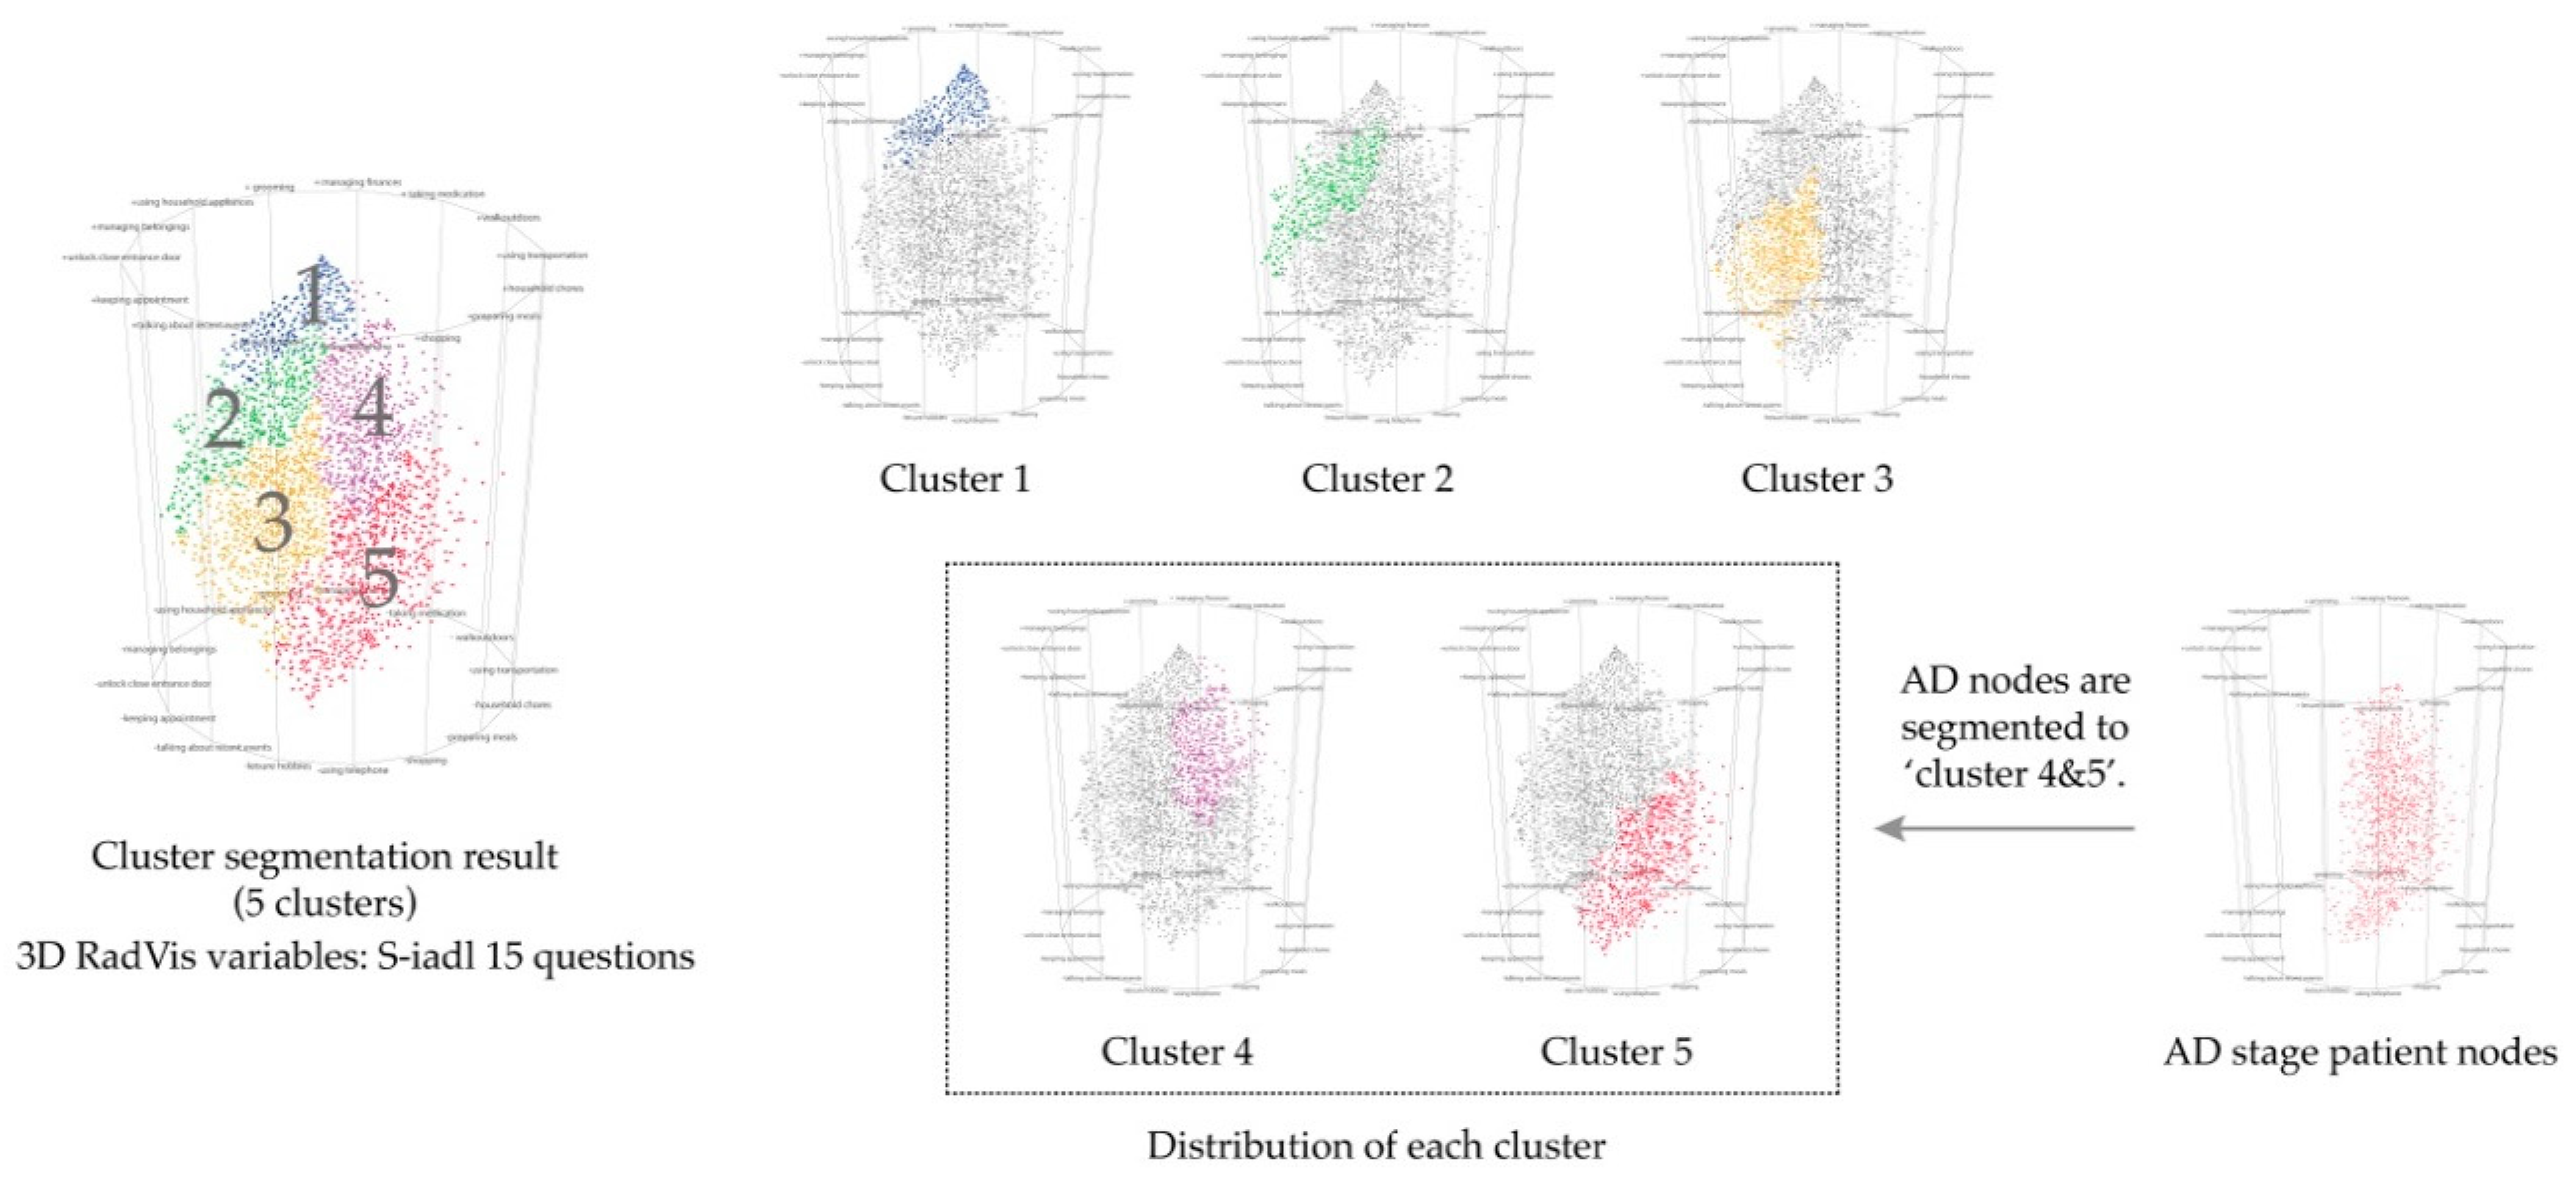
| Segmenting and parting dementia patient groups | 1. Based on your empirical experiences, what do you think of the clusters of dementia patients derived from k-means? 2. Do you think the number of segmented clusters (5) are adequate for the data type? |
© 2019 by the authors. Licensee MDPI, Basel, Switzerland. This article is an open access article distributed under the terms and conditions of the Creative Commons Attribution (CC BY) license (http://creativecommons.org/licenses/by/4.0/).
Share and Cite
Ha, H.; Lee, J.; Han, H.; Bae, S.; Son, S.; Hong, C.; Shin, H.; Lee, K. Dementia Patient Segmentation Using EMR Data Visualization: A Design Study. Int. J. Environ. Res. Public Health 2019, 16, 3438. https://doi.org/10.3390/ijerph16183438
Ha H, Lee J, Han H, Bae S, Son S, Hong C, Shin H, Lee K. Dementia Patient Segmentation Using EMR Data Visualization: A Design Study. International Journal of Environmental Research and Public Health. 2019; 16(18):3438. https://doi.org/10.3390/ijerph16183438
Chicago/Turabian StyleHa, Hyoji, Jihye Lee, Hyunwoo Han, Sungyun Bae, Sangjoon Son, Changhyung Hong, Hyunjung Shin, and Kyungwon Lee. 2019. "Dementia Patient Segmentation Using EMR Data Visualization: A Design Study" International Journal of Environmental Research and Public Health 16, no. 18: 3438. https://doi.org/10.3390/ijerph16183438