Effects of Microbial Activity and Environmental Parameters on the Degradation of Extracellular Environmental DNA from a Eutrophic Lake


Abstract
:1. Introduction
2. Materials and Methods
2.1. Preparation of Extracellular eDNA Source
2.2. Preparation of Microbial Solution
2.3. Experimental Setup
2.3.1. Temperature Effect
2.3.2. pH Effect
2.3.3. Light Effect
2.3.4. Microbial Effect
2.4. Quantification of exDNA
2.5. Statistical Analyses
3. Results
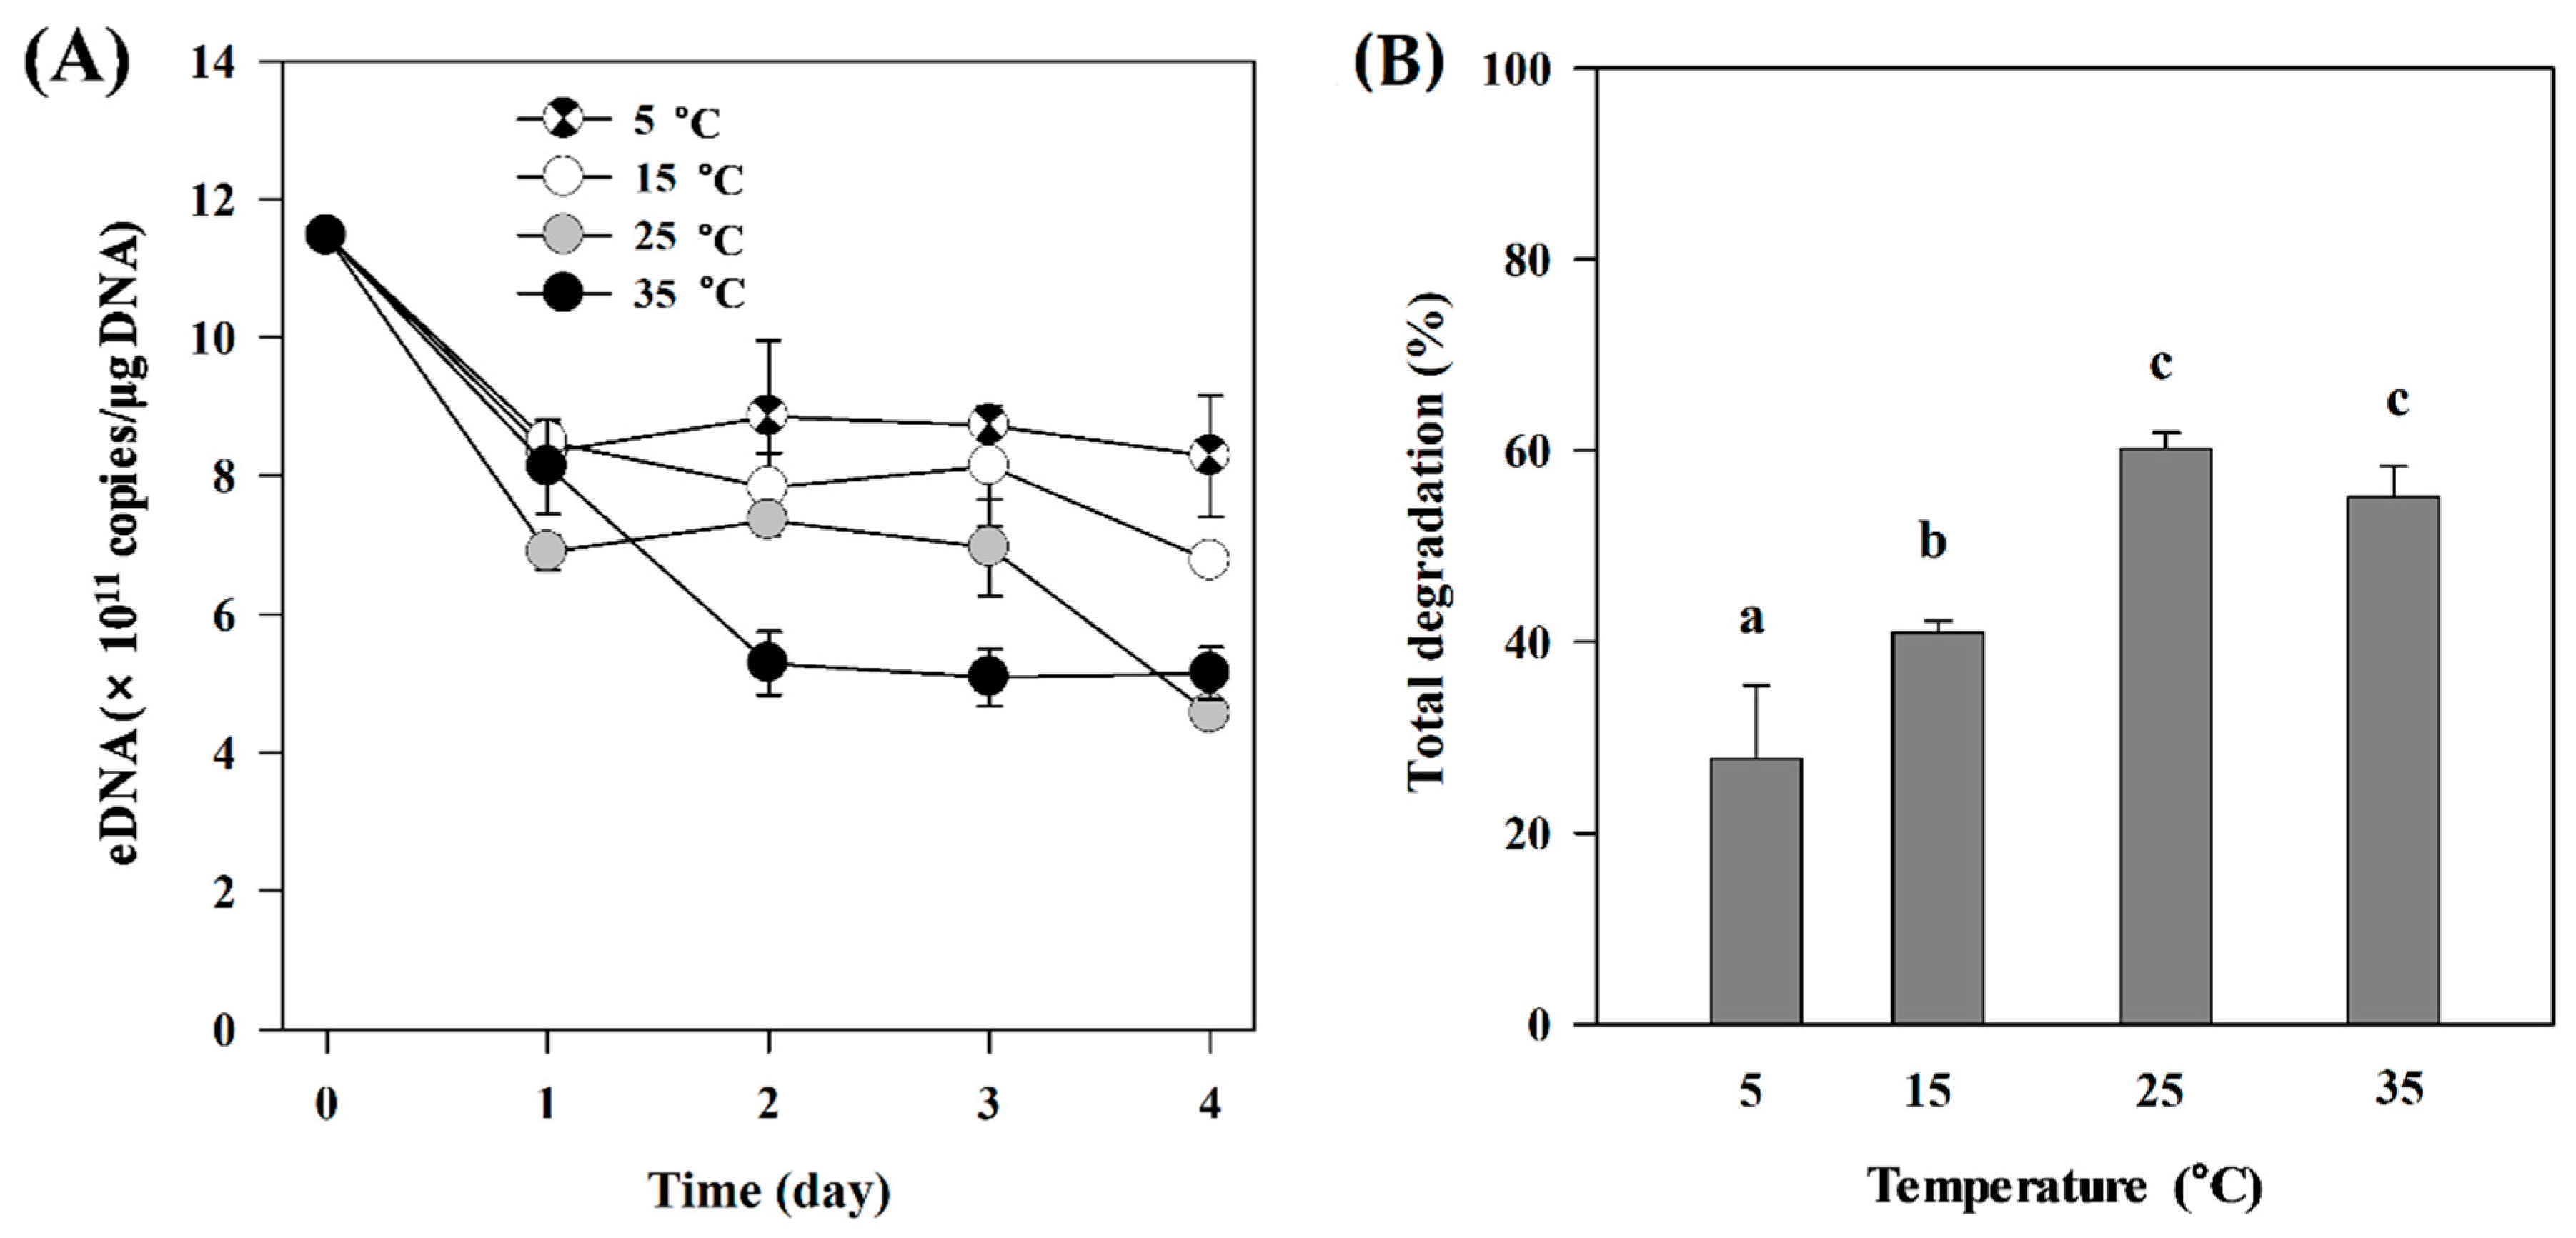
3.1. Temperature Effect
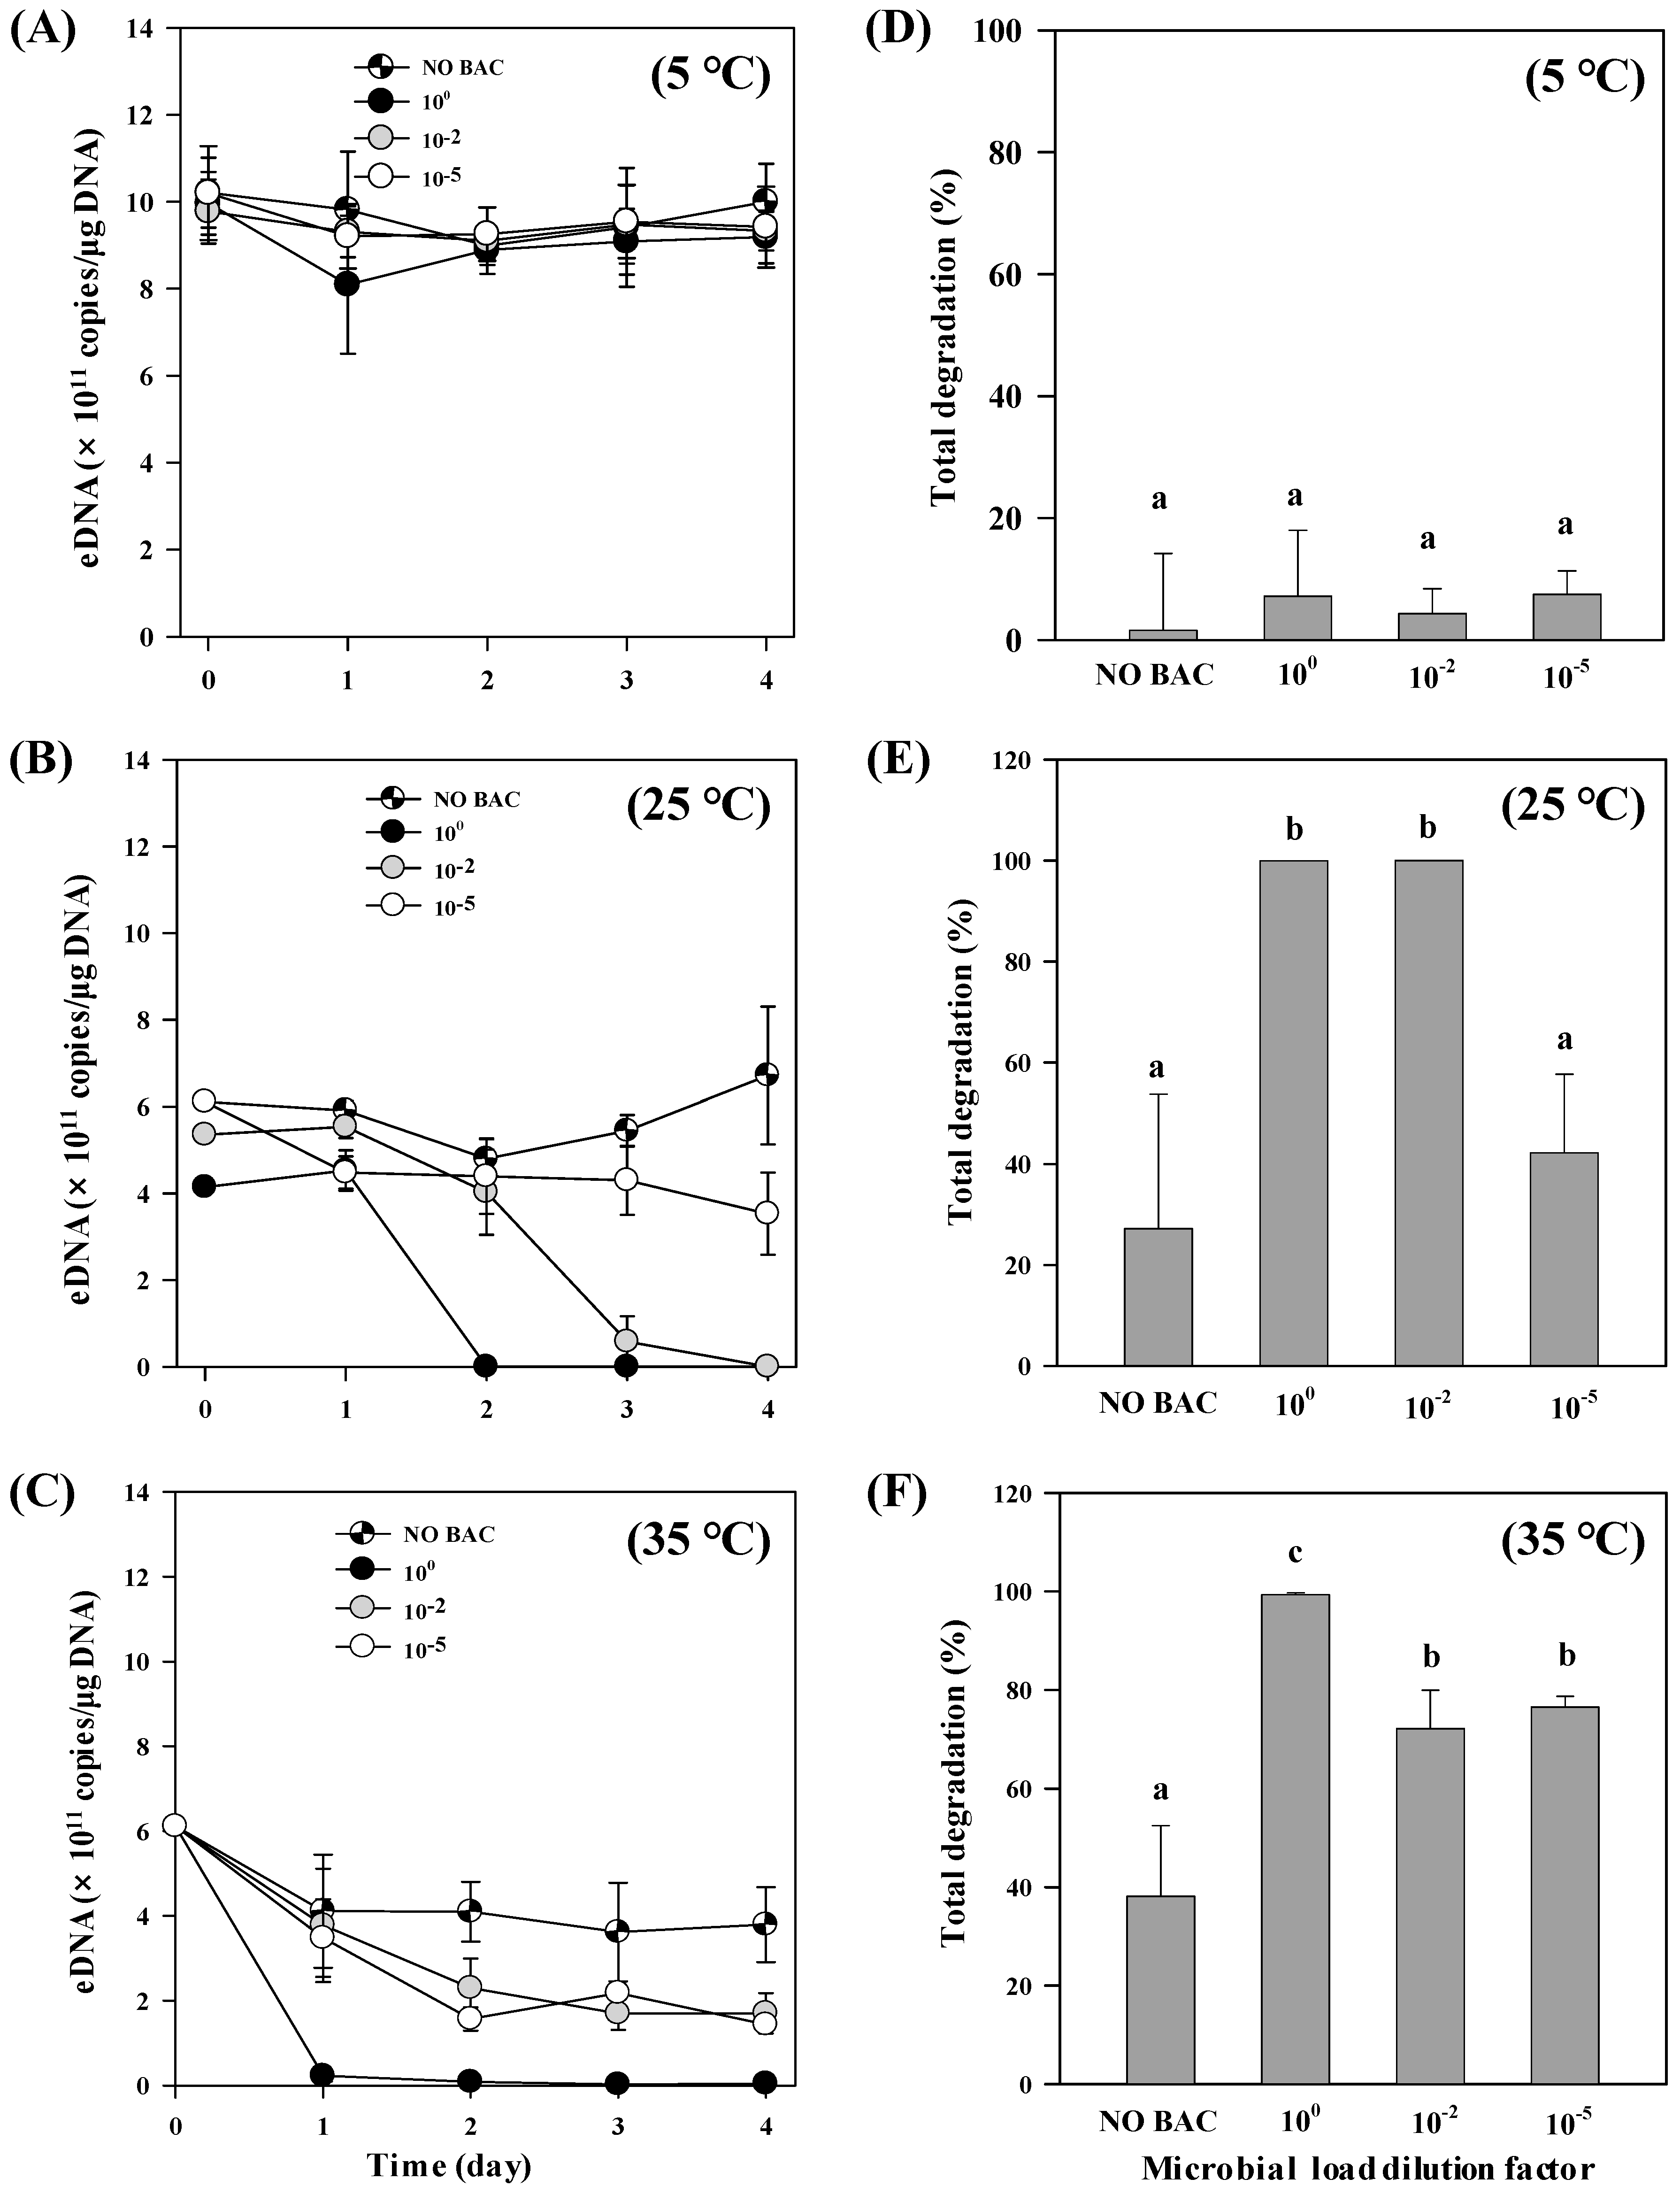
3.2. Microbial Effect
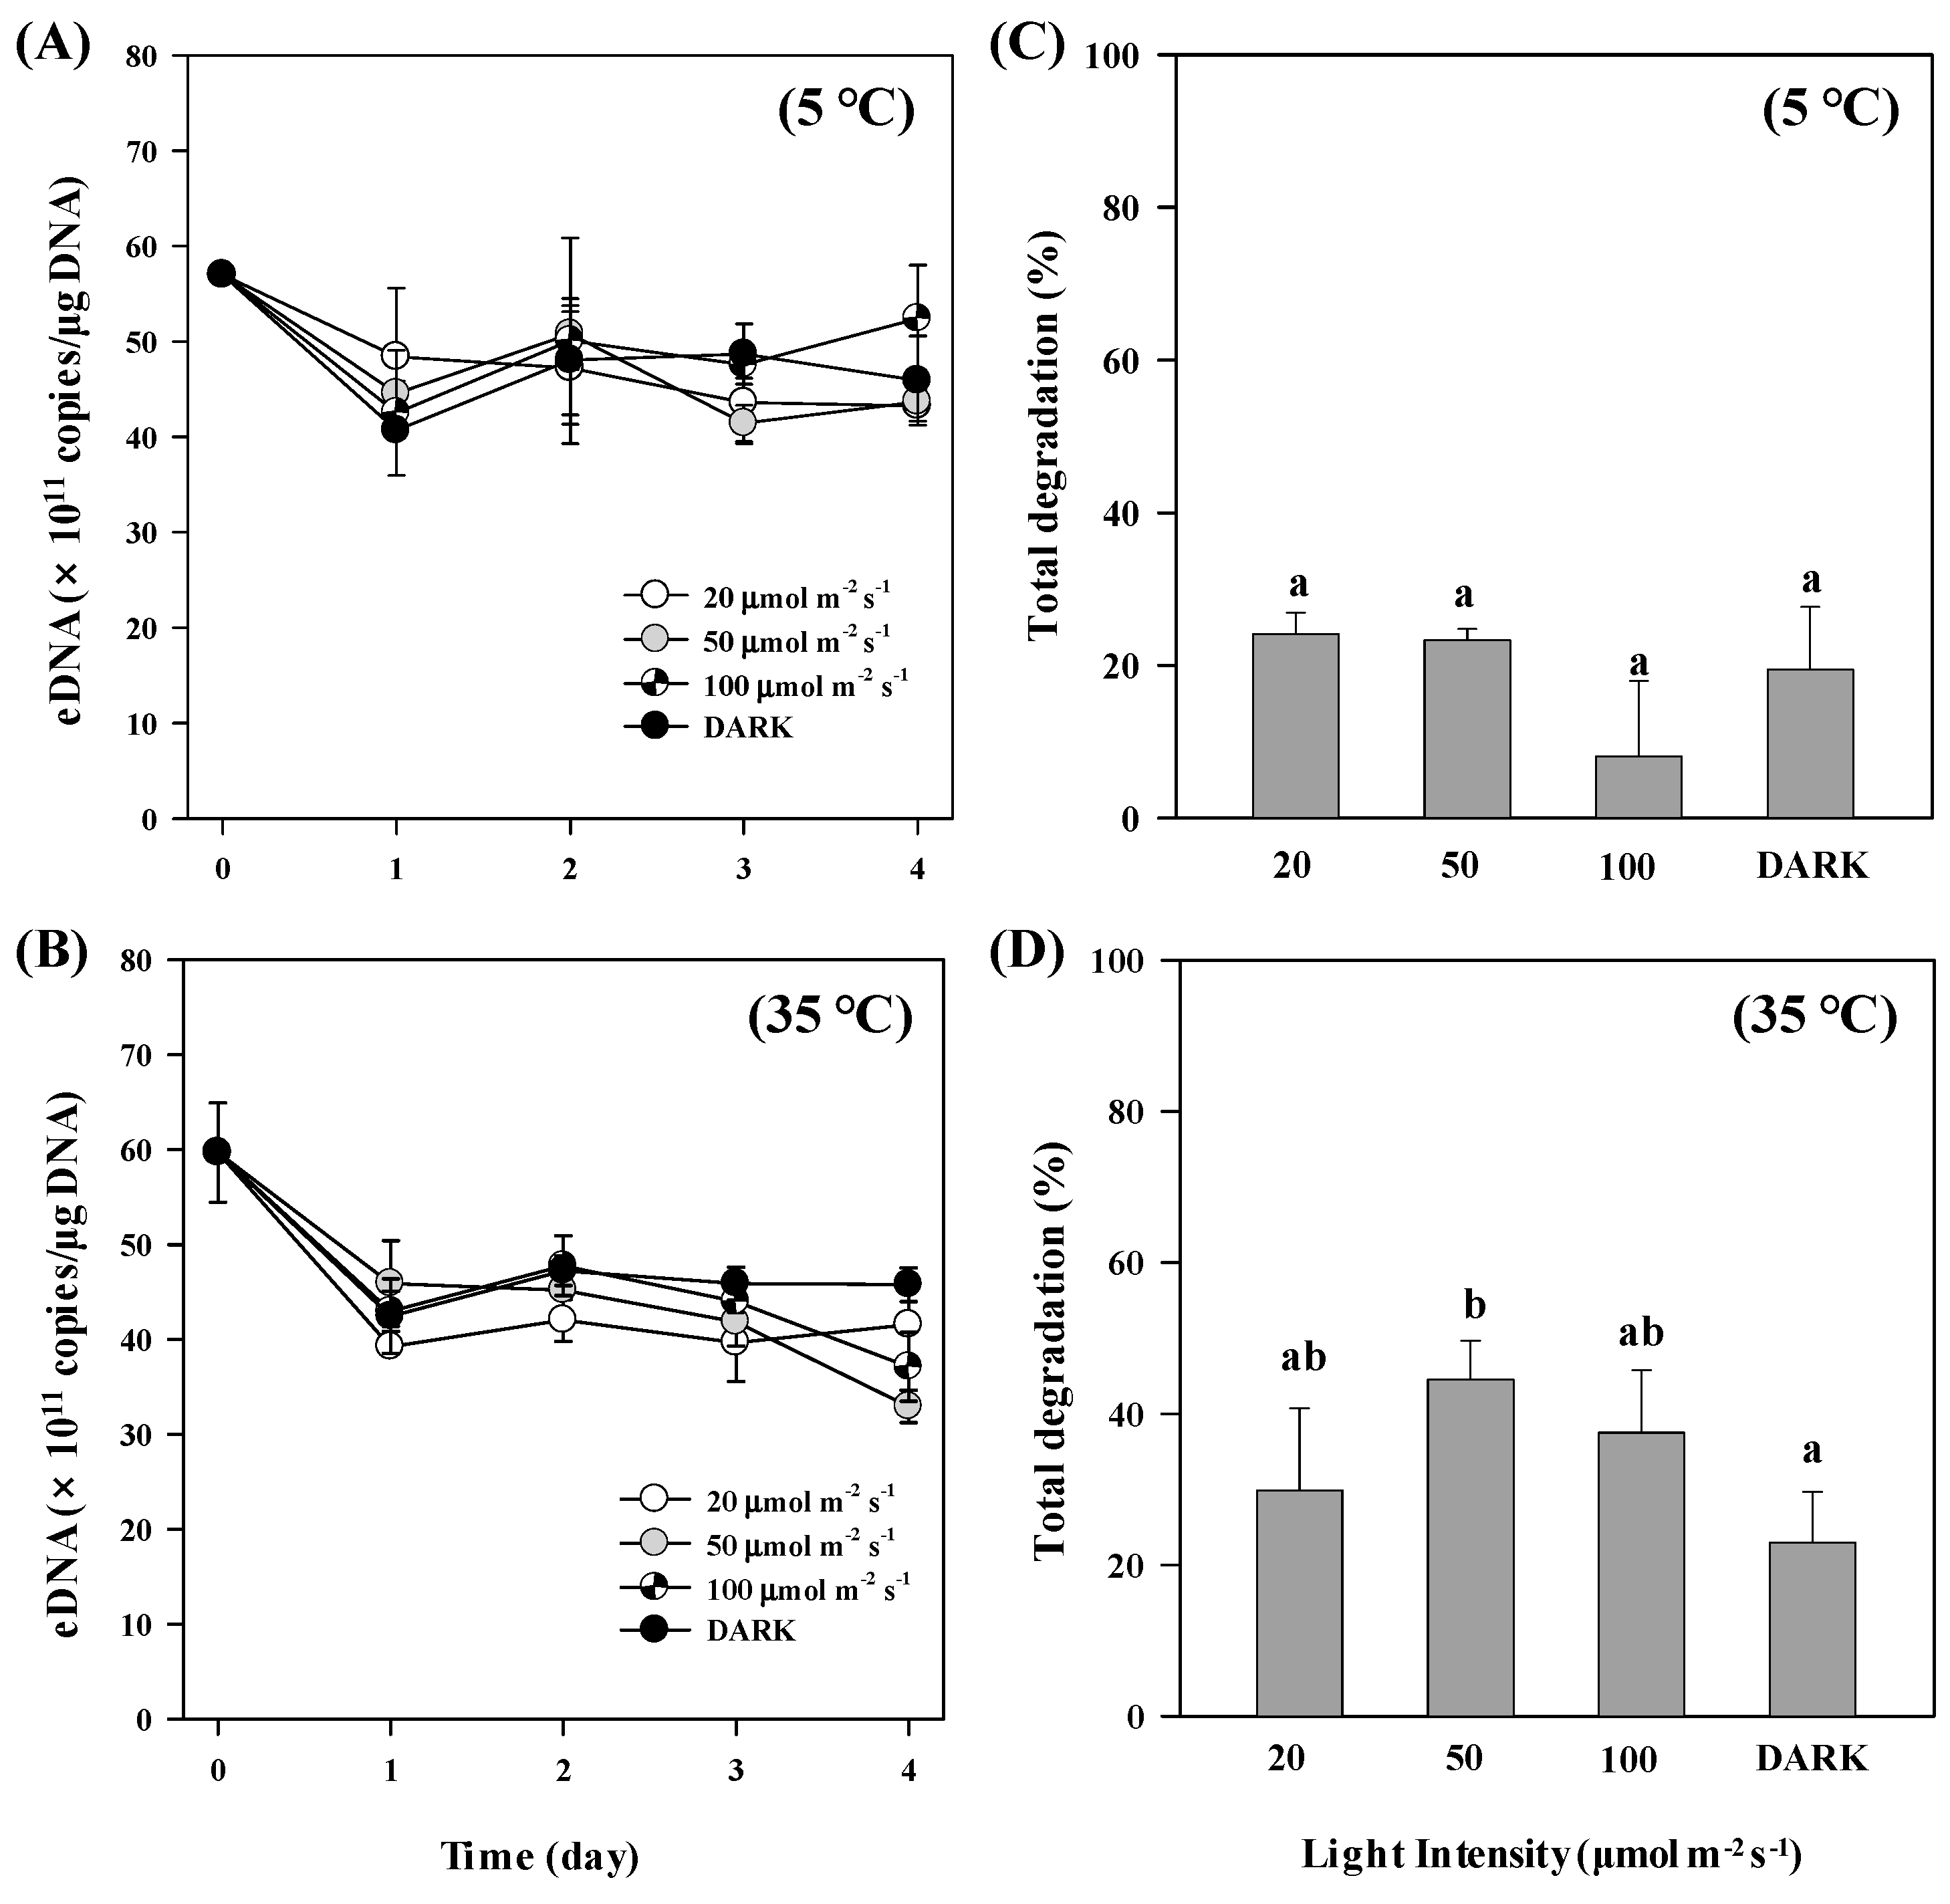
3.3. Light Effect
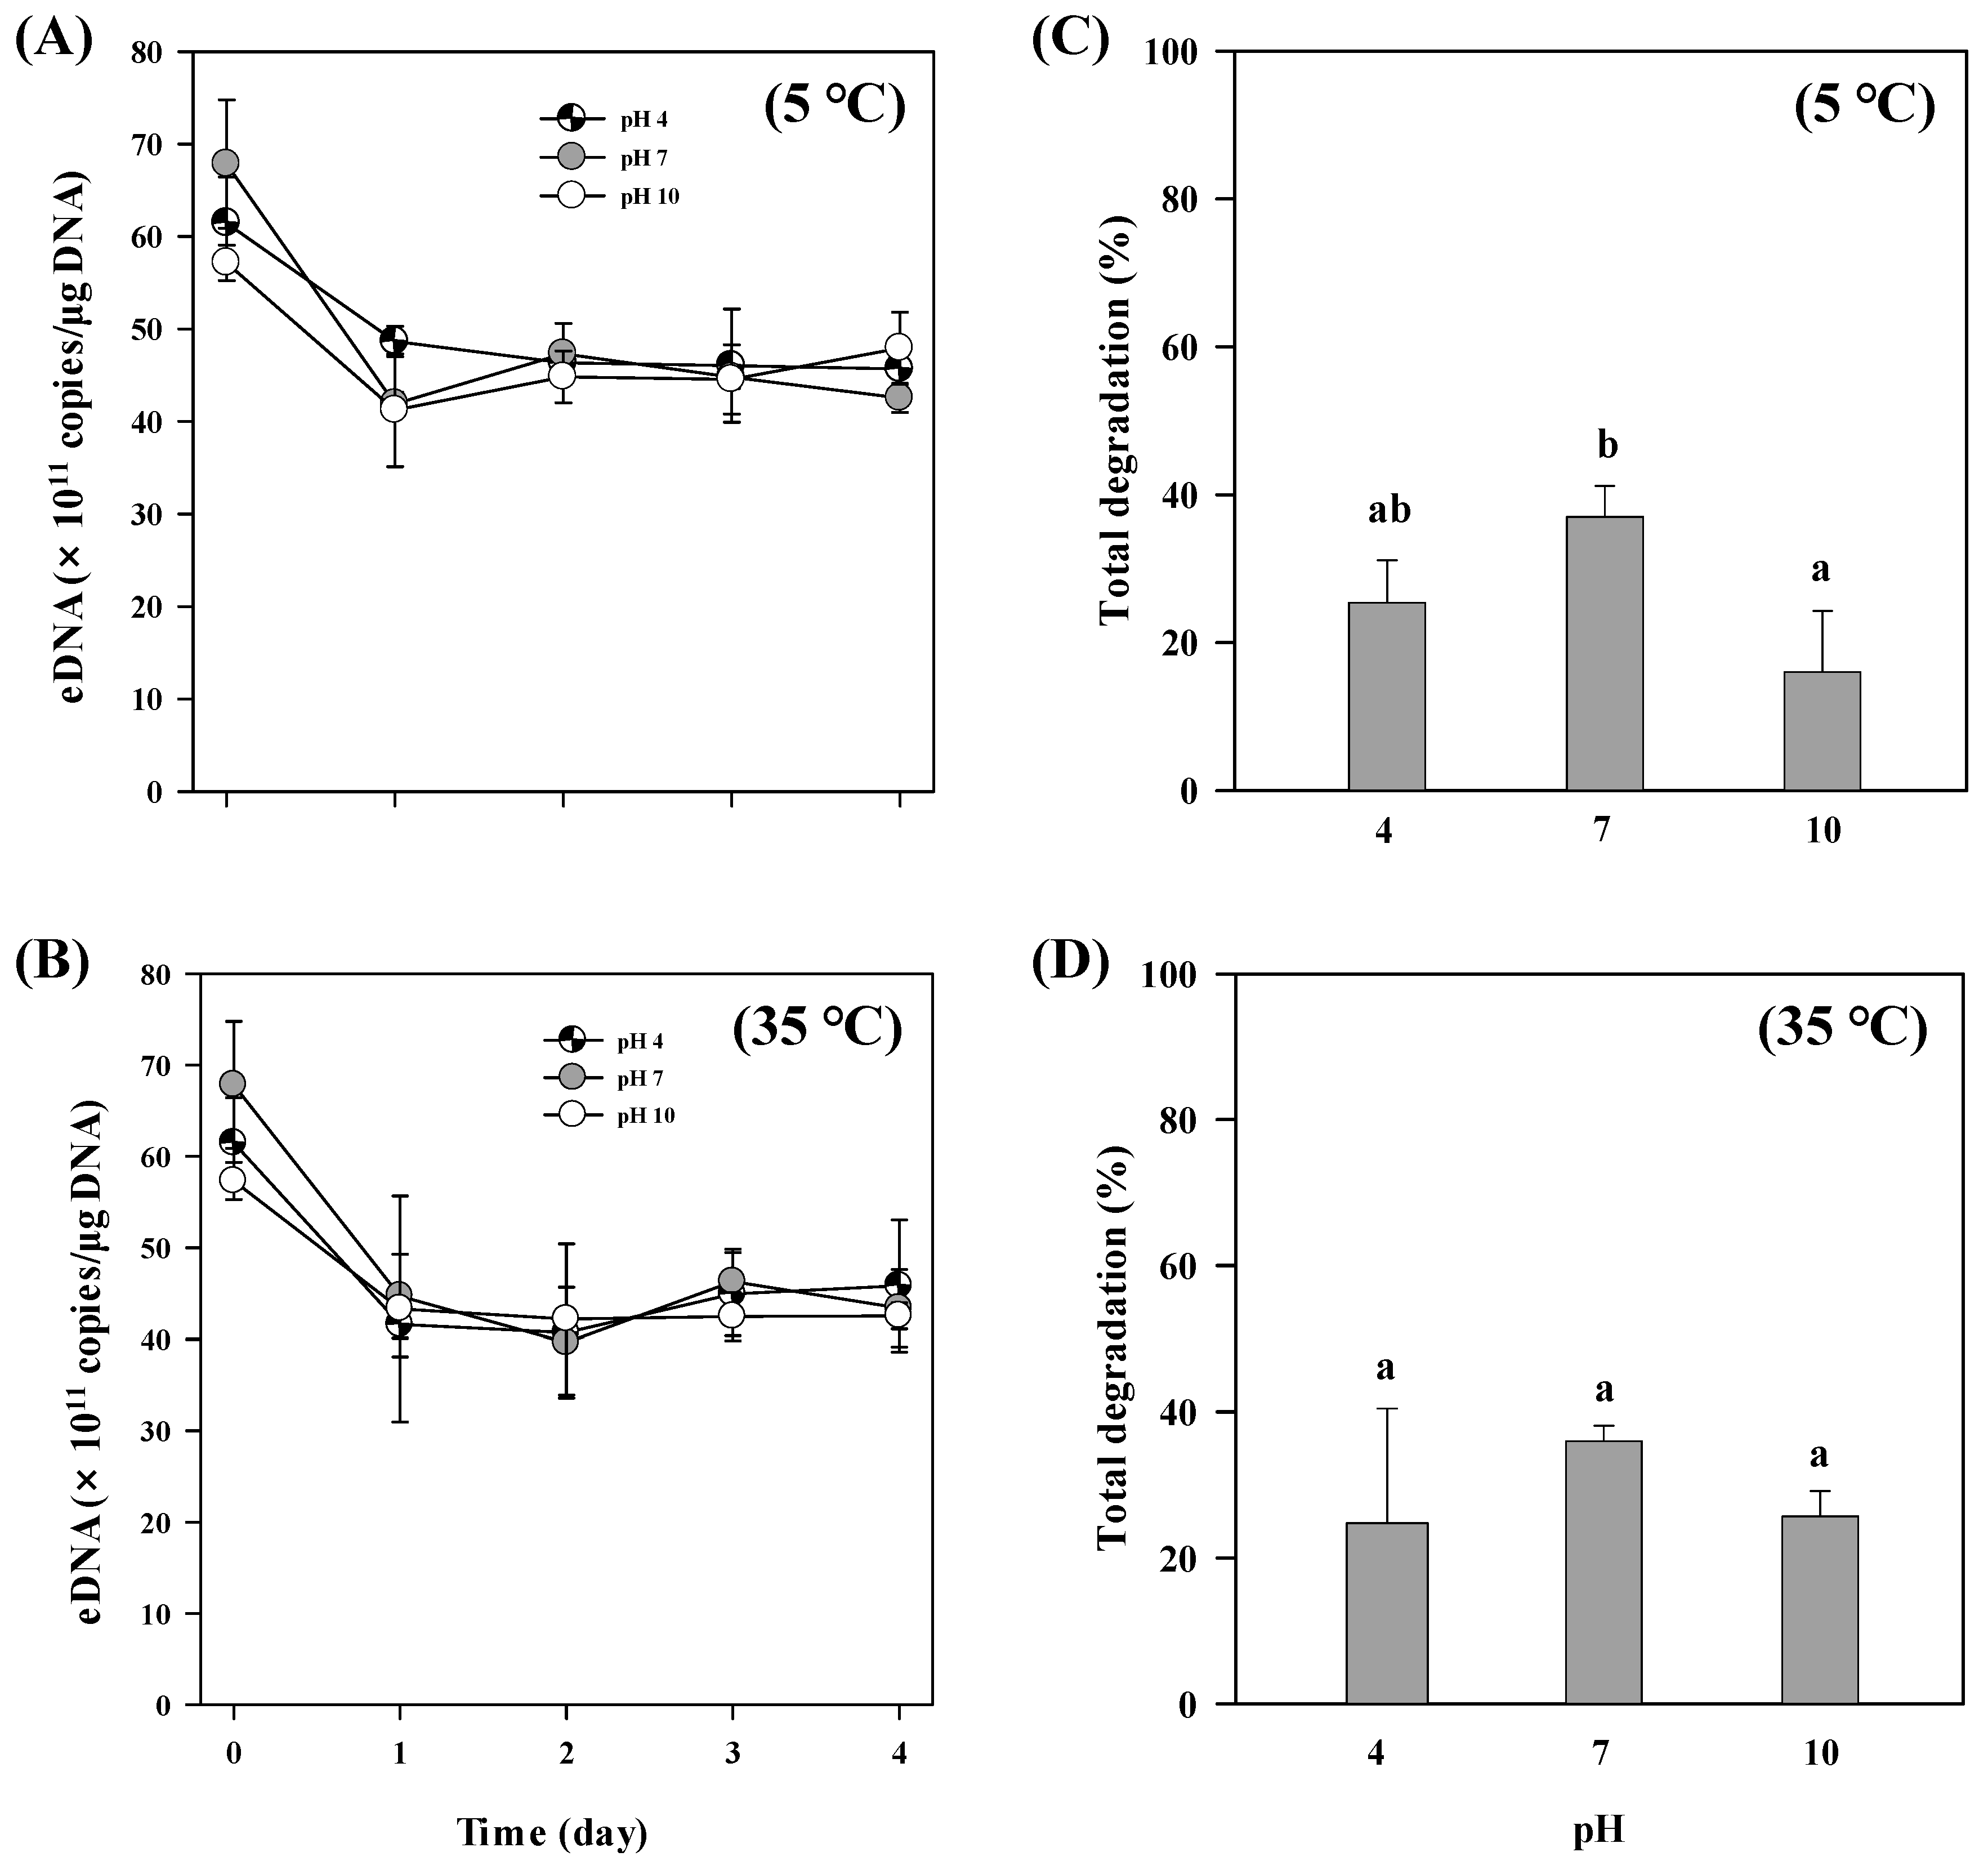
3.4. pH Effect
4. Discussion
5. Conclusions
Author Contributions
Funding
Conflicts of Interest
References
- Taberlet, P.; Coissac, E.; Hajibabaei, M.; Rieseberg, L.H. Environmental DNA. Mol. Ecol. 2012, 21, 1789–1793. [Google Scholar] [CrossRef] [PubMed]
- Davy, C.M.; Kidd, A.G.; Wilson, C.C. Development and validation of environmental DNA (eDNA) markers for detection of freshwater turtles. PLoS ONE 2015, 10, e0130965. [Google Scholar] [CrossRef] [PubMed]
- Keller, S.R.; Hilderbrand, R.H.; Shank, M.K.; Potapova, M. Environmental DNA genetic monitoring of the nuisance freshwater diatom, Didymosphenia geminata, in eastern North American streams. Divers. Distrib. 2017, 23, 381–393. [Google Scholar] [CrossRef]
- Foote, A.D.; Thomsen, P.F.; Sveegaard, S.; Wahlberg, M.; Kielgast, J.; Kyhn, L.A.; Salling, A.B.; Galatius, A.; Orlando, L.; Gilbert, M.T.P. Investigating the potential use of environmental DNA (eDNA) for genetic monitoring of marine mammals. PLoS ONE 2012, 7, e41781. [Google Scholar] [CrossRef] [PubMed]
- Takahara, T.; Minamoto, T.; Yamanaka, H.; Doi, H.; Kawabata, Z.I. Estimation of fish biomass using environmental DNA. PLoS ONE 2012, 7, e35868. [Google Scholar] [CrossRef] [PubMed]
- Tréguier, A.; Paillisson, J.M.; Dejean, T.; Valentini, A.; Schlaepfer, M.A.; Roussel, J.M. Environmental DNA surveillance for invertebrate species: Advantages and technical limitations to detect invasive crayfish Procambarus clarkii in freshwater ponds. J. Appl. Ecol. 2014, 51, 871–879. [Google Scholar] [CrossRef]
- Ficetola, G.F.; Miaud, C.; Pompanon, F.; Taberlet, P. Species detection using environmental DNA from water samples. Biol. Lett. 2008, 4, 423–425. [Google Scholar] [CrossRef] [PubMed] [Green Version]
- Rees, H.C.; Maddison, B.C.; Middleditch, D.J.; Patmore, J.R.; Gough, K.C. The detection of aquatic animal species using environmental DNA–A review of eDNA as a survey tool in ecology. J. Appl. Ecol. 2014, 51, 1450–1459. [Google Scholar] [CrossRef]
- De Souza, L.S.; Godwin, J.C.; Renshaw, M.A.; Larson, E. Environmental DNA (eDNA) detection probability is influenced by seasonal activity of organisms. PLoS ONE 2016, 11, e0165273. [Google Scholar] [CrossRef]
- Levy-Booth, D.J.; Campbell, R.G.; Gulden, R.H.; Hart, M.M.; Powell, J.R.; Klironomos, J.N.; Pauls, K.P.; Swanton, C.J.; Trevors, J.T.; Dunfield, K.E. Cycling of extracellular DNA in the soil environment. Soil Biol. Biochem. 2007, 39, 2977–2991. [Google Scholar] [CrossRef]
- Pietramellara, G.; Ascher, J.; Borgogni, F.; Ceccherini, M.; Guerri, G.; Nannipieri, P. Extracellular DNA in soil and sediment: Fate and ecological relevance. Biol. Fertil. Soils 2009, 45, 219–235. [Google Scholar] [CrossRef]
- Torti, A.; Lever, M.A.; Jørgensen, B.B. Origin, dynamics, and implications of extracellular DNA pools in marine sediments. Mar. Genom. 2015, 24, 185–196. [Google Scholar] [CrossRef] [PubMed]
- Jakubovics, N.; Shields, R.; Rajarajan, N.; Burgess, J. Life after death: The critical role of extracellular DNA in microbial biofilms. Lett. Appl. Microbiol. 2013, 57, 467–475. [Google Scholar] [CrossRef] [PubMed]
- Vorkapic, D.; Pressler, K.; Schild, S. Multifaceted roles of extracellular DNA in bacterial physiology. Curr. Genet. 2016, 62, 71–79. [Google Scholar] [CrossRef] [PubMed]
- Flemming, H.C.; Wingender, J. The biofilm matrix. Nat. Rev. Microbiol. 2010, 8, 623. [Google Scholar] [CrossRef] [PubMed]
- Schallenberg, M.; Kalff, J. The ecology of sediment bacteria in lakes and comparisons with other aquatic ecosystems. Ecology 1993, 74, 919–934. [Google Scholar] [CrossRef]
- Jiang, H.; Dong, H.; Zhang, G.; Yu, B.; Chapman, L.R.; Fields, M.W. Microbial diversity in water and sediment of Lake Chaka, an Athalassohaline lake in northwestern China. Appl. Environ. Microbiol. 2006, 72, 3832–3845. [Google Scholar] [CrossRef] [PubMed]
- Sommers, P.; Darcy, J.L.; Porazinska, D.L.; Gendron, E.M.; Fountain, A.G.; Zamora, F.; Vincent, K.; Cawley, K.M.; Solon, A.J.; Vimercati, L. Comparison of microbial communities in the sediments and water columns of frozen cryoconite holes in the McMurdo Dry Valleys, Antarctica. Front. Microbiol. 2019, 10. [Google Scholar] [CrossRef] [PubMed]
- Kuwae, T.; Hosokawa, Y. Determination of abundance and biovolume of bacteria in sediments by dual staining with 4′, 6-diamidino-2-phenylindole and acridine orange: Relationship to dispersion treatment and sediment characteristics. Appl. Environ. Microbiol. 1999, 65, 3407–3412. [Google Scholar] [PubMed]
- Jørgensen, N.O.G.; Jacobsen, C. Bacterial uptake and utilization of dissolved DNA. Aquat. Microb. Ecol. 1996, 11, 263–270. [Google Scholar] [CrossRef]
- Nielsen, K.M.; Johnsen, P.J.; Bensasson, D.; Daffonchio, D. Release and persistence of extracellular DNA in the environment. Environ. Biosaf. Res. 2007, 6, 37–53. [Google Scholar] [CrossRef] [PubMed] [Green Version]
- Nielsen, K.M.; Calamai, L.; Pietramellara, G. Stabilization of extracellular DNA and proteins by transient binding to various soil components. In Nucleic Acids and Proteins in Soil; Springer: Berlin, Germany, 2006; pp. 141–157. [Google Scholar]
- Matsui, K.; Honjo, M.; Kawabata, Z. Estimation of the fate of dissolved DNA in thermally stratified lake water from the stability of exogenous plasmid DNA. Aquat. Microb. Ecol. 2001, 26, 95–102. [Google Scholar] [CrossRef] [Green Version]
- Corinaldesi, C.; Danovaro, R.; Dell’Anno, A. Simultaneous recovery of extracellular and intracellular DNA suitable for molecular studies from marine sediments. Appl. Environ. Microbiol. 2005, 71, 46–50. [Google Scholar] [CrossRef] [PubMed]
- Turner, C.R.; Uy, K.L.; Everhart, R.C. Fish environmental DNA is more concentrated in aquatic sediments than surface water. Biol. Conserv. 2015, 183, 93–102. [Google Scholar] [CrossRef] [Green Version]
- Corinaldesi, C.; Beolchini, F.; Dell’Anno, A. Damage and degradation rates of extracellular DNA in marine sediments: Implications for the preservation of gene sequences. Mol. Ecol. 2008, 17, 3939–3951. [Google Scholar] [CrossRef] [PubMed]
- Mao, D.; Luo, Y.; Mathieu, J.; Wang, Q.; Feng, L.; Mu, Q.; Feng, C.; Alvarez, P. Persistence of extracellular DNA in river sediment facilitates antibiotic resistance gene propagation. Environ. Sci. Technol. 2013, 48, 71–78. [Google Scholar] [CrossRef] [PubMed]
- Barnes, M.A.; Turner, C.R.; Jerde, C.L.; Renshaw, M.A.; Chadderton, W.L.; Lodge, D.M. Environmental conditions influence eDNA persistence in aquatic systems. Environ. Sci. Technol. 2014, 48, 1819–1827. [Google Scholar] [CrossRef] [PubMed]
- Strickler, K.M.; Fremier, A.K.; Goldberg, C.S. Quantifying effects of UV-B, temperature, and pH on eDNA degradation in aquatic microcosms. Biol. Conserv. 2015, 183, 85–92. [Google Scholar] [CrossRef]
- Lance, R.F.; Klymus, K.E.; Richter, C.A.; Guan, X.; Farrington, H.L.; Carr, M.R.; Thompson, N.; Chapman, D.; Baerwaldt, K.L. Experimental observations on the decay of environmental DNA from bighead and silver carps. Manag. Biol. Invasions 2017, 8, 343–359. [Google Scholar] [CrossRef] [Green Version]
- Tsuji, S.; Ushio, M.; Sakurai, S.; Minamoto, T.; Yamanaka, H. Water temperature-dependent degradation of environmental DNA and its relation to bacterial abundance. PLoS ONE 2017, 12, e0176608. [Google Scholar] [CrossRef] [PubMed]
- Seymour, M.; Durance, I.; Cosby, B.J.; Ransom-Jones, E.; Deiner, K.; Ormerod, S.J.; Colbourne, J.K.; Wilgar, G.; Carvalho, G.R.; de Bruyn, M.; et al. Acidity promotes degradation of multi-species environmental DNA in lotic mesocosms. Commun. Biol. 2018, 1, 4. [Google Scholar] [CrossRef] [PubMed]
- Mächler, E.; Osathanunkul, M.; Altermatt, F. Shedding light on eDNA: Neither natural levels of UV radiation nor the presence of a filter feeder affect eDNA-based detection of aquatic organisms. PLoS ONE 2018, 13, e0195529. [Google Scholar] [CrossRef] [PubMed]
- Andruszkiewicz, E.A.; Sassoubre, L.M.; Boehm, A.B. Persistence of marine fish environmental DNA and the influence of sunlight. PLoS ONE 2017, 12, e0185043. [Google Scholar] [CrossRef] [PubMed]
- Eichmiller, J.J.; Best, S.E.; Sorensen, P.W. Effects of temperature and trophic state on degradation of environmental DNA in lake water. Environ. Sci. Technol. 2016, 50, 1859–1867. [Google Scholar] [CrossRef] [PubMed]
- Vuillemin, A.; Horn, F.; Alawi, M.; Henny, C.; Wagner, D.; Crowe, S.A.; Kallmeyer, J. Preservation and significance of extracellular DNA in ferruginous sediments from Lake Towuti, Indonesia. Front. Microbiol. 2017, 8, 1440. [Google Scholar] [CrossRef] [PubMed]
- Corinaldesi, C.; Tangherlini, M.; Luna, G.M.; Dell’Anno, A. Extracellular DNA can preserve the genetic signatures of present and past viral infection events in deep hypersaline anoxic basins. Proc. R. Soc. Lond. B Biol. Sci. 2014, 281, 20133299. [Google Scholar] [CrossRef] [PubMed]
- Lazarevic, V.; Gaïa, N.; Girard, M.; François, P.; Schrenzel, J. Comparison of DNA extraction methods in analysis of salivary bacterial communities. PLoS ONE 2013, 8, e67699. [Google Scholar] [CrossRef]
- Dunbar, J.; Takala, S.; Barns, S.M.; Davis, J.A.; Kuske, C.R. Levels of bacterial community diversity in four arid soils compared by cultivation and 16S rRNA gene cloning. App. Environ. Microbiol. 1999, 65, 1662–1669. [Google Scholar]
- Porter, K.G.; Feig, Y.S. The use of DAPI for identifying and counting aquatic microflora 1. Limnol. Oceanogr. 1980, 25, 943–948. [Google Scholar] [CrossRef]
- Lin, S.; Shen, J.; Liu, Y.; Wu, X.; Liu, Q.; Li, R. Molecular evaluation on the distribution, diversity, and toxicity of Microcystis (Cyanobacteria) species from Lake Ulungur—A mesotrophic brackish desert lake in Xinjiang, China. Environ. Monit. Assess. 2011, 175, 139–150. [Google Scholar] [CrossRef]
- Oh, K.H. Screening of Conserved DNA Sequences in Microcystin-Producing Cyanobacteria and Application of the Sequences to Monitor Microcystins in Water Reservoirs. Ph.D. Thesis, Graduate School of Seoul National University, Seoul, Korea, February 2009. [Google Scholar]
- Vaitomaa, J.; Rantala, A.; Halinen, K.; Rouhiainen, L.; Tallberg, P.; Mokelke, L.; Sivonen, K. Quantitative real-time PCR for determination of microcystin synthetase E copy numbers for Microcystis and Anabaena in lakes. Appl. Environ. Microbiol. 2003, 69, 7289–7297. [Google Scholar] [CrossRef] [PubMed]
- Heid, C.A.; Stevens, J.; Livak, K.J.; Williams, P.M. Real time quantitative PCR. Genome Res. 1996, 6, 986–994. [Google Scholar] [CrossRef] [PubMed]
- Dejean, T.; Valentini, A.; Duparc, A.; Pellier-Cuit, S.; Pompanon, F.; Taberlet, P.; Miaud, C. Persistence of environmental DNA in freshwater ecosystems. PLoS ONE 2011, 6, e23398. [Google Scholar] [CrossRef] [PubMed]
- Bowling, R.A. A theoretical review of particle adhesion. In Particles on Surfaces 1; Springer: Berlin, Germany, 1988; pp. 129–142. [Google Scholar]
- Pilliod, D.S.; Goldberg, C.S.; Arkle, R.S.; Waits, L.P. Factors influencing detection of eDNA from a stream-dwelling amphibian. Mol. Ecol. Resour. 2014, 14, 109–116. [Google Scholar] [CrossRef] [PubMed]
- Corinaldesi, C.; Tangherlini, M.; Manea, E.; Dell’Anno, A. Extracellular DNA as a genetic recorder of microbial diversity in benthic deep-sea ecosystems. Sci. Rep. 2018, 8, 1839. [Google Scholar] [CrossRef] [PubMed]
- Salter, S.J.; Cox, M.J.; Turek, E.M.; Calus, S.T.; Cookson, W.O.; Moffatt, M.F.; Turner, P.; Parkhill, J.; Loman, N.J.; Walker, A.W. Reagent and laboratory contamination can critically impact sequence-based microbiome analyses. BMC Biol. 2014, 12, 87. [Google Scholar] [CrossRef]
- Barja, M.I.; Proupin, J.; Núnez, L. Microcalorimetric study of the effect of temperature on microbial activity in soils. Thermochim. Acta 1997, 303, 155–159. [Google Scholar] [CrossRef]
- Mulcahy, H.; Charron-Mazenod, L.; Lewenza, S. Pseudomonas aeruginosa produces an extracellular deoxyribonuclease that is required for utilization of DNA as a nutrient source. Environ. Microbiol. 2010, 12, 1621–1629. [Google Scholar]
- Häder, D.P.; Sinha, R.P. Solar ultraviolet radiation-induced DNA damage in aquatic organisms: Potential environmental impact. Mutat. Res. Fundam. Mol. Mech. Mutagen. 2005, 571, 221–233. [Google Scholar] [CrossRef]
- Häder, D.P.; Lebert, M.; Schuster, M.; Ciampo, L.D.; Helbling, E.W.; McKenzie, R. ELDONET—A decade of monitoring solar radiation on five continents. Photochem. Photobiol. 2007, 83, 1348–1357. [Google Scholar] [CrossRef]
- Lindahl, T. Instability and decay of the primary structure of DNA. Nature 1993, 362, 709. [Google Scholar] [CrossRef] [PubMed]
- Gates, K.S. An overview of chemical processes that damage cellular DNA: Spontaneous hydrolysis, alkylation, and reactions with radicals. Chem. Res. Toxicol. 2009, 22, 1747–1760. [Google Scholar] [CrossRef] [PubMed]
- Tsuji, S.; Yamanaka, H.; Minamoto, T. Effects of water pH and proteinase K treatment on the yield of environmental DNA from water samples. Limnology 2017, 18, 1–7. [Google Scholar] [CrossRef]
- Crecchio, C.; Stotzky, G. Binding of DNA on humic acids: Effect on transformation of Bacillus subtilis and resistance to DNase. Soil Biol. Biochem. 1998, 30, 1061–1067. [Google Scholar] [CrossRef]


| Treatment | Levels | Interacting Factors |
|---|---|---|
| Temperature | 5 °C 15 °C 25 °C 35 °C | None |
| Bacterial activity | No Bacteria 1.6 ± 0.12 × 10⁷ cells/mL (100 fold) 1.6 ± 0.12 × 10⁵ cells/mL (10−2 fold) 1.6 ± 0.12 × 10² cells/mL (10−5 fold) | Temperature (5 °C, 25 °C, 35 °C) |
| pH | pH 4 pH 7 pH 10 | Temperature (5 °C, 35 °C) |
| Light intensity | Dark 20 μmol m−2 s−1 50 μmol m−2 s−1 100 μmol m−2 s−1 | Temperature (5 °C, 35 °C) |
| Temperature (°C) | Degradation Rate (r) (day−1) | SE | p-Value |
|---|---|---|---|
| 5 | 0.0692 | 0.0298 | 0.0353 |
| 15 | 0.1201 | 0.0339 | 0.0383 |
| 25 | 0.1942 | 0.0599 | 0.0479 |
| 35 | 0.2547 | 0.0536 | 0.0177 |
| Dilution Factor | Bacterial Concentration | Degradation Rate (r) (day−1) | SE | p-Value |
|---|---|---|---|---|
| None | 0 | 0.1297 | 0.0472 | 0.0709 |
| 100 | 1.6 ± 0.12 × 10⁷ cells/mL | 3.2706 | 0.2178 | 0.0006 |
| 10−2 | 1.6 ± 0.12 × 10⁵ cells/mL | 0.4112 | 0.0505 | 0.0039 |
| 10−5 | 1.6 ± 0.12 × 10² cells/mL | 0.4513 | 0.0987 | 0.0196 |
| Reference | eDNA Type | Source | Environmental Factor | Decay Rate, (r) (day−1) | |
|---|---|---|---|---|---|
| This study | Extracellular | Sediment sample Cyanobacterium Anabaena variabilis | Temperature *, microbial activity *, pH, light intensity | 0.0931–3.2706 | |
| [32] | Intracellular | Crustacean Daphnia magna | pH *, temperature, microbial activity, total dissolved nitrogen | Water derived | 6.552–23.568 |
| Mayfly Ephemera danica | |||||
| Biofilm derived | 1.176–17.256 | ||||
| Eel Anguilla anguilla | |||||
| [31] | Intracellular | Ayu sweetfish Plecoglossus altivelis altivelis | Temperature *, microbial abundance | 0.48–7.2 | |
| Common carp Cyprinus carpio | |||||
| [35] | Intracellular | Common carp Cyprinus carpio | Temperature *, trophic state * | 0.35–2.42 | |
| [29] | Intracellular | American bullfrog Lithobates catesbeianus | UV-B *, temperature *, pH | 0.243 | |
| [28] | Intracellular | Common carp Cyprinus carpio | Microbial community *, pH | 2.52 | |
| [27] | Extracellular | Sediment and water samples | Based on simplified OECD endurance test | 0.009–0.133 | |
© 2019 by the authors. Licensee MDPI, Basel, Switzerland. This article is an open access article distributed under the terms and conditions of the Creative Commons Attribution (CC BY) license (http://creativecommons.org/licenses/by/4.0/).
Share and Cite
Zulkefli, N.S.; Kim, K.-H.; Hwang, S.-J. Effects of Microbial Activity and Environmental Parameters on the Degradation of Extracellular Environmental DNA from a Eutrophic Lake. Int. J. Environ. Res. Public Health 2019, 16, 3339. https://doi.org/10.3390/ijerph16183339
Zulkefli NS, Kim K-H, Hwang S-J. Effects of Microbial Activity and Environmental Parameters on the Degradation of Extracellular Environmental DNA from a Eutrophic Lake. International Journal of Environmental Research and Public Health. 2019; 16(18):3339. https://doi.org/10.3390/ijerph16183339
Chicago/Turabian StyleZulkefli, Nur Syahidah, Keon-Hee Kim, and Soon-Jin Hwang. 2019. "Effects of Microbial Activity and Environmental Parameters on the Degradation of Extracellular Environmental DNA from a Eutrophic Lake" International Journal of Environmental Research and Public Health 16, no. 18: 3339. https://doi.org/10.3390/ijerph16183339