Article

Comparative Analysis of Long-Term Variation Characteristics of SO2, NO2, and O3 in the Ecological and Economic Zones of the Western Sichuan Plateau, Southwest China

1
Plateau Atmosphere and Environment Key Laboratory of Sichuan Province, College of Atmospheric Science, Chengdu University of Information Technology, Chengdu 610225, China
2
Heavy Rain and Drought-Flood Disasters in Plateau and Basin Key Laboratory of Sichuan Province, Chengdu 610072, China
3
Climate Center of Sichuan Province, Chengdu 610072, China
4
Sichuan Ecological Environment Monitoring Center, Chengdu 610041, China
5
Guangzhou Institute of Tropical and Marine Meteorology, China Meteorological Administration, Guangzhou 510080, China
*
Authors to whom correspondence should be addressed.
Int. J. Environ. Res. Public Health 2019, 16(18), 3265; https://doi.org/10.3390/ijerph16183265
Submission received: 25 July 2019 / Revised: 22 August 2019 / Accepted: 2 September 2019 / Published: 5 September 2019
(This article belongs to the Special Issue Air Quality Monitoring and Assessment)

Abstract

:
Sulfur dioxide (SO2), nitrogen dioxide (NO2), and ozone (O3) are important atmospheric pollutants that affect air quality. The long-term variations of SO2 and NO2 in 2008–2018 and O3 in 2015–2018 in the relatively less populated ecological and economic zones of Western Sichuan Plateau, Southwest China were analyzed. In 2008–2018, the variations in SO2 and NO2 in the ecological zone were not significant, but Ganzi showed a slight upward trend. SO2 decreased significantly in the economic zone, especially in Panzhihua, where NO2 changes were not obvious. From 2015 to 2018, the concentration of O3 in the ecological zone increased significantly, while the economic zone showed a downward trend. The rising trend of the concentration ratio of SO2 to NO2 in the ecological zone and the declining trend in the economic zone indicate that the energy consumption structure of these two zones is quite different. The lower correlation coefficients between NO2 and O3 in the Western Sichuan Plateau imply that the variations of O3 are mainly affected by the regional background. The effects of meteorological factors on SO2, NO2, and O3 were more obvious in the economic zone where there are high anthropometric emissions.

1. Introduction

In recent decades, China’s economy has developed rapidly. Especially in the 21st century, the emission of artificial air pollutants has increased significantly, and hazy weather is frequent; therefore, the air pollution problem has attracted people’s attention. The Sichuan Basin is one of the areas in China suffering from serious air pollution due to its special weather and topography [1,2,3,4]. Sulfur dioxide (SO2), nitrogen dioxide (NO2), and ozone (O3) are important pollutants that not only affect the generation of atmospheric fine particles and the photochemical and atmospheric acidification processes but also threaten human health [5,6,7,8]. Many previous studies [9,10,11] have carried out quantitative analysis of SO2, NO2, and O3 pollutants, discussed the diurnal and seasonal variation characteristics, and pointed out that SO2 and NO2 have the lowest concentration in summer due to the wet cleaning effect of precipitation, while O3 has the highest concentration as a result of the most active photochemical reactions occurring in spring and summer, indicating that NOx is an important precursor of O3.
Several studies have focused on the variations of SO2, NO2, and O3 in the most polluted areas in China, such as the Beijing-Tianjin-Hebei region, North China, and the Yangtze River and Pearl River Deltas. The results show that the concentration of SO2 declined sharply in the past decade, especially after 2006, because of the SO2 emission reduction requirement in China’s Nineth Five-Year Plan (1996–2000). The concentrations of NO2 in large and medium-sized cities of China showed a fluctuating upward trend due to the lack of effective denitration technology [12,13,14,15,16,17]. Due to the late observation time and complicated formation mechanism, few studies have been conducted on the long-term variation characteristics of O3. In the past five years, serious O3 pollution has appeared in the large cities of China, and O3 has replaced PM2.5 as the primary pollutant in some cities [18,19,20]. Zhao et al. [21] analyzed the characteristics of six criteria air pollutants in the Sichuan Basin of Southwest China from 2015 to 2017 and pointed out that all air pollutants except O3 showed U-shaped annual changes; motor vehicle emissions was the main contributor to O3 in the basin, while industrial emission was the main contributor to O3 in the Western Sichuan Plateau area. Air quality in many large and medium-sized cities has improved significantly as a result of various environmental policies implemented by the Chinese government [22,23]. The changes of air pollutants in the sparsely populated western plateau in the past decade remain in question.
The Sichuan Provincial Government [24] has designated Aba and Ganzi as ecological zones, and Liangshan and Panzhihua as economic zones based on the industrial structure and gross domestic product (GDP), respectively. They are located in a high-altitude area in the transition from the Sichuan Basin to the Tibet Plateau, called the Western Sichuan Plateau. Due to the sparsely populated land and low emissions of man-made pollutants, this is a clean air background region in southwest China and even the whole country. The study of the long-term variation characteristics of atmospheric pollutants in this region is of great scientific significance for a comparative analysis of pollutants in other regions of China. Based on the daily mass concentration of SO2 and NO2 from 2008 to 2018 and O3 from 2015 to 2018, long-term variations and the basic characteristics of three gaseous air pollutants in the ecological and economic zones of Western Sichuan Plateau were compared and analyzed in this paper.

2. Materials and Methods

The ecological and economic zones of Western Sichuan Plateau are located east of the Tibetan Plateau. The ecological zone includes Aba and Ganzi, and the economic zone includes Liangshan and Panzhihua. The geographical locations of these zones are shown in Figure 1, the area outlined in blue is the ecological zone and the area outlined in red is the economic zone, and the locations of cities are marked by black dots. The average altitude of Aba, Ganzi, Liangshan, and Panzhihua is 3000 m, 4100 m, 1500 m, and 1500 m, respectively.
The air pollutants data used in this paper were collected from Sichuan Ecological Environment Monitoring Center (http://www.scnewair.cn:6112/publish/index.html) [25]. The citywide daily average concentrations of SO2 and NO2 from 1 January 2008 to 31 December 2018, and the citywide daily maximum eight-hour average concentration of O3 from 1 January 2015 to 31 December 2018 were used to analyze the spatiotemporal distribution characteristics of three air pollutants in Western Sichuan Plateau. The mass concentrations of SO2, NO2, and O3 were measured by the ultraviolet fluorescence method (TEI, Model 43i, Thermo Fisher Scientific Inc., Waltham, MA, USA), the chemiluminescence method (TEI, Model 42i, Thermo Fisher Scientific Inc., USA), and the UV spectrophotometry method (TEI, Model 49i, Thermo Fisher Scientific Inc., USA), respectively [21]. The measurements were conducted by multiple national air quality monitoring sites in cities [26]. The daily average concentrations of the three air pollutants released after quality assurance and control by the Sichuan Ecological Environment Monitoring Center based on Technical Guideline on Environmental Monitoring Quality Management HJ 630-2011 (http://kjs.mep.gov.cn) were the same as the daily air quality reports issued by the government. In addition, at least 324 and 25 daily concentrations were required to calculate the average annual concentrations of SO2, NO2, and O3.
The routine meteorological parameters were collected from the National Meteorological Information Center of China [27]. The surface stations are shown by black dots in Figure 1. The monthly mean meteorological parameters included mean monthly average temperature, maximum and minimum monthly average temperature, mean relative humidity, monthly total precipitation, monthly sunshine duration, mean wind speed, and maximum wind speed from January 2008 to December 2017. The data quality is controlled by the National Meteorological Information Center of China and the accuracy rate is close to 100%.
The related statistical data of the basic situation of each city were collected from the statistical yearbook provided by the Sichuan provincial bureau (http://tjj.sc.gov.cn/tjnj). Table 1 shows the region category, area, resident population, urbanization rate, GDP, and possession of civil motor vehicles of the study area at the end of 2016. The urbanization rates of Aba, Ganzi, and Liangshan are relatively low, at 37.86%, 29.26%, and 33.04%, respectively. GDP and the number of vehicles in Liangshan and Panzhihua are obviously higher than in Aba and Ganzi, which means there are more man-made air pollutants in the economic zone (Liangshan and Panzhihua).

3. Results and Discussion

3.1. Temporal Variations of SO2, NO2, and O3

The variations of SO2 and NO2 from 2008 to 2018 and O3 from 2015 to 2018 in the ecological and economic zones of Western Sichuan Plateau based on monthly average mass concentration are shown in Figure 2. The variations of SO2 and NO2 were divided into two periods before and after 2012. SO2 and NO2 in Aba showed a downward trend before and after 2012, and the downward trend was more prominent after 2012. However, SO2 and NO2 in Ganzi increased before 2012 and decreased after 2012. O3 in the ecological zone of the Western Sichuan Plateau, Aba and Ganzi, showed a significant upward trend, with a rising rate of 0.303 μg·m−3/month and 0.154 μg·m−3/month, respectively. Ma et al. [28] reported an increasing trend of surface O3 in a rural site north of eastern China and indicated that meteorological factors had little influence on long-term O3 change, which was completely related to emissions. SO2 and NO2 in Liangshan showed a trend of first rising and then falling before and after 2012, and the decline of SO2 was particularly significant after 2012. SO2 in Panzhihua increased significantly before 2012 and decreased after 2012, while NO2 showed a slight decline and increase trend before and after 2012. The declining trend of O3 in Liangshan was very prominent, with a declining rate of 0.36 μg·m−3/month, while the change range of O3 in Panzhihua, with the highest urbanization rate, was not obvious. In general, the changes of SO2 and NO2 in the ecological zone of Western Sichuan Plateau were weak, while the decrease of SO2 in the economic zone was very significant and the variation trend of O3 in the ecological and economic zones was opposite.
For further analysis, Figure 3 shows the annual variation trend of SO2, NO2, and O3 in the ecological and economic zones of Western Sichuan Plateau, based on the annual average mass concentrations of SO2 and NO2 from 2008 to 2018, and O3 from 2015 to 2018. The concentrations of SO2 and NO2 in the ecological area were relatively lower due to the small influence of human activity. The annual variation characteristics of SO2 and NO2 in Aba were very similar; their annual concentrations remained stable at about 12 μg·m−3 from 2008 to 2012. From 2012 to 2013, the concentration of SO2 and NO2 increased significantly, from, respectively, 12.73 ± 8.28 μg·m−3 to 22.68 ± 9.25 μg·m−3, and from 14.51 ± 6.92 μg·m−3 to 24.12 ± 7.97 μg·m−3, then decreased to 7.79 ± 4.96 μg·m−3 and 10.27 ± 4.88 μg·m−3 in 2015, and then stabilized to 2018. The average O3 concentration in Aba increased from 66.56 ± 14.26 μg·m−3 to 86.37 ± 23.17 μg·m−3 from 2015 to 2018. The annual average concentration of NO2 in Ganzi was always higher than that of SO2 from 2008 to 2018, but the annual variations of SO2 and NO2 were relatively close. SO2 wavelike variation went up from 2008 to 2013, then went down, then rose again from 2015 to 2016, then fell again; the lowest concentration was 9.05 ± 7.81 μg·m−3 in 2008, and the highest concentration was 22.62 ± 9.74 μg·m−3 in 2016. The lowest concentration of NO2 in Ganzi was 15.77 ± 8.72 μg·m−3 in 2008, and the highest concentration was 32.83 ± 8.96 μg·m−3 in 2012. Overall, SO2 and NO2 in Ganzi showed an upward and then a downward trend, and the annual average concentrations of 2008 and 2018 were relatively close. The average O3 concentration in Ganzi dropped from 62.47 ± 26.75 μg·m−3 in 2015 to 52.64 ± 19.97 μg·m−3 in 2016, and then rose to 95.45 ± 22.86 μg·m−3 in 2018.
The biggest difference between annual variation characteristics of SO2 and NO2 in the economic and ecological zones was that the annual average concentration of SO2 was almost always higher than that of NO2. In 2008–2016, the mean SO2 concentration in Liangshan was always higher than that of NO2. The mean SO2 concentration increased from 35.84 ± 16.76 μg·m−3 in 2008 to 43.41 ± 16.72 μg·m−3 in 2013 and then fell irregularly to 16.44 ± 4.71 μg·m−3 in 2018. In general, SO2 in Liangshan showed a downward trend, and the concentration in 2018 was 54.13% lower than that in 2008. NO2 wavelike variation in Liangshan increased from 21.82 ± 5.15 μg·m−3 in 2008 to 29.3 ± 5.95 μg·m−3 in 2012, (34.4%), and then fell to 20.52 ± 6.62 μg·m−3 in 2018. The annual average concentration of O3 in Liangshan showed a similar trend to Ganzi, first decreasing from 99.93 ± 27.66 μg·m−3 in 2015 to 92.49 ± 27.47 μg·m−3 in 2016, and then rising to 98.68 ± 2 8.85 μg·m−3 in 2018. Panzhihua has the highest urbanization among the four regions and the largest change range of SO2 annual average concentration. The SO2 concentration in Panzhihua was always higher than that of NO2 in 2008–2018. The average concentration of SO2 increased from 76.08 ± 32.77 μg·m−3 in 2008 to 86.52 ± 33.16 μg·m−3 in 2012, then fell sharply to 33.55 ± 14.65 μg·m−3 in 2015, then increased slightly to about 39 μg·m−3 in 2018. The average concentration of NO2 in Panzhihua decreased from 44.47 ± 12.01 μg·m−3 in 2008 to 31.82 ± 9.67 μg·m−3 in 2015, (28.45%), and then went up to 38.57 ± 10.49 μg·m−3 in 2018. The annual variation of O3 in Panzhihua showed a trend of first decreasing and then increasing, from 90.34 ± 22.89 μg·m−3 in 2014 to 75.79 ± 26.38 μg·m−3 in 2016, and then recovering to 93.05 ± 33.49 μg·m−3 in 2018.
In general, the annual variation of gas pollutants in the Western Sichuan Plateau, a relatively clean area, was different from that in large and medium-sized cities. The overall variations of SO2 and NO2 in the Western Sichuan Plateau were not very large, showing a trend of first increasing and then decreasing.
Overall, SO2 and NO2 in Aba, Ganzi, and Liangshan showed a small change range, and both showed a trend of first increasing and then decreasing in 2008–2018. However, after China’s 11th Five-Year Plan (2006–2010), SO2 concentration in large and medium-sized cities [14,29,30] showed an obvious downward trend, while NO2 showed a fluctuating or rising trend. The significant decrease of SO2 concentration in Panzhihua from 2012 to 2015 was also related to the emission reduction measures in China’s 12th Five-Year Plan (2011–2015). This shows that after the 11th Five-Year Plan, the emission reduction requirements for SO2 and NO2 proposed by the government had no obvious impact on the relatively clean Western Sichuan Plateau. The annual variations of O3 in the ecological and economic zones of the Western Sichuan Plateau were like those in Eastern China. Li et al. [20] showed that O3 increased significantly during the period of 2013–2017 in the North China Plain, the Pearl River Delta, Chengdu-Chongqing urban agglomeration, and Southeastern China, while the O3 pollution in parts of the northwest, southwest, and northeast of the country was relatively light.
Figure 4 shows the annual variation characteristics of the average concentrations of SO2, NO2, and O3 in different seasons in the ecological and economic zones of Western Sichuan Plateau. Figure 4a–c show the annual variations of SO2, NO2, and O3 in different seasons in Aba. The annual changes of SO2 in spring and winter were more significant, rising first and then falling, reaching the maximum value in 2013. NO2 increased first and then decreased in all seasons, with the largest change in summer, reaching a maximum of 30.33 μg·m−3 in 2013. In both summer and winter, O3 showed an upward and then a downward trend, while in spring, it showed a very significant upward trend, with an increase of about 55.4% from 2015 to 2018. Figure 4d–f show the annual variations of seasonal average concentrations of SO2, NO2, and O3 in Ganzi. In the autumn, SO2 showed the most significant annual change, rising from 9.4 μg·m−3 in 2008 to 31.5 μg·m−3 in 2016, and finally falling to 9.3 μg·m−3 in 2018. NO2 fluctuated in all seasons, with the largest change in spring, increasing about 233.6% from 2008 to 2013, and decreasing about 58.1% from 2013 to 2018. In spring and autumn, O3 showed a downward and then an upward trend, while in summer, it showed a significant upward trend, with an increase of about 88.8% from 2015 to 2018. Both SO2 (Figure 4g) and NO2 (Figure 4h) in Liangshan showed the most obvious annual change range in winter; SO2 and NO2 reached the maximum value in 2011 and 2013, respectively. In spring, summer, and autumn, O3 in Liangshan (Figure 4i) showed a trend of first declining and then rising, while in winter it showed a trend of first rising and then falling, but the change range was small, decreasing by 5.8 μg·m−3 in 2017–2018. The seasonal average concentration of SO2 in Panzhihua (Figure 4j) showed the largest change in winter, with a decrease of 69.9% from 121.9 μg·m−3 in 2009 to 36.6 μg·m−3 in 2018. NO2 in Panzhihua (Figure 4k) showed a trend of first declining and then rising in all four seasons; the change ranges of spring and winter were large, and the seasonal average concentration in spring and winter reached the minimum value in 2016 and 2015, respectively. O3 in Panzhihua (Figure 4l) showed a trend of first declining and then rising in all four seasons, with a large change range in spring and summer, and an increase of about 26% in spring from 2016 to 2018.
The average mass concentration ratio of SO2 and NO2 (SO2/NO2) can represent the energy structure characteristics of a local region [31]. For example, in regions with more developed industries, a large amount of sulfur-containing fuel is consumed and SO2 is emitted, thus, SO2/NO2 is larger. If an area has a mass of cars and emits more NOx, the ratio is relatively small. In the 1990s, SO2/NO2 in North America and some eastern and central European countries exceeded 1, indicating that these regions had developed industries and the emissions were mainly SO2 [31]. Figure 5 shows the change characteristics of SO2/NO2 based on monthly average concentration in the ecological and economic zones of Western Sichuan Plateau from 2008 to 2018. As can be seen, SO2/NO2 of Aba and Ganzi in the ecological zone showed an upward trend, while SO2/NO2 of Liangshan and Panzhihua in the economic zone showed a downward trend. From 2008 to 2018, SO2/NO2 of Aba fluctuated and showed a slight upward trend, with an average increase of 8.9 × 10⁻⁵/month. Overall, SO2/NO2 of Ganzi was smaller than that of Aba, and the overall SO2/NO2 fluctuated and had a more obvious upward trend, with an average increase of 0.002/month, and SO2/NO2 stayed below 1.0 most of the time. SO2/NO2 in both Liangshan and Panzhihua showed an obvious downward trend, with an average decline of −0.007/month in Liangshan and a slightly higher rate in Panzhihua, −0.008/month. According to the annual average concentration ratio of SO2 and NO2 (not shown), before 2017, the annual SO2/NO2 in Liangshan was greater than 1.0, and the maximum value (about 1.88) appeared in 2011, while in 2017 and 2018, SO2/NO2 was less than 1.0 (0.73 and 0.80, respectively). The annual SO2/NO2 in Panzhihua was higher than that in Liangshan; from 2008 to 2012, it showed a quasi-linear growth trend, increasing from 1.71 in 2008 to 2.17 in 2012, and then significantly decreasing, reaching the lowest value of about 0.99 in 2017.
The rising trend of SO2/NO2 in the Western Sichuan Plateau ecological area and the declining trend in the economic area indicates that the energy consumption structure of these two areas is quite different. The rising trend of the ecological area indicates that industrial SO2 emission of in the area have increased in the past 11 years compared with NOx emissions from transportation. However, the declining trend of SO2/NO2 in the economic zone in the past decade is similar to that of some large and medium-sized cities in eastern China, indicating that the SO2 emission reduction effect in this region was relatively obvious, while the NOx emission reduction effect was not significant. It is worth noting that China’s 11th Five-Year Plan (2011–2015) put forward specific SO2 and NOx emission reduction targets, since SO2/NO2 in most Chinese cities showed a declining trend, and SO2/NO2 in the ecological zone of Western Sichuan Plateau, which is cleaner than the large and medium-sized cities, showed an increasing trend. This suggests that the SO2 pollution level in clean areas is relatively light, but its growth trend cannot be ignored.
Due to the lack of emissions data of SO2 and NOx in the ecological and economic zones of Western Sichuan Plateau, the energy consumption of unit added industrial value and the passenger and freight turnover of highways were selected to indirectly characterize the emission change characteristics of SO2 and NOx, respectively. As can be seen from Figure 6a, from 2008 to 2016, the energy consumption of unit added industrial value in Aba first increased and then decreased, while other regions showed a significant downward trend, indicating that industrial consumption of standard coal equivalent (SCE) in other regions except Aba declined year by year. Compared with the change characteristics of SO2 concentration from 2008 to 2018 (Figure 3), it was found that the variations of SO2 are not consistent with industrial emissions, indicating that in these relatively clean areas, other sources besides industrial emissions will also contribute significantly to SO2; for instance, biomass combustion in Qinghai Plateau [32] makes an important contribution to SO2. The passenger and freight turnover of highways (Figure 6b) shows an overall upward trend, first increasing and then decreasing before and after 2013, which is close to the changing trend of NO2 concentration (Figure 3), indicating that motor vehicle emissions made a prominent contribution to the change in NO2 concentration.

3.2. Effects of Meteorology on SO2, NO2 and O3

Emissions and meteorological conditions are predominant in the air pollutant trend; emissions exceeding atmospheric environmental capacity is the basic cause of air pollution [33,34]. In order to analyze the influence of meteorological factors on gaseous air pollutants in the ecological and economic zones of Western Sichuan Plateau, the relationships between SO2, NO2, O3, and routine meteorological parameters (mean monthly average temperature, maximum and minimum monthly average temperature, mean relative humidity, monthly total precipitation, monthly sunshine duration, mean wind speed, and maximum wind speed) were discussed by using monthly mean meteorological data from 2008 to 2017. Figure 7 shows these relationships in Aba, in the ecological zone. SO2 and NO2 concentrations were less dependent on meteorological parameters in the ecological zone with less anthropogenic emission. The relationship between O3 and meteorological parameters in Figure 7 implies that a high concentration of O3 was more likely to form under the meteorological conditions of high temperature, low relative humidity, long sunshine duration, and especially high wind speed.
The relationships of SO2, NO2, O3, and meteorological parameters in Panzhihua of the economic zone of Western Sichuan Plateau are shown in Figure 8. In the economic zone, with more man–made emissions than the ecological zone, gaseous pollutants are more significantly affected by meteorological parameters with a higher coefficient of determination. SO2 and NO2 decreased with increased temperature, humidity, precipitation, and wind speed. O3 was positively correlated with temperature, sunshine duration, and wind speed and negatively correlated with relative humidity. The dependence of gaseous pollutants on meteorological factors was more prominent in the economic zone than in the ecological zone, which may have to do with local emissions and special topography [21].

3.3. Characteristics of SO2, NO2, and O3

Figure 9 shows the multi-year average mass concentrations of SO2, NO2, and O3 in the Western Sichuan Plateau ecological and economic zones. The average mass concentrations of O3 in Aba, Ganzi, Liangshan, and Panzhihua were significantly higher than that of SO2 and NO2. Liangshan suffered the most serious O3 pollution of the four regions, with a mean mass concentration of 96.25 ± 28.17 μg·m−3, followed by Panzhihua, 83.96 ± 29.17 μg·m−3. O3 pollution in the ecological region, at higher altitude, was lighter than in the economic zone, with mean mass concentrations of 79.99 ± 23.41 μg·m−3 and 72.61 ± 28.28 μg·m−3, respectively, in Aba and Ganzi. The mean mass concentrations of SO2 and NO2 in the ecological zone were lower than in the economic zone. The mean mass concentration of SO2 in Aba and Ganzi was similar, at 12.39 ± 8.31 μg·m−3 and 15.02 ± 8.51 μg·m−3, respectively, and in Panzhihua, it was significantly higher than in Liangshan, at 60.05 ± 35.25 μg·m−3 and 32.73 ± 18.02 μg·m−3, respectively. Among the four regions, Panzhihua has the most serious SO2 pollution, and Aba has the least, the multi-year average concentration of SO2 in Panzhihua is about five times that in Aba. For NO2, the average mass concentration was highest in Panzhihua, at 37.81 ± 11.98 μg·m−3 and lowest in Aba, at 14.37 ± 7.07 μg·m−3. The level of NO2 pollution in Ganzi and Liangshan was moderate, and the average concentration of NO2 was similar, 24.99±11.59 μg·m−3 and 23.9 ± 7.17 μg·m−3, respectively. Zhao et al. [21] analyzed the characteristics of six criteria for air pollutants in the Sichuan basin in 2015–2017, and showed that the average SO2 concentration in Chengdu, the provincial city, was close to that in the ecological zone due to effective desulfurization measures and strict SO2 emission reduction requirements, while the average NO2 and O3 concentration in Chengdu was significantly higher than that in the ecological and economic zones in this study.
Figure 10 shows the seasonal average mass concentrations of SO2, NO2, and O3 in the ecological and economic zones of Western Sichuan Plateau. The seasonal variation of O3 is more notable than that of SO2 or NO2. The seasonal distribution of O3 in Aba and Liangshan is similar, with the highest concentration in spring and the lowest in autumn, presenting a seasonal distribution as spring > summer > winter > autumn. The average concentration of O3 in Aba was 99.8 ± 21.54 μg·m−3 and 64.83 ± 12.95 μg·m−3, and that in Liangshan was 119.64 ± 22.47 μg·m−3 and 76.42 ± 20.63 μg·m−3 in spring and autumn, respectively. The seasonal distribution of O3 in Ganzi was summer > autumn > spring > winter, with an average concentration of 83.67 ± 31.85 μg·m−3 in summer and 64.94 ± 24.14 μg·m−3 in winter. The concentration of O3 in Panzhihua reached its highest in spring 107.64 ± 19.97 μg·m−3, and its lowest in winter, 64.61 ± 19.2 μg·m−3, indicating a seasonal distribution of spring > summer > autumn > winter.
The average concentration of SO2 in Ganzi and Liangshan was the same, with a seasonal distribution of winter > autumn > spring > summer. The average concentration was 17.4 ± 9.7 μg·m−3 and 13.94 ± 7.28 μg·m−3 in Ganzi and was 38.46 ± 21.88 μg·m−3 and 28.87 ± 15.15 μg·m−3 in Liangshan in winter and summer, respectively. The maximum concentration of SO2 in Aba occurred in winter, while the minimum concentration occurred in autumn, at 13.84 ± 9.74 μg·m−3 and 11.24 ± 7.38 μg·m−3; the seasonal distribution was winter > spring > summer > autumn. The mean concentration of SO2 in Panzhihua was the highest in winter, 75.44 ± 45.67 μg·m−3, and the lowest in spring 49.99 ± 25.32 μg·m−3.
Ganzi, Liangshan, and Panzhihua had the same NO2 seasonal distribution of winter > autumn > spring > summer. The difference in NO2 mean concentration in Ganzi and Liangshan between the four seasons was not significant; the maximum and minimum concentrations in Ganzi were 27.16 ± 13.5 μg·m−3 and 22.66 ± 8.68 μg·m−3, respectively, and the difference between winter and summer was about 4.5 μg·m−3. The maximum and minimum NO2 mean concentrations in Liangshan were 27.72 ± 8.93 μg·m−3 and 21.37 ± 5.31 μg·m−3, respectively, and the difference in concentration between winter and summer was about 6.3 μg·m−3. The average concentration of NO2 in Panzhihua in the four seasons was significantly different; the maximum concentration was 47.14 ± 11.88 μg·m−3 in winter, the minimum concentration was 30.89 ± 8.13 μg·m−3 in summer, and the difference was about 16.2 μg·m−3. The seasonal distribution of NO2 in Aba was different from the other regions, with an average concentration of 15.39 ± 7.57 μg·m−3 in spring and the lowest concentration of 12.71 ± 6.19 μg·m−3 in autumn.
Figure 11 shows the monthly distribution characteristics of the three pollutants. High concentrations of O3 in Ganzi appeared in July, August, and September, and in Aba, Liangshan, and Panzhihua in March, April, and May. The maximum O3 concentration in Ganzi was 94.63 ± 29.89 μg·m−3 in August, and the minimum was 56.05 ± 22.94 μg·m−3 in January. The maximum and minimum concentrations of O3 in Aba occurred in April and September, respectively, at 103.46 ± 22.15 μg·m−3 and 62.16 ± 16.47 μg·m−3. The maximum concentration of O3 in Liangshan occurred in May at 123.40 ± 25.3 μg·m−3 and the minimum concentration of 72.49 ± 21.66 μg·m−3 in September. The maximum and minimum concentrations of O3 in Panzhihua occurred in April and December, at 109.65 ± 20.66 μg·m−3 and 56.17 ± 16.49 μg·m−3, respectively. The differences between maximum and minimum monthly concentrations in the economic zone were significantly higher than in the ecological zone, among which the difference in Panzhihua was the largest, about 53.48 μg·m−3, and the difference in Ganzi was the smallest, about 38.5 μg·m−3, indicating that the monthly change of O3 with a longer residence time was more significant in the area with more artificial emissions than in the clean area with less artificial emissions.
The monthly mean concentrations of SO2 in the ecological zone did not change significantly. The maximum and minimum concentrations in Aba appeared in December and September, respectively, and the difference was about 4.76 μg·m−3, while the maximum and minimum concentrations in Ganzi appeared in December and June, respectively, and the difference was about 4.9 μg·m−3. Artificial emissions were more prominent in the economic zone, and the monthly variations of average concentrations of SO2 were more obvious. The maximum and minimum SO2 concentration in Liangshan occurred in January and May, with a difference of 14.43 μg·m−3, and in Panzhihua occurred in January and May, respectively, at 86.01 ± 49.78 μg·m−3 and 44.96 ± 23.54 μg·m−3, with a difference of 41.05 μg·m−3. The range of variation of monthly average NO2 concentration in Aba was the lowest in the ecological and economic zones; the maximum and minimum concentrations appeared in June and September, with a difference of 6.05 μg·m−3, and the maximum and minimum concentrations in Ganzi appeared in December and February, with a difference of 9.82 μg·m−3, respectively. The monthly average NO2 concentration in Panzhihua showed the most prominent variation characteristics, with a mean maximum of 50.82 ± 12.79 μg·m−3 in January, minimum of 30.21 ± 9.79 μg·m−3 in June, and a difference of 20.61 μg·m−3. The maximum and minimum monthly average concentrations of NO2 in Liangshan occurred in December and August, respectively, with a difference of 9.01 μg·m−3.

3.4. Correlation between SO2, NO2, and O3

It is generally believed that CO and NOx pollutants are discharged by mobile sources, while SO2 and NOx pollutants are discharged by point sources [35]. Since mobile sources do not discharge a large amount of SO2 and point sources produce both SO2 and NO2, if the correlation between SO2 and NO2 is high, the point source is more prominent. On the other hand, if the correlation is low, the mobile source is more prominent. Figure 12 shows the correlation between SO2 and NO2 in Aba, Ganzi, Liangshan, and Panzhihua. SO2 and NO2 in the ecological and economic zones show a positive correlation with a significance test of 99% confidence. The correlation between SO2 and NO2 in Ganzi is the highest, with a Pearson coefficient r 0.55, followed by Panzhihua, with r = 0.47, which indicates that the emission characteristics of SO2 and NO2 in these two regions are relatively similar, SO2 and NO2 are discharged mainly from point sources and point sources contribute more to local air pollutants than mobile sources. The lowest correlation between SO2 and NO2 is found in Aba, with a correlation coefficient of 0.27, while that in Liangshan is slightly higher, with r = 0.31, indicating that the contribution of point sources to SO2 and NO2 pollution in these two areas is not very prominent. In general, although SO2 and NO2 in the ecological and economic zones were responsible less pollution than in other large and medium-sized cities in China, the emission source characteristics of SO2 and NO2 in this region were different from those of the other cities. Mao et al. [36] reported a strong positive correlation between SO2 and NO2 in Chongqing, Wuhan, and Nanjing, three metropolises along the Yangtze River, indicating the similar origins and elimination processes of SO2 and NO2.
O3 is an important secondary gaseous pollutant in the urban atmosphere, and NOx plays a very important role in its formation as the main precursor. The formation of surface O3 is highly dependent on solar radiation intensity, the absolute concentration of O3 and volatile organic compounds (VOCs), and the ratio of O3 to VOCs, while the local surface concentration of O3 is affected by meteorological elements, local precursor emissions, and the close and long-distance transport of O3 and precursor [37,38,39]. As shown in Figure 13a,b, the correlations between NO2 and O3 in the ecological and economic zones of Western Sichuan Plateau were analyzed by using the daily mass concentration from 2015 to 2018. The correlations between NO2 and O3 in the four regions were negatively correlated, and all of them passed the significance test of 99% confidence. Among the four regions, Ganzi has the highest Pearson correlation coefficient (−0.34), indicating that this region is where NO2 contributes the most to O3 generation as a precursor. Aba, Liangshan, and Panzhihua showed a relatively low correlation between NO2 and O3, with a Pearson correlation coefficient of −0.24, −0.22, and −0.26, respectively. The correlations between NO2 and O3 in the metropolitan areas of China, such as the Beijing–Tianjin–Hebei region, Yangtze River Delta, Pearl River Delta, and Chengdu–Chongqing city cluster [2,36,40] are significantly higher than in the ecological and economic zones of the Western Sichuan Plateau in our study, indicating that NO2 contributes more to O3 in large and medium-sized urban areas with high NO2 emissions. The contribution of local precursors of O3 can better explain the formation of O3, while in regions with less NO2 emission, O3 may be more affected by the regional background. de Souza et al. [41] also indicated that when the correlation between NO2 and O3 is high, the local precursor plays a leading contributory role, and when the correlation is low, the variation of O3 concentration is mainly affected by the O3 concentration in the regional background.

4. Conclusions

Based on daily average mass concentration data of SO2 and NO2 from 2008 to 2018 and O3 from 2015 to 2018 in Aba, Ganzi, Liangshan, and Panzhihua in Western Sichuan Plateau, the characteristics and change trend of the three gas pollutants and their correlations in the relatively clean ecological and economic zones were analyzed. The main conclusions are as follows:
(1)
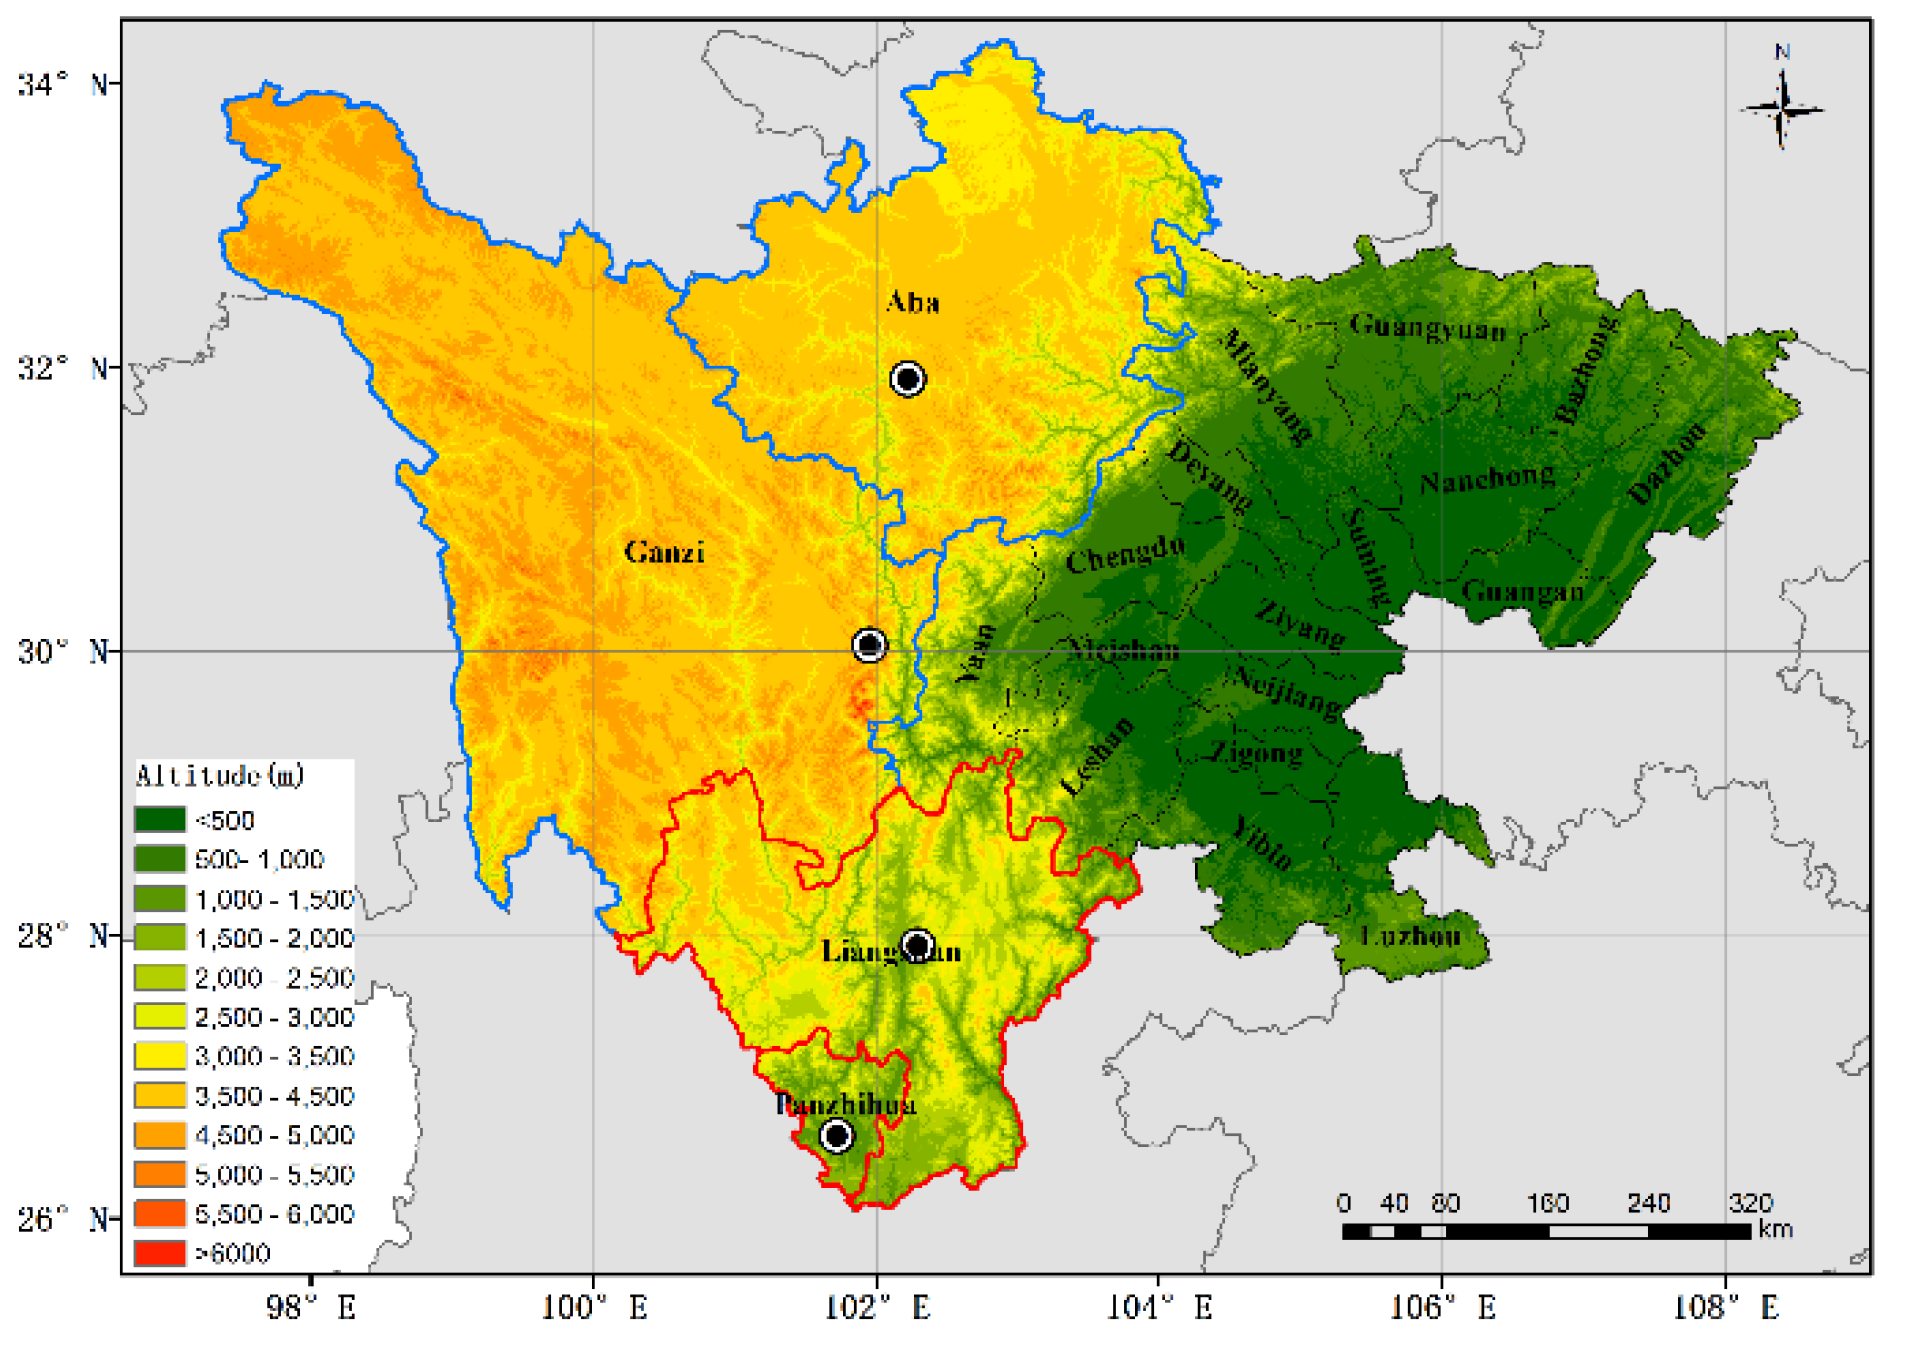
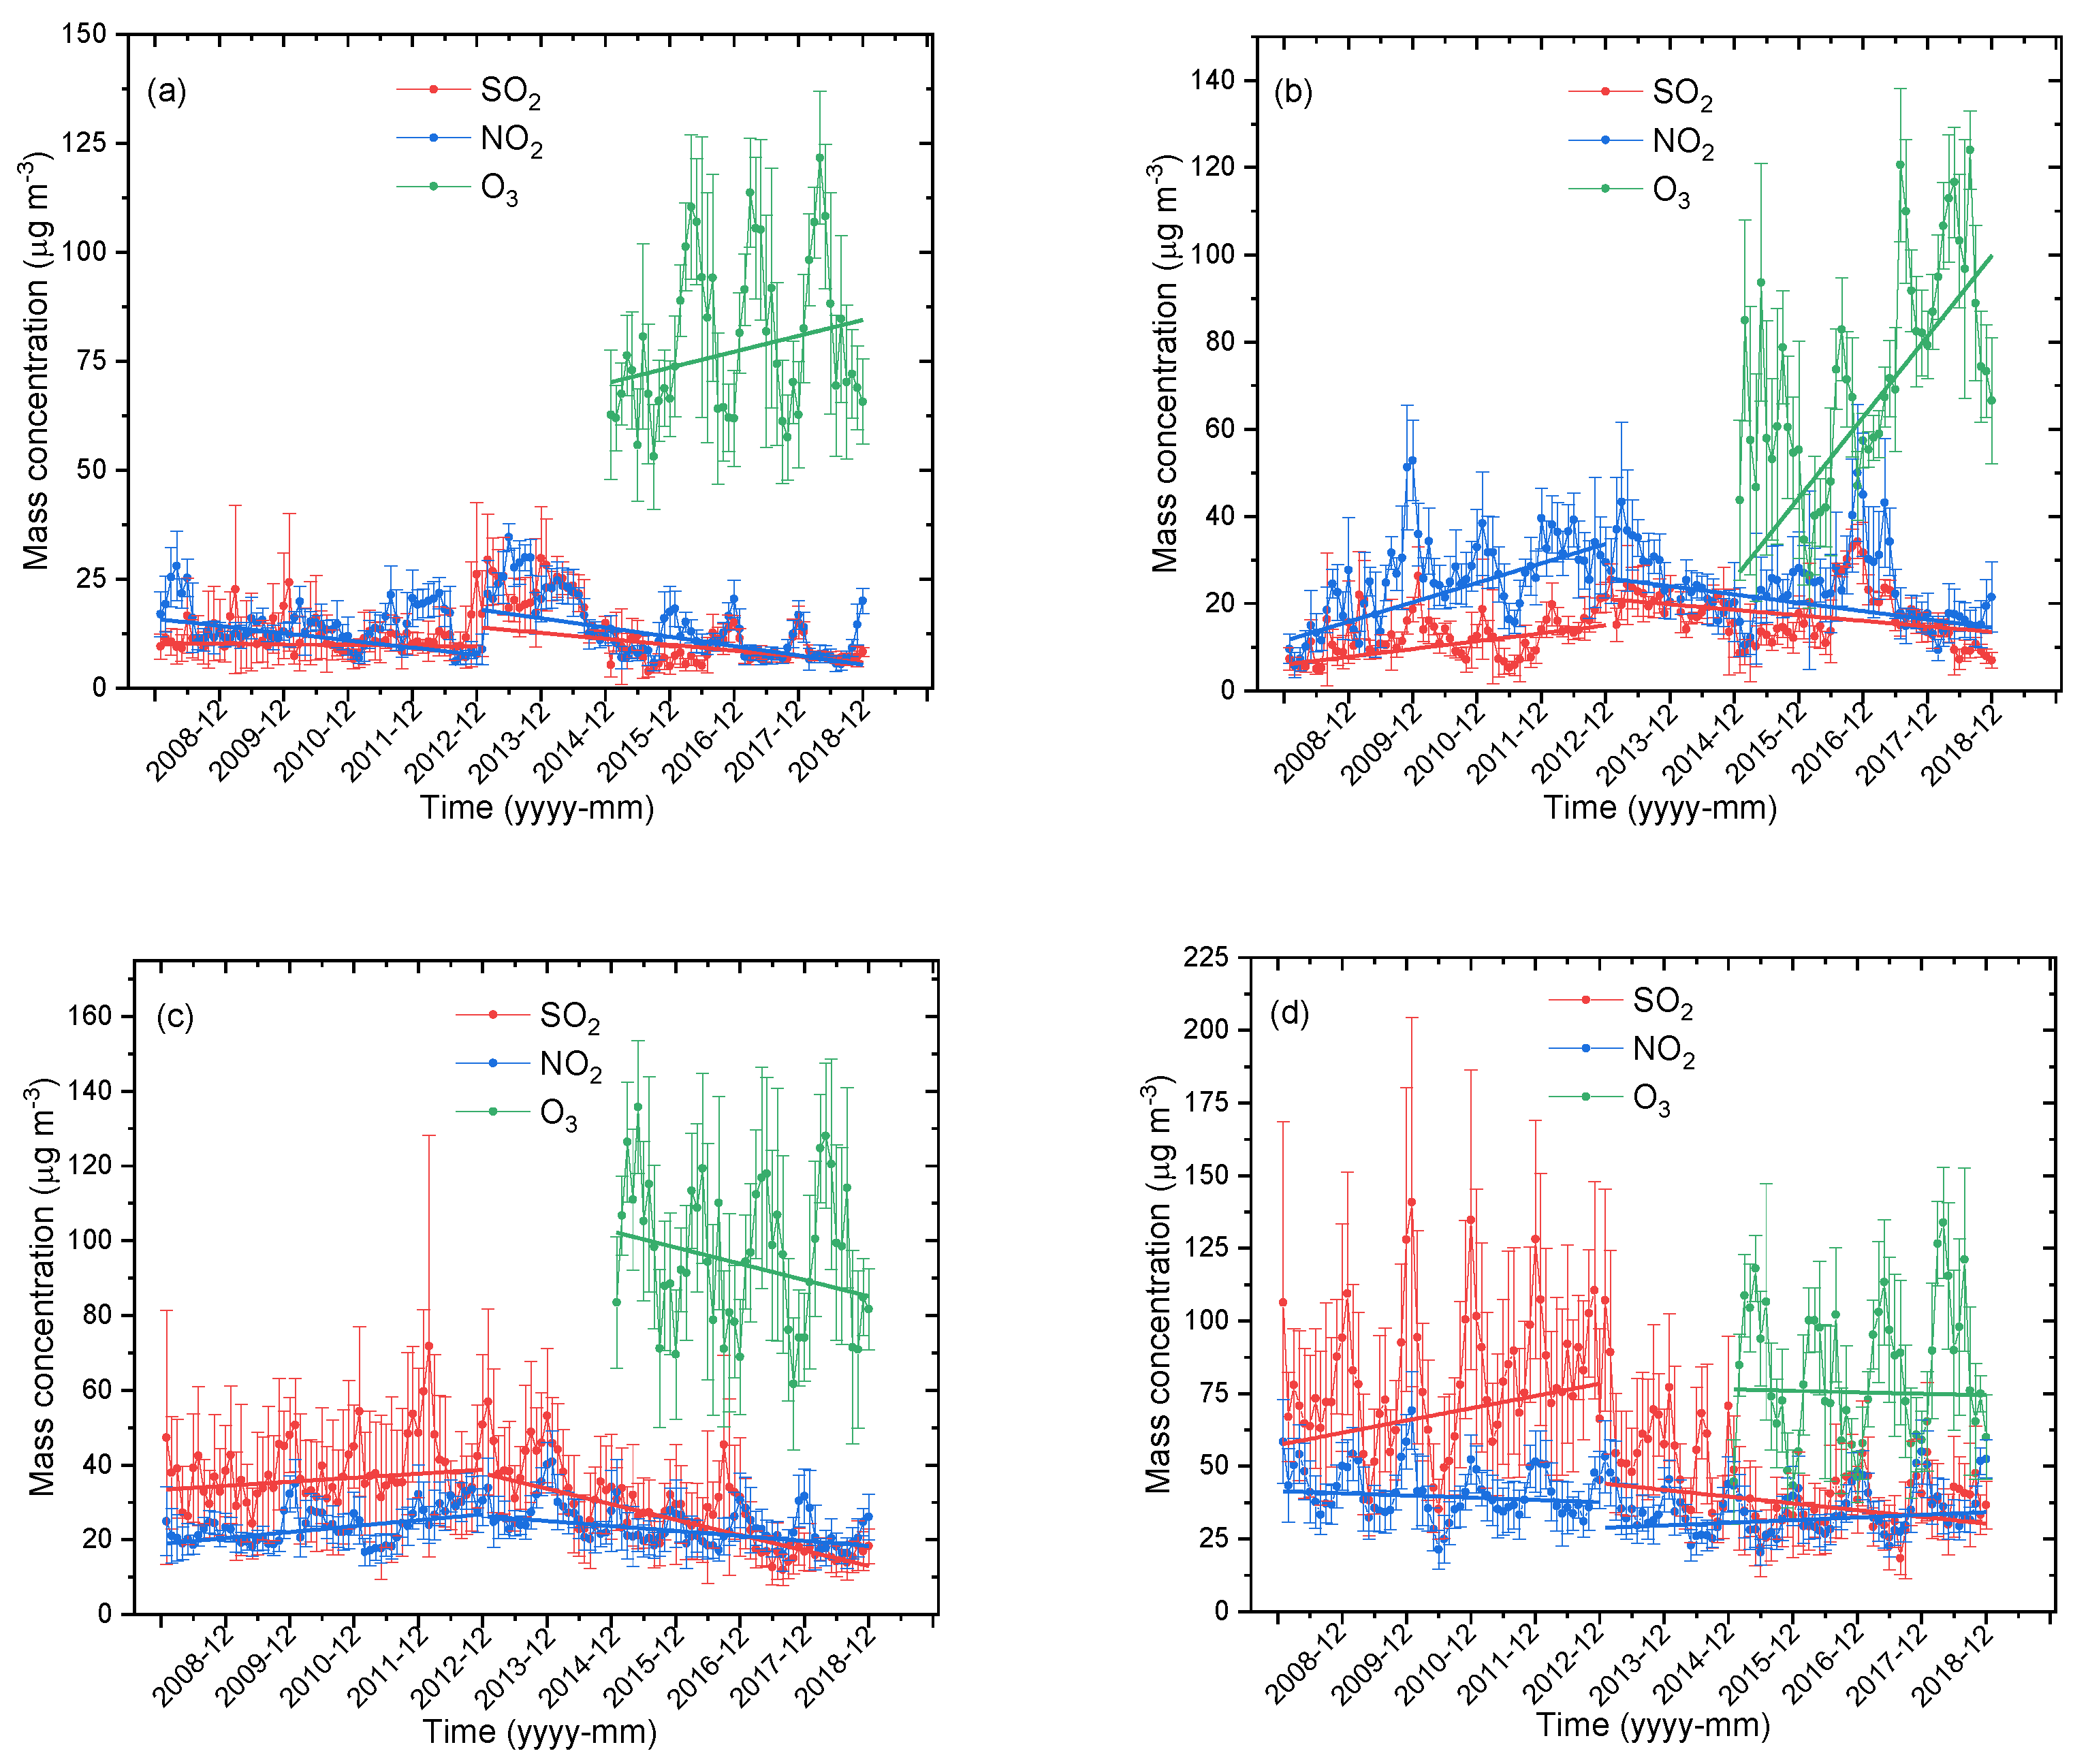
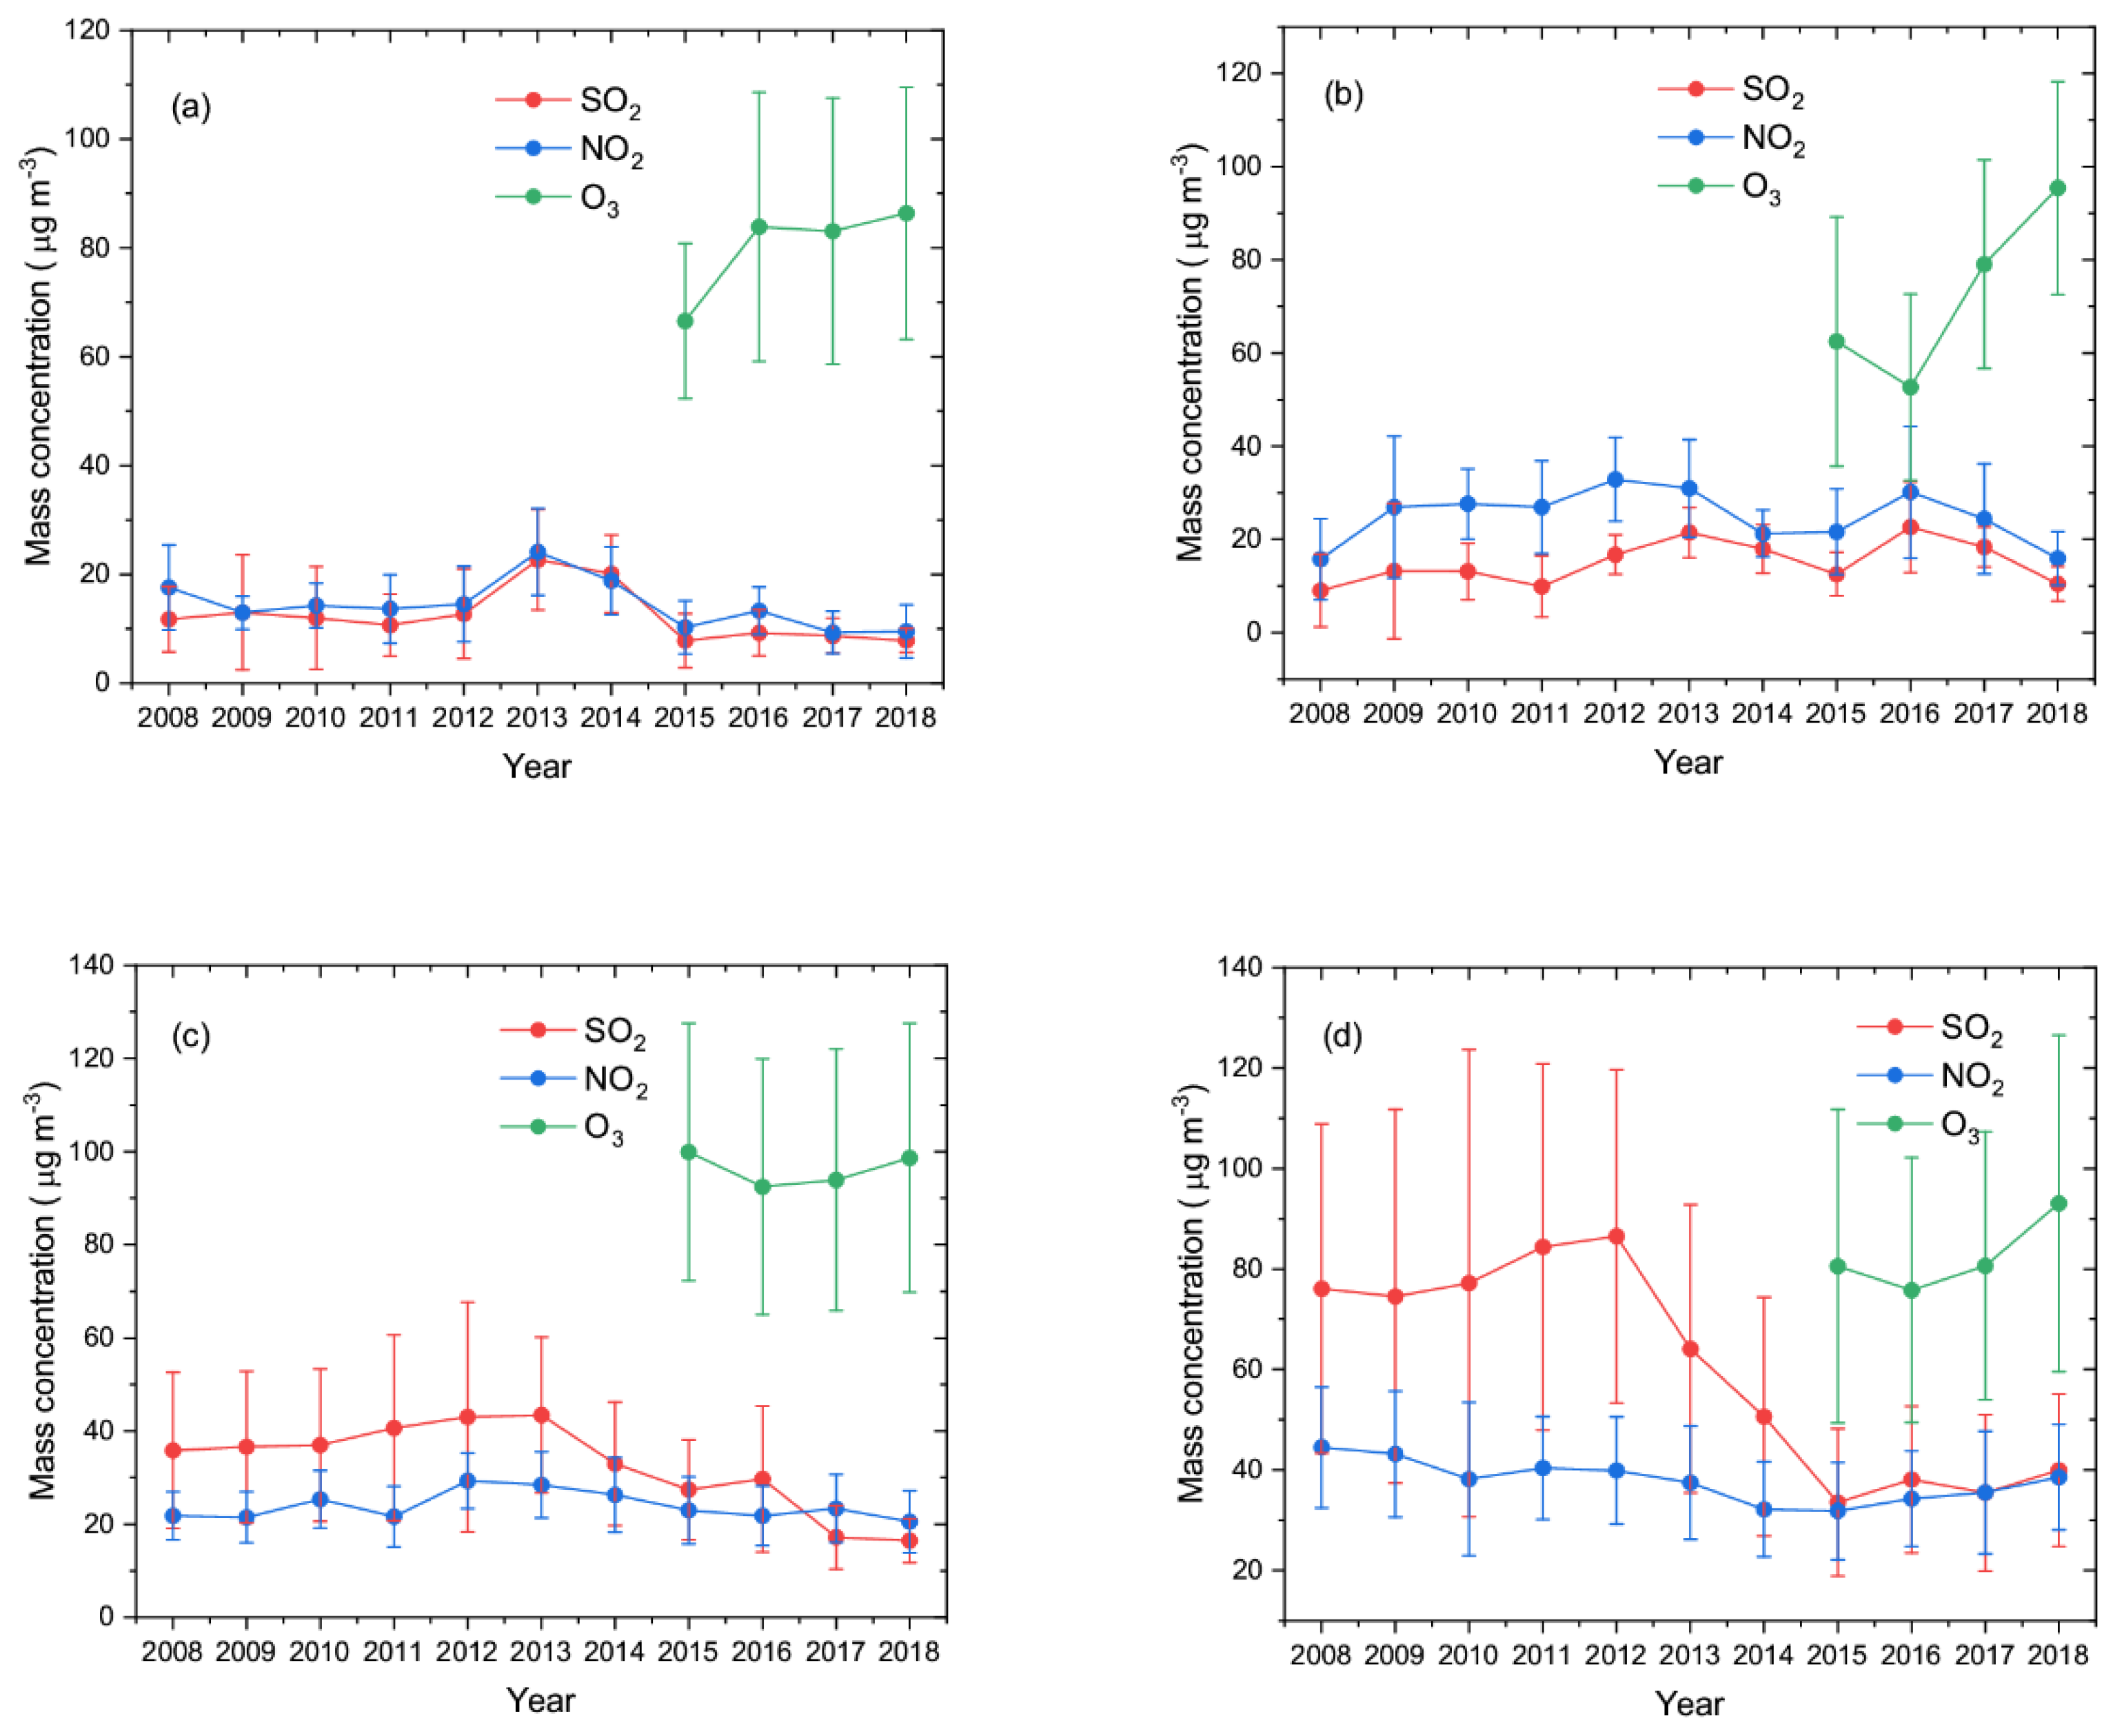
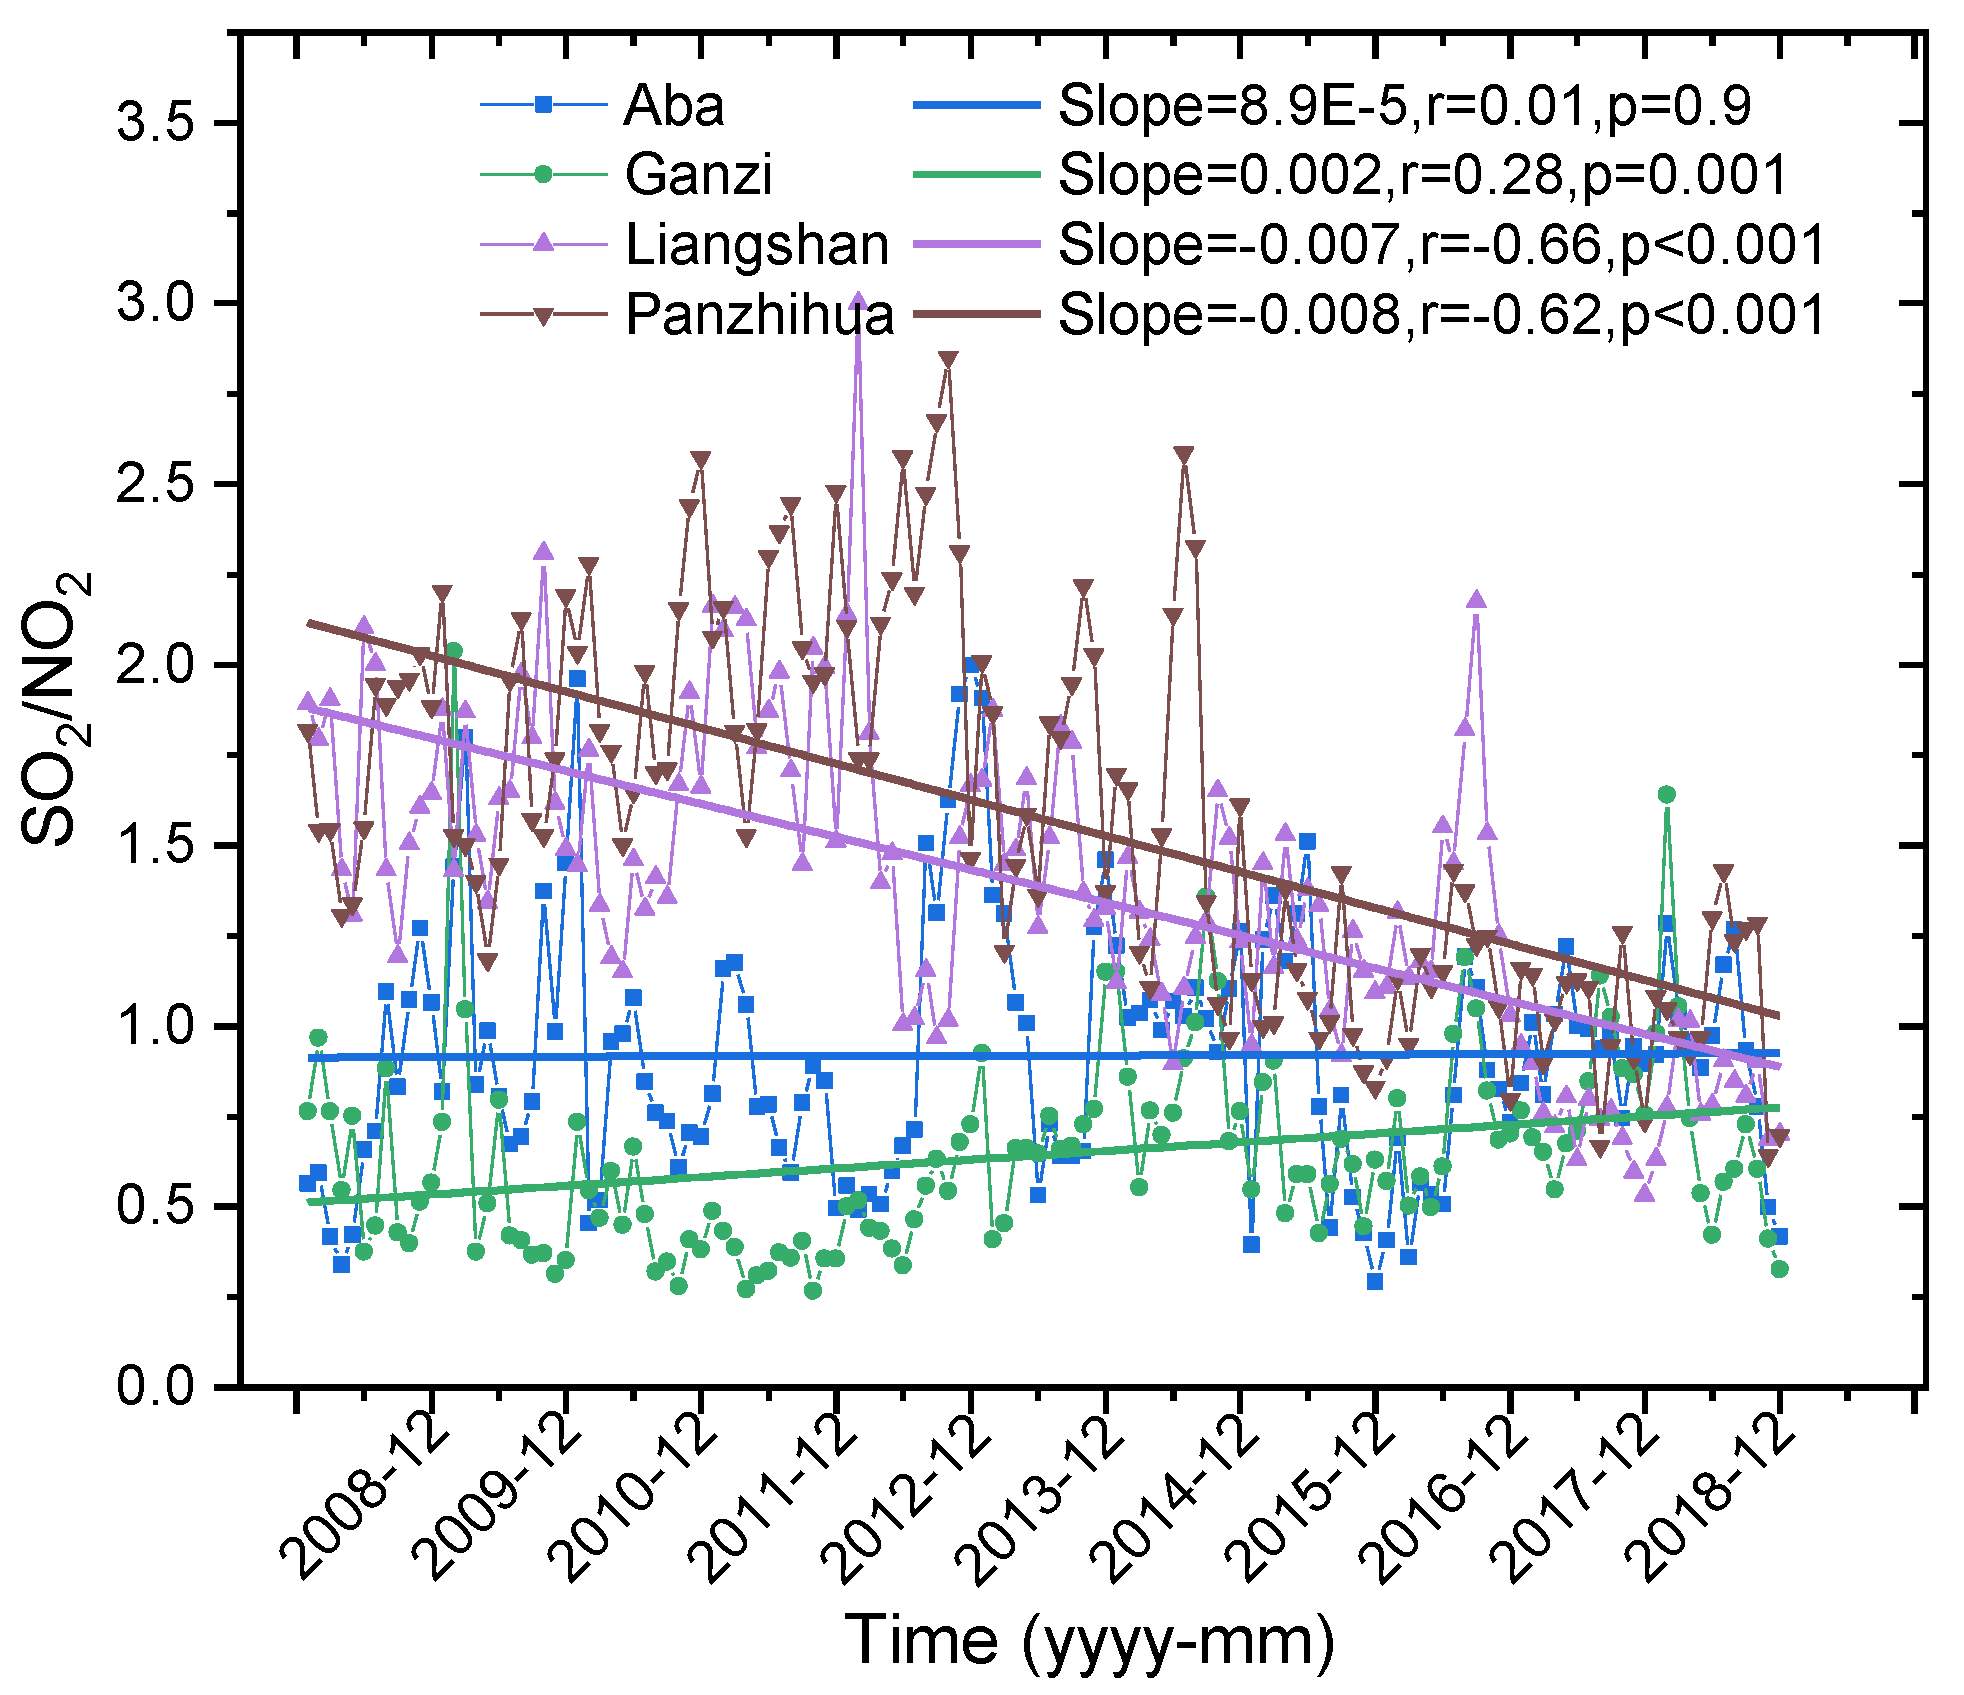
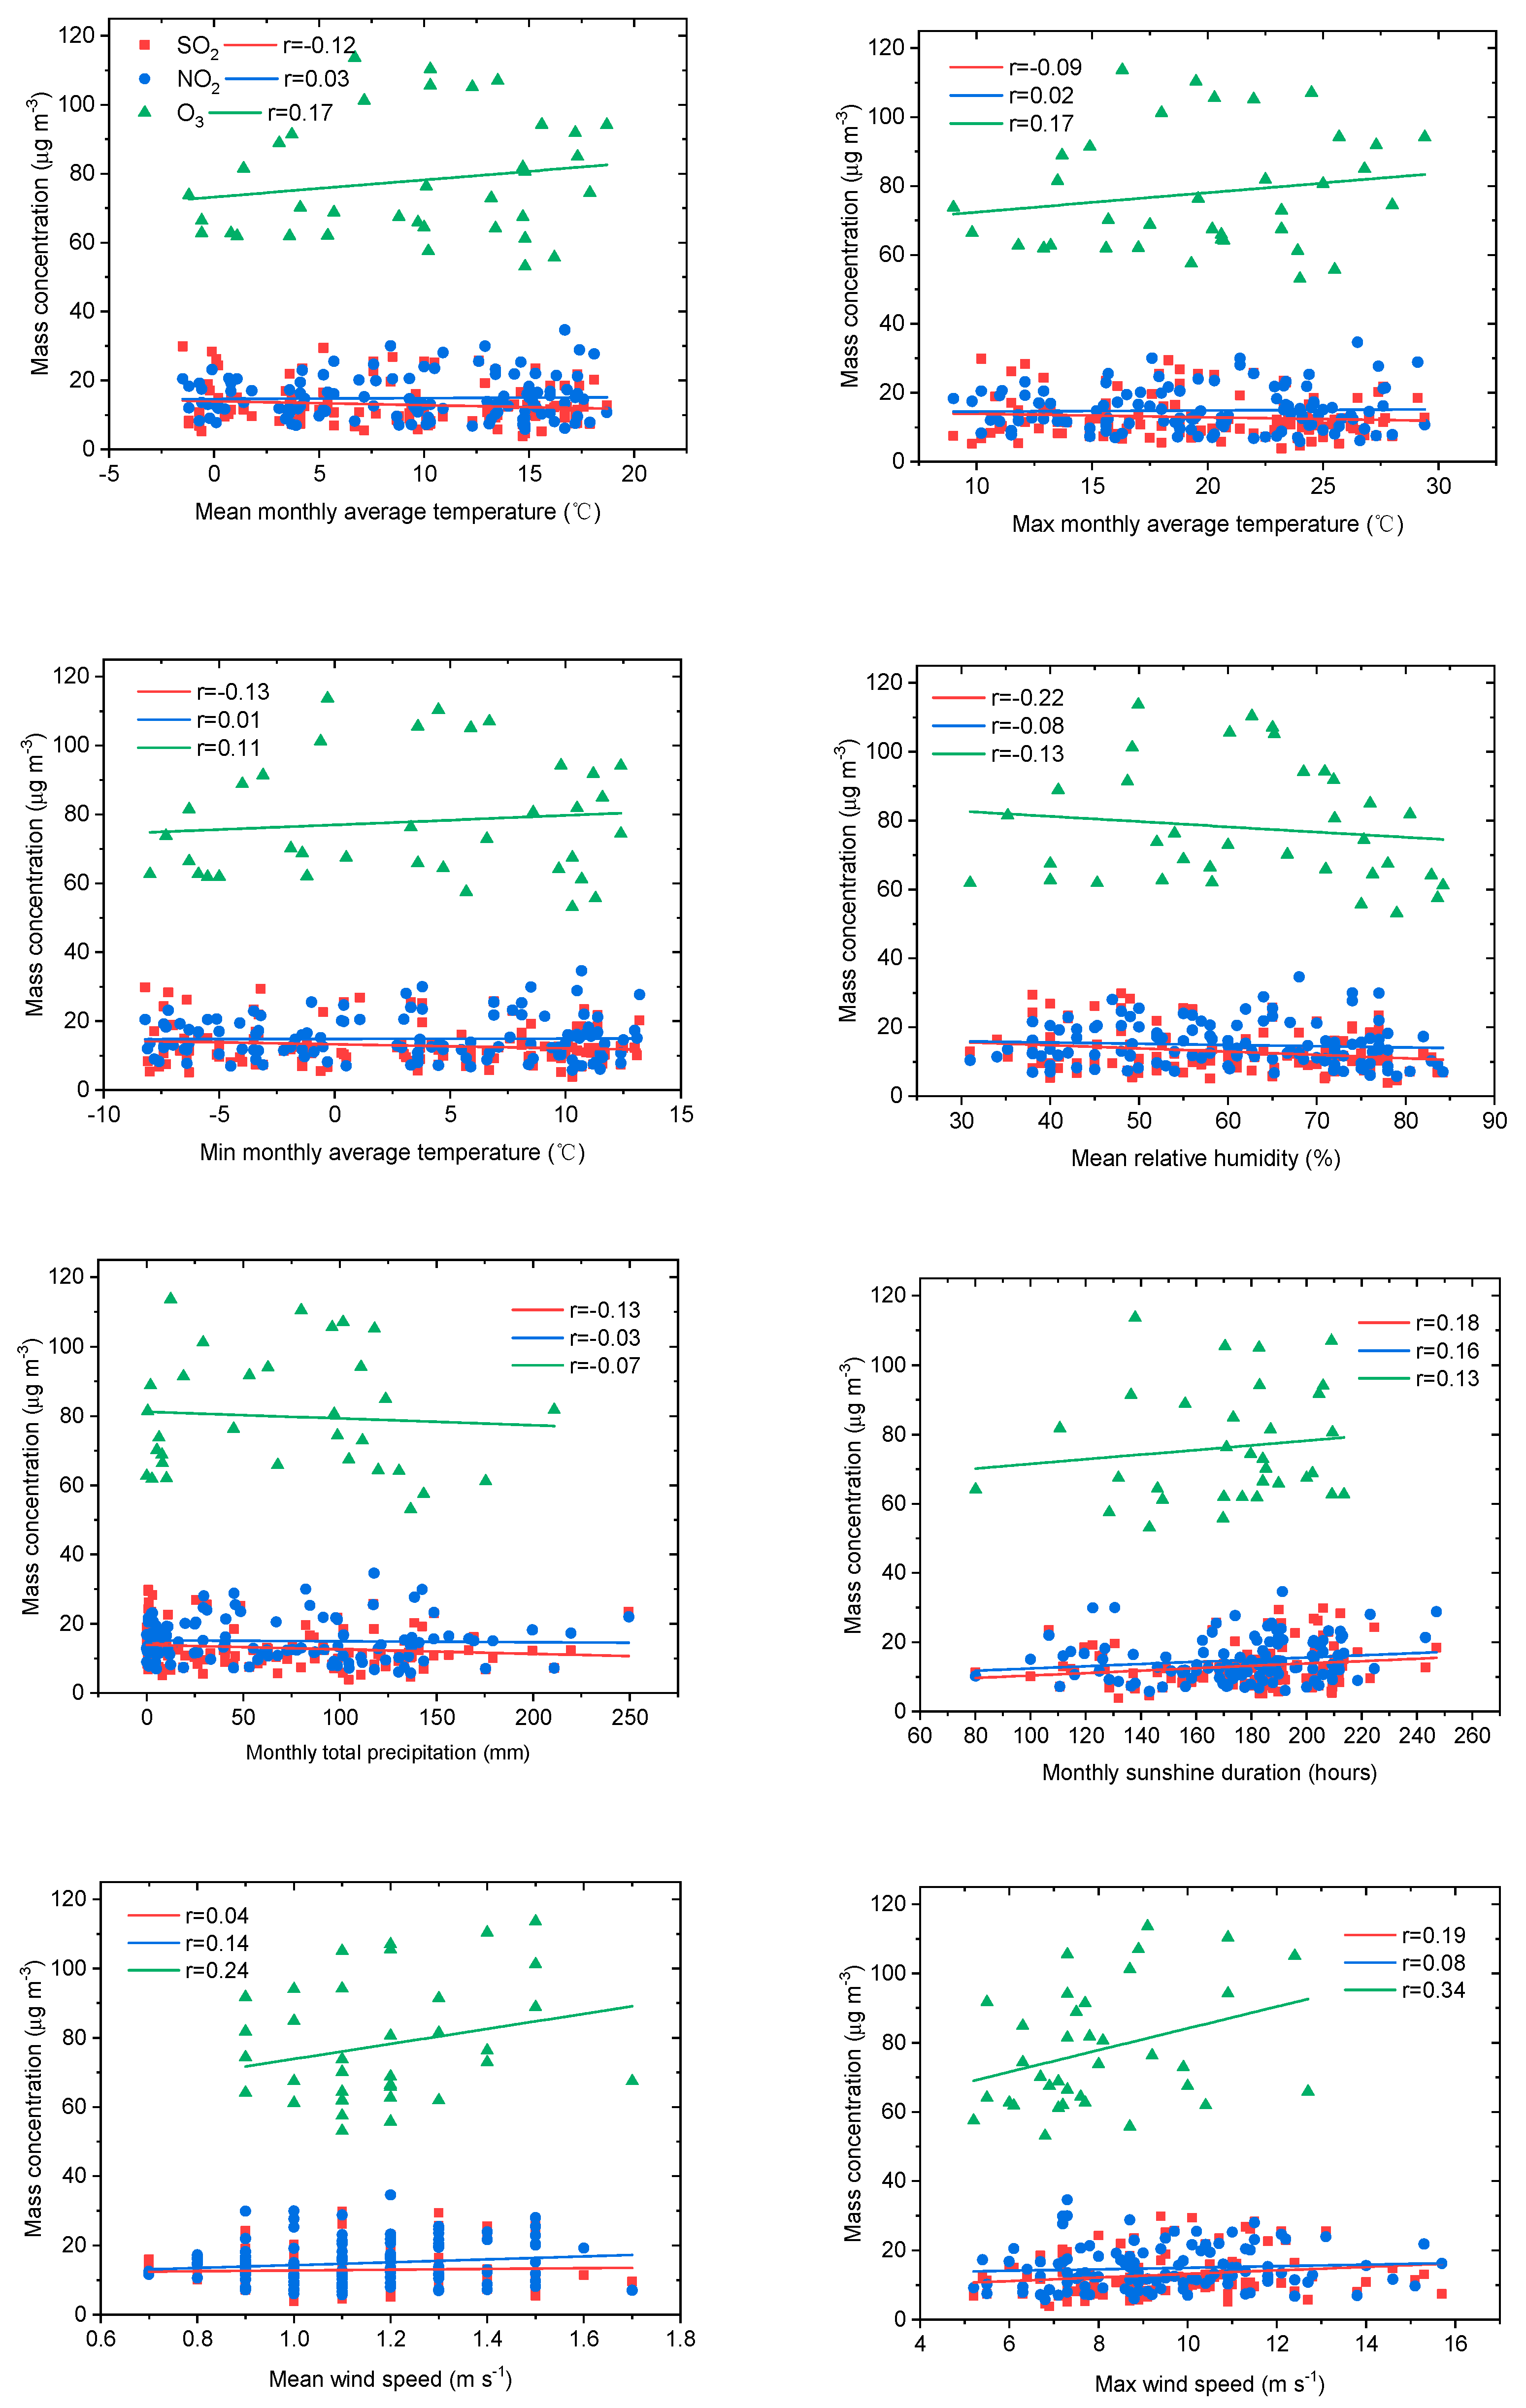
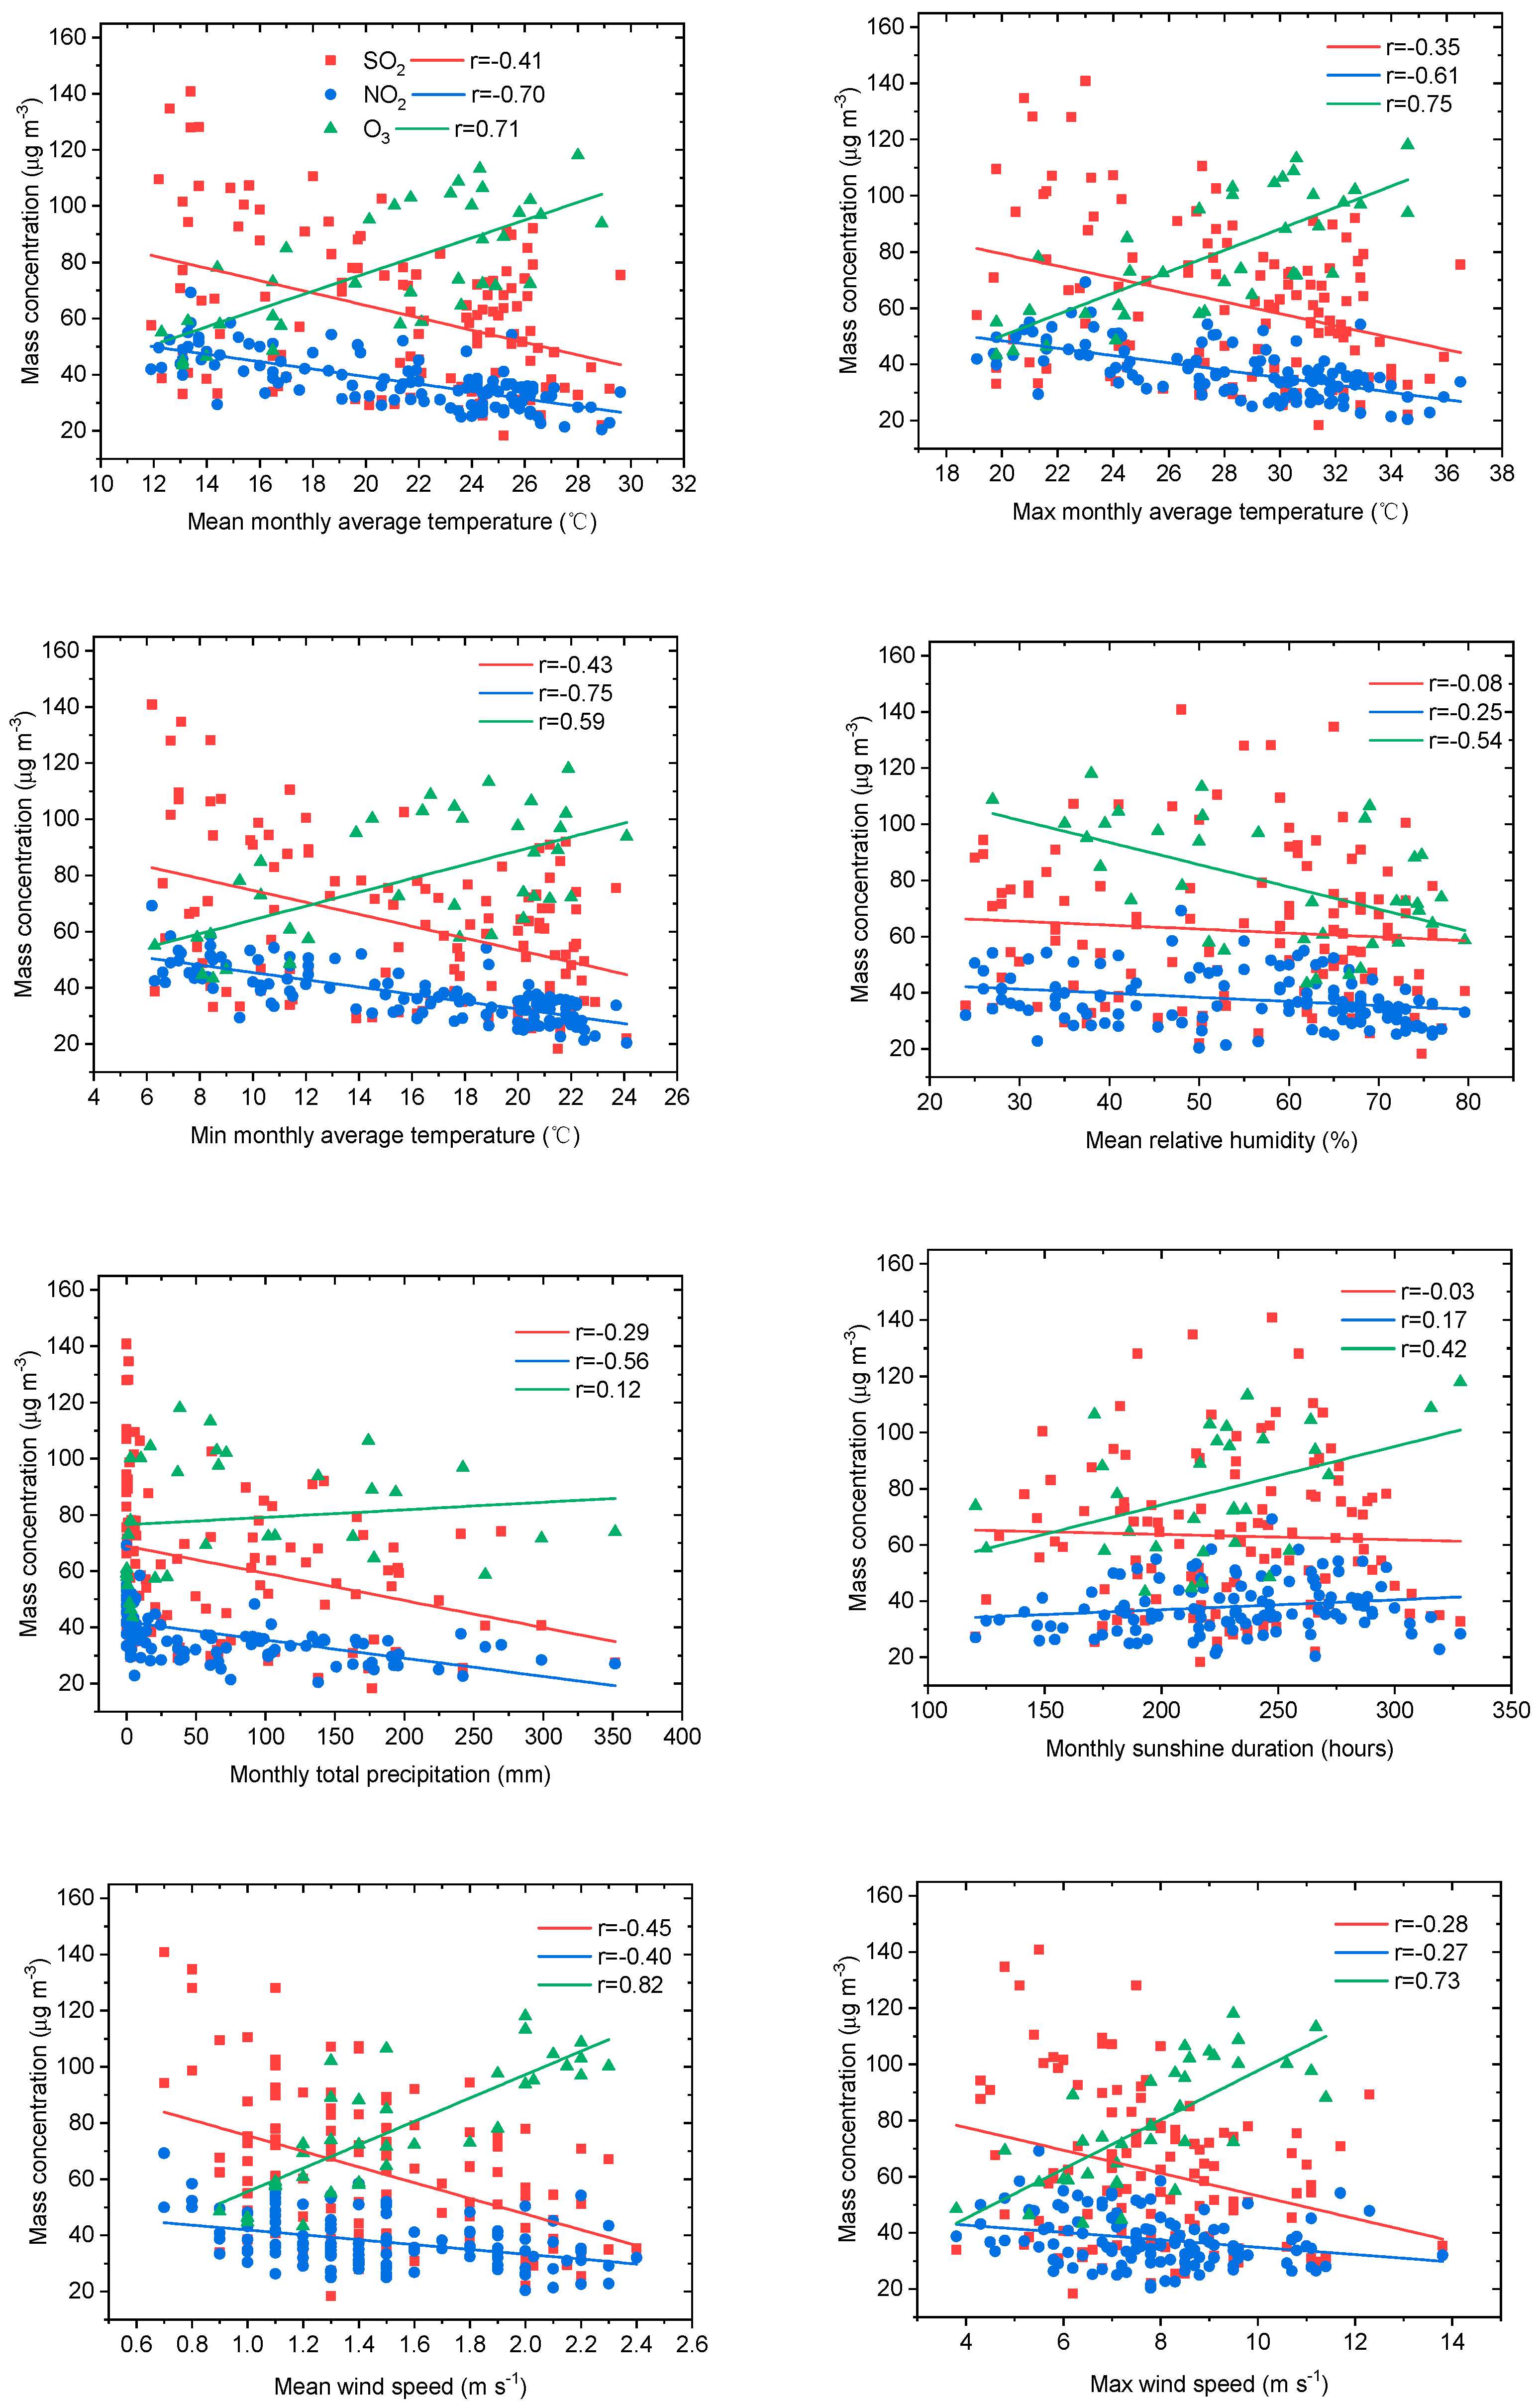
On the whole, the change ranges of SO2 and NO2 in Aba, Ganzi, and Liangshan were not large, and they all showed a trend of first increasing and then decreasing. The change range of SO2 in Panzhihua was the most obvious, and the decrease range was very significant from 2012 to 2015. During the period 2015–2018, except for Aba, O3 showed a trend of first declining and then rising in the other regions. SO2/NO2 in the economic zone of Western Sichuan Plateau showed a decreasing trend, while in the relatively clean ecological zone this ratio showed an increasing trend. Although the SO2 pollution level in the clean areas was relatively low, the growth trend could not be ignored. The dependence of SO2 and NO2 on routine meteorological parameters in the ecological zone was low. The influence of meteorological parameters on gaseous pollutants was more significant in the economic zone with high anthropometric emissions.
(2)
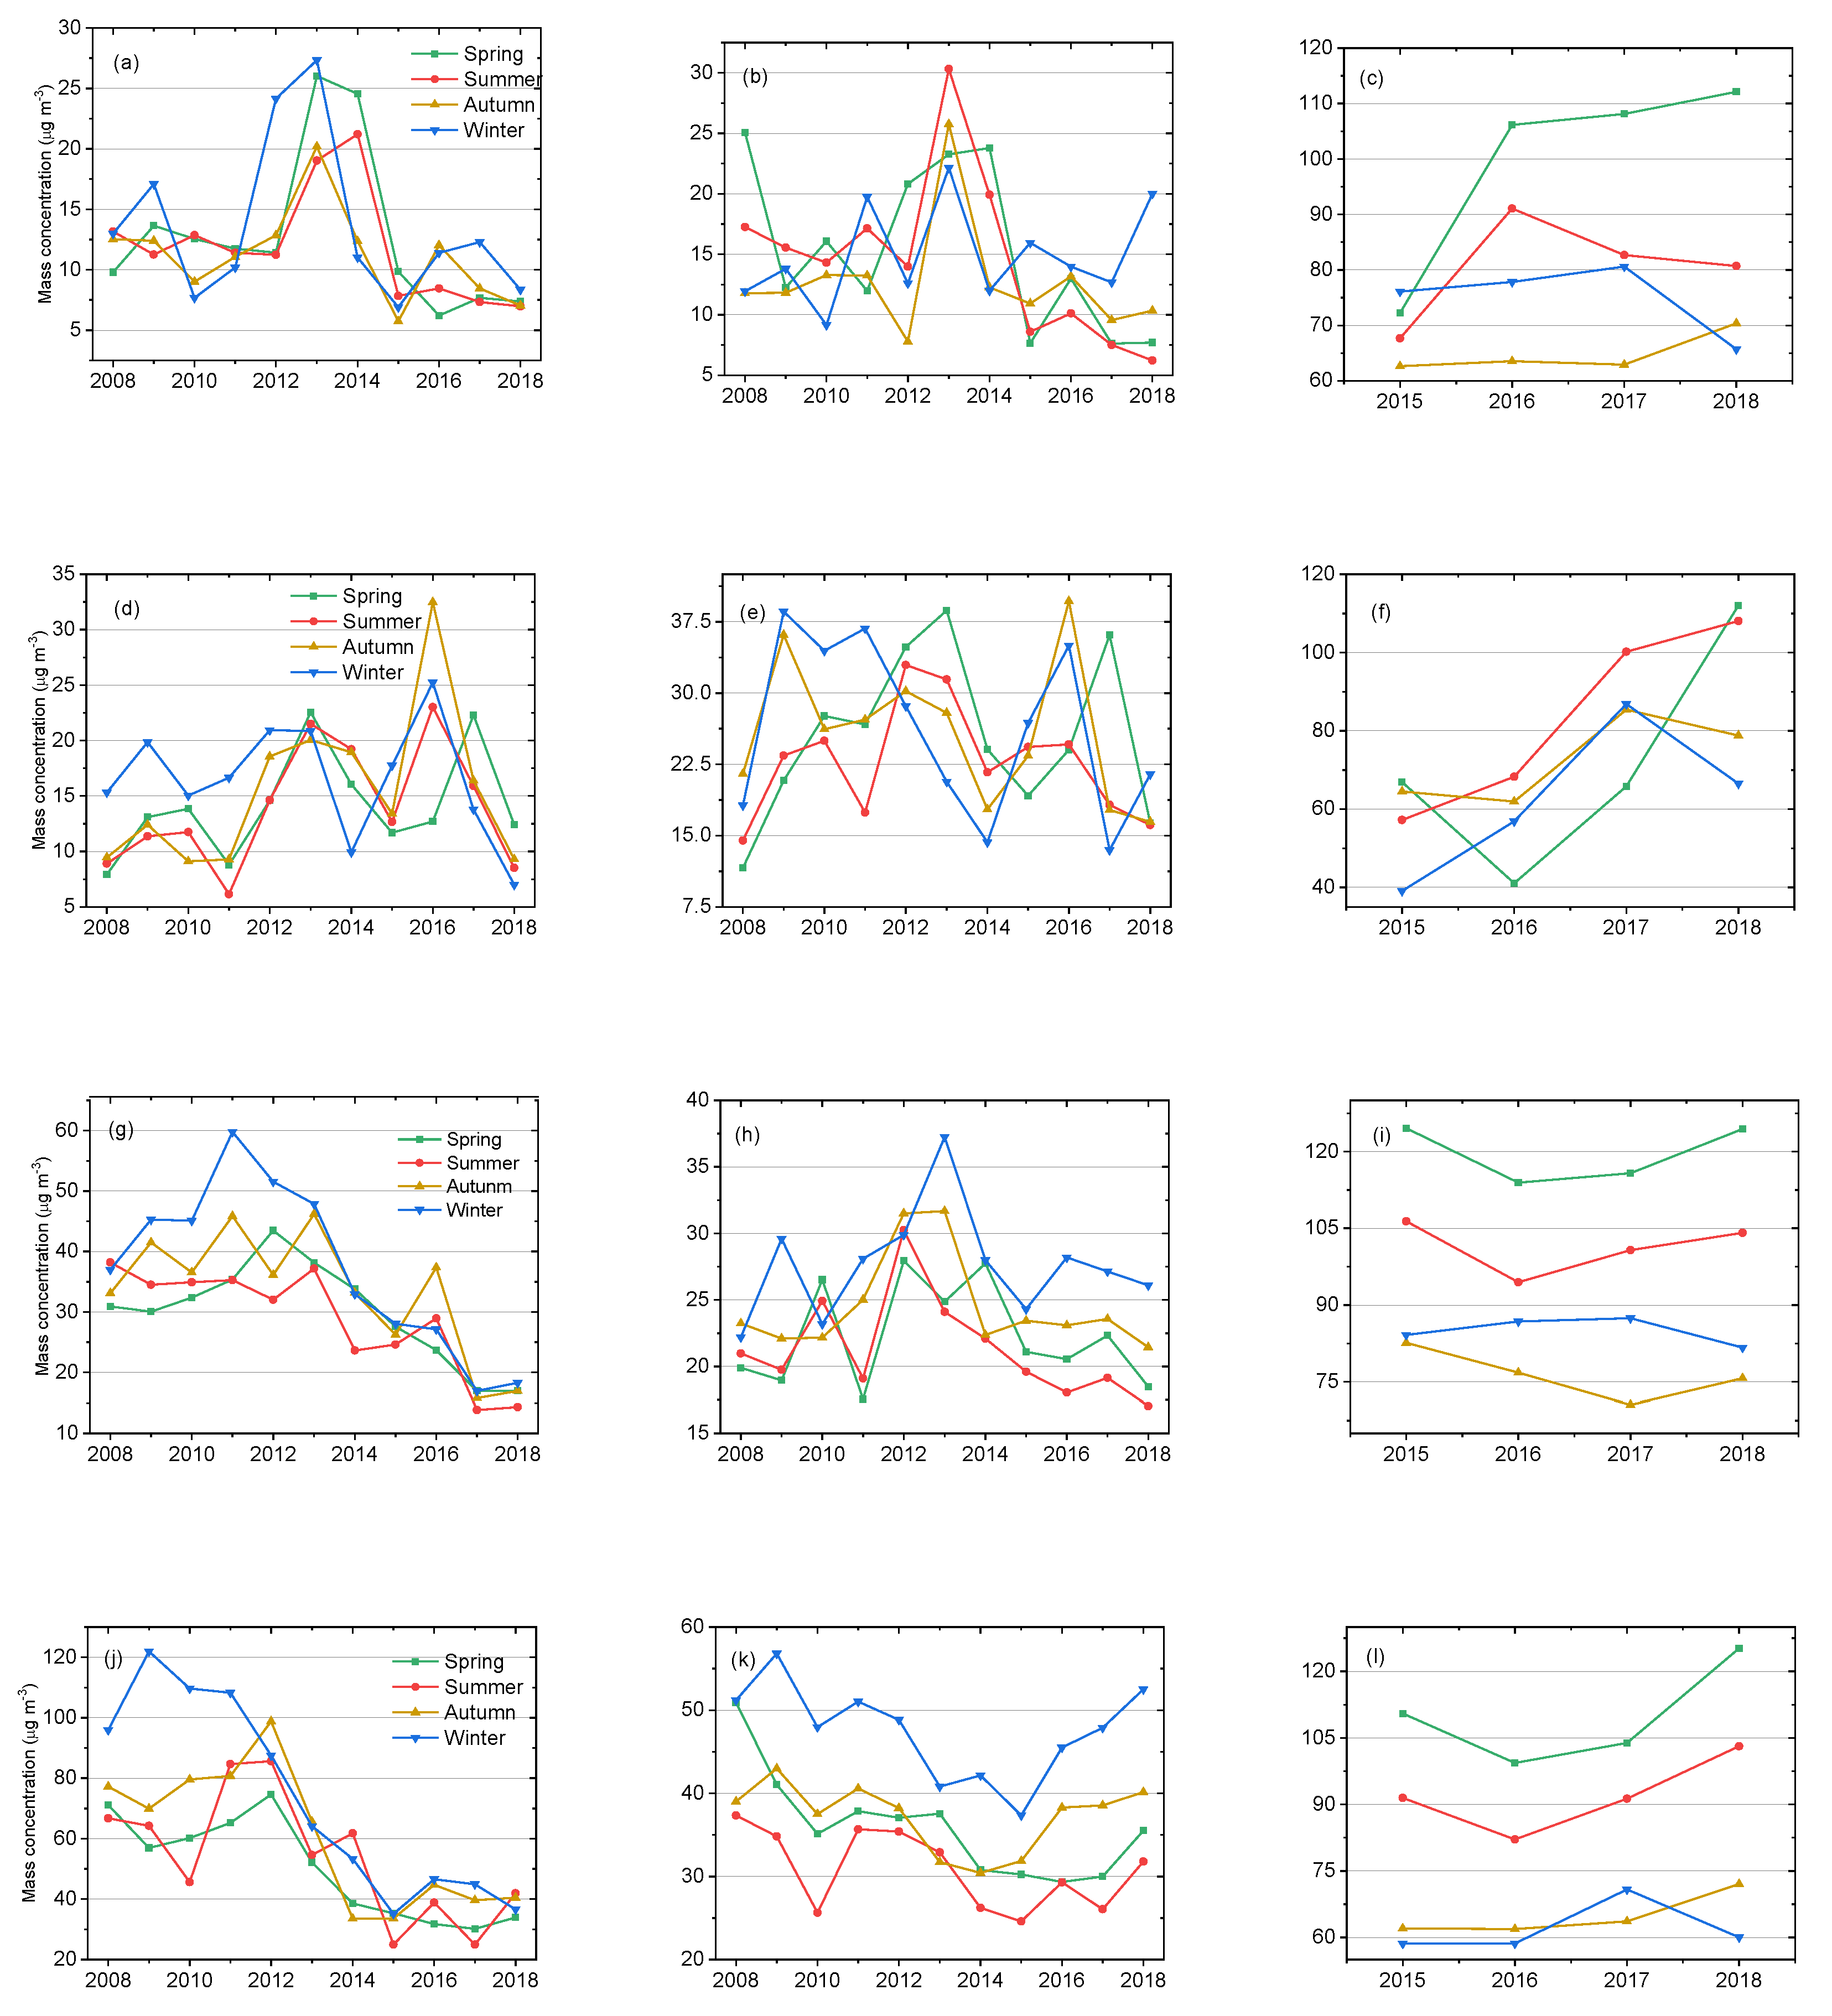
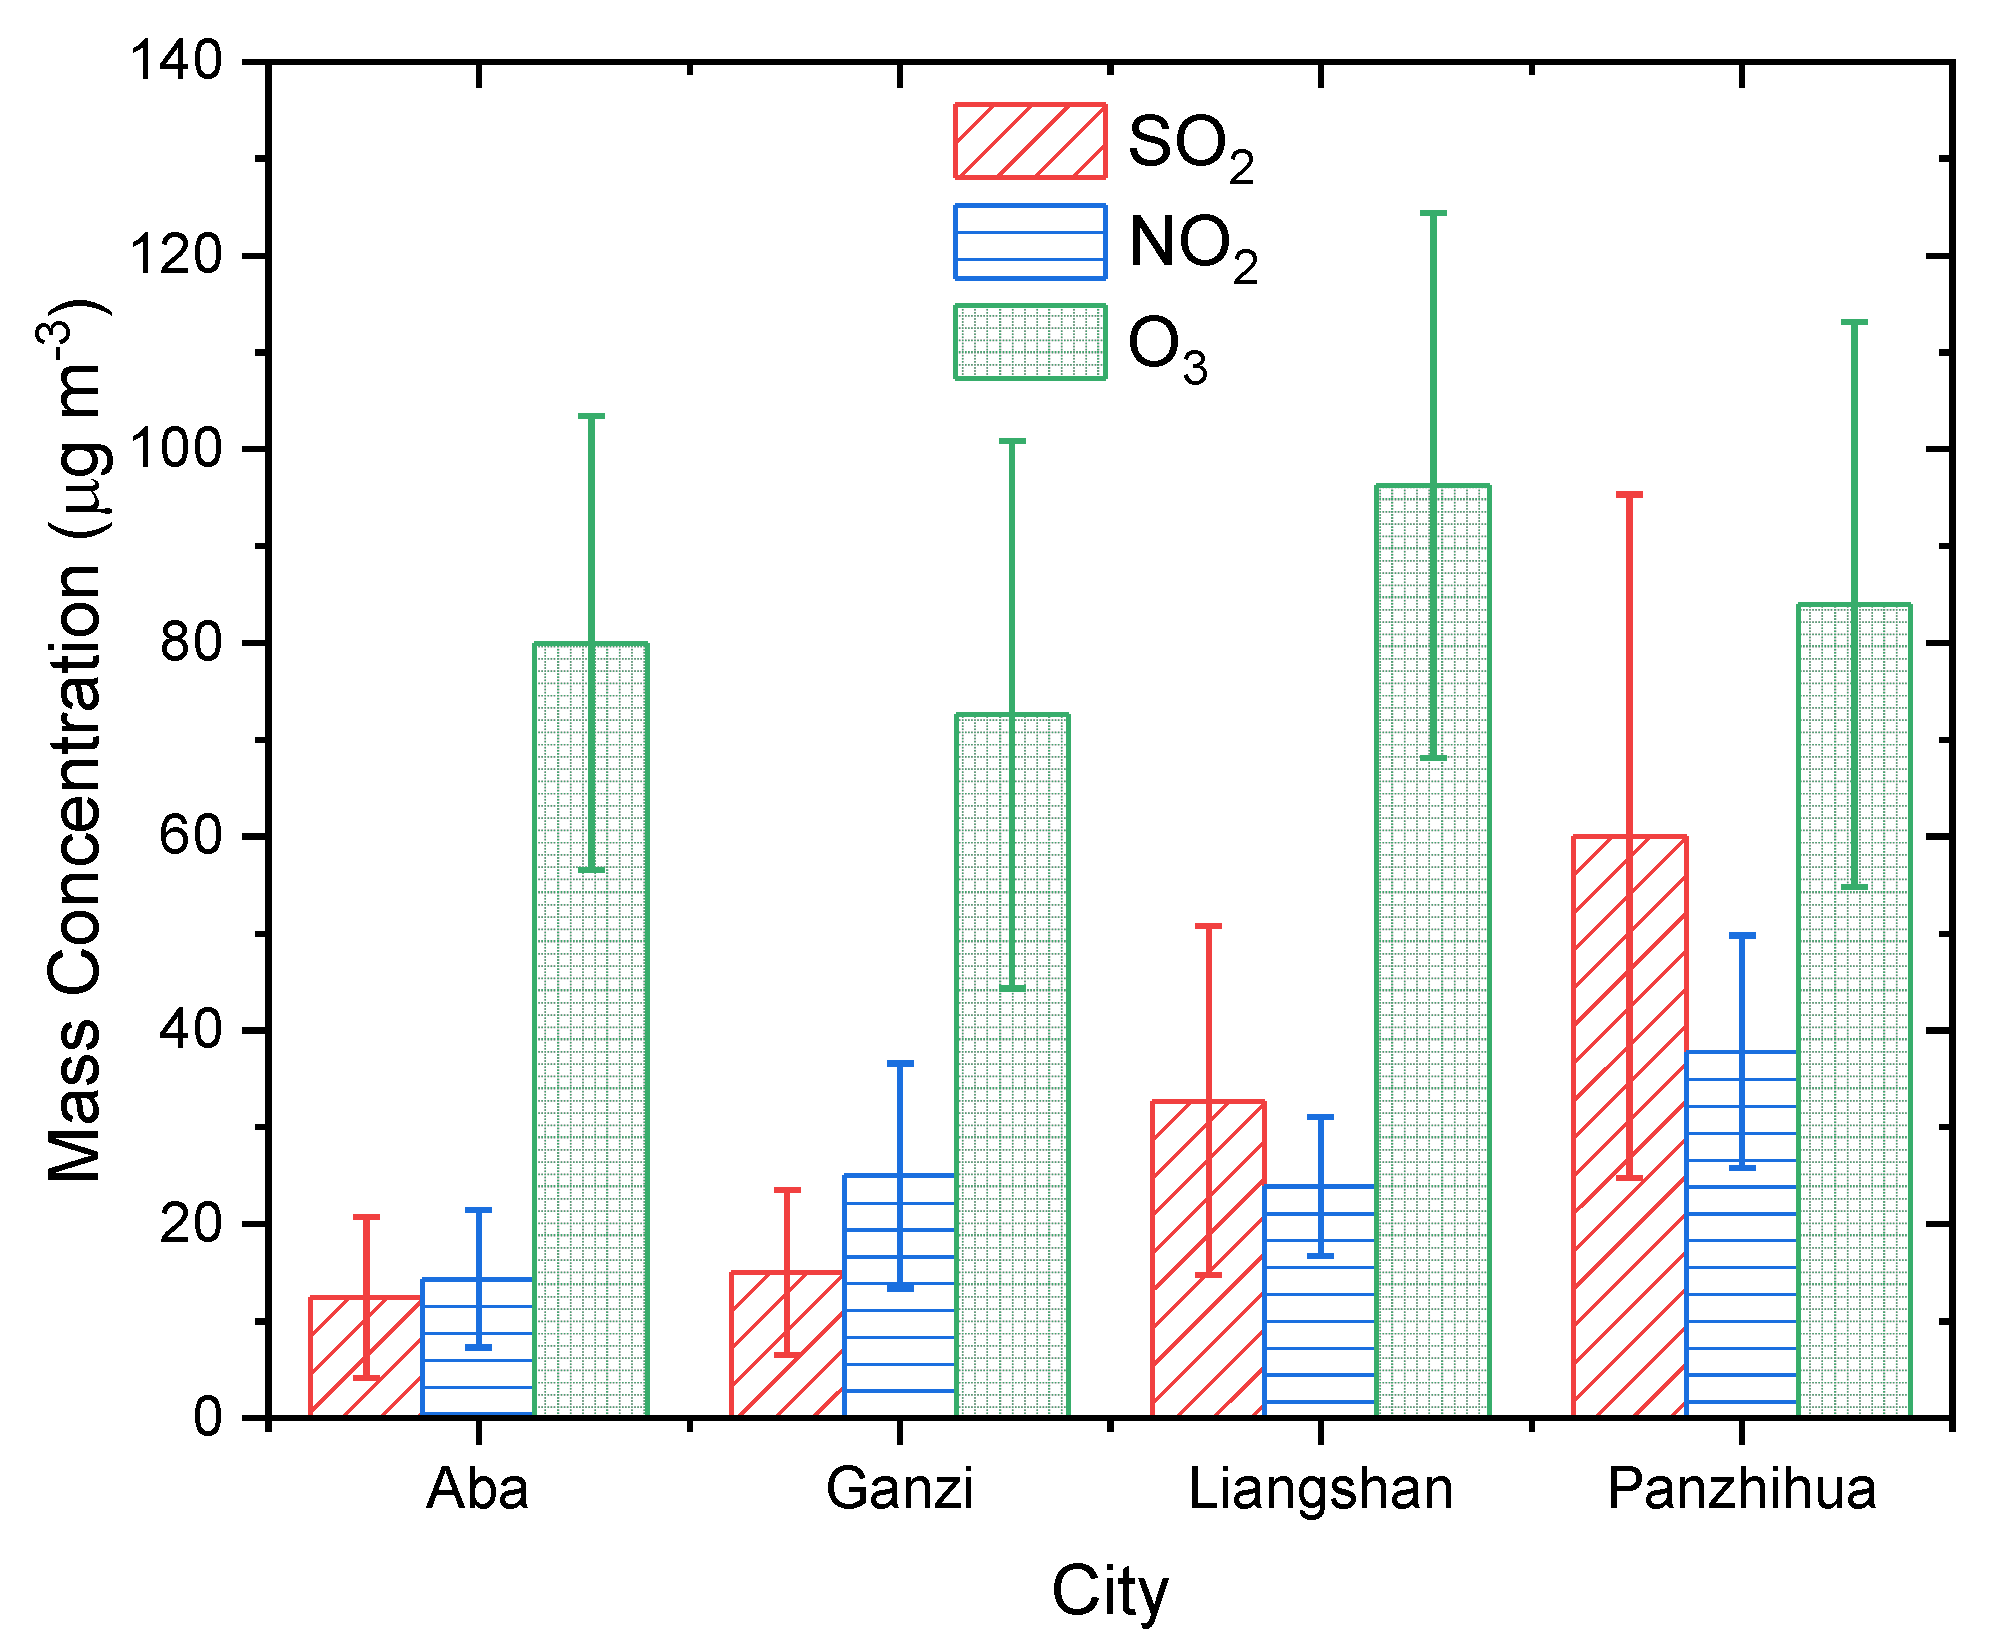
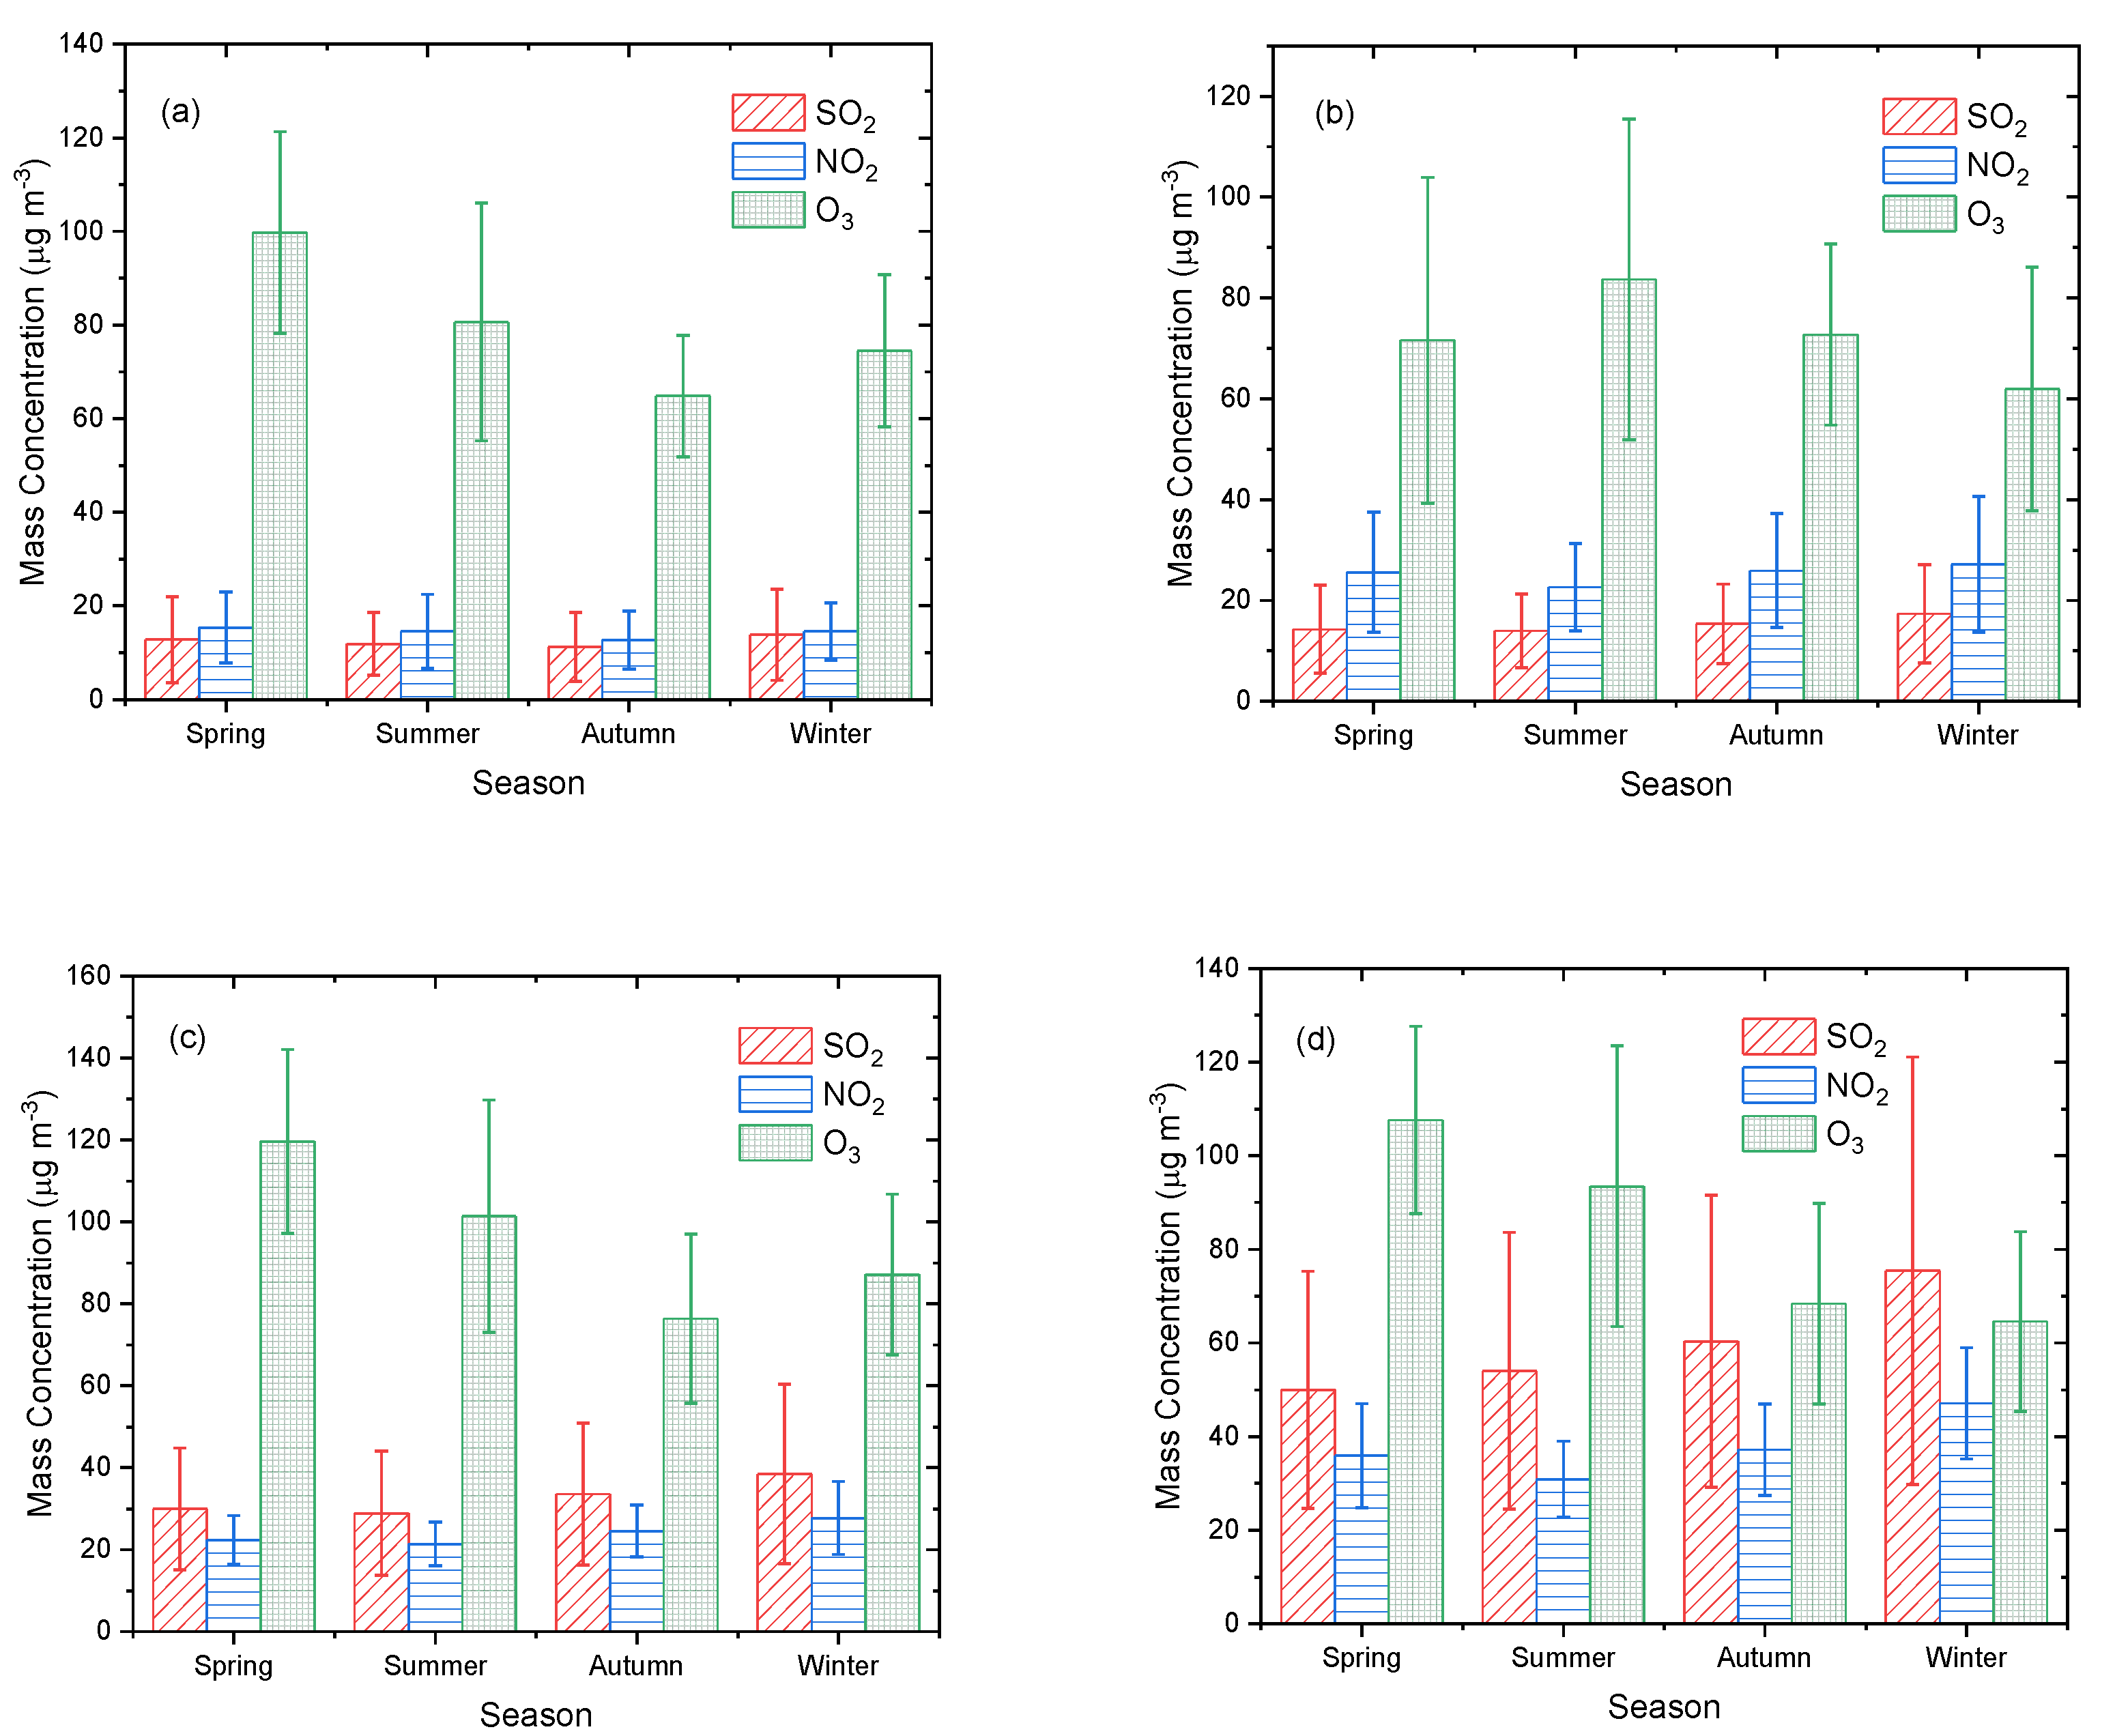
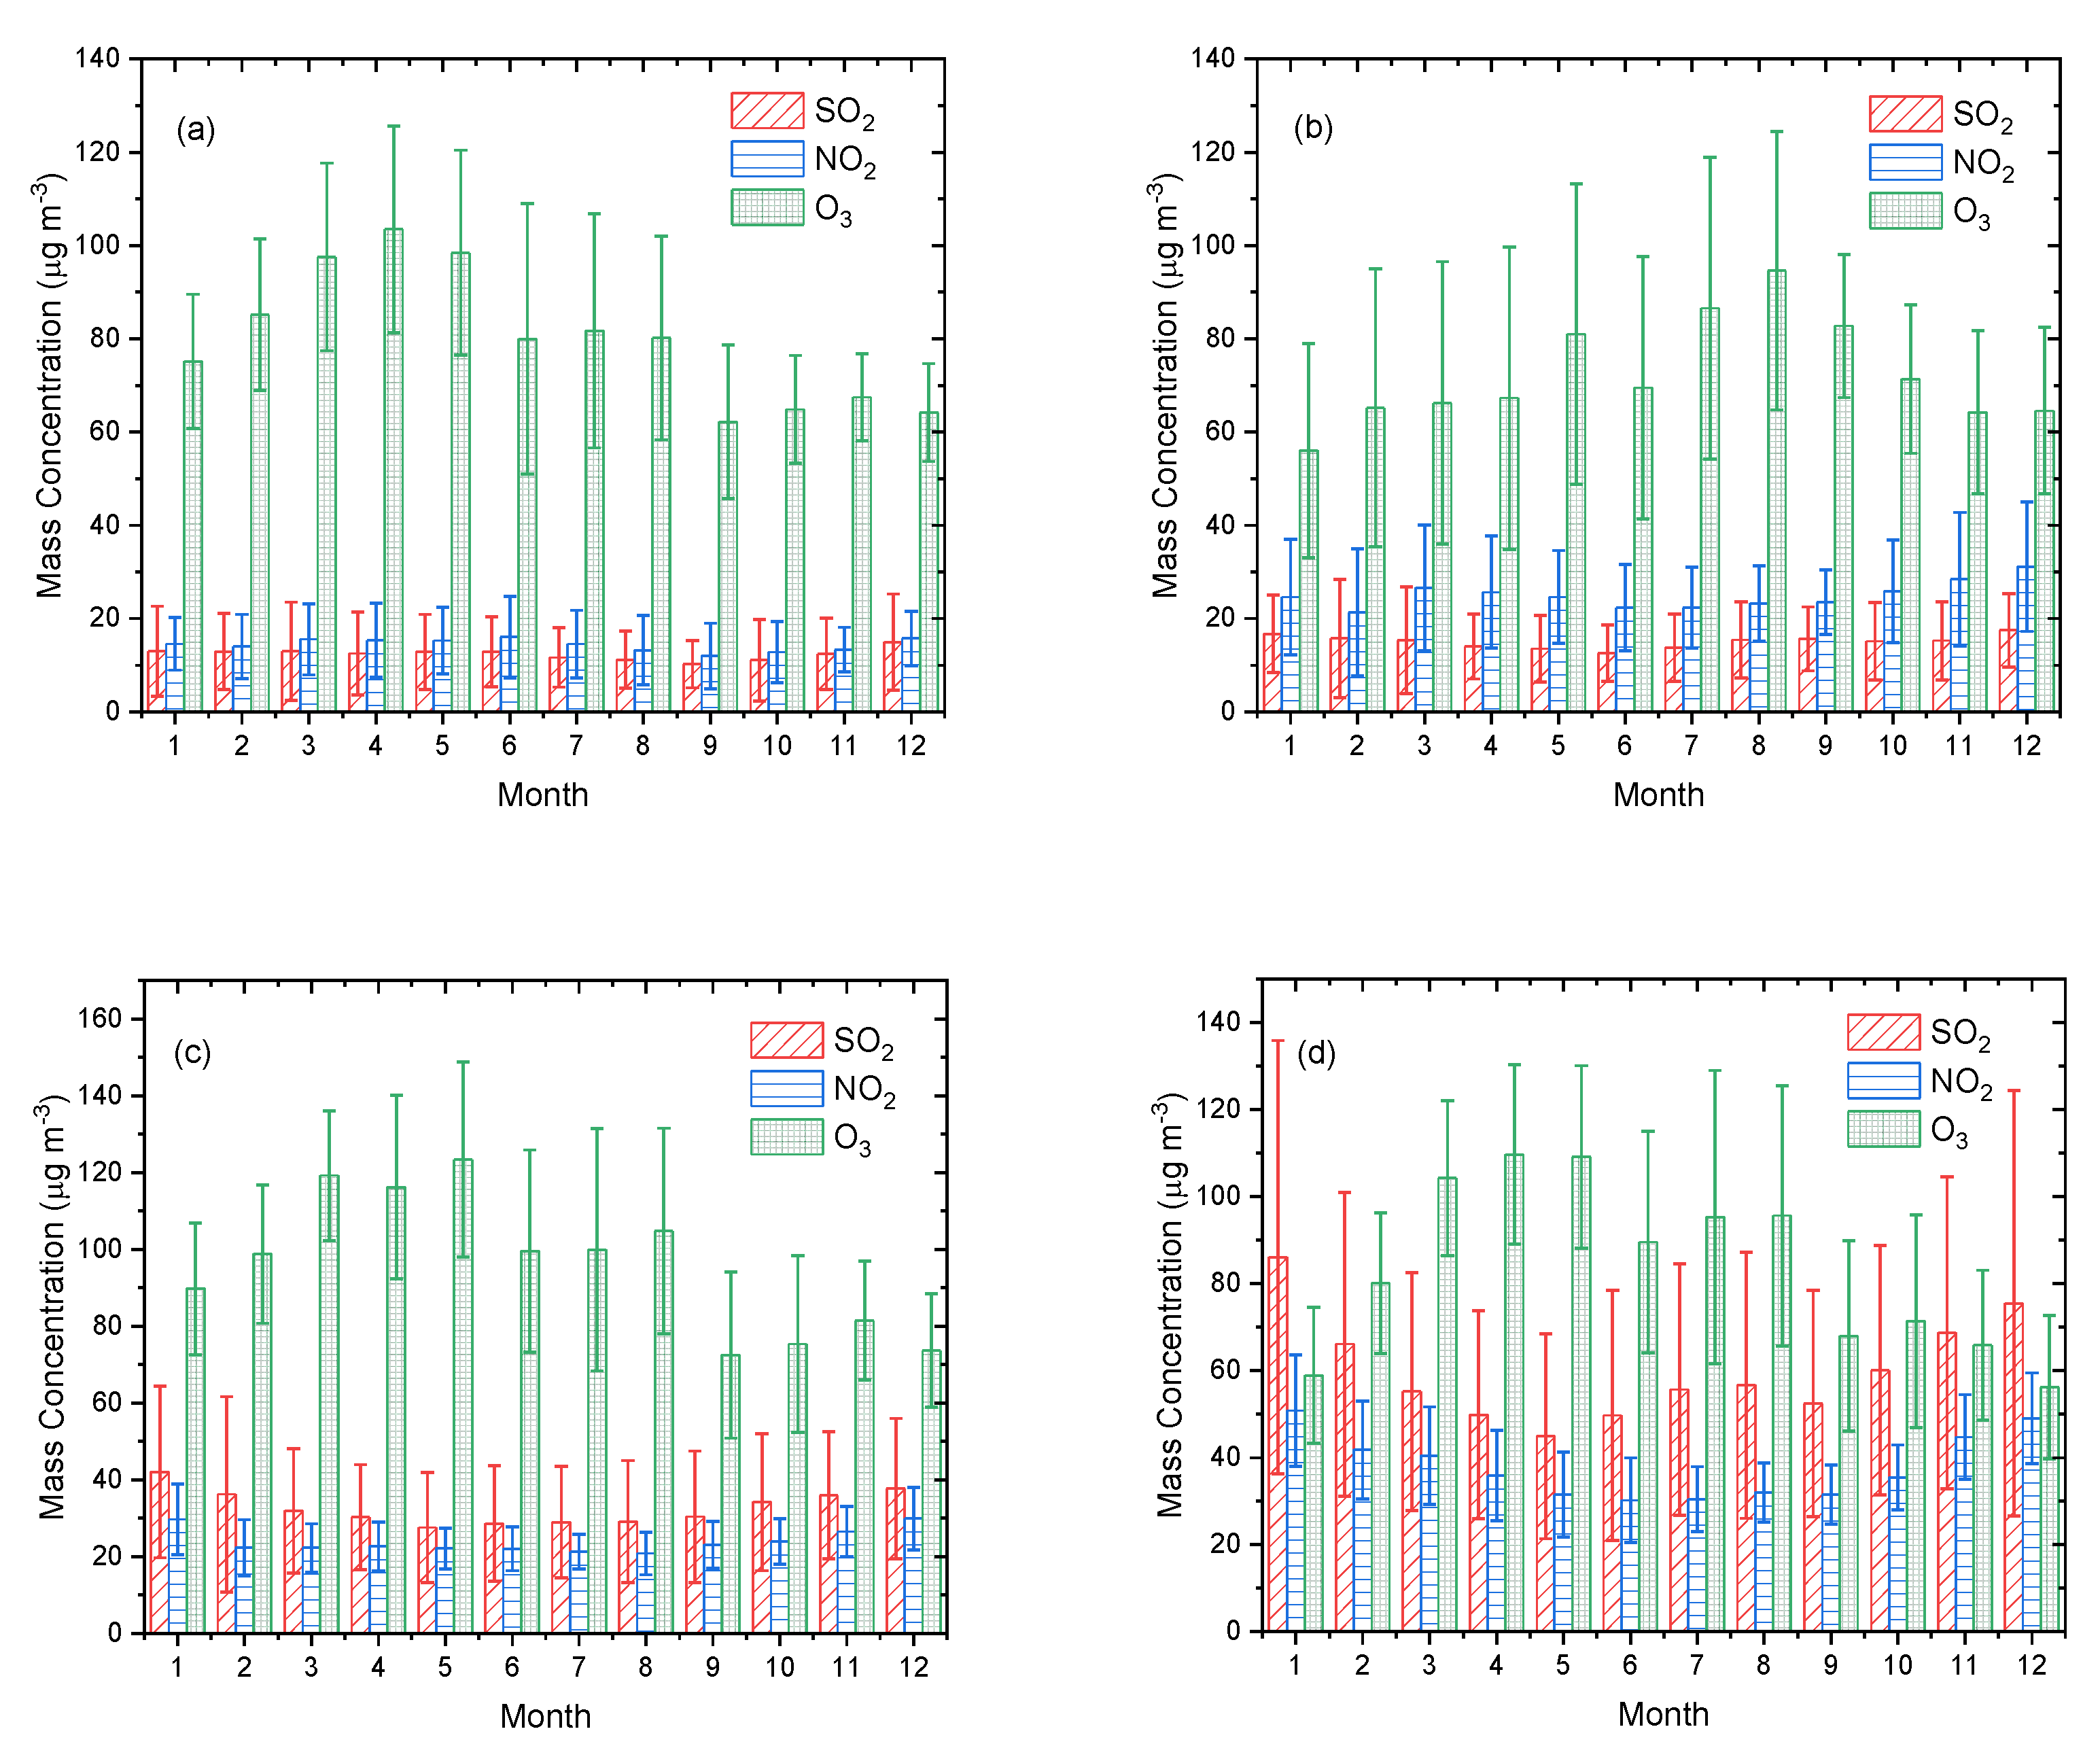
O3 pollution in the Western Sichuan Plateau with less artificial emission was prominent, with the highest annual mean concentration in Liangshan, 96.25 ± 28.17 μg·m−3, and the lowest annual mean concentration in Ganzi, 72.61 ± 28.28 μg·m−3, indicating that O3 formation is promoted by strong solar radiation induced by smaller particle concentrations and more cloud-free days [42,43]. The pollution levels of SO2 and NO2 in the ecological zone were lower than those in the economic zone. The annual average concentration of SO2 in Panzhihua and Aba was the highest and lowest, at 12.39 ± 8.31 μg·m−3 and 60.05 ± 35.25 μg·m−3, respectively. Panzhihua had the highest annual average NO2 concentration, 37.81 ± 11.98 μg·m−3, while Aba had the lowest annual average concentration, 14.37 ± 7.07 μg·m−3. The seasonal and monthly variations of O3 in the four regions were more obvious than those of SO2 and NO2. The seasonal and monthly variations in the economic zone were higher than those in the ecological zone, indicating that man-made emissions have an important impact on the temporal distribution characteristics of air pollutants.
(3)
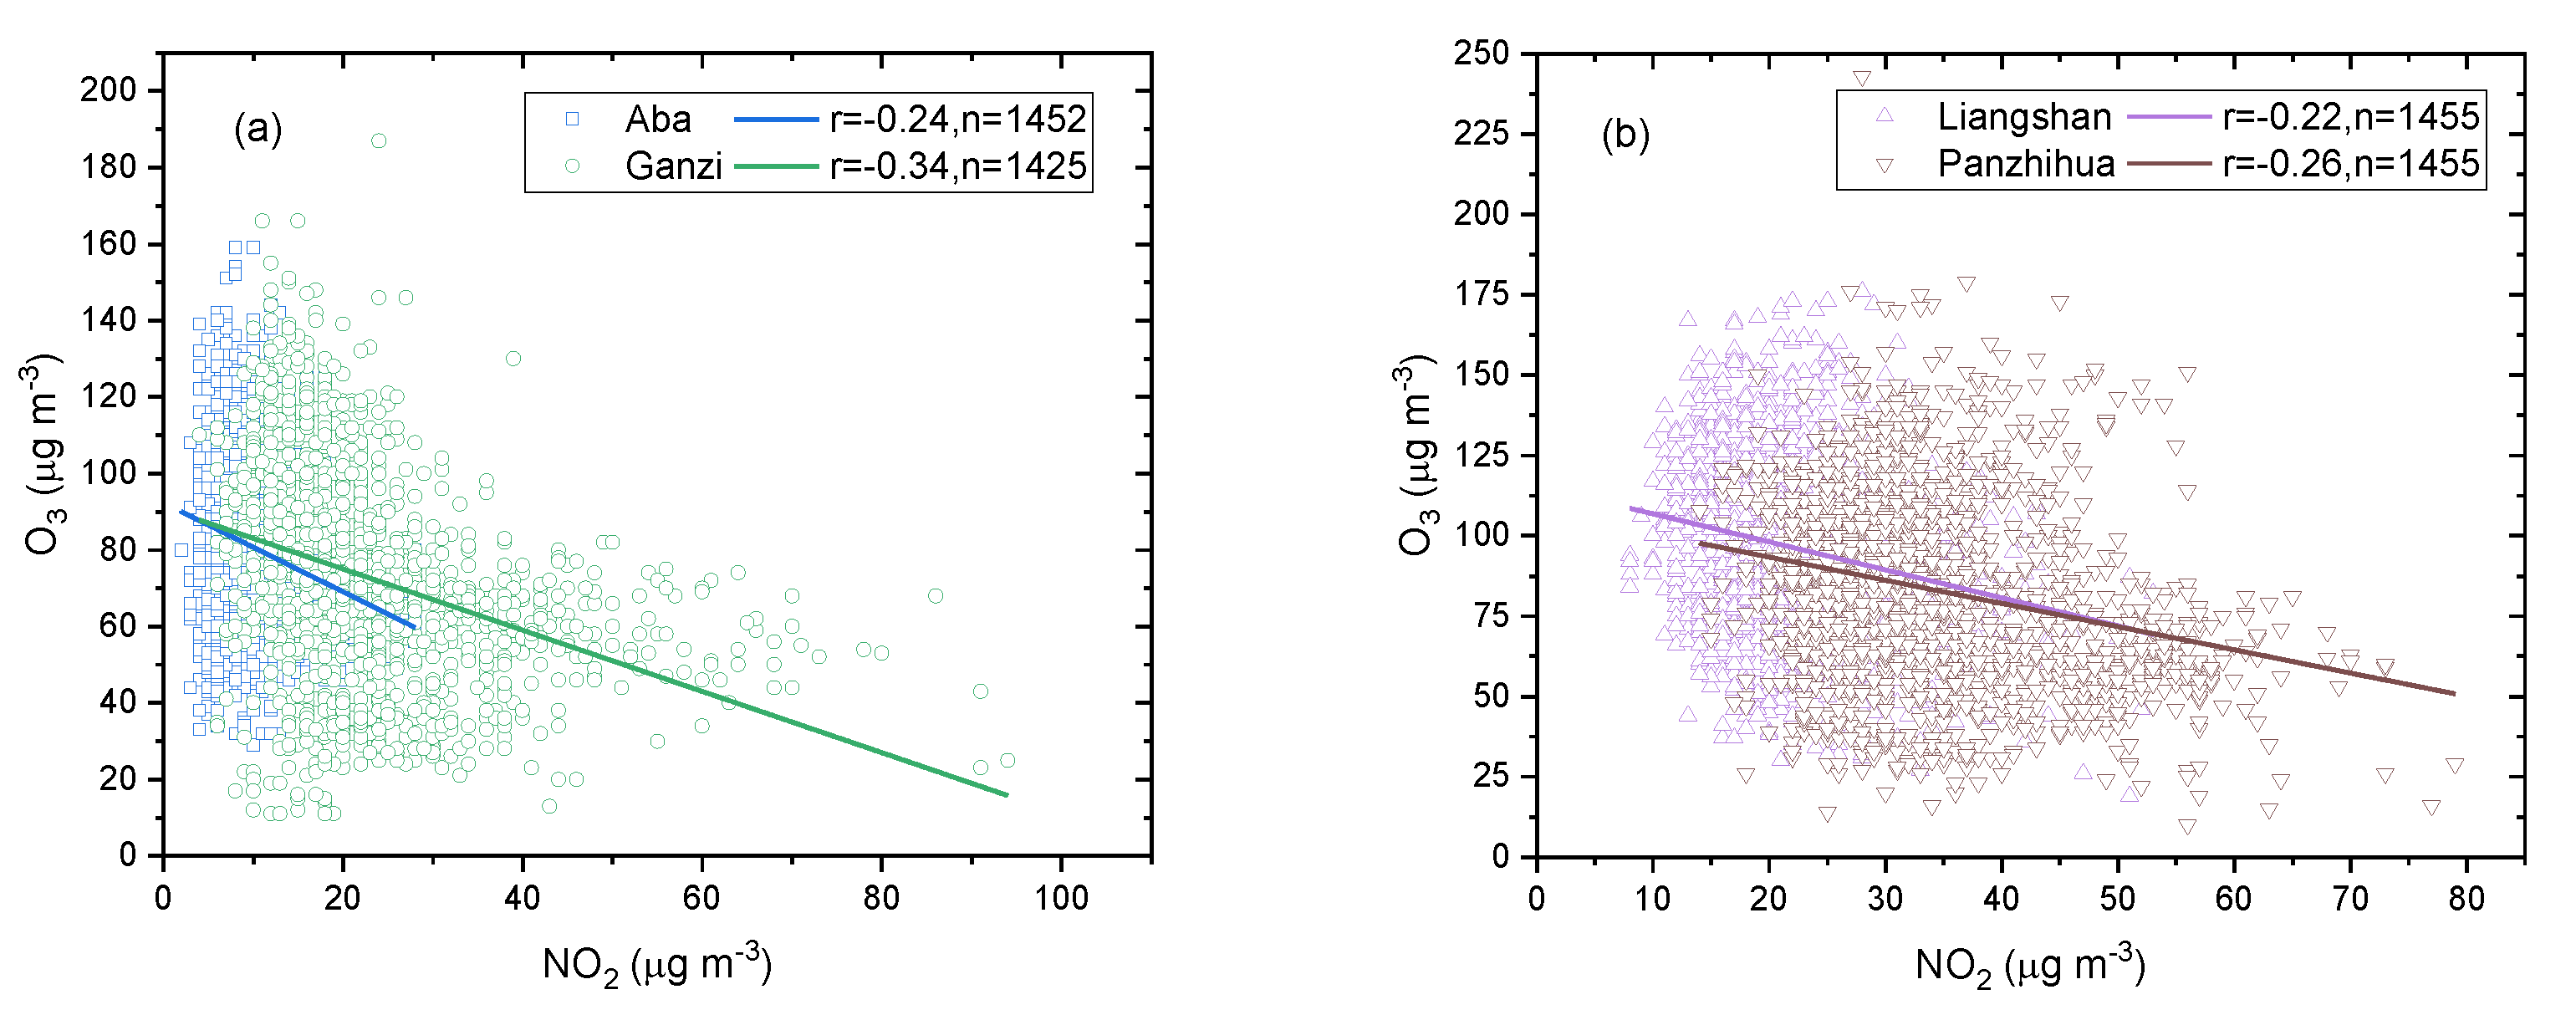
The correlation between SO2 and NO2 in Ganzi was the highest, followed by Panzhihua; the emission characteristics of SO2 and NO2 in these two regions were similar, and point sources contributed more to local air pollutants than mobile sources. The correlation between SO2 and NO2 was the lowest in Aba, indicating that the contribution of point sources to SO2 and NO2 pollution was not prominent. Ganzi showed the highest correlation coefficient, suggesting that NO2 contribute the most to O3 in this region in the Western Sichuan Plateau, followed by Panzhihua, Aba, and Liangshan. The correlation between NO2 and O3 is significantly higher in large and medium-sized cities in China than in the ecological and economic zones of Western Sichuan Plateau, which indicates that local precursors contribute more to the formation of O3 in areas with high NO2 emissions, while in areas with low NO2 emissions, O3 is more significantly affected by the regional background.

Author Contributions

Conceptualization, P.Z. and J.L.; methodology, P.Z. and Y.L.; software, P.Z. and Y.L.; validation, P.Z., and X.W.; formal analysis, P.Z.; investigation, B.L.; resources, B.L.; data curation, B.L.; writing—original draft preparation, P.Z.; writing—review and editing, P.Z. and H.X.; visualization, P.Z. and H.X.; supervision, J.L.; project administration, Y.Z.; funding acquisition, Y.Z.

Funding

This research was funded by the National Natural Science Foundation of China (41905126 and 41875169), the Scientific Research Foundation of CUIT (KYTZ201601), the Sichuan Science and Technology Project (2018SZ0316 and 2019JDKP0046), the Chengdu Science and Technology Anti-haze Project (2018-ZM01-00038-SN), and the Chengdu Science and Technology Benefit Project (2016-MH01-00038-SF).

Acknowledgments

Pengguo Zhao would like to thank the China Scholarship Council for support.

Conflicts of Interest

The authors declare no conflict of interest.

References

  1. Che, H.; Zhang, X.; Li, Y.; Zhou, Z.; Qu, J. Horizontal visibility trends in China 1981-2005. Geophys. Res. Lett. 2007, 34, L24706. [Google Scholar] [CrossRef]
  2. Zhao, S.; Yu, Y.; Yin, D.; He, J.; Liu, N.; Qu, J.; Xiao, J. Annual and diurnal variations of gaseous and particulate pollutants in 31 provincial capital cities based on in situ air quality monitoring data from China National Environmental Monitoring Center. Environ. Int. 2016, 86, 92–106. [Google Scholar] [CrossRef]
  3. Song, C.; Wu, L.; Xie, Y.; He, J.; Chen, X.; Wang, T.; Lin, Y.; Jin, T.; Wang, A.; Liu, Y.; et al. Air pollution in China: Status and spatiotemporal variations. Environ. Int. 2017, 227, 334–347. [Google Scholar] [CrossRef]
  4. Zhou, T.; Sun, J.; Yu, H. Temporal and spatial patterns of China’s main air pollutants: Years 2014 and 2015. Atmosphere 2017, 8, 137. [Google Scholar] [CrossRef]
  5. Davis, D.D.; Grodzinsky, G.; Kasibhatla, P.; Crawford, J. Impact of ship emissions on marine boundary layer NOx and SO2 distributions over the Pacific Basin. Geophys. Res. Lett. 2001, 28, 235–238. [Google Scholar] [CrossRef]
  6. Fattore, E.; Paiano, V.; Borgini, A.; Tittarelli, A.; Bertodi, M.; Crosignani, P.; Fanelli, R. Human health risk in relation to air quality in two municipalities in an industrialized area of Northern Italy. Environ. Res. 2011, 111, 1321–1327. [Google Scholar] [CrossRef]
  7. Hu, W.; Hu, M.; Hu, W.; Jimenes, J.L.; Yuan, B.; Chen, W.; Wang, M.; Wu, Y.; Chen, C.; Wang, Z.; et al. Chemical composition, sources and aging process of submicron aerosols in Beijing: Contrast between summer and winter. J. Geophys. Res. 2016, 121, 1955–1977. [Google Scholar] [CrossRef]
  8. Abdolahnejad, A.; Mohammadi, A.; Hajizadeh, Y. Mortality and Morbidity Due to Exposure to Ambient NO2, SO2, and O3 in Isfahan in 2013–2014. Int. J. Prev. Med. 2018, 9, 11. [Google Scholar]
  9. Meng, Z.; Xu, X.; Yan, P.; Ding, G.A.; Tang, J.; Lin, W.L.; Xu, X.D.; Wang, S.F. Characteristics of trace gaseous pollutants at a regional background station in Northern China. Atmos. Chem. Phys. 2009, 9, 927–936. [Google Scholar] [CrossRef] [Green Version]
  10. Lin, W.; Xu, X.; Ge, B.; Zhang, X. Characteristics of gaseous pollutants at Gucheng, a rural site southwest of Beijing. J. Geophys. Res. 2009, 114, D00G14. [Google Scholar] [CrossRef]
  11. Xu, W.; Zhao, C.; Ran, L.; Deng, Z.Z.; Liu, P.F.; Ma, N.; Lin, W.L.; Xu, X.B.; Yan, P.; He, X.; et al. Characteristics of pollutants and their correlation to meteorological conditions at a suburban site in the North China Plain. Atmos. Chem. Phys. 2011, 11, 4353–4369. [Google Scholar] [CrossRef] [Green Version]
  12. Schreifels, J.J.; Fu, Y.; Wilson, E.J. Sulfur dioxide control in China: Policy evolution during the 10th and 11th Five-year Plans and lessons for the future. Energy Policy 2012, 48, 779–789. [Google Scholar] [CrossRef]
  13. Krotkov, N.A.; McLinden, C.A.; Li, C. Aura OMI observations of regional SO2 and NO2 pollution changes from 2005 to 2014. Atmos. Chem. Phys. 2015, 15, 26555–26607. [Google Scholar] [CrossRef]
  14. Jin, Y.; Andersson, H.; Zhang, S. Air pollution control policies in China: A retrospective and prospects. Int. J. Environ. Res. Public Health 2016, 13, 1219. [Google Scholar] [CrossRef]
  15. Zhang, L.; Lee, C.; Zhang, R.; Chen, L. Spatial and temporal evaluation of long term trend (2005-2014) of OMI retrieved NO2 and SO2 concentrations in Henan Province, China. Atmos. Environ. 2017, 154, 151–166. [Google Scholar] [CrossRef]
  16. Zheng, B.; Tong, D.; Li, M.; Liu, F.; Hong, C.; Geng, G.; Li, H.; Li, X.; Peng, L.; Qi, J.; et al. Trends in China’s anthropogenic emissions since 2010 as the consequence of clean air actions. Atmos. Chem. Phys. 2018, 18, 14095–14111. [Google Scholar] [CrossRef]
  17. Zhang, Q.; Ma, Q.; Zhao, B.; Liu, X.; Wang, X.; Jia, B.; Zhang, X. Winter haze over North China Plain from 2009 to 2016: Influence of emission and meteorology. Environ. Pollut. 2018, 242, 1308–1318. [Google Scholar] [CrossRef]
  18. Jin, X.; Holloway, T. Spatial and temporal variability of ozone sensitivity over China observed from the Ozone Monitoring Instrument. J. Geophys. Res. 2015, 120, 7229–7246. [Google Scholar] [CrossRef]
  19. Lu, X.; Hong, J.; Zhang, L.; Cooper, O.R.; Schultz, M.G.; Xu, X.; Wang, T.; Gao, M.; Zhao, Y.; Zhang, Y. Severe surface ozone pollution in China: A global perspective. Environ. Sci. Technol. Lett. 2018, 5, 487–494. [Google Scholar] [CrossRef]
  20. Li, K.; Jacob, D.J.; Liao, H. Anthropogenic drivers of 2013-2017 trends in summer surface ozone in China. Proc. Natl. Acad. Sci. USA 2019, 116, 422–427. [Google Scholar] [CrossRef]
  21. Zhao, S.; Yu, Y.; Yin, D.; Qin, D.; He, J.; Dong, L. Spatial patterns and temporal variations of six criteria air pollutants during 2015 to 2017 in the city clusters of Sichuan Basin, China. Sci. Total Environ. 2018, 624, 540–557. [Google Scholar] [CrossRef]
  22. Wang, S.; Huang, G.; Lin, J.; Hu, K.; Wang, L.; Gong, H. Chinese blue days: A novel index and spatio-temporal variations. Environ. Res. Lett. 2019, 14, 074026. [Google Scholar] [CrossRef]
  23. Yan, S.; Zhu, B.; Kang, H. Long-term fog variation and its impact factors over polluted regions of East China. J. Geophys. Res. 2019, 124, 1741–1754. [Google Scholar] [CrossRef]
  24. SPG. Guiding opinions on implementing the development strategy of “one line, many branches” to promote the coordinated development of the whole province. 2018. Available online: http://www.sc.gov.cn/10462/10464/10797/2018/11/20/10463293.shtml (accessed on 20 November 2018).
  25. Sichuan Ecological Environment Monitoring Center. Available online: http://www.scnewair.cn:6112/publish/index.html (accessed on 15 March 2019).
  26. Ning, G.; Wang, S.; Ma, M.; Ni, C.; Shang, Z.; Wang, J.; Li, J. Characteristics of air pollution in different zones of Sichuan Basin, China. Sci. Total Environ. 2018, 612, 975–984. [Google Scholar] [CrossRef]
  27. National Meteorological Information Center of China. Available online: http://data.cma.cn/ (accessed on 10 August 2019).
  28. Ma, Z.; Xu, J.; Quan, W.; Zhang, Z.; Lin, W.; Xu, X. Significant increase of surface ozone at a rural site, north of Eastern China. Atmos. Chem. Phys. 2016, 16, 3969–3977. [Google Scholar] [CrossRef]
  29. Wang, Z.; Zheng, F.; Zhang, W.; Wang, S. Analysis of SO2 Pollution Changes of Beijing-Tianjin-Hebei Region over China Based on OMI Observations from 2006 to 2017. Adv. Meteorol. 2018, 8746068, 15. [Google Scholar] [CrossRef]
  30. Karplus, V.J.; Zhang, S.; Almond, D. Quantifying coal power plant responses to tighter SO2 emissions standards in China. Proc. Natl. Acad. Sci. USA 2018, 115, 7004–7009. [Google Scholar] [CrossRef]
  31. Nirel, R.; Dayan, U. On the ratio of sulfur dioxide to nitrogen oxides as an indicator of air pollution sources. J. Appl. Meteorol. 2001, 40, 1209–1222. [Google Scholar] [CrossRef]
  32. Zhao, Z.; Cao, J.; Liu, S. The variations of NO2, SO2 and O3 at an atmospheric background site in Qinghai Lake in summer, northeastern Tibetan Plateau. J. Earth Environ. 2010, 1, 201–207. [Google Scholar]
  33. An, X.; Zuo, H.; Chen, L. Atmospheric environmental capacity of SO2 in winter over Lanzhou in China: A case study. Adv. Atmos. Sci. 2007, 24, 688–699. [Google Scholar] [CrossRef]
  34. Wang, Y.; Zhang, X.; Sun, J.; Zhang, X.C.; Che, H.Z.; Li, Y. Spatial and temporal variations of the concentrations of PM10, PM2.5 and PM1 in China. Atmos. Chem. Phys. 2015, 15, 13585–13595. [Google Scholar] [CrossRef]
  35. Goyal, P.S. Present scenario of air quality in Delhi: A case study of CNG implementation. Atmos. Environ. 2003, 37, 5423–5431. [Google Scholar] [CrossRef]
  36. Mao, M.; Zhang, X.; Yin, Y. Particulate Matter and Gaseous Pollutions in Three Metropolises along the Chinese Yangtze River: Situation and Implications. Int. J. Environ. Res. Public Health. 2018, 15, 1102. [Google Scholar] [CrossRef]
  37. Gaur, A.; Tripathi, S.N.; Kanawade, V.P.; Shukla, S.P.; Tare, V. Four-year measurements of trace gases (SO2, NOx, CO, and O3) at an urban location, Kanpur, in Northern India. J. Atmos. Chem. 2014, 71, 283–301. [Google Scholar] [CrossRef]
  38. Han, S.; Bian, H.; Feng, Y.; Liu, A.; Li, X.; Zeng, F.; Zhang, X. Analysis of the Relationship between O3, NO and NO2 in Tianjin, China. Aerosol Air Qual. Res. 2011, 11, 128–139. [Google Scholar] [CrossRef]
  39. Yoo, J.; Jeong, M.; Kim, D. Spatiotemporal variations of air pollutants (O3, NO2, SO2, CO, PM10 and VOCs) with land-use types. Atmos. Chem. Phys. 2015, 15, 10857–10885. [Google Scholar] [CrossRef]
  40. Xie, Y.; Zhao, B.; Zhang, L.; Luo, R. Spatiotemporal variations of PM2.5 and PM10 concentrations between 31 Chinese cities and their relationships with SO2, NO2, CO and O3. Particuology 2015, 20, 141–149. [Google Scholar] [CrossRef]
  41. de Souza, A.; Aristone, F.; Kumar, U.; Kovac-Andric, E. Analysis of the correlations between NO, NO2 and O3 concentrations in campo grande-MS, Brazil. Eur. Chem. Bull. 2017, 6, 284–291. [Google Scholar] [CrossRef]
  42. Zhu, X.; He, H.; Liu, M.; Yu, G.; Sun, X.; Gao, Y. Spatio-temporal variation of photosynthetically active radiation in China in recent 50 years. J. Geogr. Sci. 2010, 20, 803–817. [Google Scholar] [CrossRef]
  43. Wang, T.; Xue, L.; Brimblecombe, P.; Lam, Y.F.; Li, L.; Zhang, L. Ozone pollution in China: A review of concentrations, meteorological influences, chemical precursors and effects. Sci. Total Environ. 2017, 575, 1582–1596. [Google Scholar] [CrossRef]
Figure 1. Geographical position of ecological zone (blue outline) and economic zone (red outline) of Western Sichuan Plateau, the locations of cities are marked by black dots.
Ijerph 16 03265 g001
Figure 2. Variations of monthly mean mass concentrations of SO2, NO2, and O3 in (a) Aba, (b) Ganzi, (c) Liangshan, and (d) Panzhihua from 2008 to 2018.
Ijerph 16 03265 g002
Figure 3. Variations of annual mean mass concentrations of SO2, NO2, and O3 in (a) Aba, (b) Ganzi, (c) Liangshan, and (d) Panzhihua from 2008 to 2018.
Ijerph 16 03265 g003
Figure 4. Annual variations of three air pollutants in different seasons: (a) SO2, (b) NO2, and (c) O3 in Aba; (d) SO2, (e) NO2, and (f) O3 in Ganzi; (g) SO2, (h) NO2, and (i) O3 in Liangshan; (j) SO2, (k) NO2, and (l) O3 in Panzhihua.
Ijerph 16 03265 g004
Figure 5. Variations of concentration ratio of SO2 to NO2 in Aba, Ganzi, Liangshan, and Panzhihua from 2008 to 2018.
Ijerph 16 03265 g005
Figure 6. (a) Energy consumption per unit industrial added value and (b) highway passenger and freight turnover in Aba, Ganzi, Liangshan, and Panzhihua in 2008–2016.
Ijerph 16 03265 g006
Figure 7. Relationships between SO2, NO2, O3 and routine meteorological parameters (mean monthly average temperature, maximum and minimum monthly average temperature, mean relative humidity, monthly total precipitation, monthly sunshine duration, mean wind speed, and maximum wind speed) in Aba of the ecological zone of Western Sichuan Plateau.
Ijerph 16 03265 g007
Figure 8. Relationships between SO2, NO2, O3, and routine meteorological parameters (mean monthly average temperature, maximum and minimum monthly average temperature, mean relative humidity, monthly total precipitation, monthly sunshine duration, mean wind speed, and maximum wind speed) in Panzhihua of the economic zone of Western Sichuan Plateau.
Ijerph 16 03265 g008
Figure 9. Multi-year mean mass concentrations of SO2, NO2, and O3 in Aba, Ganzi, Liangshan, and Panzhihua.
Ijerph 16 03265 g009
Figure 10. Seasonal mean mass concentrations of SO2, NO2, and O3 in (a) Aba, (b) Ganzi, (c) Liangshan, and (d) Panzhihua.
Ijerph 16 03265 g010
Figure 11. Monthly mean mass concentrations of SO2, NO2, and O3 in (a) Aba, (b) Ganzi, (c) Liangshan, and (d) Panzhihua.
Ijerph 16 03265 g011
Figure 12. Correlation between SO2 and NO2 in the (a) ecological zone and (b) economic zone in 2015–2018.
Ijerph 16 03265 g012
Figure 13. Correlation between NO2 and O3 in the (a) ecological zone and (b) economic zone in 2015–2018.
Ijerph 16 03265 g013
Table 1. Resident population, urbanization rate, population density, gross domestic product (GDP), possession of civil motor vehicles and area in the ecological and economic zones of Western Sichuan Plateau.
Region CategoryAdministrative Area (km2)Resident Population (10,000)Urbanization Rate (%)GDP (Billion Yuan)Possession of Civil Motor Vehicles (10,000)
AbaEcological zone83,01693.4637.8628.1310.5
GanziEcological zone149,599118.0529.2622.988.3
LiangshanEconomic zone60,294482.2233.04140.3924.9
PanzhihuaEconomic zone7401123.5665.34101.4715.1

