Analysis of Potential Risks Associated with Urban Stormwater Quality for Managed Aquifer Recharge


Abstract
1. Introduction
2. Materials and Methods
2.1. Stormwater Quality Data
2.1.1. Road Stormwater Runoff Quality
2.1.2. Roof Stormwater Quality
2.1.3. Greenbelt Stormwater Quality
2.2. Methods
2.2.1. Toughreact
2.2.2. Clogging Indicators
3. Results and Discussion
3.1. Characteristics of the Urban Stormwater Quality
3.1.1. Physicochemical Stormwater Properties
Road Stormwater Quality
Roof Stormwater Quality
Greenbelt Stormwater Quality
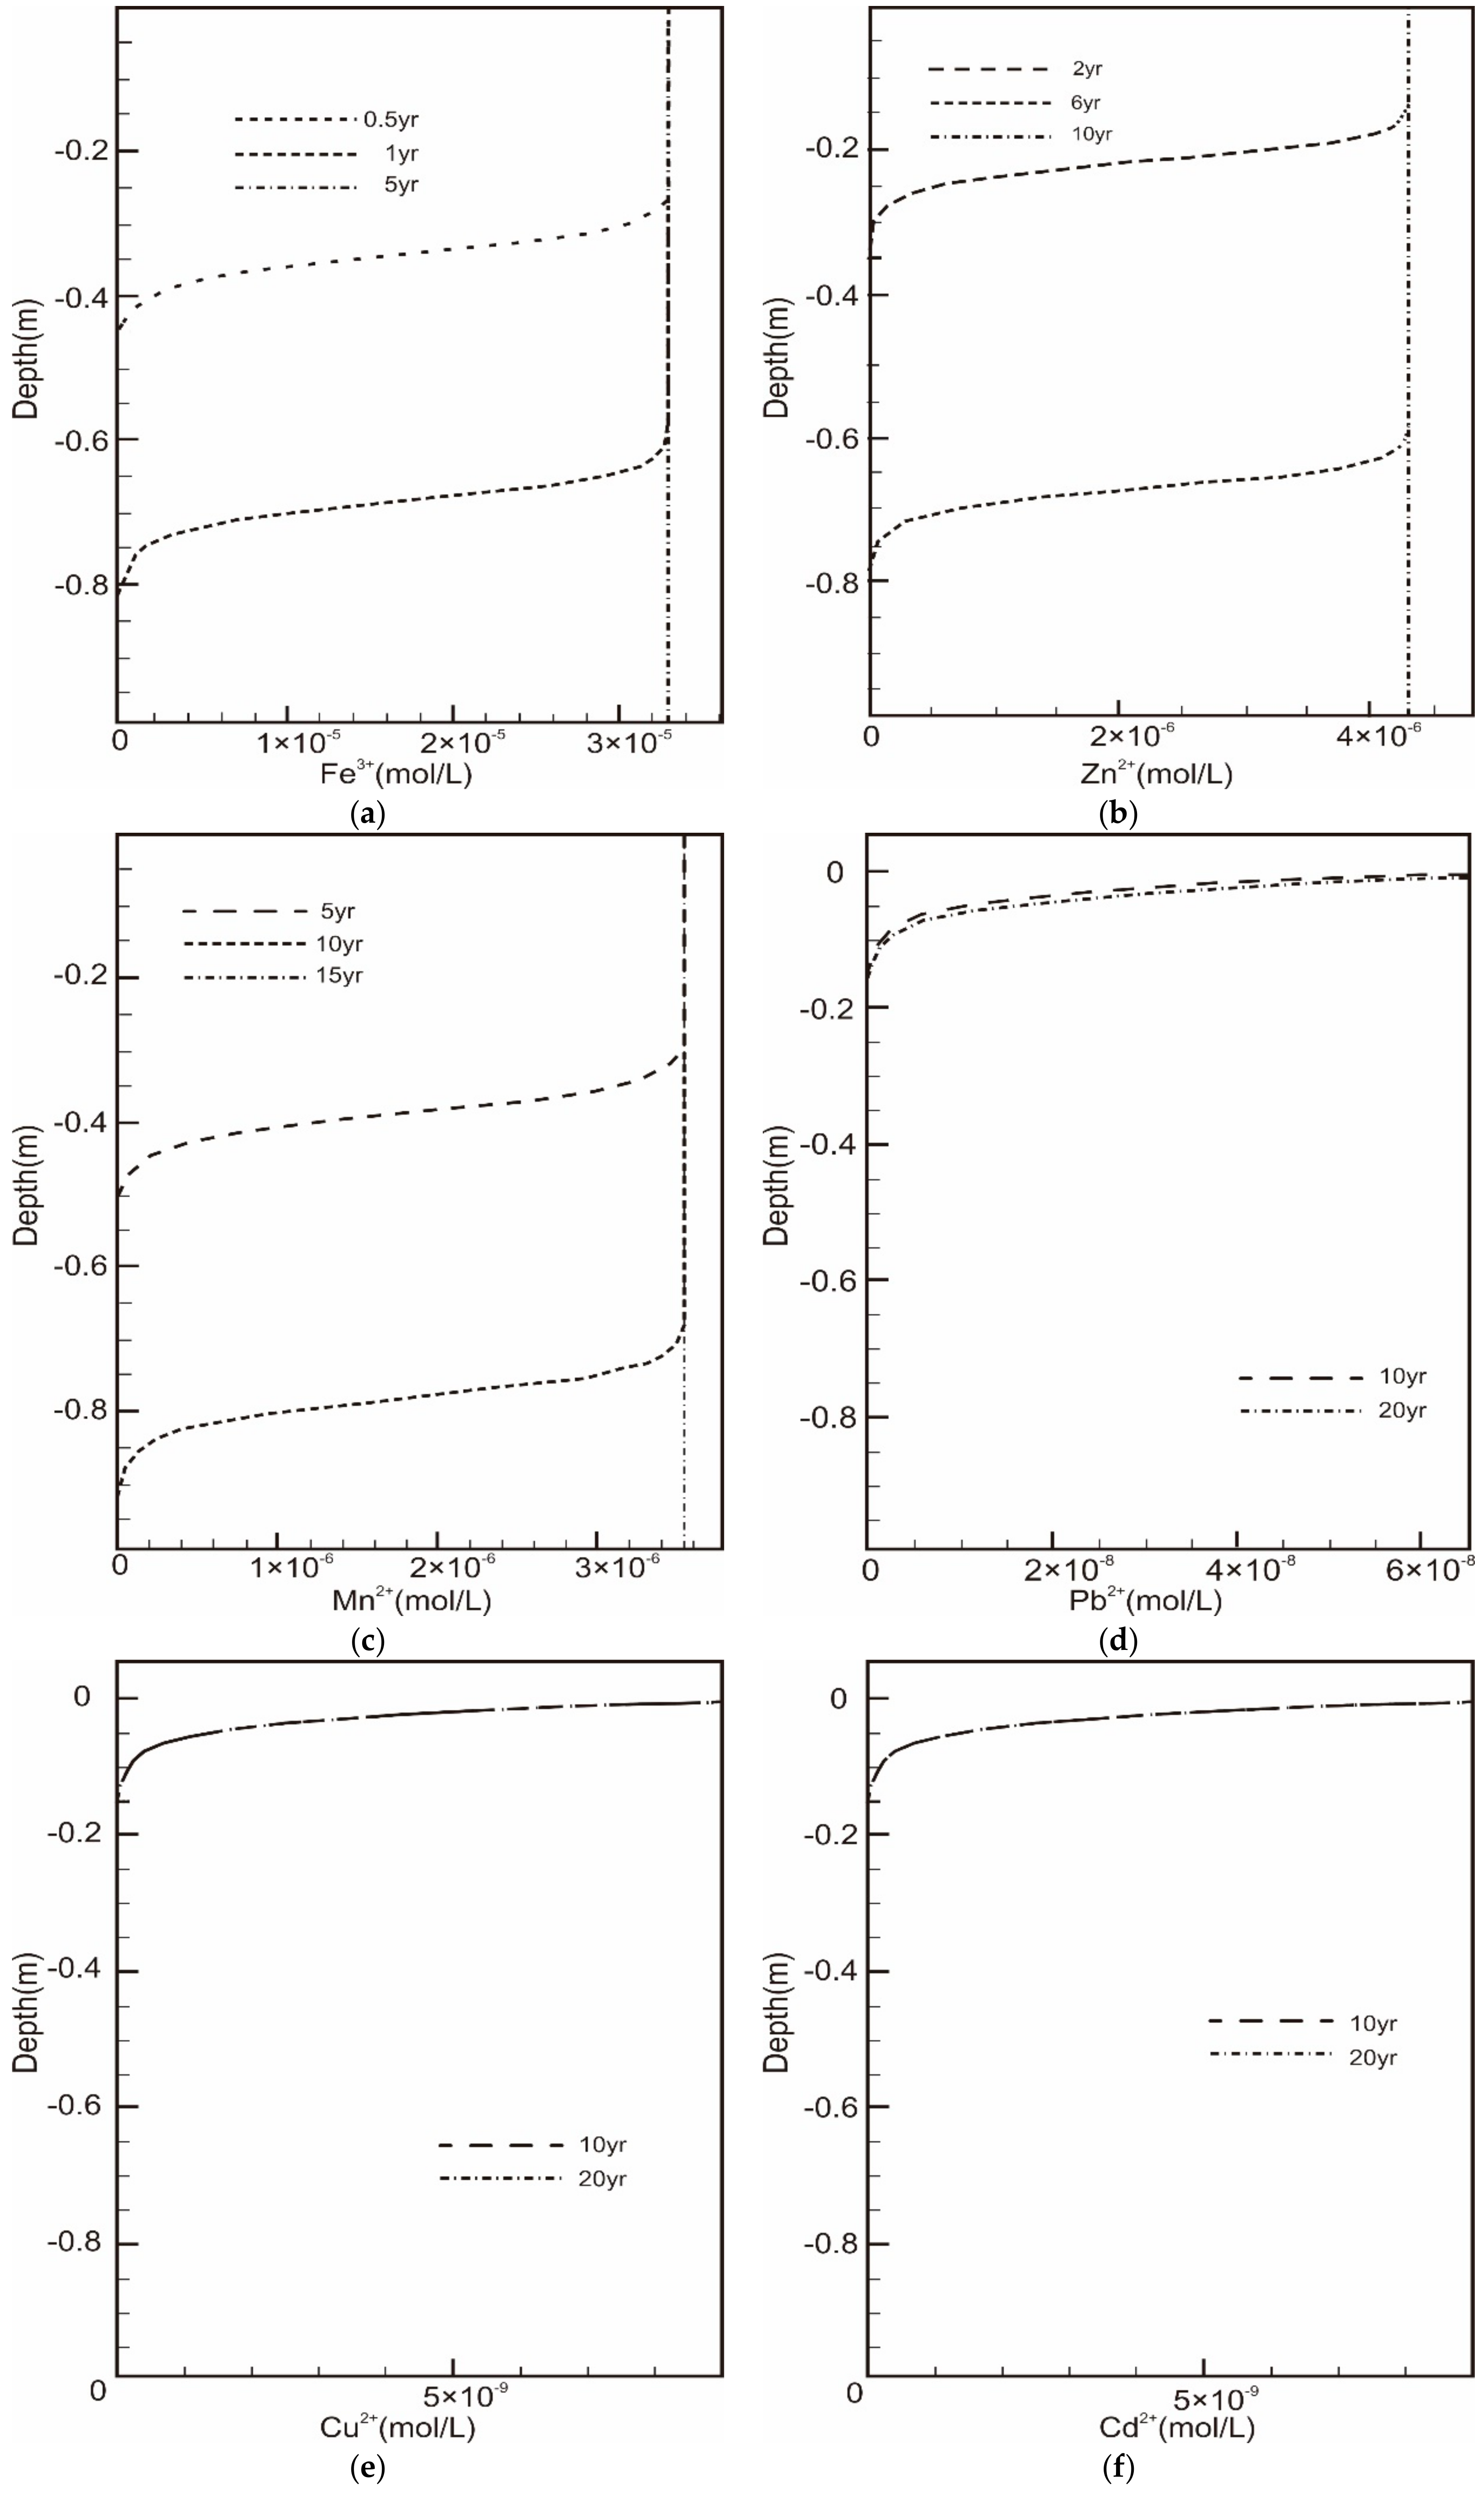
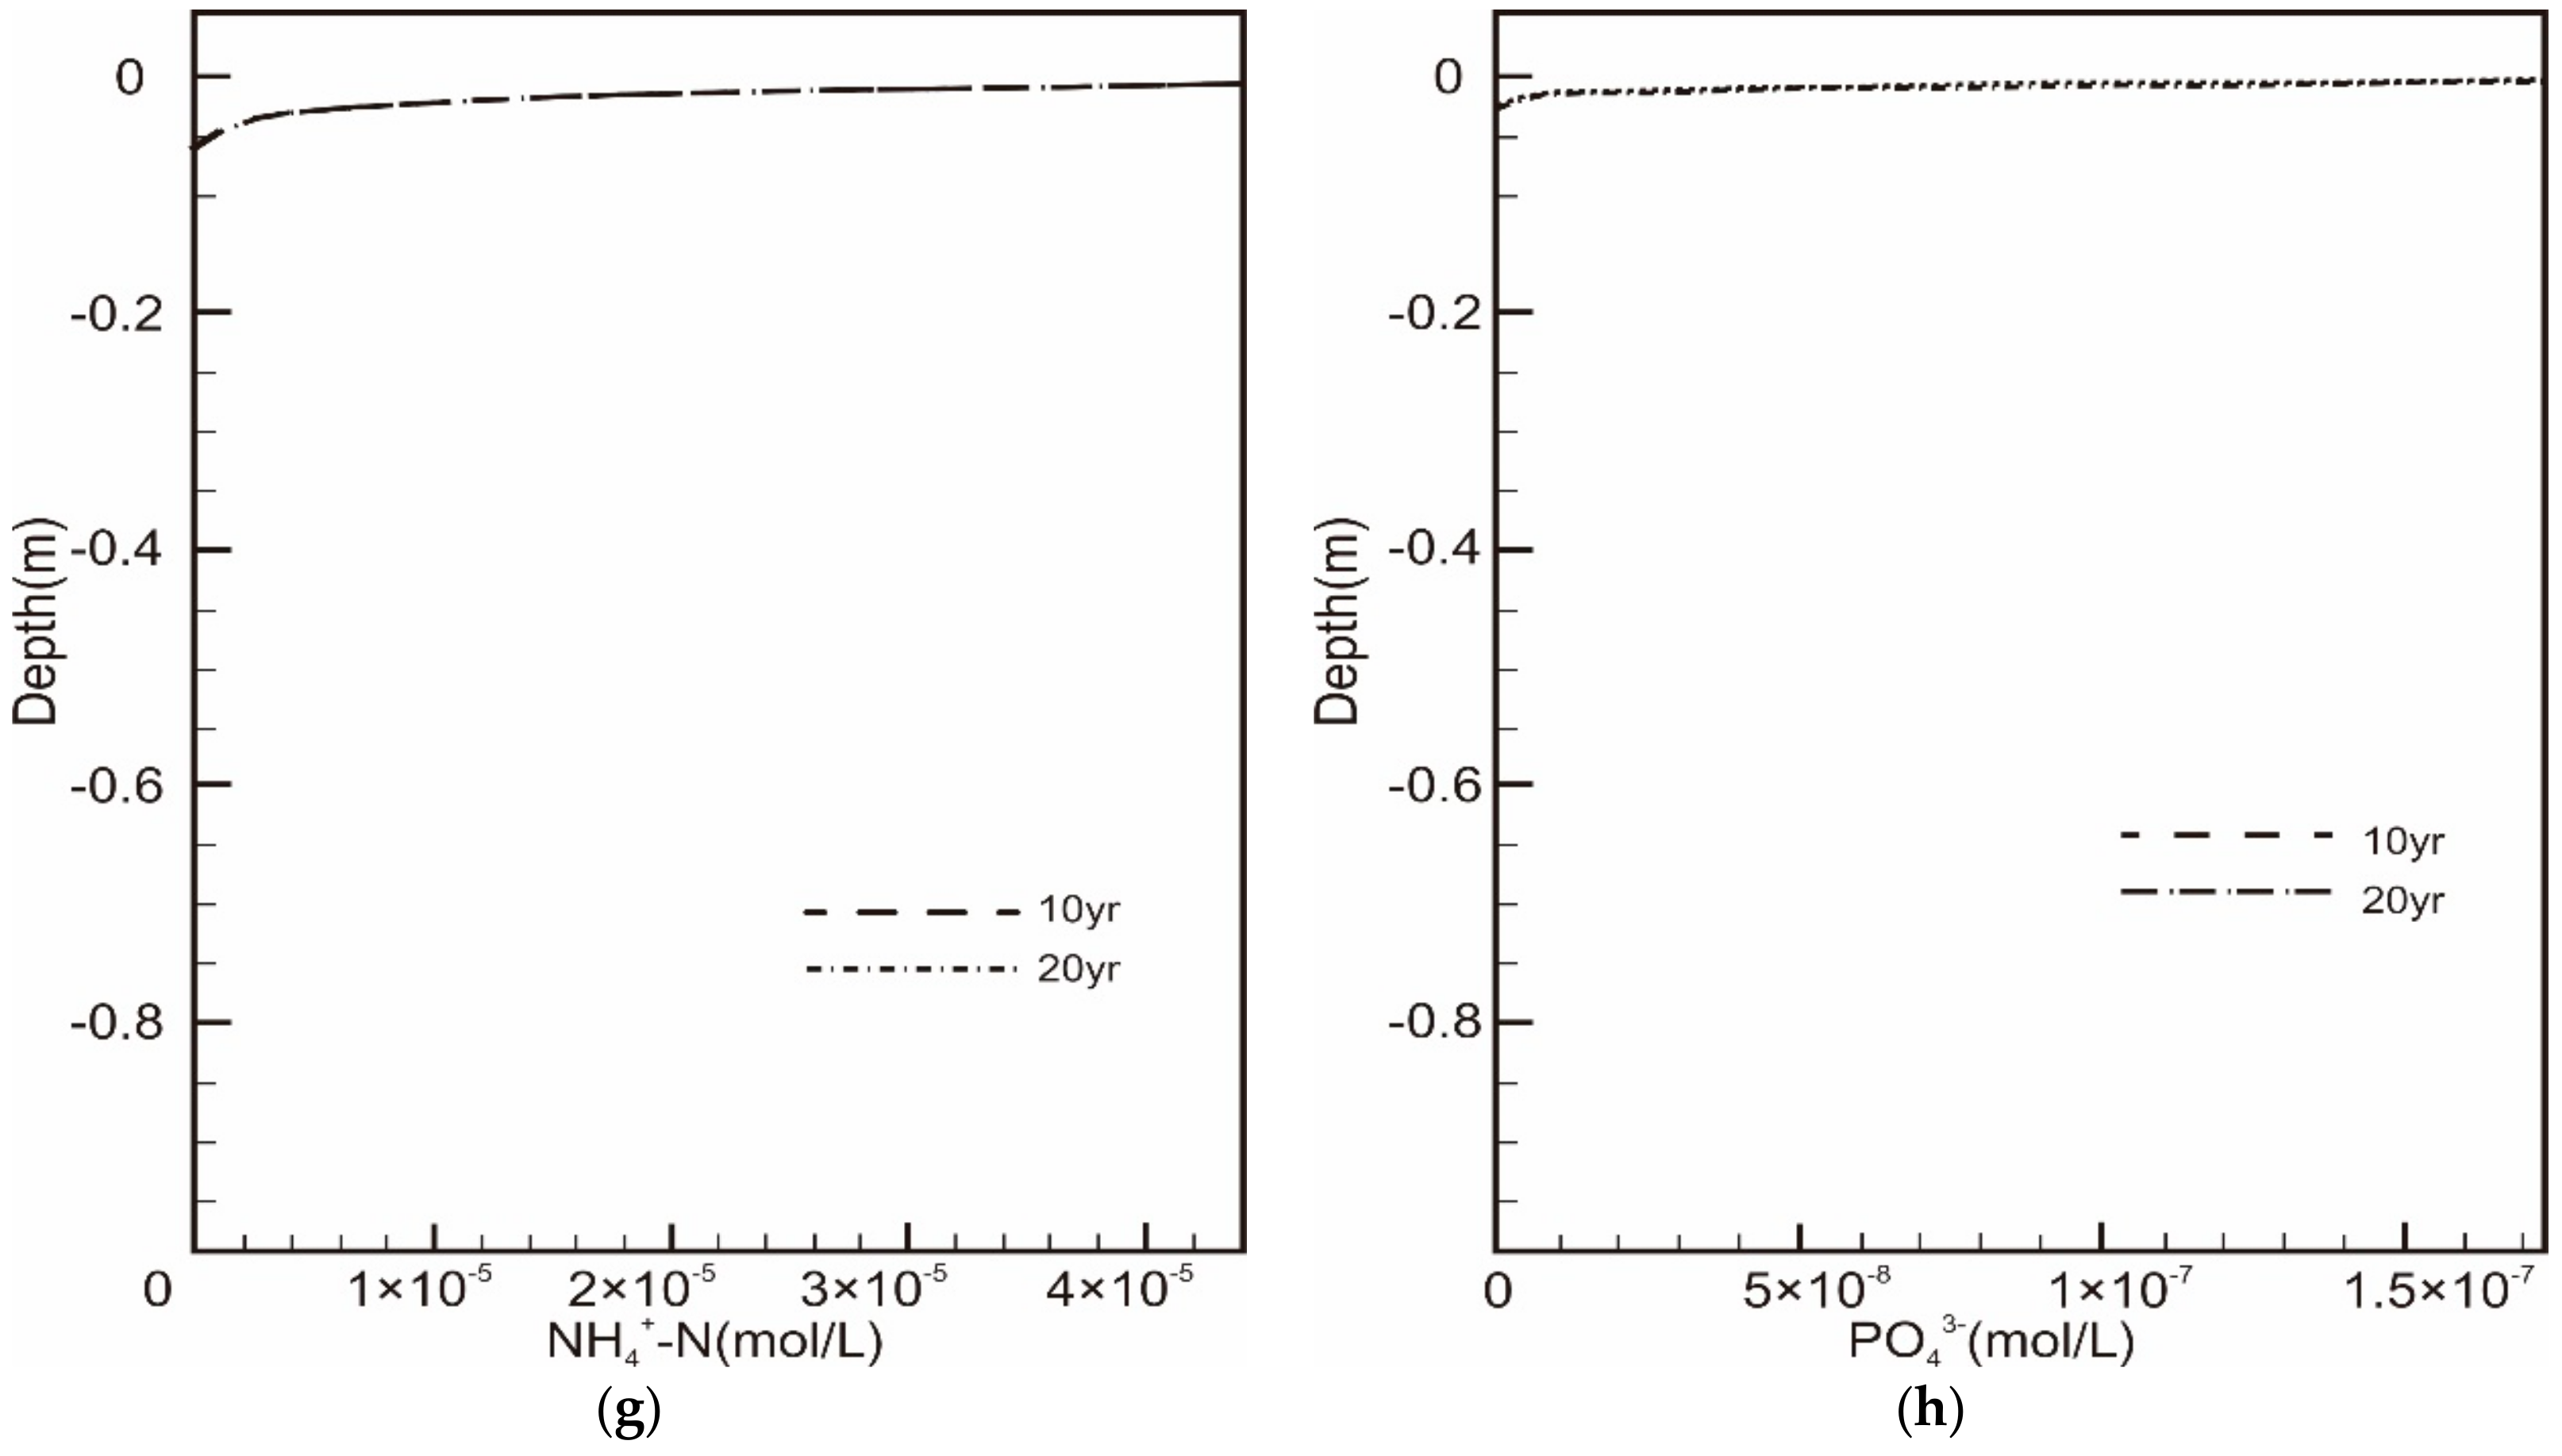
3.2. Pollution Risk Analysis
3.3. Clogging Risk
3.3.1. Physical Clogging
3.3.2. Biological Clogging
3.3.3. Chemical Clogging
4. Conclusions
Author Contributions
Funding
Conflicts of Interest
References
- Madlener, R.; Sunak, Y. Impacts of urbanization on urban structures and energy demand: What can we learn for urban energy planning and urbanization management? Sustain. Cities Soc. 2011, 1, 45–53. [Google Scholar] [CrossRef]
- Liu, H.; Wei, W.; Wang, J.; Chen, L.; Yao, L.; Dong, B. Experimental study on typical city underlyings runoff process. Resour. Sci. 2015, 37, 2219–2227. [Google Scholar]
- Hao, J. Study on the Influence Factors of Runoff Reduction for Urban Impermeable Underlying Surface under Simulated Rainfall Condition. Master’s Thesis, Chongqing University, Chongqing, China, 2012. [Google Scholar]
- Holländer, H.M.; Mull, R.; Panda, S. A concept for managed aquifer recharge using ASR-wells for sustainable use of groundwater resources in an alluvial coastal aquifer in Eastern India. Phys. Chem. Earth 2009, 34, 270–278. [Google Scholar] [CrossRef]
- Dillon, P.; Toze, S.; Page, D.; Vanderzalm, J.; Bekele, E.; Sidhu, J.; Rinck-Pfeiffer, S. Managed aquifer recharge: Rediscovering nature as a leading edge technology. Water Sci. Technol. 2010, 62, 2338–2345. [Google Scholar] [CrossRef] [PubMed]
- Bouwer, H. Artificial recharge of groundwater: Hydrogeology and engineering. Hydrogeol. J. 2002, 10, 121–142. [Google Scholar] [CrossRef]
- Dillon, P. Water recycling via managed aquifer recharge in Australia. Bol. Geol. Y Min. 2009, 120, 121–130. [Google Scholar]
- Vanderzalm, J.L.; Page, W.D.; Barry, K.E.; Dillon, P.J. A comparison of the geochemical response to different managed aquifer recharge operations for injection of urban stormwater in a carbonate aquifer. Appl. Geochem. 2010, 25, 1350–1360. [Google Scholar] [CrossRef]
- Anderson, J. The environmental benefits of water recycling and reuse. Water Sci. Technol. Water Supply 2003, 3, 1–10. [Google Scholar] [CrossRef]
- Asano, T.; Cotruvo, J.A. Groundwater recharge with reclaimed municipal wastewater: Health and regulatory considerations. Water Res. 2004, 38, 1941–1951. [Google Scholar] [CrossRef]
- Dillon, P.; Pavelic, P.; Toze, S.; Rinck-Pfeiffer, S.; Martin, R.; Knapton, A.; Pidsley, D. Role of aquifer storage in water reuse. Desalination 2006, 188, 123–134. [Google Scholar] [CrossRef]
- Hochstrat, R.; Wintgens, T.; Kazner, C.; Jeffrey, P.; Jefferson, B.; Melin, T. Managed aquifer recharge with reclaimed water: Approaches to a European guidance framework. Water Sci. Technol. 2010, 62, 1265. [Google Scholar] [CrossRef] [PubMed]
- Shannak, S.D.A.; Jaber, F.H.; Lesikar, B.J. Modeling the Effect of Cistern Size, Soil Type, and Irrigation Scheduling on Rainwater Harvesting as a Stormwater Control Measure. Water Resour. Manag. 2014, 28, 4219–4235. [Google Scholar] [CrossRef]
- Sakthivadivel, R.; Giordano, M.; Villholth, K.G. The groundwater recharge movement in India. Agr. Groundwater Revolution 2007, 22, 435–449. [Google Scholar]
- Mankad, A.; Walton, A.; Alexander, K. Key dimensions of public acceptance for managed aquifer recharge ofurban stormwater. J. Clean. Prod. 2015, 89, 214–223. [Google Scholar] [CrossRef]
- Pitt, R.; Clark, S.; Field, R. Groundwater contamination potential from stormwater infiltration practices. Urban Water 1999, 1, 217–236. [Google Scholar] [CrossRef]
- Angrill, S.; Petit-Boix, A.; Morales-Pinzón, T.; Josa, A.; Rieradevall, J.; Gabarrell, X. Urban rainwater runoff quantity and quality–A potential endogenous resource in cities? J. Environ. Manag. 2017, 189, 14–21. [Google Scholar] [CrossRef] [PubMed]
- Llopart-Mascaró, A.; Ruiz, R.; Martínez, M.; Malgrat, P.; Rusiñol, M.; Gil, A.; Suárez, J.; Puertas, J.; del Rio, H.; Paraira, M.; et al. Analysis of Rainwater Quality. Towards a Sustainable Rainwater Management in Urban Environments-Sostaqua Project; NOVATECH: La Ciotat, France, 2010. [Google Scholar]
- Deletic, A.; Orr, D.W. Pollution buildup on road surfaces. J. Environ. Eng. 2005, 131, 49–59. [Google Scholar] [CrossRef]
- Lygren, E.; Gjessing, E.; Berglind, L. Pollution transport from a highway. Sci. Total Environ. 1984, 33, 147–159. [Google Scholar] [CrossRef]
- Muschack, W. Pollution of street run-off by traffic and local conditions. Sci. Total Environ. 1990, 93, 419–431. [Google Scholar] [CrossRef]
- Sörme, L.; Lagerkvist, R. Sources of heavy metals in urban wastewater in Stockholm. Sci. Total Environ. 2002, 298, 131–145. [Google Scholar] [CrossRef]
- Hou, P.; Ren, Y.; Wang, X.; Ouyang, Z.; Zhou, X. Research on Evaluation of Water Quality of Beijing Urban Stormwater Runoff. Environ. Sci. 2012, 33, 71–75. [Google Scholar]
- Zhao, L. On Technical Scheme for Comprehensive Utilization of Rainwater Resource in Weifang. Munic. Eng. Technol. 2016, 34, 118–121. [Google Scholar]
- Wang, X.; Yu, L.; Wu, K. Analysis of rain water quality from different underlying surfaces in Xi’ an and the design of road drainage project. J. Xi’an Univ. Archit. Technol. Nat. Sci. Ed. 2017, 49, 555–560. [Google Scholar]
- Li, M.; Yu, X. Analysis on the Change Trend and Reuse of Rainwater Runoff in Jinan City. Environ. Pollut. Control 2008, 30, 98–99. [Google Scholar]
- Yan, W.; Han, Y.; He, Q. Characterization of Stormwater Runoff Pollution in Mountain City. J. Civ. Archit. Environ. Eng. 2011, 33, 136–142. [Google Scholar]
- Gan, H.; Zhuo, M.; Li, D.; Zhou, Y. Water quality characteristics of urban road rainwater runoff in Guangzhou. Ecol. Environ. 2006, 15, 969–973. [Google Scholar]
- Wu, S.; Dong, X. Water quality change characteristics and reuse analysis of rainwater runoff in Xiasha Economic Development Zone, Hangzhou. Water Sav. Irrig. 2011, 10, 48–50. [Google Scholar]
- Li, Y.; Liang, Y.; Yang, Y.; Li, C.; Xing, W. Pollution Characteristic Analysis and Utilization Study of Rainwater Runoff in Chengdu. China Rural Water Hydropower 2017, 93, 85–88. [Google Scholar]
- Liu, D.; Li, Q.; Li, T.; Wang, W.; Jin, Z. Study on Characteristics of Roof Runoff Water Quality in the Northern Coastal City and Its Influencing Factors. Environ. Sci. Technol. 2016, 39, 100–105. [Google Scholar]
- Zhang, H. Laboratory Research on the Laws of Fe(III) Clogging during Urban Stormwater Groundwater Recharge. Master’s Thesis, Jilin University, Jilin, China, 2017. [Google Scholar]
- Liu, Y. Monitoring and Analysis of Concentration Characteristics of Non-point Source Pollutants in Summer Rainwater Runoff in Chaoyang City. Technol. Soil Water Conserv. 2017, 6, 11–14. [Google Scholar]
- Dong, W.; Li, H.; Li, J. Monitoring and Analysis on Evolution Process of Rainfall Runoff Water Quality in Urban Area. Environ. Sci. 2013, 34, 561–569. [Google Scholar]
- Tian, S. Pollution Characteristics and Ecological Utilization of Stormwater Runoff in Nothern Cities. Master’s Thesis, Hebei University of Engineering, Hubei, China, 2013. [Google Scholar]
- Li, C.; Liu, K.; Lin, J.; Tang, W. Analysis on Water-Runoff Pollutions of Different Underlying Urban Surfaces in Haikou City. Environ. Monit. China 2013, 5, 80–83. [Google Scholar]
- Li, H.; Shi, J.Q.; Shen, G.; Ji, X.L.; Fu, D.F. Characteristics of Metals Pollution in Expressway Stormwater Runoff. Environ. Sci. 2009, 30, 1621–1625. [Google Scholar]
- Yuan, H.; Shi, J.; Shen, G.; Ji, X.; Fu, D. Heavy Metals Pollution of Seasonal Variation Runoff in Xi’an. Ecol. Environ. Sci. 2014, 23, 1170–1174. [Google Scholar]
- Li, Q.; Li, T.; Zhao, Q.; Liu, D.; Jin, Z. Characteristics of heavy metal pollution in road rainfall-runoff of Tianjin city. Ecol. Environ. Sci. 2011, 20, 143–148. [Google Scholar]
- Dong, W.; Chen, X.; Wei, J.; Zhao, Z. Characteristics of heavy metal pollution in road-runoff in Urumqi city. Environ. Eng. 2014, 32, 105–110. [Google Scholar]
- Westerlund, C.; Viklander, M. Particles and associated metals in road runoff during snowmelt and rainfall. Sci. Total Environ. 2006, 362, 143–156. [Google Scholar] [CrossRef]
- Che, W.; Liu, Y.; Li, J. Urban rainwater quality and pollution control at home and abroad. Water Wastewater Eng. 2003, 29, 38–42. [Google Scholar]
- Barrett, M.E.; Irish, L.B., Jr.; Charbeneau, R.J. Characterization of highway runoff in Austin, Texas, area. J. Environ. Eng. 1998, 124, 131–137. [Google Scholar] [CrossRef]
- Li, M.; Barrett, M.E. Relationship between antecedent dry period and highway pollutant: Conceptual models of buildup and removal processes. Water Environ. Res. 2008, 80, 740–747. [Google Scholar] [CrossRef]
- Kayhanian, M.; Singh, A.; Suverkropp, C.; Borroum, S. Impact of annual average daily traffic on highway runoff pollutant concentrations. J. Environ. Eng. 2003, 129, 975–990. [Google Scholar] [CrossRef]
- Sansalone, J.; Buchberger, S. Partitioning and first flush of metals in urban roadway storm water. J. Environ. Eng. 1997, 123, 134–143. [Google Scholar] [CrossRef]
- Flint, K.R.; Davis, A.P. Pollutant Mass Flushing Characterization of Highway Stormwater Runoff from an Ultra-Urban Area. J. Environ. Eng. 2007, 133, 616–626. [Google Scholar] [CrossRef]
- Hu, A.; Li, Z.; Zhang, S.; Liu, J.; Chen, J. Progress of the research of urban road rainwater runoff quality. Geomat. World 2010, 36, 123–127. [Google Scholar]
- Lee, B.C.; Matsui, S.; Shimizu, Y.; Matsuda, T.; Tanaka, Y. A new installation for treatment of road runoff: Up-flow filtration by porous polypropylene media. Water Sci. Technol. 2005, 52, 225–232. [Google Scholar] [CrossRef] [PubMed]
- Pagotto, C.; Legret, M.; Cloirec, P.L. Comparison of the hydraulic behaviour and the quality of highway runoff water according to the type of pavement. Water Res. 2000, 34, 4446–4454. [Google Scholar] [CrossRef]
- Stotz, G.; Krauth, K. The pollution of effluents from pervious pavements of an experimental highway section: First results. Sci. Total Environ. 1994, 146–147, 465–470. [Google Scholar] [CrossRef]
- Charters, F.J.; Cochrane, T.A.; O’Sullivan, A.D. Untreated runoff quality from roof and road surfaces in a low intensity rainfall climate. Sci. Total Environ. 2016, 550, 265–272. [Google Scholar] [CrossRef] [PubMed]
- Gnecco, I.; Berretta, C.; Lanza, L.G.; la Barbera, P. Storm water pollution in the urban environment of Genoa, Italy. Atmos. Res. 2005, 77, 60–73. [Google Scholar] [CrossRef]
- Doamekpor, L.K.; Darko, R.; Klake, R.K.; Samlafo, V.B.; Bobobee, L.H.; Akpabli, C.K.; Nartey, V.K. Assessment of the Contribution of Road Runoffs to Surface Water Pollution in the New Juaben Municipality, Ghana. J. Geosci. Environ. Prot. 2016, 4, 173–190. [Google Scholar] [CrossRef]
- Despins, C.; Farahbakhsh, K.; Leidl, C. Assessment of rainwater quality from rainwater harvesting systems in Ontario, Canada. Aqua 2009, 58, 117–134. [Google Scholar] [CrossRef]
- Förster, J. Patterns of roof runoff contamination and their potential implications on practice and regulation of treatment and local infiltration. Water Sci. Technol. 1996, 33, 39–48. [Google Scholar] [CrossRef]
- Förster, J. Variability of roof runoff quality. Water Sci. Technol. 1999, 39, 137–144. [Google Scholar] [CrossRef]
- Wang, S. Study on the Spatial-Temporal Distribution Characteristic of Nonpoint Source Pollution in Mountainous City. Ph.D. Thesis, Chongqing University, Chongqing, China, 2012. [Google Scholar]
- Hao, L. Study on Runoff Pollution and Control of Rainfall at Different Underlying Surfaces in Urban Residential Area of Chongqing. Master’s Thesis, Xi’nan University, Chongqing, China, 2012. [Google Scholar]
- Gao, Y. Study on the Characteristic of Diffuse Pollution and Its Control in the Residential Area of Mountain Urban. Master’s Thesis, Huazhong Agricultural University, Wuhan, China, 2011. [Google Scholar]
- Li, L.Q.; Zhu, R.X.; Guo, S.G.; Yin, C.Q. Research on Spatial Differentiation of Urban Stormwater Runoff Quality by Source Area Monitoring. Environ. Sci. 2010, 31, 2896–2904. [Google Scholar]
- Zhang, K. Study on Characteristic of Pollution in Roof Stormwater Runoff. Master’s Thesis, Dongnan University, Nanjing, China, 2011. [Google Scholar]
- Hu, K. Research on the Water Quality Evaluation and Use of Rain on City Area. Master’s Thesis, Harbin Institute of Technology, Harbin, China, 2009. [Google Scholar]
- Wang, J.; Jing, H.; Wang, H.; Zhao, D. Monitoring and Analysis of Rainfall Runoff Pollution Characteristics in Beijing City. Water Wastewater Eng. 2011, S1, 135–139. [Google Scholar]
- Dong, X.; Du, P.; Li, Z.; Yu, Z.; Wang, R.; Huang, J. Hydrology and Pollution Characteristics of Urban Runoff: Beijing as a Sample. Environ. Sci. 2008, 29, 607–612. [Google Scholar]
- Wang, S.; Li, M.; Zhang, L. Characteristics Analysis of Heavy Metal Pollution in Runoff from Different Types of Roof. Urban Environ. Urban Ecol. 2015, 28, 35–38. [Google Scholar]
- Zhou, S.; Luo, H.; Zhao, C. Analysis on Rainwater Quality of Rainy Season in Nanjing. For. Eng. 2017, 33, 60–63. [Google Scholar]
- Ren, Y.; Wang, X.; Ouyang, Z.; Miao, H.; Zheng, H. Research on variationsof asphalt felt roof runoff pollutant concentrations during the rain fall. Acta Sci. Circumst. 2006, 26, 601–606. [Google Scholar]
- Zhang, K.; Li, H.; Fu, D.; Zhou, F.; Chen, M. Characteristics of heavy metal pollution in runoff from three different types of roofs. Acta Sci. Circumst. 2011, 31, 724–730. [Google Scholar]
- Huang, J.; Du, P.; Ao, C.; Lei, M.; Zhao, D.; Ho, M.; Wang, Z. Preliminary investigation on characterization of urban roof runoff in Macau. Acta Sci. Circumst. 2006, 26, 1076–1081. [Google Scholar]
- Liao, R.; Ding, Y.; Hu, X.; Chen, J.; Zhang, S. Analysis and evaluation of water quality of rainfall and runoff in urban area in Beijing. Beijing Water 2007, 1, 14–16. [Google Scholar]
- Hou, L.; Ding, Y.; Feng, S.; Zhang, S.; Chen, J.; Liao, R. Comparison of Water Quality of Rainwater Runoff from Different Underlying Surfaces in Beijing City. China Water Wastewater 2006, 22, 35–38. [Google Scholar]
- Ma, Y.; Ma, Y.-W.; Wan, J.-Q.; Wang, Y.; Huang, M.-Z. Characterization of rainfall runoff pollution transportation in different underlying surface of Dongguan City. China Environ. Sci. 2011, 31, 1983–1990. [Google Scholar]
- Ren, Y.; Ma, Y.W.; Wan, J.; Wang, Y.; Huang, M. Chemical analysis on stormwater—Runoffpollution of different underlying urban surfaces. Acta Ecol. Sin. 2005, 25, 3225–3230. [Google Scholar]
- Wang, X.; Lai, Q.; Du, J.; Bao, Y.; Zheng, W.; Ye, F. Analysis on water r-runoff pollution of different underlying surfaces in Ningbo. Environ. Eng. 2016, S1, 312–316. [Google Scholar]
- Shi, G. Studying on the Water Quality Characteristic and Resource Utilization of Runoff Rainwater for the Urban Residential Communitys in Kunming City. Master’s Thesis, Kunming University of Science and Technology, Kunming, China, 2013. [Google Scholar]
- Pruess, K. The TOUGH codes—A family of simulation tools for multiphase flow and transport processes in permeable media. Vadose Zone J. 2004, 3, 738–746. [Google Scholar]
- Xu, T.; Spycher, N.; Sonnenthal, E.; Zhang, G.; Zheng, L.; Pruess, K. TOUGHREACT Version 2.0: A simulator for subsurface reactive transport under non-isothermal multiphase flow conditions. Comput. Geosci. 2011, 37, 763–774. [Google Scholar] [CrossRef]
- Tazehkand, S.S.; Torkzaban, S.; Bradford, S.A.; Walker, S.L. Cell preparation methods influence Escherichia coli D21g surface chemistry and transport in saturated sand. J. Environ. Qual. 2008, 37, 2108–2115. [Google Scholar] [CrossRef]
- Adamczyk, Z.; Siwek, B.; Zembala, M.; Belouschek, P. Kinetics of localized adsorption of colloid particles. Adv. Colloid Interface Sci. 1994, 48, 151–280. [Google Scholar] [CrossRef]
- Pérez Paricio, A. Integrated Modelling of Clogging Processes in Artificial Groundwater Recharge. Ph.D. Thesis, Universitat Politècnica de Catalunya, Barcelona, Spain, 2001. [Google Scholar]
- Buik, N.; Willemsen, G. Clogging rate of recharge wells in porous media. In Proceedings of the 4th International Symposium on Artificial Recharge of Groundwater, Adelaide, Australia, 22–26 September 2002. [Google Scholar]
- Dillon, P.; Pavelic, P.; Massmann, G. Enhancement of the membrane filtration index (MFI) method for determining the clogging potential of turbid urban stormwater and reclaimed water used for aquifer storage and recovery. Desalination 2001, 140, 153–165. [Google Scholar] [CrossRef]
- CEQSSW. Environmental Quality Standards for Surface Water. Available online: http://www.chinawaterrisk.org/research-reports/environmental-quality-standards-for-surface-water-gb3838-2002/ (accessed on 24 August 2019).
- Sun, J.; Xu, S. Modeling Cu/Pb/Zn/Cd transport in quartz sand column. Acta Pedol. Sin. 2010, 47, 1101–1109. [Google Scholar]
- Sun, J. Migration Law and Simulation Prediction of Cu/Pb/Zn/Cd in Porous Media. Master’s Thesis, Qingdao University, Qingdao, China, 2009. [Google Scholar]
- Clark, S.E.; Pitt, R.; Field, R. Groundwater contamination potential from infiltration of urban stormwater runoff. In Effects of Urbanization on Groundwater: An Engineering Case-Based Approach for Sustainable Development; Chang, N.B., Ed.; American Society of Civil Engineers: Reston, VA, USA, 2010; pp. 119–156. [Google Scholar]
- Rice, R.C. Soil Clogging during Infiltration of Secondary Effluent. Water Pollut. Control Fed. 1974, 46, 708–716. [Google Scholar]
- Vialle, C.; Sablayrolles, C.; Lovera, M.; Jacob, S.; Huau, M.C.; Montrejaud-Vignoles, M. Monitoring of water quality from roof runoff: Interpretation using multivariate analysis. Water Res. 2011, 45, 3765–3775. [Google Scholar] [CrossRef] [PubMed]
- Peters, J.; Jensen, K. Artificial Recharge of Groundwater. In Proceedings of the Third International Symposium on Artificial Recharge of Groundwater, Amsterdam, The Netherlands, 21–25 September 1998. [Google Scholar]
- Vigneswaran, S.; Suazo, R.B. A detailed investigation of physical and biological clogging during artificial recharge. Water Air Soil Pollut. 1987, 35, 119–140. [Google Scholar] [CrossRef]
- Baveye, P.; Vandevivere, P.; Hoyle, B.L.; DeLeo, P.C.; de Lozada, D.S. Environmental Impact and Mechanisms of the Biological Clogging of Saturated Soils and Aquifer Materials. Crit. Rev. Environ. Sci. Technol. 1998, 28, 123–191. [Google Scholar] [CrossRef]
- Oberdorfer, J.A.; Peterson, F.L. Waste-Water Injection: Geochemical and Biogeochemical Clogging Processes. Ground Water 2010, 23, 753–761. [Google Scholar] [CrossRef]
- Martin, R. Clogging Remediation Methods to Restore Well Injection Capacity. In Clogging Issues Associated with Managed Aquifer Recharge Methods; International Association of Hydrogeologists: London, UK, 2013; p. 207. [Google Scholar]
- Thullner, M. Comparison of bioclogging effects in saturated porous media within one-and two-dimensional flow systems. Ecol. Eng. 2010, 36, 176–196. [Google Scholar] [CrossRef]
- Beal, C.D.; Gardner, E.A.; Kirchhof, G.; Menzies, N.W. Long term flow rates and biomat zone hydrology in soil columns receiving septic tank effluent. Water Res. 2006, 40, 2327–2338. [Google Scholar] [CrossRef]
- Huang, Y.; Liu, D.; An, S. Effects of slope aspect on soil nitrogen and microbial properties in the Chinese Loess region. CATENA 2015, 125, 135–145. [Google Scholar] [CrossRef]
- Francisca, F.M.; Glatstein, D.A. Long term hydraulic conductivity of compacted soils permeated with landfill leachate. Appl. Clay Sci. 2010, 49, 1l87–l193. [Google Scholar] [CrossRef]
- Vandenbohede, A.; Houtte, E.V.; Lebbe, L. Water quality changes in the dunes of the western Belgian coastal plain due to artificial recharge of tertiary treated wastewater. Appl. Geochem. 2009, 24, 370–382. [Google Scholar] [CrossRef]
- Pavelic, P.; Dillon, P.J.; Mucha, M.; Nakai, T.; Barry, K.E.; Bestland, E. Laboratory assessment of factors affecting soil clogging of soil aquifer treatment system. Water Res. 2011, 45, 3153–3163. [Google Scholar] [CrossRef] [PubMed]
- Cardoso, F.; Shelton, D.; Sadeghi, A.; Shirmohammadi, A.; Pachepsky, Y.; Dulaney, W. Effectiveness of vegetated filter strips in retention of Escherichia coli and Salmonella from swine manure slurry. J. Environ. Manag. 2012, 110, 1–7. [Google Scholar] [CrossRef] [PubMed]
- Qureshi, A.A.; Dutka, B.J. Microbiological studies on the quality of urban stormwater runoff in Southern Ontario, Canada. Water Res. 1979, 13, 977–985. [Google Scholar] [CrossRef]
- Schillinger, J.E.; Gannon, J.J. Bacterial Adsorption and Suspended Particles in Urban Stormwater. Water Pollut. Control Fed. 1985, 57, 384–389. [Google Scholar]
- Selvakumar, A.; Borst, M. Variation of microorganism concentrations in urban stormwater runoff with land use and seasons. J. Water Health 2006, 4, 109. [Google Scholar] [CrossRef]
- Zhang, Y.; Hunt, H.K.; Hu, Z. Application of bacteriophages to selectively remove Pseudomonas aeruginosa in water and wastewater filtration systems. Water Res. 2013, 47, 4507–4518. [Google Scholar] [CrossRef]
- Kähler, P.; Bjornsen, P.K.; Lochte, K.; Antia, A. Dissolved organic matter and its utilization by bacteria during spring in the Southern Ocean. Deep Sea Res. II Top. Stud. Oceanogr. 1997, 44, 341–353. [Google Scholar] [CrossRef]
- Lauderdale, C.; Chadik, P.; Kirisits, M.J.; Brown, J. Engineered biofiltration: Enhanced biofilter performance through nutrient and peroxide addition. J. Am. Water Works Assoc. 2012, 104, E298–E309. [Google Scholar] [CrossRef]
- Xia, L. Study on the Mechanism and Control Technology of Bioclogging in Artifical Recharge Aquifer. Ph.D. Thesis, Ocean University of China, Qingdao, China, 2015. [Google Scholar]
- Page, D.; Vanderzalm, J.; Miotliński, K.; Barry, K.; Dillon, P.; Lawrie, K.; Brodie, R.S. Demonstrating treatment requirements for turbid river water to avoid clogging of aquifer storage and recovery wells in siliceous alluvium. Water Res. 2014, 66, 99–110. [Google Scholar] [CrossRef] [PubMed]
- Jeong, H.; Jun, S.; Cheon, J.; Park, M. A review on clogging mechanisms and managements in aquifer storage and recovery (ASR) applications. Geosci. J. 2018, 22, 667–679. [Google Scholar] [CrossRef]
- Vandevivere, P.; Baveye, P. Effect of bacterial extracellular polymers on the saturated hydraulic conductivity of sand columns. Appl. Environ. Microbiol. 1992, 58, 1690–1698. [Google Scholar] [PubMed]
- Martin, R. Clogging Issues Associated with Managed Aquifer Recharge Methods; International Association of Hydrogeologists: London, UK, 2013. [Google Scholar]
- Page, D.; Dillon, P.; Vanderzalm, J.; Bekele, E.; Barry, K.; Miotlinski, K.; Levett, K. Managed Aquifer Recharge Case Study Risk Assessments; National Water Commission: Kingston, Jamaica, 2010. [Google Scholar]
- Van Beek, C.G.E.M. Rehabilitation of clogged discharge wells in the Netherlands. Q. J. Eng. Geol. Hydrogeol. 1989, 22, 75–80. [Google Scholar] [CrossRef]
- Vanderzalm, J.; Levett, K.; Page, D.; Dillon, P.; Toze, S. Assessing the Risks of Recycling Urban Stormwater for Potable Supply via an Aquifer. In STORMWATER 2010: National Conference of the Stormwater IndustryAssociation Conference Proceedings; National Conference of the Stormwater Industry Association: Sydney, Australia, 2010; pp. 1–9. [Google Scholar]
- Aryal, R.; Vigneswaran, S.; Kandasamy, J.; Naidu, R. Urban stormwater quality and treatment. Korean J. Chem. Eng. 2010, 27, 1343–1359. [Google Scholar] [CrossRef]


| City | TSS | COD | NH3-N | TN | TP | References |
|---|---|---|---|---|---|---|
| Beijing | 53.45 | 67.52 | 2.9 | 5.88 | 0.2 | [23] |
| Weifang | - | 62.67 | 1.34 | 42.89 | 0.76 | [24] |
| Xian | 1020 | - | 7.9 | 45.4 | 0.4 | [25] |
| Jinan | 969.25 | 101.22 | 5.74 | 3.87 | 0.31 | [26] |
| Chongqing | 1730 | 76.3 | 3.7 | - | 0.24 | [27] |
| Guangzhou | 439 | 373 | - | 11.71 | 0.49 | [28] |
| Hangzhou | 152 | - | 0.68 | 5.58 | 0.109 | [29] |
| Chengdu | 801.17 | 484.48 | - | 3.92 | 0.12 | [30] |
| Tianjin | 524 | 132 | 7.65 | 12.37 | 0.89 | [31] |
| Changchun | - | 9.14 | 0.97 | - | - | [32] |
| Chaoyang | - | 30 | 1.21 | 1.71 | - | [33] |
| Baoji | 179.70 | 120.04 | 2.89 | 5.85 | 0.448 | [34] |
| Handan | 357.72 | 264.29 | 7.33 | 10.42 | 0.93 | [35] |
| Haikou | 244 | 114.2 | - | 0.95 | 0.13 | [36] |
| City | Zn | Pb | Cu | Cd | Fe | Mn | References |
|---|---|---|---|---|---|---|---|
| Beijing | 0.027 | 0.003 | 0.027 | - | - | - | [23] |
| Guangzhou | 2.06 | 0.115 | 0.16 | 0.0016 | - | 0.348 | [28] |
| Nanjing | 0.56 | 0.053 | 0.101 | 0.0014 | 0.463 | - | [37] |
| Changchun | 0.367 | - | 0.023 | - | 1.098 | - | [32] |
| Weifang | 0.02 | - | 0.01 | - | - | - | [24] |
| Shanghai | 0.06 | 0.00029 | - | 0.001 | - | 0.01 | [38] |
| Tianjin | - | - | 0.011 | 0.010 | - | - | [39] |
| Urumchi | 1.390 | 1.954 | 0.322 | 0.0058 | - | - | [40] |
| Lulea | 0.15 | 0.0166 | - | 0.0383 | - | - | [41] |
| Paris | 0.55 | 0.133 | 0.061 | 0.0006 | - | - | [42] |
| Texas | 0.1528 | 0.0112 | - | 0.0239 | 1.491 | - | [43,44] |
| California | - | 0.017 | - | 0.0094 | - | - | [45] |
| Ohio | 0.459 | 0.037 | 0.043 | 0.005 | 4.136 | 0.324 | [46] |
| Maryland | 1.18 | 0.22 | 0.11 | 0.035 | - | - | [47] |
| Los Angeles | 0.506 | 0.033 | 0.931 | 0.0025 | - | - | [48] |
| Otsu | 0.268 | 0.014 | 0.036 | 0.0002 | - | 0.066 | [49] |
| Nantes, France | 0.32 | 0.057 | 0.036 | 0.0013 | - | - | [50] |
| Weins | 0.441 | 0.137 | 0.049 | 0.0009 | 2.2 | - | [51] |
| Christchurch | 0.102 | 0.007 | 0.026 | - | - | - | [52] |
| Genoa | 0.081 | 0.013 | 0.019 | - | - | - | [53] |
| Ghaha | 0.678 | 0.409 | 0.343 | 0.035 | 2.31 | - | [54] |
| Cities | Roof Type | COD | TSS | TN | TP | NH3-N | References |
|---|---|---|---|---|---|---|---|
| Jiangbei, District, Chongqing | tile | 39 | 26 | 3.70 | 0.09 | 1.00 | [58] |
| Yubei District, Chongqing | tile | 48.10 | 37.00 | 4.03 | 0.12 | 1.19 | [59] |
| Yubei District, Chongqing | tile | 147.00 | 61.70 | 4.23 | 0.35 | 1.46 | [60] |
| Chongqing University | tile | 64.30 | 700.00 | - | 0.07 | 5.60 | [27] |
| Wuhan Wulidun | tile | 46.00 | 16.30 | 1.98 | 0.08 | - | [61] |
| Nanjing | tile | 39.80 | 77.40 | 5.80 | 0.27 | - | [62] |
| Beijing | tile | 123 | 136.00 | - | - | - | [42] |
| Tianjin | tile | 99 | 249 | 11.92 | 0.12 | 6.37 | [31] |
| Weifang | tile | 35.97 | - | 1.79 | 0.71 | 29.39 | [24] |
| Harbin | asphalt | 111.8 | 110.3 | - | 0.21 | 1.37 | [63] |
| Yubei District, Chongqing | asphalt | 44.70 | 8.30 | 3.63 | 0.06 | 1.36 | [60] |
| Chongqing University | asphalt | 74.30 | 200.00 | - | 0.16 | 2.70 | [27] |
| China Academy of Science, Bejing | asphalt | 68.91 | 37.70 | 11.75 | 0.08 | 5.67 | [23] |
| Middle layer, Tsinghua University | asphalt | 95.97 | 34.36 | 11.81 | 0.09 | 7.56 | [64] |
| High layer, Tsinghua University | asphalt | 341.27 | 39.32 | 25.25 | 0.11 | 14.73 | [64] |
| Nanjing | asphalt | 51.30 | 50.20 | 7.30 | 0.24 | - | [62] |
| Wuhan, Wulidun | asphalt | 61.50 | 46.70 | 4.18 | 0.34 | - | [61] |
| Beijing | asphalt | 328.00 | 136.0 | 9.80 | 0.94 | - | [42] |
| Tianjin | asphalt | 126 | 452 | 10.75 | 0.18 | 7.69 | [31] |
| Development, Hangzhou | asphalt | 3.62 | 33.6 | 3.69 | 0.077 | 0.18 | [29] |
| Handan | asphalt | 277.50 | 329.10 | 6.97 | 9.90 | 0.85 | [35] |
| Yubei District, Chongqing | cement | 77.50 | 61.70 | 6.20 | 0.12 | 1.03 | [59] |
| Jiangbei, District, Chongqing | cement | 68 | 56 | 5.9 | 0.15 | 1.85 | [58] |
| Haikou | cement | 44.80 | 63.0 | 1.00 | 0.04 | - | [36] |
| Wuhan, Wilimiao | cement | 78.90 | 49.70 | 2.43 | 0.09 | - | [61] |
| Nanjing | cement | 49.00 | 47.20 | 7.00 | 0.19 | - | [62] |
| Beijing | cement | 115.99 | 27.00 | 8.26 | 0.71 | - | [65] |
| Shandong | cement | 85.05 | 351.5 | 6.27 | 0.16 | 6.82 | [26] |
| Cities | Roof Type | Zn | Pb | Cu | Cd | References |
|---|---|---|---|---|---|---|
| Beijing | tile | 0.408 | 0.026 | - | 0.0029 | [66] |
| Weifang | tile | 35.97 | - | 0.02 | - | [24] |
| Nanjing | tile | 0.022 | 0.01 | - | 0.00019 | [67] |
| Yubei District, Chongqing | tile | 0.0175 | 0.0048 | 0.006 | 0.0006 | [59] |
| Beijing | asphalt | 0.28 | 0.023 | - | 0.0015 | [66] |
| China Academy of science, Bejing | asphalt | 0.063 | 0.017 | 0.012 | 0.00007 | [68] |
| Nanjing | asphalt | 0.16 | 0.001 | 0.0075 | 0.00022 | [69] |
| Yubei District, Chongqing district | cement | 0.0328 | 0.0035 | 0.0089 | 0.0006 | [59] |
| Macao | cement | 0.029 | 0.0047 | - | - | [70] |
| Jiangbei District, Chongqing | cement | 0.32 | 0.564 | 0.08 | 0.05 | [58] |
| Cities | TSS | COD | TN | TP | NH3-N | References |
|---|---|---|---|---|---|---|
| Water research institute, Beijing | - | - | 2.56 | 0.15 | 1.05 | [71] |
| Water research institute, Beijing | 95 | 8.7 | - | - | 3.95 | [72] |
| Chongqing | 650 | 23 | - | 0.21 | 1.6 | [27] |
| Haikou | 127 | 38.2 | 0.68 | 0.2 | - | [36] |
| Dongguan | 87.42 (TSS) | 67.94 | 2.42 | 0.89 | 0.85 | [73] |
| China Academy of Science, Beijing | - | 120.37 | 6.80 | 0.74 | - | [74] |
| Xian | 76.23 | 53.27 | 5.3 | 0.57 | 3.7 | [25] |
| Ningbo | 321.2 | 56.05 | 0.856 | 0.894 | 0.336 | [75] |
| Kunming | 72.8 | 55 | 2.80 | 0.38 | 2.73 | [76] |
| Handan | 125.02 | 92.50 | 4.69 | 0.51 | 3.30 | [35] |
| Variables | Road Stormwater Quality | |||
|---|---|---|---|---|
| Median | Minimum | Maximum | Standard * | |
| TSS | 439.00 | 53.45 | 1730.00 | - |
| COD | 107.71 | 9.14 | 484.48 | 20 |
| TN | 5.87 | 0.95 | 45.40 | 1.0 |
| NH3-N | 2.90 | 0.68 | 7.90 | 1 |
| TP | 0.36 | 0.11 | 0.93 | 0.2 |
| Zn | 0.34 | 0.02 | 2.06 | 1 |
| Pb | 0.04 | 0.0003 | 1.95 | 1 |
| Cu | 0.04 | 0.01 | 0.93 | 1 |
| Cd | 0.005 | 0.0002 | 0.0383 | 0.005 |
| Fe | 1.85 | 0.463 | 4.14 | - |
| Mn | 0.20 | 0.01 | 0.35 | - |
| Variables | Units | Tile Roof Runoff Quality | Asphalt Roof Runoff Quality | Cement Roof Runoff Quality | Standard * | ||||||
|---|---|---|---|---|---|---|---|---|---|---|---|
| Med | Min | Max | Med | Min | Max | Med | Min | Max | |||
| TSS/SS | mg L−1 | 69.55 | 16.3 | 700 | 48.45 | 8.30 | 452.0 | 56.00 | 27.00 | 351.5 | - |
| COD | mg L−1 | 48.10 | 35.97 | 147.00 | 85.14 | 3.62 | 314.27 | 77.50 | 44.80 | 115.99 | 20 |
| TN | mg L−1 | 4.03 | 1.79 | 11.92 | 8.55 | 3.63 | 25.25 | 6.20 | 1.00 | 8.26 | 1.0 |
| NH3-N | mg L−1 | 3.53 | 1.00 | 29.39 | 2.70 | 0.18 | 14.73 | 1.85 | 1.03 | 6.82 | 1 |
| TP | mg L−1 | 0.12 | 0.07 | 0.71 | 0.17 | 0.06 | 9.9 | 0.15 | 0.04 | 0.71 | 0.2 |
| Zn | mg L−1 | 0.215 | 0.018 | 35.97 | 0.16 | 0.028 | 0.063 | 0.032 | 0.029 | 0.32 | 1 |
| Pb | mg L−1 | 0.01 | 0.005 | 0.026 | 0.017 | 0.001 | 0.023 | 0.005 | 0.004 | 0.564 | 1 |
| Cu | mg L−1 | 0.013 | 0.006 | 0.02 | 0.010 | 0.00752 | 0.012 | 0.044 | 0.009 | 0.08 | 1 |
| Cd | mg L−1 | 0.0006 | 0.0002 | 0.0029 | 0.0002 | 0.0001 | 0.0015 | 0.025 | 0.0006 | 0.05 | 0.005 |
| Variables | Units | Greenbelt Runoff Quality | Standard * | ||
|---|---|---|---|---|---|
| Med | Min | Max | |||
| TSS | mg L−1 | 110.01 | 72.80 | 650.00 | - |
| COD | mg L−1 | 55.00 | 8.70 | 120.37 | 20 |
| TN | mg L−1 | 2.68 | 0.68 | 6.80 | 1.0 |
| NH3-N | mg L−1 | 2.17 | 0.336 | 3.95 | 1 |
| TP | mg L−1 | 0.51 | 0.15 | 0.89 | 0.2 |
| Ions | References | ||
|---|---|---|---|
| Pb2+ | 4.00 × 10⁻⁴ | 3.48 × 10⁻⁴ | [85,86] |
| Zn2+ | 1.16 × 10⁻³ | 2.96 × 10⁻⁴ | |
| Cu2+ | 9.84 × 10⁻⁴ | 3.98 × 10⁻⁴ | |
| Cd2+ | 8.64 × 10⁻³ | 5.75 × 10⁻⁴ | |
| Fe3+ | 9.60 × 10⁻⁴ | 3.60 × 10⁻⁴ | |
| Mn2+ | 9.00 × 10⁻⁴ | 3.50 × 10⁻⁴ | |
| NH4+-N | 3.14 × 10⁻² | 1.624 | |
| PO42− | 4.08 × 10⁻² | 0.055 |
| Ions | Zn2+ | Pb3+ | Cu2+ | Cd2+ | Fe3+ | Mn2+ | NH4+-N | PO43− |
|---|---|---|---|---|---|---|---|---|
| Concentration(mol/kg) | 4.3 × 10⁻⁶ | 8.2 × 10⁻⁸ | 5.6 × 10⁻⁷ | 1.4 × 10⁻⁸ | 3.3 × 10⁻⁵ | 3.5 × 10⁻⁶ | 9.2 × 10⁻⁵ | 2.2 × 10⁻⁶ |
| Ions | Fe3+ | Zn2+ | Mn2+ | Cd2+, Pb2+, Cu2+, NH4+-N, PO43− | |
|---|---|---|---|---|---|
| Items | |||||
| Migration time (year) | 5 | 10 | 15 | >20 | |
| Risk rating | IV | III | II | I | |
© 2019 by the authors. Licensee MDPI, Basel, Switzerland. This article is an open access article distributed under the terms and conditions of the Creative Commons Attribution (CC BY) license (http://creativecommons.org/licenses/by/4.0/).
Share and Cite
Song, Y.; Du, X.; Ye, X. Analysis of Potential Risks Associated with Urban Stormwater Quality for Managed Aquifer Recharge. Int. J. Environ. Res. Public Health 2019, 16, 3121. https://doi.org/10.3390/ijerph16173121
Song Y, Du X, Ye X. Analysis of Potential Risks Associated with Urban Stormwater Quality for Managed Aquifer Recharge. International Journal of Environmental Research and Public Health. 2019; 16(17):3121. https://doi.org/10.3390/ijerph16173121
Chicago/Turabian StyleSong, Yalin, Xinqiang Du, and Xueyan Ye. 2019. "Analysis of Potential Risks Associated with Urban Stormwater Quality for Managed Aquifer Recharge" International Journal of Environmental Research and Public Health 16, no. 17: 3121. https://doi.org/10.3390/ijerph16173121
APA StyleSong, Y., Du, X., & Ye, X. (2019). Analysis of Potential Risks Associated with Urban Stormwater Quality for Managed Aquifer Recharge. International Journal of Environmental Research and Public Health, 16(17), 3121. https://doi.org/10.3390/ijerph16173121