The Relation Between Tobacco Tax Structure and Corruption in European Union Member States


Abstract
:1. Introduction
2. Methods
2.1. Data
2.2. Analysis
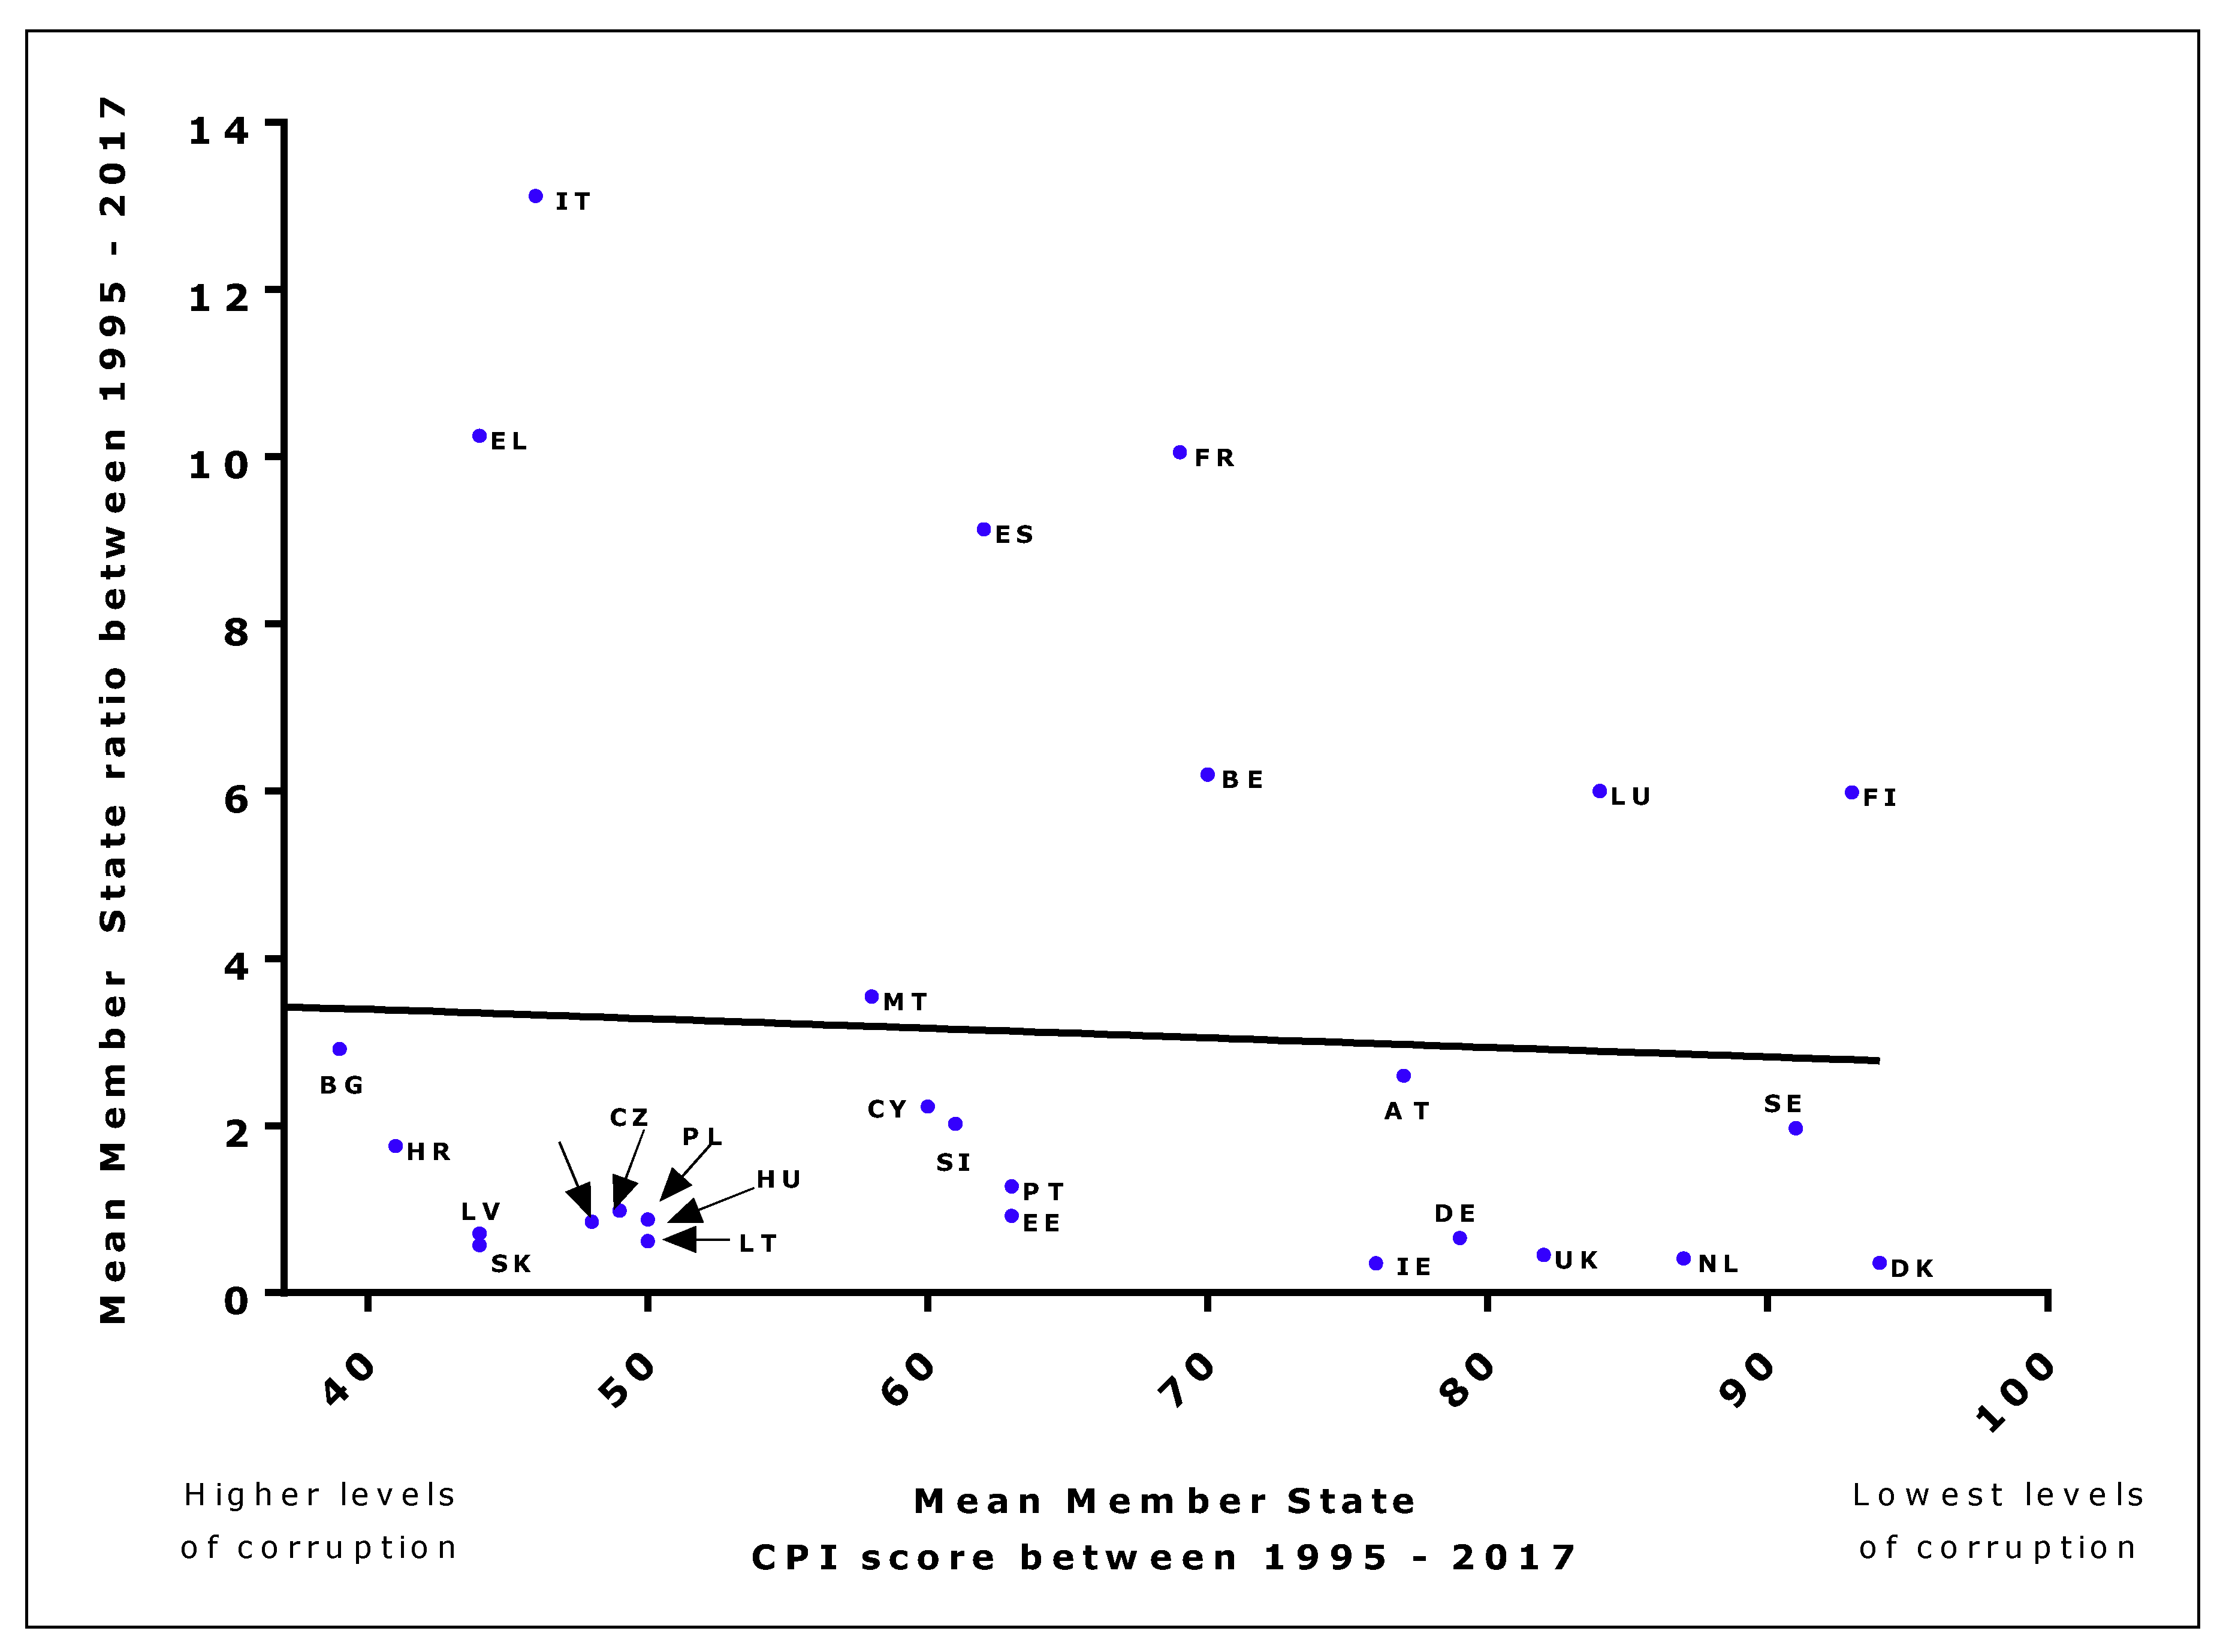
3. Results
4. Discussion
5. Conclusions
Author Contributions
Funding
Acknowledgments
Conflicts of Interest
References
- Chaloupka, F.J.; Yürekli, A.; Fong, G.T. Tobacco taxes as a tobacco control strategy. Tob. Control 2012, 21, 172–180. [Google Scholar] [CrossRef] [PubMed] [Green Version]
- World Health Organisation. WHO Framework Convention on Tobacco Control; World Health Organisation: Geneva, Switzerland, 2003; Available online: http://whqlibdoc.who.int/publications/2003/9241591013.pdf (accessed on 27 June 2017).
- International Agency for Research on Cancer. Effectiveness of Tax and Price Policies in Tobacco Control. In IARC Handbooks of Cancer Prevention, Tobacco Control; International Agency for Research on Cancer: Lyon, France, 2011; Volume 14. [Google Scholar]
- Hiscock, R.; Branston, J.R.; McNeill, A.; Hitchman, S.C.; Partos, T.R.; Gilmore, A.B. Tobacco industry strategies undermine government tax policy: Evidence from commercial data. Tob. Control 2018, 27, 488–497. [Google Scholar] [CrossRef] [PubMed]
- Gilmore, A.B.; Tavakoly, B.; Hiscock, R.; Taylor, G. Smoking patterns in Great Britain: The rise of cheap cigarette brands and roll your own (RYO) tobacco. J. Public Health 2014, 37, 78–88. [Google Scholar] [CrossRef] [PubMed]
- Gilmore, A.B.; Tavakoly, B.; Taylor, G.; Reed, H. Understanding tobacco industry pricing strategy and whether it undermines tobacco tax policy: The example of the UK cigarette market. Addiction 2013, 108, 1317–1326. [Google Scholar] [CrossRef] [PubMed]
- World Health Organisation. WHO Technical Manual on Tobacco Tax Administration; World Health Ogranisation: Geneva, Switzerland, 2010; Available online: http://whqlibdoc.who.int/publications/2010/9789241563994_eng.pdf?ua=1 (accessed on 12 March 2019).
- Shang, C.; Chaloupka, F.J.; Zahra, N.; Fong, G.T. The distribution of cigarette prices under different tax structures: Findings from the International Tobacco Control policy evaluation (ITC) project. Tob. Control 2014, 23, i23–i29. [Google Scholar] [CrossRef] [PubMed]
- Yurekli, A.; de Beye, J. Design and Administer Tobacco Taxes; World Bank Economics of Tobacco Toolkit: Washington, DC, USA, 2001. [Google Scholar]
- The Council of the European Union. Council Directive 2011/64/EU of 21 June 2011 on the Structure and Rates of Excise Duty Applied to Manufactured Tobacco; European Union: Brussels, Belgium, 2011; Available online: https://eur-lex.europa.eu/legal-content/en/ALL/?uri=CELEX%3A32011L0064 (accessed on 12 March 2019).
- Skafida, V.; Silver, K.E.; Rechel, B.P.; Gilmore, A.B. Change in tobacco excise policy in Bulgaria: The role of tobacco industry lobbying and smuggling. Tob. Control 2014, 23, e75–e84. [Google Scholar] [CrossRef] [PubMed]
- Szilagyi, T.; Chapman, S. Tobacco industry efforts to keep cigarettes affordable: A case study from Hungary. Cent. Eur. J. Public Health 2003, 11, 223–228. [Google Scholar] [PubMed]
- Bogdanovica, I.; McNeill, A.; Murray, R.; Britton, J. What factors influence smoking prevalence and smoke free policy enactment across the European Union member states. PLoS ONE 2011, 6, e23889. [Google Scholar] [CrossRef] [PubMed]
- U.S. National Cancer Institute; World Health Organization. The Economics of Tobacco and Tobacco Control; Monograph 21, NIH Publication No. 16-CA-8029A; Department of Health and Human Services, National Institutes of Health, National Cancer Institute: Bethesda, MD, USA; World Health Organization: Geneva, Switzerland, 2017. Available online: https://cancercontrol.cancer.gov/brp/tcrb/monographs/21/docs/m21_complete.pdf (accessed on 23 June 2019).
- Fxtop Historical Converter. Available online: http://fxtop.com/en/historical-currency-converter.php (accessed on 12 March 2019).
- Transparency International. Corruption Perceptions Index 2019. Available online: https://www.transparency.org/research/cpi/overview (accessed on 12 March 2019).
- Transparency International. Corruption Perceptions Index 2017. Available online: https://www.transparency.org/research/cpi (accessed on 24 June 2019).
- Transparency International. Corruption Perceptions Index 2018. Available online: https://www.transparency.org/cpi2018 (accessed on 24 June 2019).
- López-Nicolás, Á.; Stoklosa, M. Tax harmonisation and tobacco product prices in the European Union, 2004–2015. Tob. Control 2018, 28, 434–439. [Google Scholar] [CrossRef] [PubMed]
- Antić, D. Implications of the taxation of tobacco in the European Union in the period 2005–2014. Financ. Theor. Pract. 2015, 39, 279–304. [Google Scholar] [CrossRef]
- Wilhelm, P.G. International validation of the corruption perceptions index: Implications for business ethics and entrepreneurship education. J. Bus. Ethics 2002, 35, 177–189. [Google Scholar] [CrossRef]
- International, T. Corruption Perceptions Index 2017: Technical Methodology Note. 2017. Available online: http://files.transparency.org/content/download/1950/12812/file/2015_CPI_DataMethodologyZIP.zip (accessed on 12 March 2019).
- Pearce, N. The ecological fallacy strikes back. J. Epidemiol. Community Health 2000, 54, 326–327. [Google Scholar] [CrossRef] [PubMed] [Green Version]
- Smith, K.E.; Savell, E.; Gilmore, A.B. What is known about tobacco industry efforts to influence tobacco tax? A systematic review of empirical studies. Tob. Control 2013, 22, e1. [Google Scholar] [CrossRef] [PubMed]
- Blecher, E.; Ross, H.; Stoklosa, M. Lessons learned from cigarette tax harmonisation in the European Union. Tob. Control 2014, 23, e12–e14. [Google Scholar] [CrossRef] [PubMed]
- Agaku, I.T.; Blecher, E.; Filippidis, F.T.; Omaduvie, U.T.; Vozikis, A.; Vardavas, C.I. Impact of cigarette price differences across the entire European Union on cross-border purchase of tobacco products among adult cigarette smokers. Tob. Control 2016, 25, 333–340. [Google Scholar] [CrossRef] [PubMed]


| Country | Coefficient | Standard Error | p Value |
|---|---|---|---|
| Austria | −0.020313 | 0.0077516 | 0.0173 |
| Czech Republic | −0.0168546 | 0.00593855 | 0.0161 |
| Poland | −0.0328598 | −2.739512 | 0.0179 |
| Slovakia | −0.0165421 | 0.00516629 | 0.0095 |
| UK | −0.0041924 | 0.00117508 | 0.0021 |
| Germany | 0.00776925 | 0.00313698 | 0.0228 |
| Bulgaria | 0.489768 | 0.256643 | 0.0805 |
| Cyprus | 0.0135868 | 0.0114653 | 0.2634 |
| Estonia | −0.0071129 | 0.0131971 | 0.5998 |
| Finland | −0.033406 | 0.0205821 | 0.1211 |
| Greece | 0.159570 | 0.107282 | 0.1542 |
| Hungary | 0.0219810 | 0.0106499 | 0.0634 |
| Ireland | 0.00189133 | 0.00305938 | 0.5442 |
| Italy | 0.006323 | 0.0215210 | 0.7723 |
| Latvia | −0.00154183 | 0.0124290 | 0.9037 |
| Lithuania | −0.0036789 | 0.0113753 | 0.7525 |
| Malta | 0.041909 | 0.062992 | 0.5209 |
| Netherlands | 0.0075926 | 0.0040456 | 0.0760 |
| Romania | −0.0177252 | 0.0350063 | 0.6226 |
| Slovenia | −0.007171 | 0.0067619 | 0.3166 |
| Belgium | 0.033049 | 0.110575 | 0.7685 |
| Denmark | 0.013342 | 0.0137247 | 0.3432 |
| Luxembourg | −0.33617 | 0.304799 | 0.2846 |
| Portugal | −0.00621 | 0.098344 | 0.9503 |
| Slovakia | −0.01654 | 0.0051662 | 0.0095 |
| Spain | 0.282165 | 0.059392 | 0.0002 |
| Sweden | 0.187649 | 0.101819 | 0.081 |
© 2019 by the authors. Licensee MDPI, Basel, Switzerland. This article is an open access article distributed under the terms and conditions of the Creative Commons Attribution (CC BY) license (http://creativecommons.org/licenses/by/4.0/).
Share and Cite
Shah, A.; Eminson, K.; Bogdanovica, I.; Britton, J. The Relation Between Tobacco Tax Structure and Corruption in European Union Member States. Int. J. Environ. Res. Public Health 2019, 16, 2842. https://doi.org/10.3390/ijerph16162842
Shah A, Eminson K, Bogdanovica I, Britton J. The Relation Between Tobacco Tax Structure and Corruption in European Union Member States. International Journal of Environmental Research and Public Health. 2019; 16(16):2842. https://doi.org/10.3390/ijerph16162842
Chicago/Turabian StyleShah, Ajay, Katie Eminson, Ilze Bogdanovica, and John Britton. 2019. "The Relation Between Tobacco Tax Structure and Corruption in European Union Member States" International Journal of Environmental Research and Public Health 16, no. 16: 2842. https://doi.org/10.3390/ijerph16162842