Abstract
Transnational restaurant chains sell food and beverage products in 75 to 139 countries worldwide linked to obesity and non-communicable diseases (NCDs). This study examined whether transnational restaurant chains reformulated products and standardized portions aligned with healthy dietary guidelines and criteria. Firstly, we describe the transnational restaurant industry structure and eating trends. Secondly, we summarize results from a scoping review of healthy dietary guidelines for restaurants. Thirdly, we describe a systematic review of five electronic databases (2000–2018) to identify studies on nutrient profile and portion size changes made by transnational restaurants over 18 years. We used Preferred Reporting Items for Systematic Reviews and Meta-Analysis (PRISMA) guidelines, identified 179 records, and included 50 studies conducted in 30 countries across six regions. The scoping review found a few expert-recommended targets for restaurants to improve offerings, but no internationally accepted standard for portions or serving sizes. The systematic review results showed no standardized assessment methods or metrics to evaluate transnational chain restaurants’ practices to improve menu offerings. There was wide variation within and across countries, regions, firms, and chains to reduce energy, saturated and trans fats, sodium, and standardized portions. These results may inform future research and encourage transnational chain restaurants to offer healthy product profiles and standardized portions to reduce obesity and NCD risks worldwide.
1. Introduction
Quick-service, fast-casual, and full-service restaurant (QSR, FCR, and FSR) chains offer a variety of inexpensive and convenient food and beverage products to customers on the premises, as takeaway, or delivered at home, work, or other locations [1]. Fast-food meals and sugary beverages marketed by transnational QSR chains are perceived to be a symbol of Western culture, capitalism, and the globalization of the food supply [2,3].
Technical innovation and trade liberalization enabled the international expansion of restaurant franchise businesses worldwide since the 1960s that generated some economic benefits but also many health consequences [2,3,4]. While QSR chains contributed to economic development by creating jobs, businesses often pay workers below the minimum wage and provide limited benefits that precipitate food and economic insecurity [2,4,5]. Transnational restaurant chains created a lucrative global market demand for energy-dense, nutrient-poor processed food and beverage products linked to obesity and non-communicable diseases (NCDs), including type 2 diabetes, cardiovascular diseases, and certain cancers [2,3,6]. Cross-sectional studies found associations among the consumption of food and beverage products high in energy (kilocalories (kcal) or kilojoules (kJ)) fats (i.e., total, saturated, and trans fats); sodium and added sugars; poor diet quality; unhealthy lifestyle behaviors; and obesity or diet-related NCD risks among populations in high- and middle-income countries [7,8,9,10,11,12,13,14,15].
Some evidence suggests that one’s biological preferences for energy-dense and nutrient-poor foods high in calories, fats, sugars, and sodium may interact with cultural, economic, lifestyle, and sociodemographic factors (i.e., age, race, ethnicity, and gender) to increase the demand for QSR foods [16]. Yet, two recent systematic reviews found no statistically significant association among adults’ geographic access to fast-food or QSR chains, socioeconomic status, and weight [17,18].
There is inconsistent evidence to show a strong association but not causal outcomes between fast-food or QSR consumption frequency, diet quality, and metabolic indicators of disease risk [19]. These inconsistencies may reflect differences in study design including how restaurant products are defined, the frequency and amount of food and beverage products consumed away from home, and the diet and health outcomes examined. For example, a longitudinal study of United States (U.S.) adults (1987–2017) found that, while QSR customers purchased fewer vegetables, fish, or seafood, the diet quality of QSR customers did not differ significantly from non-QSR customers [20]. A prospective cross-sectional cohort study of US adults (n = 3031) over 15 years (1985–2000) found that the frequency of fast-food consumption was strongly correlated with weight gain and insulin resistance [21]. However, a separate prospective cross-sectional cohort study of US adults (n = 9107) over 10 years (1999–2011) did not show a statistically significant association between QSR consumption frequency, cardio-metabolic risk factors, and increased mortality rates [22].
1.1. Study Purpose
QSR chains have extensive reach through the globalized food system and may influence the diet quality of billions of people worldwide who purchase and consume restaurant products onsite through self-serve or full-serve options, takeaway, or delivered to their worksite or home. Monitoring temporal trends in the global food supply quality, and the fidelity of QSR chain pledges and business practices over time may help to reformulate products that contribute to poor diet quality, obesity, and diet-related NCDs [23]. Documenting differences across countries and regions is important to inform government policy and hold the restaurant industry accountable for business practices to support healthy dietary guidelines and positive health outcomes for populations [24].
This study has four objectives. The first objective is to describe the transnational restaurant industry structure, global presence, and QSR consumption trends for customers. The second objective is to conduct a scoping review to identify recommendations issued by the World Health Organization (WHO) and other authoritative bodies relevant to the transnational restaurant sector to reformulate products to meet nutrient targets and standardize meal portions that align with healthy dietary guidelines. The third objective is to conduct a systematic review of peer-reviewed studies between 2000 and 2018 to understand the temporal trends in transnational chains’ reformulation of products and standardization of meal portions to align with healthy dietary guidelines. The fourth objective is to use the findings to suggest actions for future government policies and business practices for transnational QSR chains to support healthy dietary guidelines across countries and regions worldwide.
1.2. Restaurant Industry Structure and Global Presence
The transnational QSR chain sector emerged in the U.S. during the 1950s due to many factors including the development of new food technology, rising disposable income of households, changing work and family lifestyles, a new motorized travel infrastructure, and a growing market demand for convenient, tasty, and inexpensive food and beverage products [2,3,4]. The McDonaldization of Society described a “process by which fast-food restaurant businesses dominated the sectors of American society and the rest of the world” based on the principles of efficiency, calculability, predictability, and control [2].
During the 1960s and 1970s, trade liberalization and government deregulation of international markets enabled US-headquartered companies to promote branded QSR chains (i.e., McDonald’s, Subway, Kentucky Fried Chicken (KFC), Pizza Hut, Taco Bell, Domino’s Pizza, and Burger King) that used a franchising business model to increase their competitiveness by expanding rapidly into international markets [2,3,25,26]. Franchising allows a restaurant chain or franchisor to contract with a franchisee who may be an investment firm or individual who pays an initial fee (U.S. dollars (USD) $15,000–$90,000) and royalties (4% to 8% of gross sales) based on the percentage of the total annual business revenue [27,28]. The franchisee provides a location, trains employees, develops a marketing plan, and adheres to the corporate brand’s standards [27].
During the 1980s, transnational and national food and beverage manufacturers in Europe and Latin America acquired transnational QSR chains through franchising that enabled the vertical integration of processed food and beverage products into national and regional food supply chains and procurement systems that led to economies of scale to maximize sales and revenue for manufacturers [29]. Over four decades, there was a marked growth and differentiation of the restaurant industry sector in the US and worldwide, ranging from independent non-chain restaurants to the limited-service restaurant segment including QSR and FCR chains that serve burgers, sandwiches, pizza, and chicken, as well as FSR or sit-down restaurant chains, and independent family dining, casual dining, and upscale fine-dining restaurants [27,30].
Euromonitor International forecasts that the QSR chain industry will grow in most countries worldwide through 2020 [31], especially in the Asia Pacific region and China, due to the increased disposable income of young consumers who are expected to drive fast-food purchasing and consumption trends [31]. Media stories also suggested that transnational QSR chains including McDonald’s, KFC, and Domino’s Pizza expanded rapidly across Africa, Asia, and Latin America [32,33,34]. The away-from-home food sector in low- and middle-income countries (LMICs) is complex because it is comprised of both transnational and national chains, and many informal food service providers, including small-scale takeaways and street vendors [29,31]. Epidemiologic studies suggest that indigenous non-chain restaurants, independent takeaway eateries, and street vendors dominate over transnational QSR chains in India, Mexico, Nigeria, and Singapore [35,36,37,38].
Market research suggests that the global fast-food restaurant industry market represents about USD $651 billion annually [39]. By comparison, the combined U.S. limited-service restaurant (i.e., QSR and FCR) and FSR segments represented USD $497 billion and 48% of U.S. household income spent on food in 2017 [1]. Table 1 summarizes the 2018 brand value, and the number of franchise units in countries where U.S.-headquartered, popular transnational QSR chains operate businesses worldwide [40,41,42,43,44,45].

Table 1.
Major United States (U.S.)-headquartered transnational quick-service restaurant (QSR) chains, 2018 brand value 1 and number of franchise units in countries where the businesses chains operate worldwide. KFC—Kentucky Fried Chicken; USD—United States dollars.
1.3. Customer Purchasing and Eating Trends at Restaurants
A 2015 Nielsen global online survey of more than 30,000 adults in 61 countries found that more than 50% of respondents reported eating lunch and dinner at restaurants or street vendors weekly, and about 9% ate at these away-from-home outlets daily [46]. Other research suggests that 28–37% of residents in Australia, Europe, United Kingdom (UK), and US reported consuming takeaway meals at least twice weekly [19]. Market research shows that customers who visit QSR chains rank cost, value for money spent, food quality, food safety, staff friendliness, service speed, cleanliness, atmosphere, and type of cuisine as more important attributes over personal health [47,48]. In China, consumer demand for QSR chain meals increased from USD $10.5 million to USD $94.2 million between 1999 and 2013 [49]. U.S. spending on away-from-home food accounted for 44% of total food expenditures annually since the 1980s, and increased to 50.2% in 2010 [20]. Nevertheless, customers recognize that healthy restaurant menu choices are limited. An online survey of 5000 adults across 10 high-income countries found that less than 20% were satisfied with healthy restaurant menu options [50].
2. Materials and Methods
This paper updates evidence from two published reviews that identified expert recommendations and evaluated the US restaurant sector progress across eight marketing-mix and choice-architecture strategies (i.e., place, profile, portion, pricing, promotion, healthy default picks, priming or promotion, and proximity) [51,52]. Given the breadth of the literature on restaurants, the research question for this study examined the use of two strategies—changing the nutrient composition by reformulating products (profiles) and reducing or standardizing serving sizes (portions)—by transnational chain restaurants worldwide to meet healthy dietary guidelines.
We defined changes to product profiles as alterations to the nutrient composition, texture, taste, and flavor of food, beverage, and meal products sold. We defined changes to portions as reducing or standardizing the food, beverage, and/or meals to influence customers’ expectations about single servings and to support healthy dietary guidelines.
2.1. Search Strategy for Steps 1 and 2
The first step involved the lead investigator (V.K.) conducting a scoping review of the peer-reviewed and gray-literature sources to identify dietary recommendations issued by the WHO for individuals and populations to limit nutrients of concern to reduce obesity and NCD risks. This step also involved the lead investigator contacting international researchers to identify resources that offered recommendations issued by authoritative bodies for transnational QSR chains to implement nutrient-profiling criteria or specific performance metrics for product reformulation, and portion size targets for meals, side dishes, desserts, and beverages sold to children, teens, or adults that align with a healthy diet. The results were independently reviewed by three co-investigators (S.R.G.P., D.R., and E.K.).
The second step involved two co-investigators (S.R.G.P. and D.R.) developing the search strategy, in consultation with the lead author (V.K.) and a health sciences librarian. We compiled the search terms and identified five electronic databases to search for original, peer-reviewed publications. This study’s research question was as follows: What progress was made by transnational restaurant chains to reformulate products and standardize or reduce portions or serving sizes to meet recommended healthy dietary guidelines for children, adolescents, and adults between 2000 and 2018?
We used the Preferred Reporting Items for Systematic Reviews and Meta-Analysis (PRISMA) guidelines [53] to conduct a systematic review of English-language electronic databases (i.e., the Cumulative Index to Nursing and Allied Health Literature (CINAHL), Food Science Technology Abstracts, Mintel, PubMed, and Web of Science) to identify relevant literature published between 1 January 2000 and 18 December 2018. Table 2 summarizes the a priori inclusion and exclusion criteria used to conduct the systematic review using the PICO approach including population (restaurants), indicator (assessment of nutrient content and portion or serving sizes of restaurant products), comparison (dietary standards, guidelines or nutrient profiling targets), outcomes (energy, fat, sugar, sodium, portion or serving size), and study design. Table S1 (Supplementary Materials) describes the detailed search strategy used for each database to conduct the systematic review. The search strategy used a combination of keywords including “restaurant”, “fast food”, “takeaway”, “take out”, “reformulation”, “change”, “portion size”, “standard”, “standardized”, “serving”, “guideline”, “diet”, “dietary”, “recommendation”, “food policy”, “nutrition policy”, “regulation”, “standard”, “monitor”, “energy”, “calorie”, “sodium”, “salt”, “saturated fat”, “trans fat”, “sugar”, “portion” and “serving”.
Table 2.
Inclusion and exclusion criteria for the study selection for the systematic review. FCR—fast-casual restaurant; FSR—full-service restaurant; TFA—trans fatty acids.
2.2. Study Selection and Data Extraction
One co-investigator (S.R.G.P.) removed duplicate articles from the original search of the five electronic databases. Two co-investigators (S.R.G.P. and D.R.) screened the titles and abstracts of the retrieved records independently to identify studies that met the inclusion criteria, as recommended by the PRISMA process. A third co-investigator (V.K.) confirmed the inclusion or exclusion of the retrieved records. The three co-investigators discussed any disagreements, and documented reasons for study exclusions that included location (i.e., conducted in other settings such as schools, childcare, cafeterias, supermarkets, vending machines, or convenience stores), and marketing practices (i.e., television, internet, outdoors, or mobile devices) that were not the focus of this study. Two co-investigators (S.R.G.P. and D.R.) examined the full-text key review articles included, and hand-searched the references of selected articles and key review articles. They consulted other sources to ensure that they had not overlooked any important articles published during the review period. One co-investigator (D.R.) extracted relevant data from each study verified independently by two co-investigators (V.K. and E.K.). The evidence table included the lead author and year the study was published, study objective, data collection period, study design and methods (i.e., outcomes measured, assessment, evidence sources, and dietary or nutrient-profile guidelines or criteria used to assess the nutrient composition or serving size of products), restaurant chains examined, and the main results.
2.3. Study Quality Assessment
Two co-investigators (S.R.G.P. and E.K.) independently reviewed the 50 studies for quality. They used the Johanna Briggs Institute’s eight-item, critical appraisal checklist for analytical cross-sectional studies [54] to assess the quality of each study for clear inclusion criteria, setting, measuring the exposure in a valid and reliable way, and whether objective and standard criteria were used to measure the outcomes of interest. Each study was assigned a quality score of weak (1), moderate (2), or strong (3). A third co-investigator (V.K.) resolved differences in scoring, and consensus was reached on the final score through investigator triangulation. We did not conduct a risk of bias assessment because the outcomes of interest were descriptive, and the systematic review did not include either intervention or randomized controlled trial study designs.
3. Results
The section below describes the results for step 1 (scoping review) and step 2 (systematic review) based on the findings from published studies presented in a narrative summary. The different study designs and heterogeneity of study outcomes precluded the poling of data to conduct a meta-analysis for the results across countries.
3.1. Step 1: Scoping Review of Dietary Recommendations for Restaurant Chains
More than 100 countries worldwide developed science-based, national dietary guidelines to inform food and nutrition policies for stakeholders to foster a healthy diet [55]. The WHO and Food and Agriculture Organization (FAO) of the United Nations issued several reports between 2004 and 2018 with recommendations for national governments to increase nutrient density of diets and reduce several nutrients of concern in the food supply. Recommendations for individuals and populations to consume nutrient-dense foods include five or more servings (more than 400 g) daily of fruits and vegetables [56]; lean meat and fish, low-fat or fat-free dairy, or appropriate plant-based substitutes; dietary fiber (20 g/person/day) [57,58]; and dietary potassium (e.g., beans, peas, nuts, and fruits and vegetables) to provide at least 3.5 g potassium/person/day [59].
The WHO and/or FAO also recommended that individuals and populations reduce dietary fats (i.e., total, saturated fat and artificial or industrially produced trans fats (TFA)), and replace TFA with healthier monounsaturated or polyunsaturated fats or oils [60,61]. Additionally, individuals should reduce free or added sugars [62] and sodium or salt [63] to lower obesity and diet-related NCD risks including type 2 diabetes. The specific targets recommended are as follows: dietary fat (15–30% total energy/person/day); saturated fat (<10% total energy/person/day; <7% total energy for high-risk groups); and TFA (<1% of total energy intake that translates into <2.2 g TFA/day for a 2000-calorie diet (one kilocalorie (kcal) = 4.184 kilojoules (kJ); a 2000-calorie diet is equivalent to an 8370-kilojoule diet). Moreover, the WHO recommended that consumers reduce their free or added sugars to less than 10% total energy/person/day, representing 25 g/day or six teaspoons added sugars for children, and 50 g/day or 12 teaspoons added sugars for adults who consume a 2000-calorie diet [62]. Finally, individuals should aim to consume less than a teaspoon of salt (less than 5 g salt/person/day) or sodium (less than 2 g sodium/person/day) [63].
Several national governments issued dietary recommendations for the average adult to consume no more than 2000 to 2500 kcal or 8700 kJ daily [64,65,66,67]. In 2018, Public Health England launched the One You Campaign that encouraged adults to “Aim for 400-600-600” when eating away from home, by choosing 400 calories for breakfast, 600 calories for lunch, and 600 calories for the dinner meal [68].
Governments, industry task forces, and public health experts in Australia [69], Canada [70], the United Kingdom [71], and the United States of America (USA) [72,73] issued recommendations for healthy food procurement and nutrition standards for various food service settings. However, there are few explicit recommendations for transnational chain restaurants with quantitative nutrient targets and specified timelines to improve the healthfulness of offerings. Moreover, there is no internationally accepted standard for a portion or serving size of a meal for a child, adolescent, or adult. Table 3 summarizes the recommended dietary guidelines identified through the scoping review from bodies that issued specific dietary recommendations, nutrient targets, or performance metrics for restaurant chains to reformulate products and reduce or standardize meal portions to support healthy dietary guidelines [74,75,76,77,78]. Only the U.S. National Salt Reduction Initiative offered a specific timeline for restaurants to implement the sodium recommendations [78].
Table 3.
Recommended dietary guidelines for restaurant chains to reformulate and standardize serving sizes of products to meet healthy dietary guidelines *.
3.2. Step 2: Data Selection, Quality Assessment, and Analysis for the Systematic Review
Figure 1 shows the PRISMA flow diagram that shows that the initial search yielded 179 records from five electronic databases. After removal of duplicates (n = 32), 147 titles and 51 abstracts were screened. Following the full-text review (n = 38), we excluded four studies and selected 34 studies that met the inclusion criteria. An additional 16 additional articles were identified from the reference lists of key articles and other sources, and 50 articles were included in the final analysis [78,79,80,81,82,83,84,85,86,87,88,89,90,91,92,93,94,95,96,97,98,99,100,101,102,103,104,105,106,107,108,109,110,111,112,113,114,115,116,117,118,119,120,121,122,123,124,125,126,127].
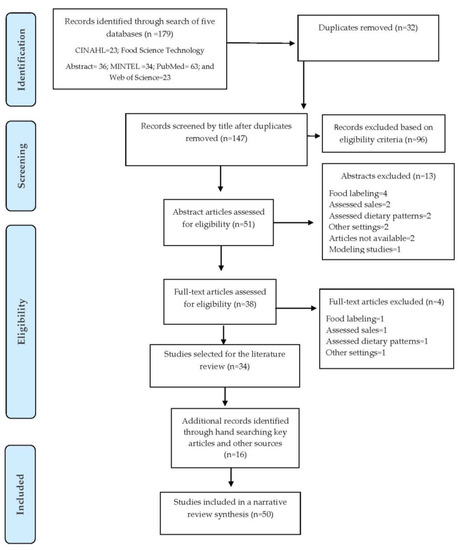
Figure 1.
Preferred Reporting Items for Systematic Reviews and Meta-Analysis (PRISMA) flow diagram for the systematic review of studies to evaluate transnational restaurant chains’ progress to reformulate products and standardize portions to meet healthy dietary guidelines, 2000–2018.
Table 4 summarizes the Johanna Briggs Institute critical appraisal checklist for quality assessment results for eight items that rated the study quality as weak (1), moderate (2), or strong (3). This tool examined whether the study had clearly defined inclusion criteria, the detail described for the study setting, validity and reliability of the outcomes measured, use of standard criteria to measure outcomes, strategies to address confounding factors, and statistical analysis used.
Table 4.
Evaluation of study quality assessed by the Joanna Briggs Institute critical appraisal checklist.
3.3. Study Characteristics: Outcomes, Research Design, Duration, Restaurant Segment, Geographic Location
Table 5 summarizes the studies included in the systematic review by country, study design, methods, data collection period, outcomes measured, and number of chains examined. A majority of studies (n = 39) were cross-sectional and 11 studies were longitudinal. The studies compared outcomes of interest over several weeks to years between 2000 and 2018. The outcomes measured were energy (kcal/kJ) or energy density (mg/100 g) (n = 36 studies); total, saturated, and TFA (g)) (n = 35 studies); free or added sugars (g) (n = 13 studies); sodium or salt (mg) or sodium density (mg/1000 kcal or 1000 kJ) (n = 34 studies); and portion or serving size (kcal or kJ/serving or per 100 g) (n = 9 studies). Table S2 (Supplementary Materials) summarizes the detailed findings for the published studies included in the systematic review, including the lead author and year published; study purpose; location (continent, country and state); data collection period; study design; assessment methods and evidence sources; number and type of restaurant chains examined; and main results.
Table 5.
Studies included in the systematic review summarized by country, study design, methods, data collection period, outcomes measured, and chains examined, 2000–2018.
Of the 50 studies summarized in Table 5 and Table S2 (Supplementary Materials), 30 studies reported examining 475 chains from the QSR, FCR, and FSR segments. McDonald’s Corporation was reported at the highest frequency of studies (n = 25), followed by Burger King or Hungry Jack’s (n = 24), KFC (n = 22), Subway (n = 16), Pizza Hut (n = 13), Domino’s Pizza (n = 10), and Taco Bell (n = 6). The remaining 20 studies did not report the QSR, FCR, and FSR chains and non-chain restaurants. Only three studies conducted in Abu Dhabi, United Arab Emirates (UAE); London, England, United Kingdom (UK); and Japan [95,107,120] compared the nutritional profile and/or portion sizes of items at chain restaurants and non-chain restaurants.
Table S3 (Supplementary Materials) lists 50 studies conducted in 30 unique countries and six geographic regions (i.e., Africa, Americas, Asia, Europe, Middle East, and Oceania). Most studies were conducted in one country. Six multi-country studies [91,98,101,119,127] compared specific outcomes of interest for restaurant chains in 48 countries between two and five geographical regions from 2006 to 2018. More than half of the studies were conducted in the North American region including the US (n = 29) and Canada (n = 9), followed by Oceania that included Australia (n = 9) and New Zealand (n = 7). Three studies examined QSR outcomes in Africa including in Egypt (n = 1), Ghana (n = 1), and South Africa (n = 1). Four studies were conducted in Latin or South America including Brazil (n = 1), Costa Rica (n = 1), Guatemala (n = 1), and Peru (n = 1). Six studies were conducted in Asia including Japan (n = 2), China (n = 2), and India (n = 2). In the European region, the United Kingdom (England) (n = 5) was followed by one or more studies conducted in Austria, Czech Republic, Denmark, Finland, France, Germany, Hungary, Italy, the Netherlands, Norway, Poland, Portugal, Russia, Spain, and Sweden. Two studies were conducted in the UAE in the Middle East region. Fifteen studies [78,89,92,95,98,101,102,103,104,105,107,113,114,120,124] evaluated children’s menu items across six regions for eight countries including Australia, Canada, Guatemala, Japan, New Zealand, UAE, UK, and U.S.
3.4. Study Characteristics by Evidence Sources, Assessment Methods, and Dietary Guidelines or Criteria
Several studies used one or more forms of primary, secondary, or tertiary information, diverse assessment methods, and statistical tests to determine whether there were significant changes in the nutrient content or portion size changes of menu items over time. These methods included the annual tracking of restaurant products reported by manufacturers on their websites, onsite visits to examine offerings on menus and menu boards, and by contacting restaurant firms via telephone. A few studies collected menu samples (i.e., fries, hamburgers, or chicken dishes) homogenized and tested in the laboratory using bomb calorimetry to measure energy or gas chromatography to measure the TFA content of restaurant menu items compared within and across countries [80,108,119]. Nine U.S. studies used the MenuStat Database established by the New York City Department of Health and Mental Hygiene to provide nutrition information for products sold by the leading QSR, FCR, and FSR chains from 2012 to 2017 [73,83,84,85,92,100,104,110,126]. Four studies used independent food and nutrient databases to assess the quality of meals [82,96,109,115].
Different dietary guidelines were used in the studies that varied by study design and country. About two-thirds (n = 34/50; 68%) of the studies reported guidelines, criteria, or nutrient targets to assess the healthfulness of menu offerings based on comparative standards for the product profiles or portion sizes. Three of the five multi-country studies [91,98,127] did not report any standard dietary criteria to compare differences across countries or regions (Table S3, Supplementary Materials).
The US and a few non-U.S. studies reported using the Dietary Guidelines for Americans (DGA) 2005, 2010, or 2010–2015 or the percent dietary reference value (%DV) for selected nutrients [79,81,87,89,92,96,99,101,102,112,116,117,126], the FDA or American Heart Association’s sodium targets [79,99], The U.S. Department of Agriculture’s (USDA’s) Healthy Eating Index [79,96,102], National School Lunch Program (NSLP) standards [95,104], US Expert Panel on Children’s Menu Portions [78], the National Restaurant Association’s Kids LiveWell Program [95,104], and the American Academy of Pediatrics’ energy recommendations [92] (Table 3). Other studies reported using the Dietary Guidelines for Children and Adolescents in Australia [124], Japanese NSLP standards [120], UK’s Nutrient Profiling Model [103,118], Recommended Dietary Intakes of New Zealand [123], and the WHO target for sugars [123].
3.5. Energy
Thirty-six studies measured energy (kcal/kJ) either as a primary outcome or to calculate the energy density for fat, TFA, sugar, or sodium content/1000 calories. Fewer studies measured either total fat, saturated fat, and/or TFA (n = 28); free or added sugars (n = 12); and portion or serving size (n = 19) reported as kcal/kJ or energy density/100 g. A specific outcome for energy at restaurant chains was reported for 33 studies conducted in eight countries including Australia, Canada, Guatemala, Japan, New Zealand, UAE, UK, and the U.S. Four multi-country studies [98,101,108,127] compared the energy and/or portion sizes at chain and non-chain restaurants collectively across 24 countries, and all documented considerable variability in energy (kcal/kJ) and fat content across different menu items, chain types, and countries. More than one-third (38%) of 36 studies examined the energy content of children’s menu items, including one multi-country study that compared the energy content of QSR menu items in Australia, Canada, New Zealand, UK, and U.S. [98]; six U.S. studies [78,92,102,104,105,117], and one study each in Australia [124], Canada [113], Guatemala [103], Japan [120], UAE [95], and the UK [107].
The diversity of dietary guidelines and nutrient targets used, the examination of different chain types (i.e., QSR, FCR, and FSR), menu items (i.e., bundled meals, entrees, burgers, fries, side dishes, and beverages), varied age groups (i.e., adult versus children), and time frame from 2000 to 2018 precluded making direct comparisons of the energy content of chain restaurants’ menu items across the 33 studies. Therefore, we provide a narrative summary of salient results for energy outcomes below discussed chronologically for each of the eight countries.
In Australia, Brindal et al. (2008) [86] documented that the average meal provided nearly half (47.5%) of energy (kJ) and fat (g) (48%) at six chains in 2005. By 2009, Dunford et al. (2010) [90] found that a majority of items examined at nine chains did not meet healthy criteria. In 2010, Wellard et al. (2012) [124] examined the nutrient content of 199 children’s meal combinations and found that only 16% and 22% met the industry’s nutrient criteria for children aged 4–8 and 9–13 years, respectively. More than two-thirds (72%) of QSR meals exceeded 30% of the daily energy recommendations for a four-year-old child, and many meals also exceeded the upper limit for daily saturated fat recommendation for children aged 4–8 years. Between 2009 and 2015, Wellard-Cole et al. (2018) [125] found that five chains significantly increased the energy content for limited-time menu offerings over seven years despite voluntary menu labeling legislated in New South Wales, Australia.
In Canada, Scourboutakos and L’Abbe (2012) [111] documented that FSR chains had higher calories/serving for all food categories compared to QSR chains in 2010. Calories varied both within and across food categories, and the portion or serving size was more strongly correlated with calories than energy density at 85 chains examined. Between 2010 and 2011, Scourboutakos et al. (2013) [112] documented that, among 19 FSR chains, meals provided an average of 1128 calories (56% of daily 2000 calories/day), 89% DV for fat, and 83% DV for saturated fat; these restaurants labeled meals as healthy if they provided an average of 474 calories, 13 g fat, and 3 g saturated fat/serving. Scourboutakos et al. (2014) [113] also found that half (50%) of children’s meals sold at 17 chains exceeded the WHO’s daily free sugars target (5–10% energy) in 2010.
In New Zealand, Chand et al. (2012) [88] found that only one-fifth (21%) of items met healthy guidelines in 2010–2011, and 79% of items were high in energy and exceeded the portion size target at 12 chains. In 2014, Waterlander et al. (2014) [123] found that the most popular burger combo meals and pizza sold at four chains contributed between one-third and half of an adult’s energy needs, and the combo meals provided at least 94% of the WHO’s free sugars guideline. From 2012–2016, Eyles et al. (2018) [93] documented moderate to large increase in mean portion size and energy density for all menu items examined at 10 QSR chains.
In the UK, Reeves et al. (2011) [107] examined the mean portion size of children’s meals at seven chain and non-chain restaurants in 2009 and found that QSR chains provided smaller portions compared to non-chain FSR; however, neither the QSR nor FSR meals met the recommended nutrient standards for children aged 5–11 years. In Guatemala, Mazariegos et al. (2016) [103] found that six chains marketed less than one-fifth (18.4%) of combination meals in 2016, but none of the five children’s meals that provided nutritional information met healthy dietary guidelines. In the UAE, Garemo and Naimi (2018) [95] documented that half of 58 chain and non-chain restaurants offered children’s menus in 2016, but more than three-quarters (79%) of these meals did not meet the US Kids LiveWell Program healthy criteria. In Japan, Uechi 2018 [120] examined the nutritional content of children’s meals at 20 chains in 2017 and found that more than half of the restaurants aligned with the nutrient standards of the Japanese School Lunch Program for energy. Overall, about 59% and 41% of children’s meals met the energy (≤2218 kJ) and fat (≤30% energy) content, respectively.
In the US, a majority of the 19 studies that examined the quality of menu items documented that most menu entrées or bundled meals sold to adults exceeded 700 kcal/meal [81,108], and received a low Healthy Eating Index score [96,102,105]. Selected results for the U.S. studies are presented below.
Between 2000 and 2013, Urban et al. (2014) [121] documented that the energy content of 56% of items decreased and the energy content of 44% of items increased at three chains. In 2013, energy content of a large-sized bundled meal (cheeseburger, fries, and soda) represented 65–80% of a 2000 calorie diet. Between 2006 and 2010, Bauer et al. (2012) [82] found no change in the energy for entrees and beverages, and energy for side dishes decreased but desserts increased at eight chains.
From 2009–2010, Bruemmer et al. (2012) [87] documented a lower energy content for items at 37 FSR and LSR chains, yet all chains exceeded the DGA 2005 for calories (56%) and saturated fat (77%). Soo et al. (2018) [118] found that the promoted items on the general menu boards in 2010 and 2013 did not meet healthy nutrient criteria at four U.S. chains.
Two of six U.S. studies assessed children’s meals between 2008 and 2009 including O’Donnell et al. (2008) [105], which documented that only 3% of meals met all NSLP nutrition criteria at 10 chains, and non-adhering meals were more than 1.5 times energy dense than healthy meals; and from 2008–2009, Kirkpatrick et al. (2013) [102] observed that the menus at five QSR chains scored lower than 50/100 on Healthy Eating Index 2005, although children’s menus scored 10 points higher than adult meals. However, no menu received a score higher than 72 out of 100 points. Meal scores for total fruit, whole grains, and sodium were poor. Between 2012 and 2016, four studies of children’s meals documented that, while QSR chains were more likely to provide healthier options than FSR chains, most menu items did not meet the DGA targets for calories, or percent calories from fat or saturated fat, and FSR chains were more likely to serve children’s meals that exceeded ≤600 calories/meal [78,92,117]. Moran et al. (2017) [104] found that, between 2012 and 2015, 15 out of 45 chains that participated in the US Kids LiveWell Program significantly reduced the energy by 40 calories/children’s meal compared to nonparticipating restaurants, but this change did not persist through 2015.
Several U.S. studies used the New York City MenuStat Database to examine trends in the energy content of chain restaurant menu items from 2012 to 2015 [83,84,85,100,110]. Bleich et al. (2015) [83] observed a modest decline in energy (8–20%) for newly introduced entrees, beverages, and children’s meals but no differences in mean calories for menu items at 66 chains. Jarlenski et al. (2016) [100] found a modest decline in energy across 11,737 items, but an increase in energy of beverages and a large percentage of calories from added sugars in desserts at 37 chains. Bleich et al. (2017) [85] found no differences in mean energy for newly introduced items (2012–2015) relative to items on menu in 2008 at 44 chains. Schoffman et al. (2016) [110] found that FCR chains provided more calories per entrée (760 kcal) than QSR entrées (561 kcal), and QSRs provided more entrées <500 calories compared to FCR chains >751 calories at 62 chains.
3.6. Fat, Saturated Fat, and TFA
Of the 26 studies that examined changes in dietary fats, the results suggest a reduction in TFA to approach recommended levels over 18 years, but not a reduction in total or saturated fats of other food items. Auchincloss et al. (2014) [81] documented in 2011 that 30% of à la carte entrees at US chains exceeded the percent DV for saturated fat. In 2004 and 2005, Stender et al. (2006) [119] tested and compared two menu items (i.e., fries and chicken nuggets) at McDonald’s and KFC across 20 countries and three regions. These investigators found that half of the 43 samples contained >5.0 g TFA/serving, with KFC providing more TFA/item serving compared to McDonald’s. The investigators also found wide variation in the TFA content of items across the two chains depending on the chain’s geographic location ranging from 1–2% TFA in Denmark, 1–13% TFA in Spain, 5–23% TFA in the U.S., and 8–35% TFA in Hungary. By 2010–2011, Scourboutakos et al. (2013) [112] documented that meals sold at 19 FSR chains in Canada provided an average of 0.6 g TFA/meal.
By 2017, Astiasarán et al. (2017) [80] documented fries had a TFA content ranging from 0.49% to 0.89%, which was lower than <2% total energy set by European countries as the maximum legal content of TFA that contained <0.5 g/serving. In the U.S., Urban et al. (2014) [122] documented a sharp decline in saturated fat and TFA of large fries/1000 calories at three chains. After 2009, cheeseburgers were the major contributor of TFA/1000 calories, and the TFA content of this item remained stable through 2013. Finally, two studies of children’s meals reported on the TFA content. In 2012–2014, Eissa et al. (2017) [92] found that the TFA content in children’s meals was lower at QSR chains compared to FSR chains based on an analysis of 42 chains. In 2016, Mazariegos et al. (2016) [103] reported zero TFA content of five children’s meals at six chains that provided nutrition information in Guatemala.
3.7. Sodium or Salt
Of the 38 studies that examined the sodium or salt content of chain restaurant meals, two multi-country studies documented substantial differences in the sodium content of menu items that differed by food category at different QSR chains across nine countries [91,101]. Dunford et al. (2012) [91] documented that the mean sodium content of foods varied between chains and between the same products across six countries, and Khan et al. (2018) [101] found that two-thirds of sodium came from meats, chicken, and buns across four countries including Australia, Egypt, India, and the U.S. Studies across Australia [94,124], Canada [113,114,115,116], Costa Rica [97], Japan [120], New Zealand [93,106,123], and the U.S. [79,87,89,99,109,121,122,126] documented wide variation in the sodium content by restaurant chain and food category that precluded making generalizations about the sodium content of menu items within a single country and across countries. Only a small proportion of children’s meals met the recommended sodium targets in Australia [124], Japan [120], and U.S. [117]. A large proportion of entrees sold at U.S. chains exceeded the sodium target recommended by the DGA or FDA [79,87,89,122], and the sodium content of items either increased between 2000 and 2014 or decreased modestly for newly introduced items between 2012 and 2016 [99,109,121].
4. Discussion
This is the first systematic review to summarize the findings from the peer-reviewed literature to determine whether transnational restaurant chains used two strategies, reformulating food and beverage products and standardizing menu item portions and servings, to align with healthy dietary guidelines across franchise businesses in countries worldwide between 2000 and 2018. This study is important because poor diet is the leading risk factor for NCD mortality, especially among LMIC populations, associated with 11 million deaths and 255 million disability-adjusted life years [128]. A recent analysis showed an increase in the volume of ultra-processed food and beverage sales in South and Southeast Asia and North Africa and the Middle East between 2002 and 2016, which was positively associated with increased obesity risk during this period [129]. The WHO Action Plan encouraged governments and other stakeholders to adopt policies and actions to halt obesity and diabetes rates and reduce NCD mortality. Relevant actions include eliminating TFA and reducing sodium by 30% by 2025 [130].
These study results may inform decision-makers at transnational chain restaurants, and their franchise businesses to improve customers’ perceptions of their corporate brand image, increase trust, and brand loyalty [131], while also promoting healthy profile products and small portions that align with public health recommendations.
Step 1 of this study involved conducted a scoping review of dietary recommendations for restaurants chains. We identified general dietary and nutrient-specific recommendations issued by the WHO and/or FAO for individuals and populations to reduce processed foods and beverages high in energy, saturated fat, TFA, free or added sugars, and sodium. We also identified national governments and public health experts in Australia, Canada, the UK, and U.S. that issued recommendations for healthy food procurement and nutrition standards for various food service settings. We found only a few recommendations for transnational chain restaurants with quantitative nutrient targets but no clear specified timeline to improve the healthfulness of offerings.
The results of step 1 revealed a lack of clear, universal and internationally accepted standards for transnational restaurant chains to adopt portion or serving sizes for meals, beverages, side dishes, and desserts served to children, adolescents, and adults. Downsizing and standardizing portions are recommended as an important strategy for restaurants to reduce obesity and NCD risks for customers [51,132,133]. Some restaurant owners expressed concern about voluntarily reducing meal portions due to anticipated loss of revenue, lack of customer demand, and limited technical assistance [134].
A US evaluation of restaurant industry progress included four studies that found restaurant owners who participated in healthy restaurant programs were receptive to reducing portion sizes of children’s meals or side dishes, and the reductions led to fewer calories purchased or consumed by children [52]. Research also suggests that modest reformulation of restaurant products to reduce calories, fat, saturated fat, and sodium are acceptable to consumers [135].
Given the public scrutiny on transnational restaurant chain business practices that may contribute to obesity and NCDs, there is a need for an industry body, such as the US National Restaurant Association or International Food and Beverage Alliance, to encourage transnational chains to adopt standardize nutrient targets that meet healthy dietary guidelines (Table 3) and applied across all countries where they operate franchise businesses (Table 1). McDonald’s Corporation is the only transnational QSR chain that publicly announced commitments and performance metrics to sell healthy children’s meals in markets throughout Asia, Canada, Europe, and the U.S. by 2025 [136,137]. This global commitment is important for other chains to adopt because parents request that chain restaurants provide less expensive and smaller portions of healthy choices for their children [138].
Step 2 of this study involved conducting a systematic review of the peer-reviewed literature. We identified 50 published studies that collectively revealed great variation in the outcomes examined in 30 countries and five regions worldwide. A majority of studies that examined the energy and sodium content of menu items were in single countries, with only six multi-country studies that measured differences in these nutrients in 48 countries. Three-quarters (77%) of the studies were from high-income countries. Only five studies included LMICs in Africa (i.e., Ghana and Egypt) [101,108], Asia (i.e., China and India) [101,108], and Latin America (i.e., Brazil, Guatemala, and Peru) [103,108,119].
The results showed that two-thirds (68%) of the 50 studies reported various government, industry, or WHO guidelines or criteria used to compare their results. Due to the diversity of dietary guidelines and nutrient targets used, along with different menu items examined across various QSR, FCR, and FSR chains and non-chain restaurants, we were unable to directly compare the nutrient content changes in menu items within and across the countries between 2000 and 2018.
Recent U.S. studies (2012–2015) suggested that the 2010 national menu labeling law may have influenced leading chain restaurants to reformulate by reducing the energy content for newly introduced items, but not existing or time-limited menu items [83,84,85]. A separate evaluation showed that 78% of 90 popular QSR, FCR, and FSR chains either fully or partially complied with the U.S. national menu labeling law by the May 2018 implementation date [139]. However, the U.S. law does not require labeling disclosures for other nutrients of concern and thus may not have stimulated industry reformulation to reduce saturated fat, added sugars, and sodium in menu items.
The nutrient composition findings for menu items in other countries were less optimistic. In Australia, the energy and sodium content of menu items increased between 2009 and 2015 despite voluntary menu labeling legislated during this period [125]. Similarly, the body of research for Canada, New Zealand, and the UK reflected only a small proportion of adult or children’s meals that met healthy criteria. Governments could adopt policies and enact mandatory legislation to encourage the restaurant industry sector to meet healthy reformulation targets and standardize portions.
The WHO set a global target and commitment to assist governments and food service industries to eliminate industrial TFA from processed foods and use alternative healthy fat replacement by 2023 [140]. Only a few of the 28 studies reported on the TFA content of selected menu items. We found limited evidence that transnational restaurant chains reduced or eliminated TFA in menu offerings, which is especially relevant for chains that are expanding in LMIC markets.
Businesses, researchers, and civil society organizations could monitor and evaluate transnational chain restaurants’ progress to provide offerings that meet dietary guidelines and criteria across countries and regions. There is also a need for a central database to compare results across countries. An international collaboration was initiated in 2012 to track changes in the composition of fast foods across countries [141] but requires funding to support monitoring as the restaurant sector makes continuous changes in menu offerings. The Access to Nutrition Foundation monitors the nutrition-related policies and practices of global food and beverage manufacturers but not transnational restaurant chains [142]. This foundation could expand its monitoring efforts to the restaurant sector or fund researchers and civil society organizations to use the Business Impact Assessment (BIA)-Obesity [143] tool to compare policies, commitments, and actions to reformulate and reduce portions of menu items across countries and regions.
Researchers could also examine how transnational restaurant chains can combine marketing-mix and choice-architecture strategies to provide profitable and healthy options. Examples include using proportionate pricing and price promotions for healthy and affordable products; designating fruit, salad, and water as healthy default picks; using proximity or positioning to promote healthy affordable options; and using priming or prompting through information, labeling, or verbal cues to encourage customers to “downsize” portions to reduce their energy intake [51,52,144].
Study Strengths and Limitations
Strengths of this study were the aggregate of evidence for many types of transnational chain restaurants, the range of dietary outcomes examined for various menu offerings, the examination of temporal trends over 18 years for product reformulation, and portion sizes of items sold by restaurant chains countries and regions worldwide. We also assessed the quality of the studies published that was not conducted for previous systematic reviews published. Limitations were that we focused on comparing outcomes for nutrients of concern and not desirable nutrients such as whole grains and dietary fiber. We also limited this review to examined English-language, peer-reviewed publications and did not include studies published in other languages or gray-literature evidence sources such as industry or civil society organization reports. We also did not have access to proprietary industry data that could have revealed the frequency of consumption or sales by restaurant brand in the countries and regions examined. The different study designs and heterogeneity of study outcomes precluded the pooling of data to conduct a meta-analysis for the results across countries. Future research is needed to examine restaurant chain marketing practices aimed at children, variations in pricing strategies, and use of healthy default beverage and side dish choices for customers. These topics were beyond the scope of this study but are needed to inform future government policies and business practices.
5. Conclusions
The results of this scoping and systematic review suggest that there are only a few expert-recommended targets for transnational chain restaurants to improve the quality and healthfulness of their offerings to customers, but no internationally accepted standard appropriate for portion or serving sizes to prevent obesity. We also found no standardized assessment methods or metrics to evaluate transnational chain restaurants’ practices to improve menu offerings. There was wide variation within and across countries, regions, firms, and chains to reduce energy, saturated and trans fats, sodium, and standardized portions. Researchers should use standardized assessment methods, tools, and performance metrics to evaluate transnational chain restaurants’ practices to improve diet quality of menu offerings across countries and regions. These results may inform future research and encourage transnational chain restaurants to offer healthy product profiles and standardized portions to reduce obesity and NCD risks worldwide.
Supplementary Materials
The following are available online at https://www.mdpi.com/1660-4601/16/15/2732/s1, Table S1: Detailed search strategy used for the systematic review, Table S2: Published studies (n = 50) of transnational restaurant chains to reformulate products and standardize portions to meet healthy dietary guidelines, 2000–2018, Table S3: Published studies (n = 50) of transnational restaurant chains to reformulate products and standardize portions to meet healthy dietary guidelines by geographic region, 2000–2018.
Author Contributions
V.K., S.R.-G.P., and D.R. conceptualized the research questions and study design; S.R.-G.P. and D.R. conducted the systematic evidence review; V.K., S.R.-G.P., D.R., and E.K. analyzed the data; V.K. wrote the first draft of the manuscript, coordinated the feedback of the co-authors, and led the submission process. S.R.-G.P., D.R., and E.K. provided editorial feedback on subsequent drafts. All authors read and approved the final submission.
Acknowledgments
V.K. received partial funding from the Department of Human Nutrition, Foods, and Exercise at Virginia Tech to support staff salary to complete this paper. V.K., S.R.-G.P., D.R. and E.K. did not receive any funding from government or non-governmental agencies or commercial or private-sector entities to support the research or consulting related to this manuscript. We are grateful for the financial support awarded by Virginia Tech Libraries’ Open Access Subvention Fund to cover the publication costs and open access for this manuscript.
Conflicts of Interest
The authors declare no conflict of interest.
References
- National Restaurant Association. 2017 Restaurant Industry Outlook. Available online: https://www.restaurant.org/Downloads/PDFs/News-Research/2017_Restaurant_outlook_summary-FINAL.pdf (accessed on 24 May 2019).
- Ritzer, G. The McDonaldization of Society, 8th ed.; Sage Publications: Thousand Oaks, CA, USA, 2015. [Google Scholar]
- Schlosser, E. Fast Food Nation: The Dark Side of the All-American Meal; Houghton Mifflin Harcourt: Boston, MA, USA, 2001. [Google Scholar]
- DeMaria, A.N. Of fast food and franchises. J. Am. Coll. Cardiol. 2003, 41, 1227–1228. [Google Scholar] [CrossRef]
- Jayaraman, S. The workers who feed us: Poverty and food insecurity among U.S. restaurant and retail workers. In From Farm to Fork: Perspectives on Growing Sustainable Food Systems in the Twenty-First Century; University of Akron Press: Akron, OH, USA, 2016. [Google Scholar]
- Bahadoran, Z.; Mirmiran, P.; Azizi, F. Fast food pattern and cardiometabolic disorders: A review of current studies. Health Promot. Perspect. 2016, 5, 231–240. [Google Scholar] [CrossRef] [PubMed]
- Braithwaite, I.; Stewart, A.W.; Hancox, R.J.; Beasley, R.; Murphy, R.; Mitchell, E.A.; ISAAC Phase Three Study Group. Fast-food consumption and body mass index in children and adolescents: An international cross-sectional study. BMJ Open 2014, 4, e005813. [Google Scholar] [CrossRef] [PubMed]
- Nago, E.S.; Lachat, C.K.; Dossa, R.A.; Kolsteren, P.W. Association of out-of-home eating with anthropometric changes: A systematic review of prospective studies. Crit. Rev. Food Sci. Nutr. 2014, 54, 1103–1116. [Google Scholar] [CrossRef] [PubMed]
- Powell, L.M.; Nguyen, B.T. Fast-food and full-service restaurant consumption among children and adolescents: Effect on energy, beverage, and nutrient intake. JAMA Pediatr. 2013, 167, 14–20. [Google Scholar] [CrossRef] [PubMed]
- Nguyen, B.T.; Powell, L.M. The impact of restaurant consumption among US adults: Effects on energy and nutrient intakes. Public Health Nutr. 2014, 17, 2445–2452. [Google Scholar] [CrossRef] [PubMed]
- Rosenheck, R. Fast food consumption and increased caloric intake: A systematic review of a trajectory towards weight gain and obesity risk. Obes. Rev. 2008, 9, 535–547. [Google Scholar] [CrossRef] [PubMed]
- Seguin, R.A.; Aggarwal, A.; Vermeylen, F.; Drewnowski, A. Consumption frequency of foods away from home linked with higher body mass index and lower fruit and vegetable intake among adults: A cross sectional study. J. Environ. Public Health 2016, 2016, 3074241. [Google Scholar] [CrossRef] [PubMed]
- Smith, C.; Gray, A.R.; Fleming, E.A.; Parnell, W.R. Characteristics of fast food/takeaway-food and restaurant/café food consumers among New Zealand adults. Public Health Nutr. 2014, 17, 2368–2377. [Google Scholar] [CrossRef]
- Alturki, H.A.; Brooke, D.S.K. Comparative evidence of the consumption from fast-food restaurants between normal-weight and obese Saudi schoolchildren. Public Health Nutr. 2018, 21, 2280–2290. [Google Scholar] [CrossRef]
- Tambalis, K.D.; Panagiotakos, D.B.; Psarra, G.; Sidossis, L.S. Association between fast-food consumption and lifestyle characteristics in Greek children and adolescents; results from the EYZHN (National Action for Children’s Health) programme. Public Health Nutr. 2018, 21, 3386–3394. [Google Scholar] [CrossRef]
- Janssen, H.G.; Davies, I.G.; Richardson, L.D.; Stevenson, L. Determinants of takeaway and fast food consumption: A narrative review. Nutr. Res. Rev. 2018, 31, 16–34. [Google Scholar] [CrossRef]
- Zagorsky, J.L.; Smith, P.K. The association between socioeconomic status and adult fast-food consumption in the U.S. Econ. Hum. Biol. 2017, 27, 12–25. [Google Scholar] [CrossRef]
- Mackenbach, J.D.; Charreire, H.; Glonti, K.; Bárdos, H.; Rutter, H.; Compernolle, S.; de Bourdeaudhuij, I.; Nijpels, G.; Brug, J.; Oppert, J.; et al. Exploring the relation of spatial access to fast food outlets with body weight: A mediation analysis. Environ. Behav. 2018, 51, 1–30. [Google Scholar] [CrossRef]
- Jaworowska, A.; Blackham, T.; Davies, I.G.; Stevenson, L. Nutritional challenges and health implications of takeaway and fast food. Nutr. Rev. 2013, 71, 310–318. [Google Scholar] [CrossRef]
- Saksena, M.J.; Okrent, A.M.; Anekwe, T.D.; Cho, C.; Dicken, C.; Effland, A.; Elitzak, H.; Guthrie, J.; Hamrick, K.S.; Hyman, J.; et al. America’s Eating Habits: Food Away From Home, United States Department of Agriculture Economic Research Service, September 2018. Available online: https://www.ers.usda.gov/publications/pub-details/?pubid=90227 (accessed on 24 May 2019).
- Pereira, M.A.; Kartashov, A.I.; Ebbeling, C.B.; Van Horn, L.; Slattery, M.L.; Jacobs, D.R.J.; Ludwig, D.S. Fast-food habits, weight gain, and insulin resistance (the CARDIA study): 15-year prospective analysis. Lancet 2005, 365, 36–42. [Google Scholar] [CrossRef]
- Kant, A.K.; Graubard, B.I. A prospective study of frequency of eating restaurant prepared meals and subsequent 9-year risk of all-cause and cardiometabolic mortality in US adults. PLoS ONE 2018, 13, e0191584. [Google Scholar] [CrossRef]
- Neal, B.; Sacks, G.; Swinburn, B.; Vandevijvere, S.; Dunford, E.; Snowdon, W.; Webster, J.; Barquera, S.; Friel, S.; Hawkes, C.; et al. INFORMAS. Monitoring the levels of important nutrients in the food supply. Obes. Rev. 2013, 14, 49–58. [Google Scholar] [CrossRef]
- Ng, S.W.; Dunford, E. Complexities and opportunities in monitoring and evaluating US and global changes by the food industry. Obes. Rev. 2013, 14, 29–41. [Google Scholar] [CrossRef]
- Popkin, B.M.; Adair, L.S.; Ng, S.W. Global nutrition transition and the pandemic of obesity in developing countries. Nutr. Rev. 2012, 70, 3–21. [Google Scholar] [CrossRef]
- De Vogli, R.; Kouvonen, A.; Gimeno, D. The influence of market deregulation on fast food consumption and body mass index: A cross-national time series analysis. Bull. World Health Organ. 2014, 92, 99–107. [Google Scholar] [CrossRef]
- Daszkowski, D. The Expansion of American Fast Food Franchises, The Balance, 15 May 2018. Available online: https://www.thebalance.com/how-american-fast-food-franchises-expanded-abroad-1350955 (accessed on 24 May 2019).
- Rush Wirth, S. 2017 top 500: Limited Service Chains, Restaurant Business, 12 June 2017. Available online: http://www.restaurantbusinessonline.com/financing/2017-top-500-limited-service-chains (accessed on 24 May 2019).
- Popkin, B.M.; Reardon, T. Obesity and the Food System Transformation in Latin America. Obes. Rev. 2018, 19, 1028–1064. [Google Scholar] [CrossRef]
- Journalistic Inc. The Top 50 Fast Food Restaurants in America Ranked by Sales 2017, QSR Magazine, 2018. Available online: https://www.qsrmagazine.com/content/qsr50-2017-top-50-chart (accessed on 24 May 2019).
- Euromonitor International. Fast Food, 2018. Available online: http://www.euromonitor.com/fast-food (accessed on 24 May 2019).
- Searcy, D. The Global Siren Call of Fast Food, The New York Times, 2 October 2017. Available online: https://www.nytimes.com/series/obesity-epidemic (accessed on 24 May 2019).
- Searcey, D.; Ritchtel, M. Obesity was Rising as Ghana Embraced Fast Food, Then Came KFC. The New York Times, 2 October 2017. Available online: https://www.nytimes.com/series/obesity-epidemic (accessed on 24 May 2019).
- Zuckerman, J.C. Palm oil is everywhere in India—And Public-Health Experts are Concerned, The Nation, 28 September 2018. Available online: https://www.thenation.com/article/how-palm-oil-became-the-high-fructose-corn-syrup-of-the-developing-world/ (accessed on 24 May 2019).
- Langellier, B.A. Consumption and expenditure on food prepared away from home among Mexican adults in 2006. Salud Publica Mexico 2015, 57, 4–13. [Google Scholar] [CrossRef]
- Naidoo, N.; van Dam, R.M.; Ng, S.; Tan, C.S.; Chen, S.; Lim, J.Y.; Chan, M.F.; Chew, L.; Rebello, S.A. Determinants of eating at local and western fast-food venues in an urban Asian population: A mixed methods approach. Int. J. Behav. Nutr. Phys. Act. 2017, 14, 69. [Google Scholar] [CrossRef]
- Patel, O.; Shahulhameed, S.; Shivashankar, R.; Tayyab, M.; Rahman, A.; Prabhakaran, D.; Tandon, N.; Jaacks, L.M. Association between full service and fast food restaurant density, dietary intake and overweight/obesity among adults in Delhi, India. BMC Public Health 2017, 18, 36. [Google Scholar] [CrossRef]
- Olutayo, A.O.; Akanle, O. Fast food in Ibadan: An emerging consumption pattern. Africa 2009, 79, 207–227. [Google Scholar] [CrossRef]
- IBIS World. Global Fast Food Restaurants Industry Market. Research Report, January 2018. Available online: https://www.ibisworld.com/industry-trends/global-industry-reports/hotels-restaurants/fast-food-restaurants.html (accessed on 24 May 2019).
- Statista. Brand Value of the 10 Most Valuable Fast Food Brands Worldwide in 2018 (in Million U.S. Dollars), 2018. Available online: https://www.statista.com/statistics/273057/value-of-the-most-valuable-fast-food-brands-worldwide/ (accessed on 24 May 2019).
- Touryalai, H.; Stoller, K. (Eds.) Global 2000: The world’s Largest Public Companies: Restaurants, 2018. Available online: https://www.forbes.com/global2000/list/#industry:Restaurants (accessed on 24 May 2019).
- McDonald’s Corporation. 2017 Annual Report. Available online: https://corporate.mcdonalds.com/content/dam/gwscorp/investor-relations-content/annual-reports/McDonald%27s%202017%20Annual%20Report.pdf (accessed on 24 May 2019).
- Yum! Brands. 2017 Annual Report. Available online: http://www.yum.com/annualreport/ (accessed on 24 May 2019).
- Statista. Number of Domino’s Pizza Stores in Selected Countries Worldwide from 2010 to 2017, 2018. Available online: https://www.statista.com/statistics/207130/number-of-dominos-pizza-stores-worldwide-by-country/ (accessed on 24 May 2019).
- Fitzpatrick, H. The top 20 food franchises in the world, Business Insider, 25 July 2015. Available online: https://www.businessinsider.com/the-top-20-food-franchises-in-the-world-2015-7 (accessed on 24 May 2019).
- The Nielsen Company. What’s in Our Food and On Our Mind? Ingredient and Dining Out Trends around the World, August 2016. Available online: http://www.nielsen.com/content/dam/nielsenglobal/eu/docs/pdf/Global%20Ingredient%20and%20Out-of-Home%20Dining%20Trends%20Report%20FINAL%20(1).pdf (accessed on 24 May 2019).
- Technomic. 2018 Future of LSR Consumer Trend Report. Available online: https://www.technomic.com/available-studies/consumer-trend-reports/future-of-lsr (accessed on 24 May 2019).
- Marketforce Information. New Study from Market Force Information Reveals America’s Favorite Quick-Service Restaurants, 15 March 2017. Available online: http://www.marketforce.com/consumers-favorite-QSRs-2017-Market-Force-research (accessed on 24 May 2019).
- Wang, Y.; Wang, L.; Xue, H.; Qu, W. A review of the growth of the fast food industry in China and its potential impact on obesity. Int. J. Environ. Res. Public Health 2016, 13, 1112. [Google Scholar] [CrossRef]
- Newson, R.S.; van der Mass, R.; Beijersbergen, A.; Carlson, L.; Rosenbloom, C. International consumer insights into the desires and barriers of diners in choosing restaurant meals. Food Qual. Prefer. 2015, 43, 63–70. [Google Scholar] [CrossRef]
- Kraak, V.; Englund, T.; Misyak, S.; Serrano, E.L. A novel marketing mix and choice architecture framework to nudge restaurant customers toward healthy food environments to reduce obesity in the United States. Obes. Rev. 2017, 18, 852–868. [Google Scholar] [CrossRef]
- Kraak, V.; Englund, T.; Misyak, S.; Serrano, E. Progress evaluation for the restaurant industry assessed by a voluntary marketing-mix and choice-architecture framework that offers strategies to nudge American customers toward healthy food environments, 2006–2017. Int. J. Environ. Res. Public Health 2017, 14, 760. [Google Scholar] [CrossRef]
- Moher, D.; Shamseer, L.; Clarke, M.; Ghersi, D.; Liberati, A.; Petticrew, M.; Shekelle, P.; Stewart, L.A.; PRISMA-P Group. Preferred reporting items for systematic review and meta-analysis protocols (PRISMA-P) 2015 statement. Syst. Rev. 2015, 4, 1. [Google Scholar] [CrossRef]
- The Johanna Briggs Institute. Checklist for Analytical Cross-Sectional Studies, Adelaide, Australia, 2017. Available online: http://joannabriggs.org/research/critical-appraisal-tools.html (accessed on 24 May 2019).
- Food and Agriculture Organization of the United Nations. Food-Based Dietary Guidelines, 2018. Available online: http://www.fao.org/nutrition/education/food-based-dietary-guidelines/en/ (accessed on 24 May 2019).
- World Health Organization, Food and Agriculture Organization. Joint WHO/FAO Workshop on Fruit and Vegetables for Health. Kobe, Japan, 1–3 September 2004, WHO and FAO, 2005. Available online: http://www.who.int/dietphysicalactivity/publications/fruit_vegetables_report.pdf (accessed on 24 May 2019).
- World Health Organization. Global Strategy on Diet, Physical Activity, and Health. Report No. WHA57.17. Geneva: WHO, 2004. Available online: http://www.who.int/dietphysicalactivity/strategy/eb11344/en/index.html (accessed on 24 May 2019).
- World Health Organization. Follow-Up to the Political Declaration of the High-level Meeting of the General Assembly on the Prevention and Control of Non-communicable Diseases, 25 May 2013. Available online: http://apps.who.int/gb/ebwha/pdf_files/WHA66/A66_R10-en.pdf (accessed on 24 May 2019).
- World Health Organization. Potassium Intake for Adults and Children, Geneva: WHO, 2012. Available online: http://www.who.int/nutrition/publications/guidelines/potassium_intake/en/index.html (accessed on 24 May 2019).
- Food and Agriculture Organization of the United Nations. Fats and Fatty Acids in Human Nutrition, Report of an Expert Consultation, FAO Food and Nutrition Paper 91. Rome: FAO, 2010. Available online: http://www.fao.org/docrep/013/i1953e/i1953e00.pdf (accessed on 24 May 2019).
- World Health Organization. WHO Plan to Eliminate Industrially-Produced Trans-Fatty Acids from the Global Food Supply, 14 May 2018 [news release]. Available online: http://www.who.int/news-room/detail/14-05-2018-who-plan-to-eliminate-industrially-produced-trans-fatty-acids-from-global-food-supply (accessed on 24 May 2019).
- World Health Organization. Sugars Intake for Adults and Children, Guidelines. Geneva, Switzerland: WHO, 2015. Available online: https://www.who.int/nutrition/publications/guidelines/sugars_intake/en/ (accessed on 24 May 2019).
- World Health Organization. Guideline: Sodium Intake for Adults and Children, Geneva, Switzerland: WHO, 2012. Available online: http://www.who.int/nutrition/publications/guidelines/sodium_intake_printversion.pdf (accessed on 24 May 2019).
- U.S. Department of Health and Human Services and U.S. Department of Agriculture. 2015–2020 Dietary Guidelines for Americans, 8th Edition. Washington, DC: US Government Printing Office, December 2015. Available online: https://health.gov/dietaryguidelines/2015/ (accessed on 24 May 2019).
- National Health Service. The Eatwell Guide, 2016. England, United Kingdom. Available online: https://www.nhs.uk/live-well/eat-well/the-eatwell-guide/ (accessed on 24 May 2019).
- Australian Government. National Health and Medical Research Council. Department of Health and Ageing. Eat for Health: Educator Guide, Information for Nutrition Educators, 2013. Available online: https://www.eatforhealth.gov.au/guidelines (accessed on 24 May 2019).
- Canada’s Dietary Guidelines for Health Professionals and Policy Makers. Ottawa, Ontario: Health Canada, Minister of Health, 2019. Available online: https://food-guide.canada.ca/static/assets/pdf/CDG-EN-2018.pdf (accessed on 6 July 2019).
- National Health Service. One You Campaign. Keep Track of Calories with 400-600-600. Public Health England, United Kingdom, 2018. Available online: https://www.nhs.uk/oneyou/for-your-body/eat-better/keep-track-of-calories-400-600-600/ (accessed on 24 May 2019).
- Australian Government Department of Health. The Healthy Food Partnership. The Final Rationale and Recommendations of the Food Service Working Group, May 2018. Available online: http://health.gov.au/internet/main/publishing.nsf/Content/food-service (accessed on 24 May 2019).
- Raine, K.D.; Atkey, K.; Olstad, D.L.; Ferdinands, A.R.; Beaulieu, D.; Buhler, S.; Campbell, N.; Cook, B.; L’Abbé, M.; Lederer, A.; et al. Healthy food procurement and nutrition standards in public facilities: Evidence synthesis and consensus policy recommendations. Health Promot. Chronic Dis. Prev. Can. 2018, 38, 6–17. [Google Scholar] [CrossRef]
- Public Health England; Local Government Association. Strategies for Encouraging Healthier ‘Out of Home’ Food Provision. A Toolkit for Local Councils Working with Small Food Businesses, 2017. Available online: https://assets.publishing.service.gov.uk/government/uploads/system/uploads/attachment_data/file/604912/Encouraging_healthier_out_of_home_food_provision_toolkit_for_local_councils.pdf (accessed on 24 May 2019).
- The Keystone Center. Forum on Away-From-Home Foods: Opportunities for Preventing Weight Gain and Obesity, Washington, DC: Keystone Center 2006. Available online: https://www.keystone.org/wp-content/uploads/2015/08/053006-Report-on-Keystone-Forum-on-Preventing-Weight-Gain-and-Obesity.pdf (accessed on 24 May 2019).
- Centers for Disease Control and Prevention. US Department of Health and Human Services. Healthy Food Service Guidelines, August 2018. Available online: https://www.cdc.gov/obesity/strategies/food-serv-guide.html (accessed on 24 May 2019).
- National Restaurant Association. About the Kids LiveWell Program, 2018. Available online: https://www.restaurant.org/Industry-Impact/Food-Healthy-Living/Kids-LiveWell/About (accessed on 24 May 2019).
- American Heart Association. Heart-Check Meal Certification Program Nutrition Requirements, May 2018. Available online: https://www.heart.org/en/healthy-living/company-collaboration/heart-check-certification/heart-check-meal-certification-program-foodservice/heart-check-meal-certification-program-nutrition-requirements (accessed on 24 May 2019).
- Elbel, B.; Champagne, C.M.; Economos, C.D.; Cohen, D.; Harris, J.; Williams, J.D.; Shields, K.; Whitsel, L.P.; Lesser, L.I.; van Horn, L.; et al. Performance Standards for Restaurants. A New Approach to Addressing the Obesity Epidemic, Conference Proceedings, Santa Monica, CA: RAND Corporation 2013. Available online: https://www.rand.org/pubs/conf_proceedings/CF313.html (accessed on 24 May 2019).
- New York City Department of Health and Mental Hygiene. National Salt Reduction Initiative Restaurant Food Categories and Targets, 2014. Available online: https://www1.nyc.gov/assets/doh/downloads/pdf/cardio/cardio-salt-nsri-restaurant.pdf (accessed on 24 May 2019).
- Cohen, D.A.; Lesser, L.I.; Wright, C.; Story, M.; Economos, C. Kid’s menu portion sizes: How much should children be served? Nutr. Today 2016, 51, 273–280. [Google Scholar] [CrossRef]
- Ahuja, J.K.; Wasswa-Kintu, S.; Haytowitz, D.B.; Daniel, M.; Thomas, R.; Showell, B.; Nickle, M.; Roseland, J.M.; Gunn, J.; Cogswell, M.; et al. Sodium content of popular commercially processed and restaurant foods in the United States. Prev. Med. Rep. 2015, 2, 962–967. [Google Scholar] [CrossRef]
- Astiasarán, I.; Abella, E.; Gatta, G.; Ansorena, D. Margarines and fast-food french fries: Low content of trans fatty acids. Nutrients 2017, 9, 662. [Google Scholar] [CrossRef]
- Auchincloss, A.H.; Leonberg, B.L.; Glanz, K.; Bellitz, S.; Ricchezza, A.; Jervis, A. Nutritional value of meals at full-service restaurant chains. J. Nutr. Educ. Behav. 2014, 46, 75–81. [Google Scholar] [CrossRef]
- Bauer, K.W.; Hearst, M.O.; Earnest, A.A.; French, S.A.; Oakes, J.M.; Harnack, L.J. Energy content of U.S. fast-food restaurant offerings: 14-year trends. Am. J. Prev. Med. 2012, 43, 490–497. [Google Scholar] [CrossRef]
- Bleich, S.N.; Wolfson, J.A.; Jarlenski, M.P. Calorie changes in chain restaurant menu items: Implications for obesity and evaluations of menu labeling. Am. J. Prev. Med. 2015, 48, 70–75. [Google Scholar] [CrossRef]
- Bleich, S.N.; Wolfson, J.A.; Jarlenski, M.P. Calorie changes in large chain restaurants: Declines in new menu items but room for improvement. Am. J. Prev. Med. 2016, 50, e1–e8. [Google Scholar] [CrossRef]
- Bleich, S.N.; Wolfson, J.A.; Jarlenski, M.P. Calorie changes in large chain restaurants from 2008 to 2015. Prev. Med. 2017, 100, 112–116. [Google Scholar] [CrossRef]
- Brindal, E.; Mohr, P.; Wilson, C.; Wittert, G. Obesity and the effects of choice at a fast food restaurant. Obes. Res. Clin. Pract. 2008, 2, 111–117. [Google Scholar] [CrossRef] [PubMed]
- Bruemmer, B.; Krieger, J.; Saelens, B.E.; Chan, N. Energy, saturated fat, and sodium were lower in entrées at chain restaurants at 18 months compared with 6 months following the implementation of mandatory menu labeling regulation in King County, Washington. J. Assoc. Nutr. Diet. 2012, 112, 1169–1176. [Google Scholar] [CrossRef] [PubMed]
- Chand, A.; Eyles, H.; Ni Mhurchu, C. Availability and accessibility of healthier options and nutrition information at New Zealand fast food restaurants. Appetite 2012, 58, 227–233. [Google Scholar] [CrossRef] [PubMed]
- Deierlein, A.L.; Peat, K.; Claudio, L. Comparison of the nutrient content of children’s menu items at US restaurant chains, 2010–2014. Nutr. J. 2015, 14, 80. [Google Scholar] [CrossRef] [PubMed]
- Dunford, E.; Webster, J.; Barzi, F.; Neal, B. Nutrient content of products served by leading Australian fast food chains. Appetite 2010, 55, 484–489. [Google Scholar] [CrossRef] [PubMed]
- Dunford, E.; Webster, J.; Woodward, M.; Czernichow, S.; Yuan, W.L.; Jenner, K.; Ni Mhurchu, C.; Jacobson, M.; Campbell, N.; Neal, B. The variability of reported salt levels in fast foods across six countries: Opportunities for salt reduction. CMAJ 2012, 184, 1023–1028. [Google Scholar] [CrossRef] [PubMed]
- Eissa, M.A.; Hearne, K.; Saavedra, N. Comparison of children’s menu items at full- and quick-service restaurants. South. Med. J. 2018, 111, 192–197. [Google Scholar] [CrossRef] [PubMed]
- Eyles, H.; Jiang, Y.; Blakely, T.; Neal, B.; Crowley, J.; Cleghorn, C.; Ni Mhurchu, C. Five year trends in the serve size, energy, and sodium contents of New Zealand fast foods: 2012 to 2016. Nutr. J. 2018, 17, 65. [Google Scholar] [CrossRef]
- Garcia, J.; Dunford, E.K.; Sundtrom, J.; Neal, B.C. Changes in the sodium content of leading Australian fast-food products between 2009 and 2012. Med. J. Aust. 2014, 200, 340–344. [Google Scholar] [CrossRef]
- Garemo, M.; Naimi, A.A. Children’s meals at restaurants in Abu Dhabi, United Arab Emirates, have poor nutritional quality. Mediterr. J. Nutr. Metab. 2018, 11, 85–92. [Google Scholar] [CrossRef]
- Hearst, M.O.; Harnack, L.J.; Bauer, K.W.; Earnest, A.A.; French, S.A.; Michael Oakes, J. Nutritional quality at eight U.S. fast-food chains: 14-year trends. Am. J. Prev. Med. 2013, 44, 589–594. [Google Scholar] [CrossRef] [PubMed]
- Heredia-Blonval, K.; Blanco-Metzler, A.; Montero-Campos, M.; Dunford, E.K. The salt content of products from popular fast-food chains in Costa Rica. Appetite 2014, 83, 173–177. [Google Scholar] [CrossRef] [PubMed]
- Hobin, E.; White, C.; Li, Y.; Chiu, M.; O’Brien, M.F.; Hammond, D. Nutritional quality of food items on fast-food ‘kids’ menus’: Comparisons across countries and companies. Public Health Nutr. 2014, 17, 2263–2269. [Google Scholar] [CrossRef] [PubMed]
- Jacobson, M.F.; Havas, S.; McCarter, R. Changes in sodium levels in processed and restaurant foods, 2005 to 2011. JAMA Intern. Med. 2013, 173, 1285–1291. [Google Scholar] [CrossRef] [PubMed]
- Jarlenski, M.P.; Wolfson, J.A.; Bleich, S.N. Macronutrient composition of menu offerings in fast food restaurants in the U.S. Am. J. Prev. Med. 2016, 51, e91–e97. [Google Scholar] [CrossRef] [PubMed]
- Khan, M.A.; Khan, M.M.; Abdelhafiz Gadelrab, R.M. Sodium content in fast foods: Assessment of menu items in selected countries. J. Foodserv. Bus. Res. 2018, 21, 553–569. [Google Scholar] [CrossRef]
- Kirkpatrick, S.I.; Reedy, J.; Kahle, L.L.; Harris, J.L.; Ohri-Vachaspati, P.; Krebs-Smith, S.M. Fast-food menu offerings vary in dietary quality, but are consistently poor. Public Health Nutr. 2014, 17, 924–931. [Google Scholar] [CrossRef]
- Mazariegos, S.; Chacón, V.; Cole, A.; Barnoya, J. Nutritional quality and marketing strategies of fast food children’s combo meals in Guatemala. BMC Obes. 2016, 3, 52. [Google Scholar] [CrossRef]
- Moran, A.J.; Block, J.P.; Goshev, S.G.; Bleich, S.N.; Roberto, C.A. Trends in nutrient content of children’s menu items in U.S. chain restaurants. Am. J. Prev. Med. 2017, 52, 284–291. [Google Scholar] [CrossRef]
- O’Donnell, S.I.; Hoerr, S.L.; Mendoza, J.A.; Tsuei Goh, E. Nutrient quality of fast food kids meals. Am. J. Clin. Nutr. 2008, 88, 1388–1395. [Google Scholar]
- Prentice, C.A.; Smith, C.; McLean, R.M. Sodium in commonly consumed fast foods in New Zealand: A public health opportunity. Public Health Nutr. 2016, 19, 958–966. [Google Scholar] [CrossRef] [PubMed][Green Version]
- Reeves, S.; Wake, Y.; Zick, A. Nutrition labeling and portion size information on children’s menus in fast-food and table-service chain restaurants in London, UK. J. Nutr. Educ. Behav. 2011, 43, 543–547. [Google Scholar] [CrossRef] [PubMed]
- Roberts, S.B.; Das, S.K.; Suen, V.M.M.; Pihlajamäki, J.; Kuriyan, R.; Steiner-Asiedu, M.; Taetzsch, A.; Anderson, A.K.; Silver, R.E.; Barger, K.; et al. Measured energy content of frequently purchased restaurant meals: Multi-country cross sectional study. BMJ 2018, 363, k4864. [Google Scholar] [CrossRef] [PubMed]
- Rudelt, A.; French, S.; Harnack, L. Fourteen-year trends in sodium content of menu offerings at eight leading fast-food restaurants in the USA. Public Health Nutr. 2014, 17, 1682–1688. [Google Scholar] [CrossRef] [PubMed]
- Schoffman, D.E.; Davidson, C.R.; Hales, S.B.; Crimarco, A.E.; Dahl, A.A.; Turner-McGrievy, G.M. The fast-casual conundrum: Fast-casual restaurant entrees are higher in calories than fast food. J. Acad. Nutr. Diet. 2016, 116, 1606–1612. [Google Scholar] [CrossRef] [PubMed]
- Scourboutakos, M.J.; L’Abbé, M.R. Restaurant menus: Calories, calorie density, and serving size. Am. J. Prev. Med. 2012, 43, 249–255. [Google Scholar] [CrossRef]
- Scourboutakos, M.J.; Semnani-Azad, Z.; L’Abbe, M.R. Restaurant meals: Almost a full day’s worth of calories, fats, and sodium. JAMA Intern. Med. 2013, 173, 1373–1374. [Google Scholar] [CrossRef]
- Scourboutakos, M.J.; Semnani-Azad, Z.; L’Abbé, M.R. Added sugars in kids’ meals from chain restaurants. Prev. Med. Rep. 2016, 3, 391–393. [Google Scholar] [CrossRef]
- Scourboutakos, M.J.; L’Abbé, M.R. Sodium levels in fast-food and sit-down restaurants. Can. J. Public Health. 2013, 104, 2–8. [Google Scholar]
- Scourboutakos, M.J.; Murphy, S.A.; L’Abbé, M.R. Association between salt substitutes/enhancers and changes in sodium levels in fast-food restaurants: A cross-sectional analysis. CMAJ 2018, 6, E118–E125. [Google Scholar] [CrossRef][Green Version]
- Scourboutakos, M.J.; L’Abbé, M.R. Changes in sodium levels in chain restaurant foods in Canada (2010–2013): A longitudinal study. CMAJ 2014, 2, 343–351. [Google Scholar] [CrossRef] [PubMed]
- Sliwa, S.; Anzman-Frasca, S.; Lynskey, V.; Washburn, K.; Economos, C. Assessing the availability of healthier children’s meals at leading quick-serve and full-service restaurants. J. Nutr. Educ. Behav. 2016, 48, 242–249. [Google Scholar] [CrossRef] [PubMed]
- Soo, J.; Harris, J.L.; Davison, K.K.; Williams, D.R.; Roberto, C.A. Changes in the nutritional quality of fast-food items marketed at restaurants, 2010 v. 2013. Public Health Nutr. 2018, 21, 2117–2127. [Google Scholar] [CrossRef] [PubMed]
- Stender, S.; Dyerberg, J.; Astrup, A. High levels of industrially produced trans fat in popular fast foods. N. Engl. J. Med. 2006, 354, 1650–1652. [Google Scholar] [CrossRef] [PubMed]
- Uechi, K. Nutritional quality of meals offered to children (kids’ meals) at chain restaurants in Japan. Public Health Nutr. 2018, 21, 3101–3110. [Google Scholar] [CrossRef] [PubMed]
- Urban, L.E.; Roberts, S.B.; Fierstein, J.L.; Gary, C.E.; Lichtenstein, A.H. Temporal trends in fast-food restaurant energy, sodium, saturated fat, and trans fat content, United States, 1996–2013. Prev. Chronic Dis. 2014, 11, 140202. [Google Scholar] [CrossRef] [PubMed]
- Urban, L.E.; Roberts, S.B.; Fierstein, J.L.; Gary, C.E.; Lichtenstein, A.H. Sodium, saturated fat, and trans fat content per 1,000 kilocalories: Temporal trends in fast-food restaurants, United States, 2000–2013. Prev. Chronic Dis. 2014, 11, E228. [Google Scholar] [CrossRef] [PubMed]
- Waterlander, W.E.; Eyles, H.; Whitworth, L. Healthiness of popular fast food items in New Zealand: Plenty of room for improvement. N. Z. Med. J. 2014, 127, 102–105. [Google Scholar] [PubMed]
- Wellard, L.; Glasson, C.; Chapman, K. Fries or a fruit bag? Investigating the nutritional composition of fast food children’s meals. Appetite 2012, 58, 105–110. [Google Scholar] [CrossRef]
- Wellard-Cole, L.; Goldsbury, D.; Havill, M.; Hughes, C.; Watson, W.L.; Dunford, E.K.; Chapman, K. Monitoring the changes to the nutrient composition of fast foods following the introduction of menu labelling in New South Wales, Australia: An observational study. Public Health Nutr. 2018, 21, 1194–1199. [Google Scholar] [CrossRef]
- Wolfson, J.A.; Moran, A.J.; Jarlenski, M.P.; Bleich, S.N. Trends in sodium content of menu items in large chain restaurants in the U.S. Am. J. Prev. Med. 2018, 54, 28–36. [Google Scholar] [CrossRef] [PubMed]
- Ziauddeen, N.; Fitt, E.; Edney, L.; Dunford, E.; Neal, B.; Jebb, S.A. Variability in the reported energy, total fat and saturated fat contents in fast-food products across ten countries. Public Health Nutr. 2015, 18, 2962–2969. [Google Scholar] [CrossRef] [PubMed][Green Version]
- Afshin, A.; Sur, P.J.; Fay, K.A. Health effects of dietary risks in 195 countries, 1990-2017: A systematic analysis for the Global Burden of Disease Study 2017. Lancet 2019, 393, 1958–1972. [Google Scholar] [CrossRef]
- Vandevijvere, S.; Jaacks, L.M.; Monteiro, C.A.; Moubarac, J.C.; Girling-Butcher, M.; Lee, A.C.; Pan, A.; Bentham, J.; Swinburn, B. Global trends in ultra-processed food and drink product sales and their association with adult body mass index trajectories. Obes. Rev. 2019, 1–10. [Google Scholar] [CrossRef]
- World Health Organization. Global Action Plan for the Prevention and Control of Noncommunicable Diseases 2013–2020, Geneva: WHO; 2013. Available online: http://apps.who.int/iris/bitstream/handle/10665/94384/9789241506236_eng.pdf;jsessionid=16A7E6805FBAB03802848E12F76944D9?sequence=1 (accessed on 24 May 2019).
- Kim, E.; Ham, S. Restaurants’ disclosure of nutritional information as a corporate social responsibility initiative: customers’ attitudinal and behavioral responses. Int. J. Hosp. Manag. 2016, 55, 96–106. [Google Scholar] [CrossRef]
- Marteau, T.M.; Hollands, G.J.; Shemilt, I.; Jebb, S.A. Downsizing: Policy options to reduce portion sizes to help tackle obesity. BMJ 2015, 351, h5863. [Google Scholar] [CrossRef]
- Cohen, D.A.; Story, M. Mitigating the health risks of dining out: The need for standardized portion sizes in restaurants. Am. J. Public Health 2014, 104, 586–590. [Google Scholar] [CrossRef]
- Gase, L.; Dunning, L.; Kuo, T.; Simon, P.; Fielding, J.E. Restaurant owners’ perspectives on a voluntary program to recognize restaurants for offering reduced-size portions, Los Angeles County, 2012. Prev. Chronic Dis. 2014, 11, E44. [Google Scholar] [CrossRef]
- Patel, A.A.; Lopez, N.V.; Lawless, H.T.; Njike, V.; Beleche, M.; Katz, D.L. Reducing calories, fat, saturated fat, and sodium in restaurant menu items: Effects on consumer acceptance. Obesity (Silver Spring) 2016, 12, 2497–2508. [Google Scholar] [CrossRef]
- Alliance for a Healthier Generation. McDonald’s Announces Global Commitments to Support Families with Increased Focus on Happy Meals, 15 February 2018 [news release]. Available online: https://www.healthiergeneration.org/news__events/2018/02/15/1968/mcdonalds_announces_global_commitment_to_support_families_with_increased_focus_on_happy_meals (accessed on 24 May 2019).
- McDonald’s & Alliance for a Healthier Generation. Five-Year Progress Report on 2013 Commitments, May 2019. Available online: https://www.healthiergeneration.org/our-work/businesses/impact/mcdonalds-commitment/five-year-interactive-report (accessed on 24 May 2019).
- Lee-Kwan, S.H.; Park, S.; Maynard, L.; Blanck, H.M. One menu please: Parents want affordable, right-sized portions for their children in restaurants. Clin. Nutr. Res. 2018, 7, 241–247. [Google Scholar] [CrossRef]
- Cleveland, L.P.; Simon, D.; Block, J.P. Compliance in 2017 with federal calorie labelling in 90 chain restaurants and 10 retail food outlets prior to required implementation. Am. J. Public Health 2018, 108, 1099–1102. [Google Scholar] [CrossRef] [PubMed]
- World Health Organization. Fats, Oils, Food and Food Service Industries should Join Global Effort to Eliminate Industrial Trans Fat from Processed Food by 2023, 23 April 2019 [media release]. Available online: https://www.who.int/news-room/detail/23-04-2019-fats-oils-food-and-food-service-industries-should-join-global-effort-to-eliminate-industrial-trans-fat-from-processed-food-by-2023 (accessed on 24 May 2019).
- Food Monitoring Group. International collaborative project to compare and track the nutritional composition of fast foods. BMC Public Health 2012, 12, 559. [Google Scholar] [CrossRef] [PubMed]
- Access to Nutrition Index. Global Index 2018: Marketing, May 2018. Available online: https://www.accesstonutrition.org/sites/gl18.atnindex.org/files/resources/atni_report_global_index_2018.pdf (accessed on 24 May 2019).
- Sacks, G.; Vanderlee, L.; Robinson, E.; Vandevijvere, S.; Cameron, A.; Ni Mhurchu, C.; Lee, A.; See Hoe, W.; Karupaiah, T.; Vergeer, L.; et al. BIA-Obesity (Business Impact Assessment—Obesity and population-level nutrition): A tool and process to assess food company policies and commitments related to obesity prevention and population nutrition at the national level. Obes. Rev. 2019. [Google Scholar] [CrossRef] [PubMed]
- Schwartz, J.; Riis, J.; Elbel, B.; Ariely, D. Inviting consumers to downsize fast-food portions significantly reduces calorie consumption. Health Aff. (Millwood) 2012, 31, 399–407. [Google Scholar] [CrossRef] [PubMed]
© 2019 by the authors. Licensee MDPI, Basel, Switzerland. This article is an open access article distributed under the terms and conditions of the Creative Commons Attribution (CC BY) license (http://creativecommons.org/licenses/by/4.0/).