Environmental Assessment and Evaluation of Oxidative Stress and Genotoxicity Biomarkers Related to Chronic Occupational Exposure to Benzene

 , ,
, ,  , ,
, ,
Abstract
1. Introduction
2. Materials and Methods
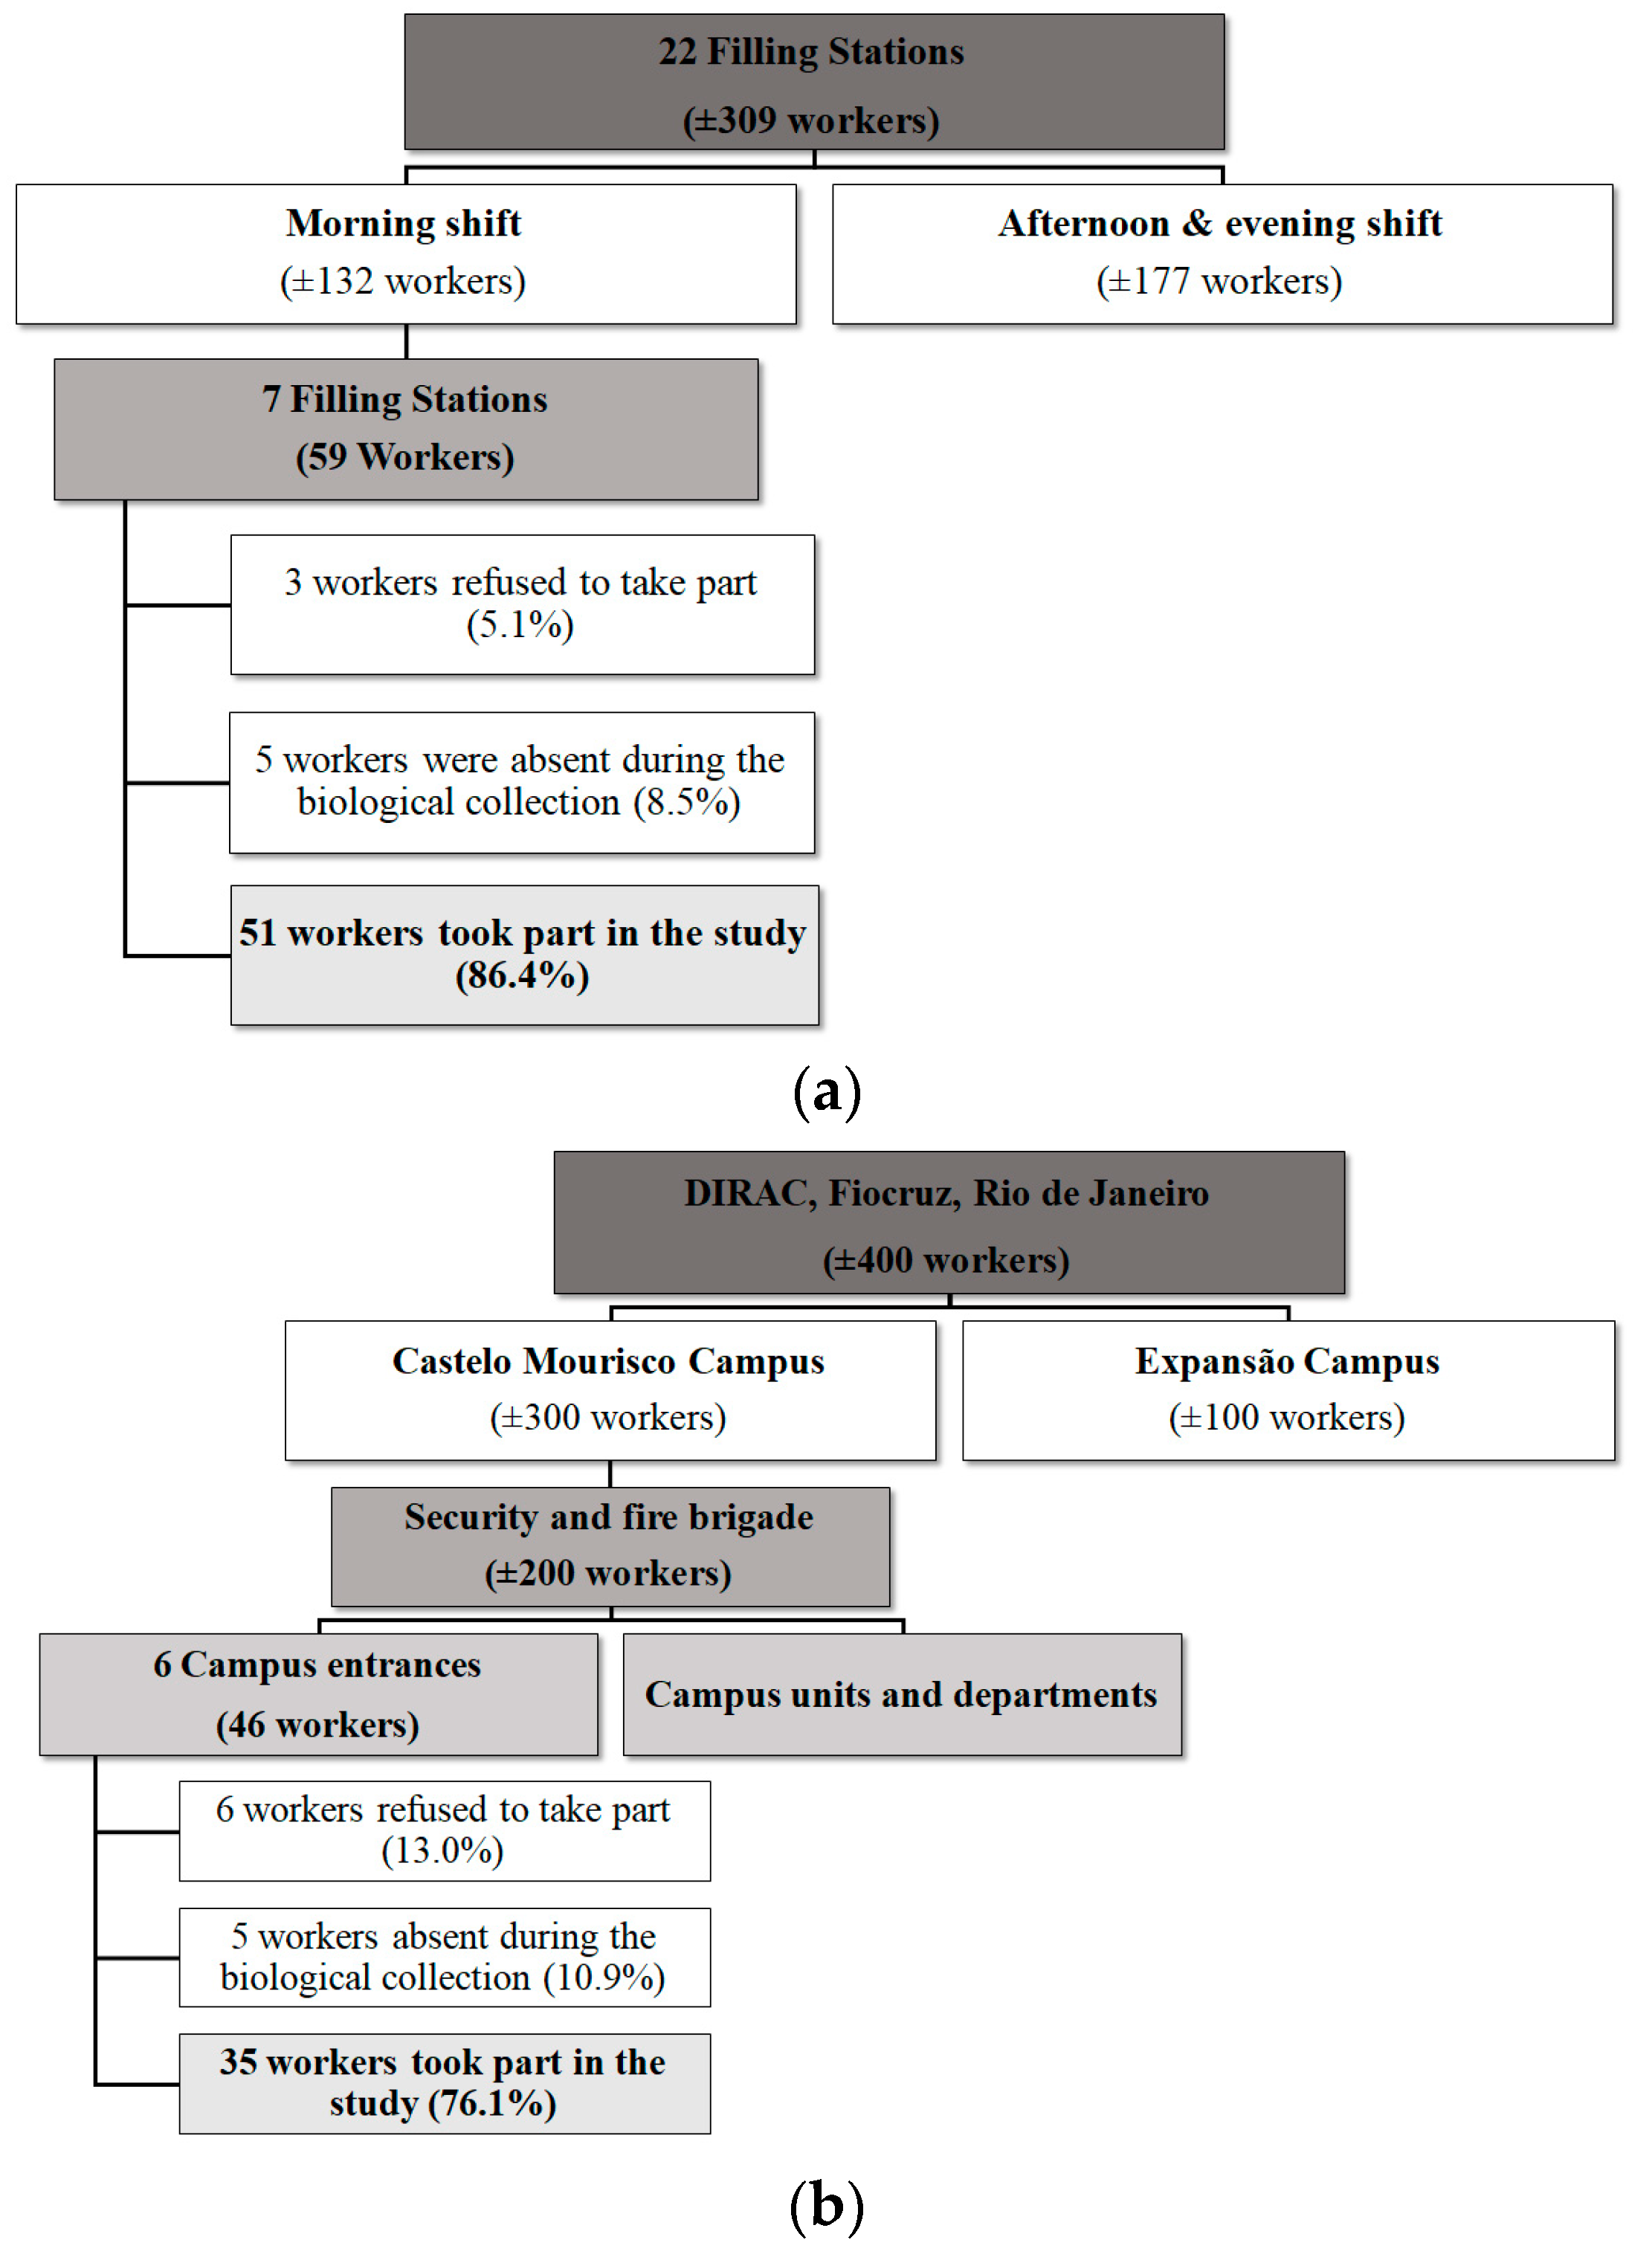
2.1. Environmental Assessment
2.2. Clinical Assessment
2.3. Evaluation of Exposure, Oxidative Stress, and Genotoxicity Biomarkers
2.3.1. Determination of trans,trans-Muconic Acid (ttMA)
2.3.2. Determination of S-phenylmercapturic Acid (S-PMA)
2.3.3. Determination of Catalase Activity
2.3.4. Determination of Glutathione S-transferase (GST) Enzyme Activity
2.3.5. Determination of Superoxide Dismutase (SOD) Enzyme Activity
2.3.6. Thiol Group (THIOL) Analysis
2.3.7. Determination of Malondialdehyde (MDA)
2.3.8. Chromosomal Anomalies (Chromosomal Aberrations, Breaks, Fragments, and Premature Chromatid Separation)
2.3.9. Nuclear Abnormalities (Micronuclei, Binucleated Cells and Broken Egg Cells)
2.3.10. Comet Assay with FPG (C-FPG)
2.3.11. Methylation Analysis
2.4. Statistical Analysis
3. Results
4. Discussion
5. Limitations of the Study
6. Conclusions
Author Contributions
Funding
Acknowledgments
Conflicts of Interest
References
- Okumura, L.L.; Stradiotto, N.R. Simultaneous determination of neutral nitrogen compounds in gasoline and diesel by differential pulse voltammetry. Talanta 2007, 72, 1106–1113. [Google Scholar] [CrossRef]
- Tunsaringkarn, T.; Siriwong, W.; Rungsiyothin, A.; Nopparatbundit, S. Occupational exposure of gasoline station workers to BTEX compounds in Bangkok, Thailand. Int. J. Occup. Environ. Med. 2012, 3, 117–125. [Google Scholar] [PubMed]
- Loomis, D.; Guyton, K.Z.; Grosse, Y.; El Ghissassi, F.; Bouvard, V.; Benbrahim-Tallaa, L.; Guha, N.; Vilahur, N.; Mattock, H.; Straif, K. Carcinogenicity of benzene. Lancet Oncol. 2017, 18, 1574–1575. [Google Scholar] [CrossRef]
- Moura-Correa, M.J.; Larentis, A.L. Exposure to benzene at work and its effects on health. Rev. Bras. Saude Ocup. 2017, 42 (Suppl. 1), e14s. [Google Scholar]
- Silva, T.F.; Rodrigues, D.R.F.; Coutinho, G.B.F.; Soares, M.; Almeida, M.S.; Sarcinelli, P.N.; Mattos, R.C.O.C.; Larentis, A.L.; Matos, G.G.O. Ototoxicity of hydrocarbons present in gasoline: A literature review. Rev. CEFAC 2018, 20, 110–121. [Google Scholar] [CrossRef][Green Version]
- Agência Nacional do Petróleo, gás natural e biocombustíveis (ANP). Portaria no 309, de 27 de Dezembro de 2001; Estabelece as especificações para a comercialização de gasolinas automotivas no Brasil; Diário Oficial da União (DOU), Brazil; 2001. Available online: http://legislacao.anp.gov.br/?path=legislacao-anp/portarias-anp/tecnicas/2001/dezembro&item=panp-309--2001 (accessed on 27 May 2019).
- International Agency for Research on Cancer (IARC). Chemical Agents and Related Occupations; International Agency for Research on Cancer (IARC): Lyon, France, 2012. [Google Scholar]
- World Health Organization (WHO). Environmental Health Criteria; 214. Human exposure Assessment; International Programme on Chemical Safety: Geneva, Switzerland; ICPS: Geneva, Switzerland, 2000. [Google Scholar]
- American Conference of Governmental Industrial Hygienists (ACGIH). 2012 TLVs and BEIs: Based on the Documentation of the Threshold Limit Values for Chemical Substances and Physical Agents &Biological Exposure Indices; ACGIH Signature Publications: Cincinnati, OH, USA, 2012. [Google Scholar]
- Carrieri, M.; Bonfiglio, E.; Scapellato, M.L.; Maccà, I.; Tranfo, G.; Faranda, P.; Paci, E.; Bartolucci, G.B. Comparison of exposure assessment methods in occupational exposure to benzene in gasoline filling-station attendants. Toxicol. Lett. 2006, 162, 146–152. [Google Scholar] [CrossRef] [PubMed]
- Valente, D.; Costa-Amaral, I.C.; Carvalho, L.V.B.; Santos, M.V.C.; Castro, V.S.; Rodrigues, D.R.F.; Falco, A.D.; Silva, C.B.; Nogueira, S.M.; Gonçalves, E.S.; et al. Use of genotoxicity biomarkers and gene expression on the evaluation of gas station attendants exposed to gasoline fumes. Rev. Bras. Saude Ocup. 2017, 42 (Suppl. 1), e2s. [Google Scholar]
- Benites, C.I.; Amado, L.L.; Vianna, R.A.P.; Martino-Roth, M.D.G. Micronucleus test on gas station attendants. Genet. Mol. Res. 2006, 5, 45–54. [Google Scholar]
- Lacerda, L.P.; Dantas, E.B.; Cerqueira, G.D.S.; Peron, A.P.; Sousa, J.M.C. Occupational toxicology study emphasizing the cytotoxic and mutagenic activity among workers exposed to gasoline. Biotemas 2015, 28, 135. [Google Scholar] [CrossRef][Green Version]
- Mitri, S.; Fonseca, A.; Otero, U.; Tabalipa, M.; Moreira, J.; Sarcinelli, P. Metabolic Polymorphisms and Clinical Findings Related to Benzene Poisoning Detected in Exposed Brazilian Gas-Station Workers. Int. J. Environ. Res. Public Health 2015, 12, 8434–8447. [Google Scholar] [CrossRef]
- Moro, A.M.; Charão, M.F.; Brucker, N.; Durgante, J.; Baierle, M.; Bubols, G.; Goethel, G.; Fracasso, R.; Nascimento, S.; Bulcão, R.; et al. Genotoxicity and oxidative stress in gasoline station attendants. Mutat. Res. 2013, 754, 63–70. [Google Scholar] [CrossRef] [PubMed]
- Rosa, J.C.F.; Fiegenbaum, M.; Soledar, A.L.; Claus, M.S.; Souza Nunes, A.D.; Cardoso, V.V. Cytogenetic evaluation and the association with polymorphisms of the CPY1A1 and NR1I3 genes in individuals exposed to BTEX. Environ. Monit. Assess. 2013, 185, 5883–5890. [Google Scholar] [CrossRef] [PubMed]
- Santiago, J.A.; Scherzer, C.R.; Potashkin, J.A. Network Analysis Identifies SOD2 mRNA as a Potential Biomarker for Parkinson’s Disease. PLoS ONE 2014, 9, e109042. [Google Scholar] [CrossRef] [PubMed]
- Trevisan, P.; Silva, J.N.; Silva, A.P.; Rosa, R.F.M.; Paskulin, G.A.; Thiesen, F.V.; de Oliveira, C.A.V.; Zen, P.R.G. Evaluation of genotoxic effects of benzene and its derivatives in workers of gas stations. Environ. Monit. Assess. 2014, 186, 2195–2204. [Google Scholar] [CrossRef] [PubMed]
- Campos, M.A.A.; Fernandes, A.P.S.M.; André, L.C. Comet assay as a biomarker of genotoxicity to assess occupational exposure to benzene in gas-station attendants and fuel analysts. Rev. Bras. Saude Ocup. 2017, 42 (Suppl. 1), e6s. [Google Scholar]
- Costa-Amaral, I.C.; Carvalho, L.V.B.; Pimentel, J.N.S.; Pereira, A.C.; Vieira, J.A.; Castro, V.S.; Borges, R.M.; Alves, S.R.; Nogueira, S.M.; Tabalipa, M.M.; et al. Environmental assessment of BTEX (benzene, toluene, ethylbenzene, xylenes) and biomarkers of genotoxicity in gas stations workers. Rev. Bras. Saude Ocup. 2017, 42 (Suppl. 1), e8s. [Google Scholar]
- Hays, S.M.; Pyatt, D.W.; Kirman, C.R.; Aylward, L.L. Biomonitoring Equivalents for benzene. Regul. Toxicol. Pharmacol. 2012, 62, 62–73. [Google Scholar] [CrossRef] [PubMed]
- Meek, M.E.; Klaunig, J.E. Proposed mode of action of benzene-induced leukemia: Interpreting available data and identifying critical data gaps for risk assessment. Chem. Biol. Interact. 2010, 184, 279–285. [Google Scholar] [CrossRef]
- Yoon, B.I.; Hirabayashi, Y.; Kawasaki, Y.; Kodama, Y.; Kaneko, T.; Kim, D.Y.; Inoue, T. Mechanism of action of benzene toxicity: Cell cycle suppression in hemopoietic progenitor cells (CFU-GM). Exp. Hematol. 2001, 29, 278–285. [Google Scholar] [CrossRef]
- McHale, C.M.; Zhang, L.; Smith, M.T. Current understanding of the mechanism of benzene-induced leukemia in humans: Implications for risk assessment. Carcinogenesis 2012, 33, 240–252. [Google Scholar] [CrossRef]
- Rappaport, S.M.; Kim, S.; Lan, Q.; Vermeulen, R.; Waidyanatha, S.; Zhang, L.; Li, G.; Yin, S.; Hayes, R.B.; Rothman, N.; et al. Evidence that humans metabolize benzene via two pathways. Environ. Health Perspect. 2009, 117, 946–952. [Google Scholar] [CrossRef] [PubMed]
- Cox, L.A.; Schnatter, A.R.; Boogaard, P.J.; Banton, M.; Ketelslegers, H.B. Non-parametric estimation of low-concentration benzene metabolism. Chem. Biol. Interact. 2017, 278, 242–255. [Google Scholar] [CrossRef] [PubMed]
- McNally, K.; Sams, C.; Loizou, G.D.; Jones, K. Evidence for non-linear metabolism at low benzene exposures? A reanalysis of data. Chem. Biol. Interact. 2017, 278, 256–268. [Google Scholar] [CrossRef] [PubMed]
- Vlaanderen, J.; Portengen, L.; Rothman, N.; Lan, Q.; Kromhout, H.; Vermeulen, R. Flexible Meta-Regression to Assess the Shape of the Benzene–Leukemia Exposure–Response Curve. Environ. Health Perspect. 2009, 118, 526–532. [Google Scholar] [CrossRef] [PubMed]
- Snyder, R. Xenobiotic Metabolism and the Mechanism(s) of Benzene Toxicity. Drug Metab. Rev. 2004, 36, 531–547. [Google Scholar] [CrossRef] [PubMed]
- Snyder, R. Leukemia and Benzene. Int. J. Environ.Res. Public. Health 2012, 9, 2875–2893. [Google Scholar] [CrossRef] [PubMed]
- Snyder, R. Benzene’s toxicity: A consolidated short review of human and animal studies by HA Khan. Hum. Exp. Toxicol. 2007, 26, 687–696. [Google Scholar] [CrossRef] [PubMed]
- Moura-Correa, M.J.; Pinheiro, R.D.C.; Carvalho, L.V.B.; Menezes, M.A.C.; Nussbaumer, L.; Jacobina, A.J.R.; Nobre, L.C.C. Uses and applications of the Form for Sanitary Inspection of Work Processes and Environments in Gas Stations, Santa Catarina state, Brazil. Rev. Bras. Saude Ocup. 2017, 42 (Suppl. 1), e10s. [Google Scholar]
- The National Institute for Occupational Safety and Health (NIOSH). Hidrocarbons, Aromatic: Method 1501. In NIOSH Manual of Analytical Methods (NMAM), 4th ed.; The National Institute for Occupational Safety and Health (NIOSH): Washington, DC, USA, 2003; Volume 3, pp. 2–7. [Google Scholar]
- Waidyanatha, S.; Rothman, N.; Li, G.; Smith, M.T.; Yin, S.; Rappaport, S.M. Rapid determination of six urinary benzene metabolites in occupationally exposed and unexposed subjects. Anal. Biochem. 2004, 327, 184–199. [Google Scholar] [CrossRef]
- Ducos, P.; Gaudin, R.; Robert, A.; Francin, J.M.; Maire, C. Improvement in HPLC analysis of urinary trans, trans-muconic acid, a promising substitute for phenol in the assessment of benzene exposure. Int. Arch. Occup. Environ. Health 1990, 62, 529–534. [Google Scholar] [CrossRef]
- Paula, F.C.S.; Silveira, J.N.; Junqueira, R.G.; Leite, E.M.A. Avaliação do ácido trans, trans-mucônico urinário como biomarcador de exposição ao benzeno. Rev. Saúde Pública 2003, 37, 780–785. [Google Scholar] [CrossRef] [PubMed]
- Gomes, R.P.; Pena, C.B.; Rezende, J.; Coutrim, M.X.; Afonso, R.J.C.F. Validation of a new high-throughput method to determine urinary S-phenylmercapturic acid using low-temperature partitioning extraction and ultra high performance liquid chromatography-mass spectrometry. J. Sep. Sci. 2017, 40, 550–557. [Google Scholar] [CrossRef] [PubMed]
- Góth, L. A simple method for determination of serum catalase activity and revision of reference range. Clin. Chim. Acta 1991, 196, 143–151. [Google Scholar] [CrossRef]
- Habig, W.H.; Pabst, M.J.; Jakoby, W.B. Glutathione S-transferases. The first enzymatic step in mercapturic acid formation. J. Biol. Chem. 1974, 249, 7130–7139. [Google Scholar]
- Habdous, M.; Vincent-Viry, M.; Visvikis, S.; Siest, G. Rapid spectrophotometric method for serum glutathione S-transferases activity. Clin. Chim. Acta. 2002, 326, 131–142. [Google Scholar] [CrossRef]
- Hu, M.L. Measurement of protein thiol groups and glutathione in plasma. Methods Enzymol. 1994, 233, 380–385. [Google Scholar]
- Moorhead, P.S.; Nowell, P.C.; Mellman, W.J.; Battips, D.M.; Hungerford, D.A. Chromosome preparations of leukocytes cultured from human peripheral blood. Exp. Cell Res. 1960, 20, 613–616. [Google Scholar] [CrossRef]
- Carrano, A.V.; Natarajan, A.T. Considerations for population monitoring using cytogenetic techniques. Mutat. Res. 1988, 204, 379–406. [Google Scholar] [CrossRef]
- Thomas, P.; Holland, N.; Bolognesi, C.; Kirsch-Volders, M.; Bonassi, S.; Zeiger, E.; Knasmueller, S.; Fenech, M. Buccal micronucleus cytome assay. Nat. Protoc. 2009, 4, 825–837. [Google Scholar] [CrossRef]
- Shaposhnikov, S.; Azqueta, A.; Henriksson, S.; Meier, S.; Gaivão, I.; Huskisson, N.H.; Smart, A.; Brunborg, G.; Nilsson, M.; Collins, A.R. Twelve-gel slide format optimised for comet assay and fluorescent in situ hybridisation. Toxicol. Lett. 2010, 195, 31–34. [Google Scholar] [CrossRef]
- Santos, M.V.C. Seleção in silico de genes alterados pela exposição ao benzeno e avaliação do padrão de metilação de LINE-1 em trabalhadores de postos de combustíveis na Zona Oeste do Rio de Janeiro/RJ. M.Sc. Dissertation, Escola Nacional de Saúde Pública Sergio Arouca/Fundação Oswaldo Cruz (ENSP/Fiocruz), Rio de Janeiro, Brazil, 24 April 2018. [Google Scholar]
- Bollati, V.; Baccarelli, A.; Hou, L.; Bonzini, M.; Fustinoni, S.; Cavallo, D.; Byun, H.-M.; Jiang, J.; Marinelli, B.; Pesatori, A.C.; et al. Changes in DNA Methylation Patterns in Subjects Exposed to Low-Dose Benzene. Cancer Res. 2007, 67, 876–880. [Google Scholar] [CrossRef] [PubMed]
- Santos, M.V.C.; Larentis, A.L.; Perini, J.A. Prediction and characterisation of biomarker network for benzene exposure. Occup. Environ. Med. 2018, 75, A411. [Google Scholar]
- Fonseca, A.S.A.; Costa, D.F.; Dapper, V.; Machado, J.M.H.; Valente, D.; Carvalho, L.V.B.; Costa-Amaral, I.C.; Alves, S.R.; Sarcinelli, P.N.; Menezes, M.A.C.; et al. Clinical-laboratory classification for clinical management of workers exposed to benzene in gas stations. Rev. Bras. Saude Ocup. 2017, 42 (Suppl. 1), e5s. [Google Scholar]
- Valdati, K.D.; Henneberg, R.; Nascimento, A.J. Hematological reference ranges among healthy adults of Curitiba, PR, Brazil. Rev. Bras. Hematol. Hemoter. 2011, 33, 395–396. [Google Scholar] [CrossRef] [PubMed][Green Version]
- Bolden, A.L.; Kwiatkowski, C.F.; Colborn, T. New Look at BTEX: Are Ambient Levels a Problem? Environ. Sci. Technol. 2015, 49, 5261–5276. [Google Scholar] [CrossRef] [PubMed]
- Moura-Correa, M.J.; Jacobina, A.J.R.; Santos, S.A.; Pinheiro, R.D.C.; Menezes, M.A.C.; Tavares, A.M.; Pinto, N.F. Exposure to benzene in gas stations in Brazil: Occupational health surveillance (VISAT) network. Ciênc. Saúde Colet. 2014, 19, 4637–4648. [Google Scholar] [CrossRef]
- Lagorio, S.; Ferrante, D.; Ranucci, A.; Negri, S.; Sacco, P.; Rondelli, R.; Cannizzaro, S.; Torregrossa, M.V.; Cocco, P.; Forastiere, F.; et al. Exposure to benzene and childhood leukaemia: A pilot case-control study. BMJ Open 2013, 3, 1–11. [Google Scholar] [CrossRef]
- Costa, M.F.B. Estudo da Aplicabilidade do ácido trans, trans-mucônico Urinário Como Indicador Biológico de Exposição ao Benzeno. D.Sc. Thesis, Escola Nacional de Saúde Pública Sergio Arouca/Fundação Oswaldo Cruz (ENSP/Fiocruz), Rio de Janeiro, Brazil, 19 June 2001. [Google Scholar]
- Rekhadevi, P.; Rahman, M.F.; Mahboob, M.; Grover, P. Genotoxicity in Filling Station Attendants Exposed to Petroleum Hydrocarbons. Ann. Occup. Hyg. 2010. [Google Scholar]
- Laurentino, L.S.; Marques, M.R.C.; Corrêa, S.M. Impacto ambiental de kartódromos situados na cidade do Rio de Janeiro: Monitoramento de BTEX no ar e do nível de ruído. Quím. Nova 2012, 35, 1865–1869. [Google Scholar] [CrossRef]
- Martins, L.D.; Andrade, M.F.; Ynoue, R.Y.; Albuquerque, É.L.; Tomaz, E.; Vasconcellos, P.C. Ambiental volatile organic compounds in the megacity of São Paulo. Quím. Nova 2008, 31, 2009–2013. [Google Scholar] [CrossRef]
- Kim, S.; Vermeulen, R.; Waidyanatha, S.; Johnson, B.A.; Lan, Q.; Smith, M.T.; Zhang, L.; Li, G.; Shen, M.; Yin, S.; et al. Modeling Human Metabolism of Benzene Following Occupational and Environmental Exposures. Cancer Epidemiol. Biomarkers Prev. 2006, 15, 2246–2252. [Google Scholar] [CrossRef] [PubMed]
- Qu, Q.; Shore, R.; Li, G.; Jin, X.; Chen, L.C.; Cohen, B.; Melikian, A.A.; Eastmond, D.; Rappaport, S.M.; Yin, S.; et al. Hematological changes among Chinese workers with a broad range of benzene exposures. Am. J. Ind. Med. 2002, 42, 275–285. [Google Scholar] [CrossRef] [PubMed]
- Carrieri, M.; Spatari, G.; Tranfo, G.; Sapienza, D.; Scapellato, M.L.; Bartolucci, G.B.; Manno, M. Biological monitoring of low level exposure to benzene in an oil refinery: Effect of modulating factors. Toxicol. Lett. 2018, 298, 70–75. [Google Scholar] [CrossRef] [PubMed]
- Boogaard, P.J. Biomonitoring of the Workplace and Environment. In General and Applied Toxicology; Ballantyne, B., Marrs, T.C., Syversen, T., Eds.; John Wiley & Sons, Ltd.: Chichester, UK, 2009. [Google Scholar]
- Gobba, F.; Rovesti, S.; Borella, P.; Vivoli, R.; Caselgrandi, E.; Vivoli, G. Inter-individual variability of benzene metabolism to trans,trans-muconic acid and its implications in the biological monitoring of occupational exposure. Sci. Total Environ. 1997, 199, 41–48. [Google Scholar] [CrossRef]
- Jalai, A.; Ramezani, Z.; Ebrahim, K. Urinary Trans, Trans-Muconic Acid is Not a Reliable Biomarker for Low-level Environmental and Occupational Benzene Exposures. Saf. Health Work 2017, 8, 220–225. [Google Scholar] [CrossRef] [PubMed]
- Santos, M.V.C.; Figueiredo, V.O.; Arcuri, A.S.A.; Costa-Amaral, I.C.; Gonçalves, E.S.; Larentis, A.L. Aspectos toxicológicos do benzeno, biomarcadores de exposição e conflitos de interesses. Rev. Bras. Saude Ocup. 2017, 42 (Suppl. 1), e13s. [Google Scholar] [CrossRef]
- Melikian, A.A.; Qu, Q.; Shore, R.; Li, G.; Li, H.; Jin, X.; Cohen, B.; Chen, L.; Li, Y.; Yin, S.; et al. Personal exposure to different levels of benzene and its relationships to the urinary metabolites S-phenylmercapturic acid and trans,trans-muconic acid. J. Chromatogr. B Analyt. Technol. Biomed. Life Sci. 2002, 778, 211–221. [Google Scholar] [CrossRef]
- Barata-Silva, C.; Mitri, S.; Pavesi, T.; Saggioro, E.; Moreira, J.C. Benzeno: Reflexos sobre a saúde pública, presença ambiental e indicadores biológicos utilizados para a determinação da exposição. Cad. Saúde Colet. 2014, 22, 329–342. [Google Scholar] [CrossRef]
- Gonçalves, E.S.; Borges, R.M.; Carvalho, L.V.B.; Alves, S.R.; Moreira, J.C. Analytical strategies with chromatography and mass spectrometry for biomonitoring of benzene exposure by determination of urinary S-phenylmercaturic acid. Rev. Bras. Saude Ocup. 2017, 42 (Suppl. 1), e1s. [Google Scholar]
- Agency for Toxic Substances and Disease Registry (ATSDR). Toxicological Profile for Benzene; U.S. Department of Health and Human Services, Public Health Service: Atlanta, GA, USA, 2007.
- International Agency for Research on Cancer (IARC). WHO Classification of Tumours of Haematopoietic and Lymphoid Tissues, 4th ed.; World Health Organization International Agency for Research on Cancer: Lyon, France, 2008. [Google Scholar]
- Huber, P.C.; Almeida, W.P.; de Fátima, Â. Glutathione and related enzymes: Biological roles and importance in pathological processes. Quím. Nova 2008, 31, 1170–1179. [Google Scholar] [CrossRef]
- Göethel, G.; Brucker, N.; Moro, A.M.; Charão, M.F.; Fracasso, R.; Barth, A.; Bubols, G.; Durgante, J.; Nascimento, S.; Baierle, M.; et al. Evaluation of genotoxicity in workers exposed to benzene and atmospheric pollutants. Mutat. Res.Genet. Toxicol. Environ. Mutagen. 2014, 770, 61–65. [Google Scholar] [CrossRef] [PubMed]
- Sellappa, S.; Sadhanandhan, B.; Francis, A.; Vasudevan, S.G. Evaluation of Genotoxicity in Petrol Station Workers in South India Using Micronucleus Assay. Ind. Health 2010, 48, 852–856. [Google Scholar] [CrossRef] [PubMed]
- Çelık, A.; Çavaş, T.; Ergene-Gözükara, S. Cytogenetic biomonitoring in petrol station attendants: Micronucleus test in exfoliated buccal cells. Mutagenesis 2003, 18, 417–421. [Google Scholar] [CrossRef] [PubMed]
- Hallare, A.V.; Gervasio, M.K.R.; Gervasio, P.L.G.; Acacio-Claro, P.J.B. Monitoring genotoxicity among gasoline station attendants and traffic enforcers in the City of Manila using the micronucleus assay with exfoliated epithelial cells. Environ. Monit. Assess. 2009, 156, 331–341. [Google Scholar] [CrossRef] [PubMed]
- Azqueta, A.; Arbillaga, L.; Lopez de Cerain, A.; Collins, A. Enhancing the sensitivity of the comet assay as a genotoxicity test, by combining it with bacterial repair enzyme FPG. Mutagenesis 2013, 28, 271–277. [Google Scholar] [CrossRef] [PubMed]
- Santos-Mello, R.; Cavalcante, B. Cytogenetic studies on gas station attendants. Mutat. Res. Toxicol. 1992, 280, 285–290. [Google Scholar] [CrossRef]
- Çelık, A.; Akbaş, E. Evaluation of sister chromatid exchange and chromosomal aberration frequencies in peripheral blood lymphocytes of gasoline station attendants. Ecotoxicol. Environ. Saf. 2005, 60, 106–112. [Google Scholar] [CrossRef] [PubMed]
- Fracasso, M.E.; Doria, D.; Bartolucci, G.B.; Carrieri, M.; Lovreglio, P.; Ballini, A.; Soleo, L.; Tranfo, G.; Manno, M. Low air levels of benzene: Correlation between biomarkers of exposure and genotoxic effects. Toxicol. Lett. 2010, 192, 22–28. [Google Scholar] [CrossRef] [PubMed]
- Lovreglio, P.; Maffei, F.; Carrieri, M.; D’Errico, M.N.; Drago, I.; Hrelia, P.; Bartolucci, G.B.; Soleo, L. Evaluation of chromosome aberration and micronucleus frequencies in blood lymphocytes of workers exposed to low concentrations of benzene. Mutat. Res. Toxicol. Environ. Mutagen. 2014, 770, 55–60. [Google Scholar] [CrossRef]
- Costa-Amaral, I.C.; Joca, F.J.G.; Carvalho, L.V.B.; Castro, V.S.; Pereira, N.C.; Murata, M.M.; Mainenti, H.R.D.; Mitri, S.; Ribeiro, P.C.; Rodrigues, C.F.; et al. Evaluation of Genotoxic Effects of Asbestos on Occupationally Exposed Workers in Brazil. Biomonitoring 2016, 3, 25–33. [Google Scholar] [CrossRef]
- Evelo, C.T.; Bos, R.P.; Borm, P.J. Decreased glutathione content and glutathione S-transferase activity in red blood cells of coal miners with early stages of pneumoconiosis. Occup. Environ. Med. 1993, 50, 633–636. [Google Scholar] [CrossRef] [PubMed][Green Version]
- Azqueta, A.; Collins, A.R. The essential comet assay: A comprehensive guide to measuring DNA damage and repair. Arch. Toxicol. 2013, 87, 949–968. [Google Scholar] [CrossRef] [PubMed]
- Collins, A.R. Measuring oxidative damage to DNA and its repair with the comet assay. Biochim. Biophys. Acta 2014, 1840, 794–800. [Google Scholar] [CrossRef] [PubMed]
- Fustinoni, S.; Rossella, F.; Polledri, E.; Bollati, V.; Campo, L.; Byun, H.-M.; Agnello, L.; Consonni, D.; Pesatori, A.C.; Baccarelli, A.; et al. Global DNA methylation and low-level exposure to benzene. Med. Lav. 2012, 103, 84–95. [Google Scholar] [PubMed]
- Seow, W.J.; Pesatori, A.C.; Dimont, E.; Farmer, P.B.; Albetti, B.; Ettinger, A.S.; Bollati, V.; Bolognesi, C.; Roggieri, P.; Panev, T.I.; et al. Urinary Benzene Biomarkers and DNA Methylation in Bulgarian Petrochemical Workers: Study Findings and Comparison of Linear and Beta Regression Models. PLoS ONE 2012, 7, e50471. [Google Scholar] [CrossRef]
- Humbert, M.; Halter, V.; Shan, D.; Laedrach, J.; Leibundgut, E.O.; Baerlocher, G.M.; Tobler, A.; Fey, M.F.; Tschan, M.P. Deregulated expression of Kruppel-like factors in acute myeloid leukemia. Leuk. Res. 2011, 35, 909–913. [Google Scholar] [CrossRef] [PubMed]
- Song, J.; Kim, C.J.; Cho, Y.G.; Kim, S.Y.; Nam, S.W.; Lee, S.H.; Yoo, N.J.; Lee, J.Y.; Park, W.S. Genetic and epigenetic alterations of the KLF6 gene in hepatocellular carcinoma. J. Gastroenterol. Hepatol. 2006, 21, 1286–1289. [Google Scholar] [CrossRef]
- McHale, C.M.; Zhang, L.; Lan, Q.; Li, G.; Hubbard, A.E.; Forrest, M.S.; Vermeulen, R.; Chen, J.; Shen, M.; Rappaport, S.M.; et al. Changes in the peripheral blood transcriptome associated with occupational benzene exposure identified by cross-comparison on two microarray platforms. Genomics 2009, 93, 343–349. [Google Scholar] [CrossRef]


| Variables | Groups of Workers Exposed to Benzene | ||||
|---|---|---|---|---|---|
| Filling Stations (I) | Campus Entrances (II) | Total | |||
| n (n = 51) * | % | n (n = 35) * | % | n (n = 86) * | |
| Age group (years) | |||||
| ≥18 to <25 | 11 | 21.6 | 2 | 5.7 | 13 |
| ≥25 to ≤39 | 26 | 51.0 | 8 | 22.9 | 34 |
| >40 | 14 | 27.5 | 25 | 71.4 | 39 |
| Sex | |||||
| Male | 43 | 84.3 | 29 | 82.9 | 72 |
| Female | 8 | 15.7 | 6 | 17.1 | 14 |
| Race/ethnicity | |||||
| White | 14 | 29.2 | 4 | 12.5 | 18 |
| Black/brown | 33 | 68.7 | 28 | 87.5 | 61 |
| Indigenous | 1 | 2.1 | - | - | 1 |
| Marital status | |||||
| Married/separated | 33 | 64.7 | 25 | 86.2 | 58 |
| Single | 18 | 33.3 | 4 | 13.8 | 22 |
| Education | |||||
| 9 years of schooling | 15 | 29.4 | 6 | 20.7 | 21 |
| 12 years of schooling | 33 | 64.7 | 22 | 75.9 | 55 |
| Higher ed. (unfinished) | 3 | 5.9 | 1 | 3.5 | 4 |
| Tobacco use | |||||
| Smokers | 10 | 20.00 | 6 | 21.4 | 16 |
| Used to smoke | 9 | 18.0 | 6 | 21.4 | 15 |
| Never smoked | 31 | 62.0 | 16 | 57.1 | 47 |
| Alcohol use | |||||
| Drinks | 36 | 70.6 | 14 | 50.0 | 50 |
| Used to drink | 3 | 5.9 | 3 | 10.7 | 6 |
| Never drank | 12 | 23.5 | 11 | 39.3 | 23 |
| Group of Workers Exposed to Benzene | |||||||||||
|---|---|---|---|---|---|---|---|---|---|---|---|
| Variables | Filling Stations (I) | Campus Entrances (II) | |||||||||
| n | Mean (SD) | Median | 25th Percentile | 75th Percentile | n | Mean (SD) | Median | 25th Percentile | 75th Percentile | p-Value | |
| Benzene (µg m−3) | 30 | 14.85(9.85) | 12.96 | ≤LQ | 21.46 | 18 | ≤LQ (-) | ≤LQ | ≤LQ | ≤LQ | 0.0001*† |
| Toluene (µg m−3) | 30 | 20.18 (14.30) | 17.03 | ≤LQ | 27.04 | 18 | 24.19 (67.80) | 6.70 | ≤LQ | 10.04 | 0.008† |
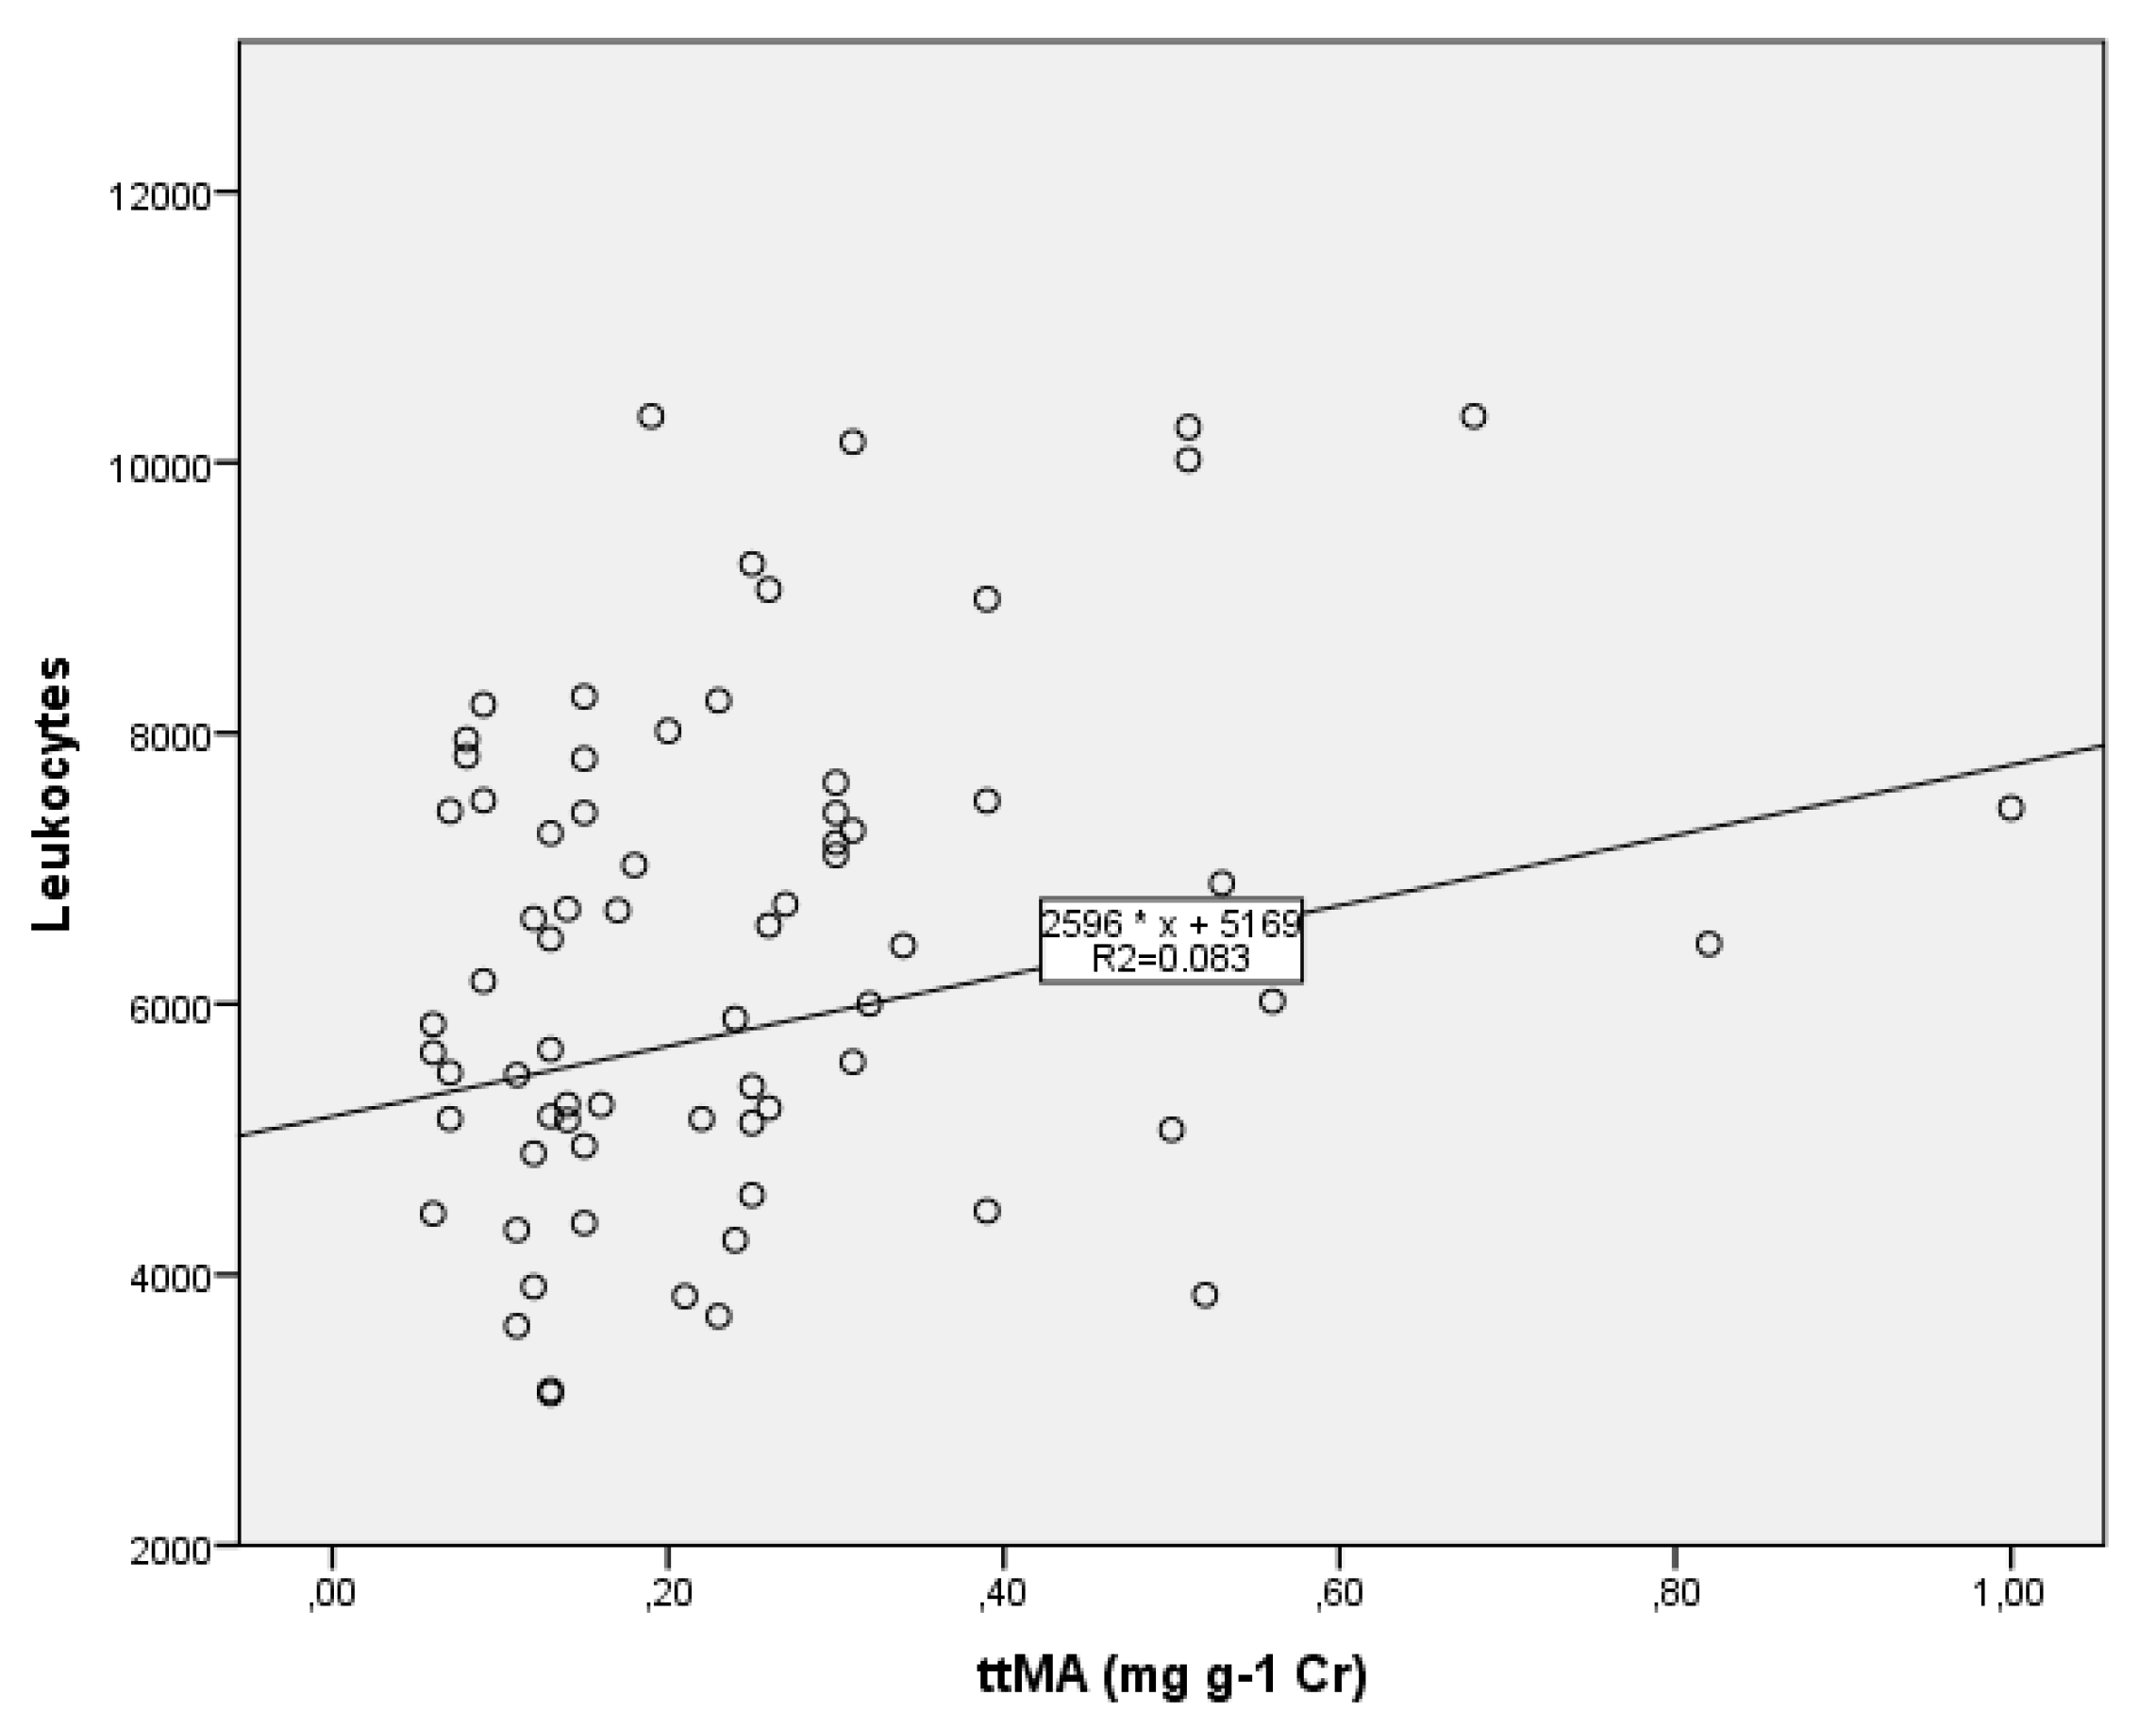
| ttMA (mg g−1 Cr) | 51 | 0.24 (0.19) | 0.18 | 0.13 | 0.30 | 35 | 0.26 (0.17) | 0.23 | 0.12 | 0.32 | 0.392 |
| S-PMA (µg g−1 Cr) | 36 | 3.54 (2.47) | ≤LQ | ≤LQ | 4.45 | 32 | 3.38 (0.76) | ≤LQ | ≤LQ | 3.34 | 0.301 |
| Biomarkers of Exposure | ||||||||||
|---|---|---|---|---|---|---|---|---|---|---|
| Tobacco Use | ttMA (mg g−1 Cr) | S-PMA (µg g−1 Cr) | ||||||||
| n | Mean (SD) | Median | Minimum | Maximum | n | Mean (SD) | Median | Minimum | Maximum | |
| Filling Stations (I) | ||||||||||
| Never smoked | 23 | 0.19* (0.19) | 0.14 | <LQ | 1.00 | 23 | 3.58 (2.54) | <LQ | <LQ | 14.60 |
| Used to smoke | 6 | 0.17 (0.07) | 0.13 | <LQ | 0.27 | 6 | <LQ | <LQ | <LQ | <LQ |
| Smokers | 5 | 0.45* (0.26) | 0.50 | 0.13 | 0.82 | 5 | 3.43 (0.57) | <LQ | <LQ | 4.45 |
| Campus Entrances (II) | ||||||||||
| Never smoked | 8 | 0.27 (0.19) | 0.21 | <LQ | 0.56 | 8 | 3.60 (1.18) | <LQ | <LQ | 6.52 |
| Used to smoke | 3 | 0.18 (0.06) | 0.15 | 0.15 | 0.25 | 3 | <LQ | <LQ | <LQ | <LQ |
| Smokers | 4 | 0.24 (0.10) | 0.26 | <LQ | 0.32 | 4 | 3.24 (0.12) | <LQ | <LQ | 3.41 |
| Group of Workers Exposed to Benzene | |||||||||
|---|---|---|---|---|---|---|---|---|---|
| Variables | Filling Stations (I) | Campus Entrances (II) | |||||||
| n | Mean (SD) | Minimum | Maximum | n | Mean (SD) | Minimum | Maximum | p-Value | |
| Oxidative stress | |||||||||
| CAT (kU/L) | 50 | 41.37 (32.91) | 5.62 | 154.65 | 28 | 37.06 (13.47) | 11.65 | 87.56 | 0.468 |
| GST (U/L) | 50 | 20.23 (17.97) | 1.98 | 121.25 | 28 | 13.47(4.12) | 0.00 | 20.08 | 0.169 |
| SOD (U/mL) | 50 | 1.90 (1.14) | 0.08 | 5.50 | 28 | 1.87 (0.97) | 0.11 | 4.21 | 0.851 |
| THIOL (mM) | 50 | 0.40 (0.13) | 0.19 | 0.98 | 28 | 0.44 (0.05) | 0.32 | 0.55 | 0.001* |
| MDA (µM) | 50 | 5.39 (5.53) | 0.56 | 24.51 | 28 | 1.19 (0.54) | 0.66 | 2.70 | 0.0001* |
| Chromosomal aberrations | |||||||||
| MCA (MCA/100 met) | 51 | 73.25 (132.04) | 0 | 841 | 35 | 72.43 (100.21) | 2 | 570 | 0.474 |
| NCBk (NCBk/100 met) | 51 | 6.80 (11.49) | 0 | 73 | 35 | 1.40 (2.53) | 0 | 13 | 0.0001* |
| Frag (Frag/100 met) | 51 | 11.90 (22.03) | 0 | 141 | 35 | 2.80 (5.07) | 0 | 26 | 0.002* |
| PCS (PCS/100 met) | 51 | 2.18 (4.37) | 0 | 27 | 35 | 2.51 (2.61) | 0 | 9 | 0.046* |
| Nuclear Abnormalities | |||||||||
| MN (MN/1000 cells) | 51 | 1.19 (1.28) | 0 | 6.00 | 35 | 0.72 (0.51) | 0 | 1.50 | 0.237 |
| BEC (BEC/1000 cells) | 51 | 0.39 (0.74) | 0 | 2.50 | 35 | 2.14 (1.47) | 0 | 5.50 | 0.0001* |
| BNC (BNC/1000 cells) | 51 | 0.12 (0.28) | 0 | 1.50 | 35 | 0.91 (0.90) | 0 | 3.50 | 0.0001* |
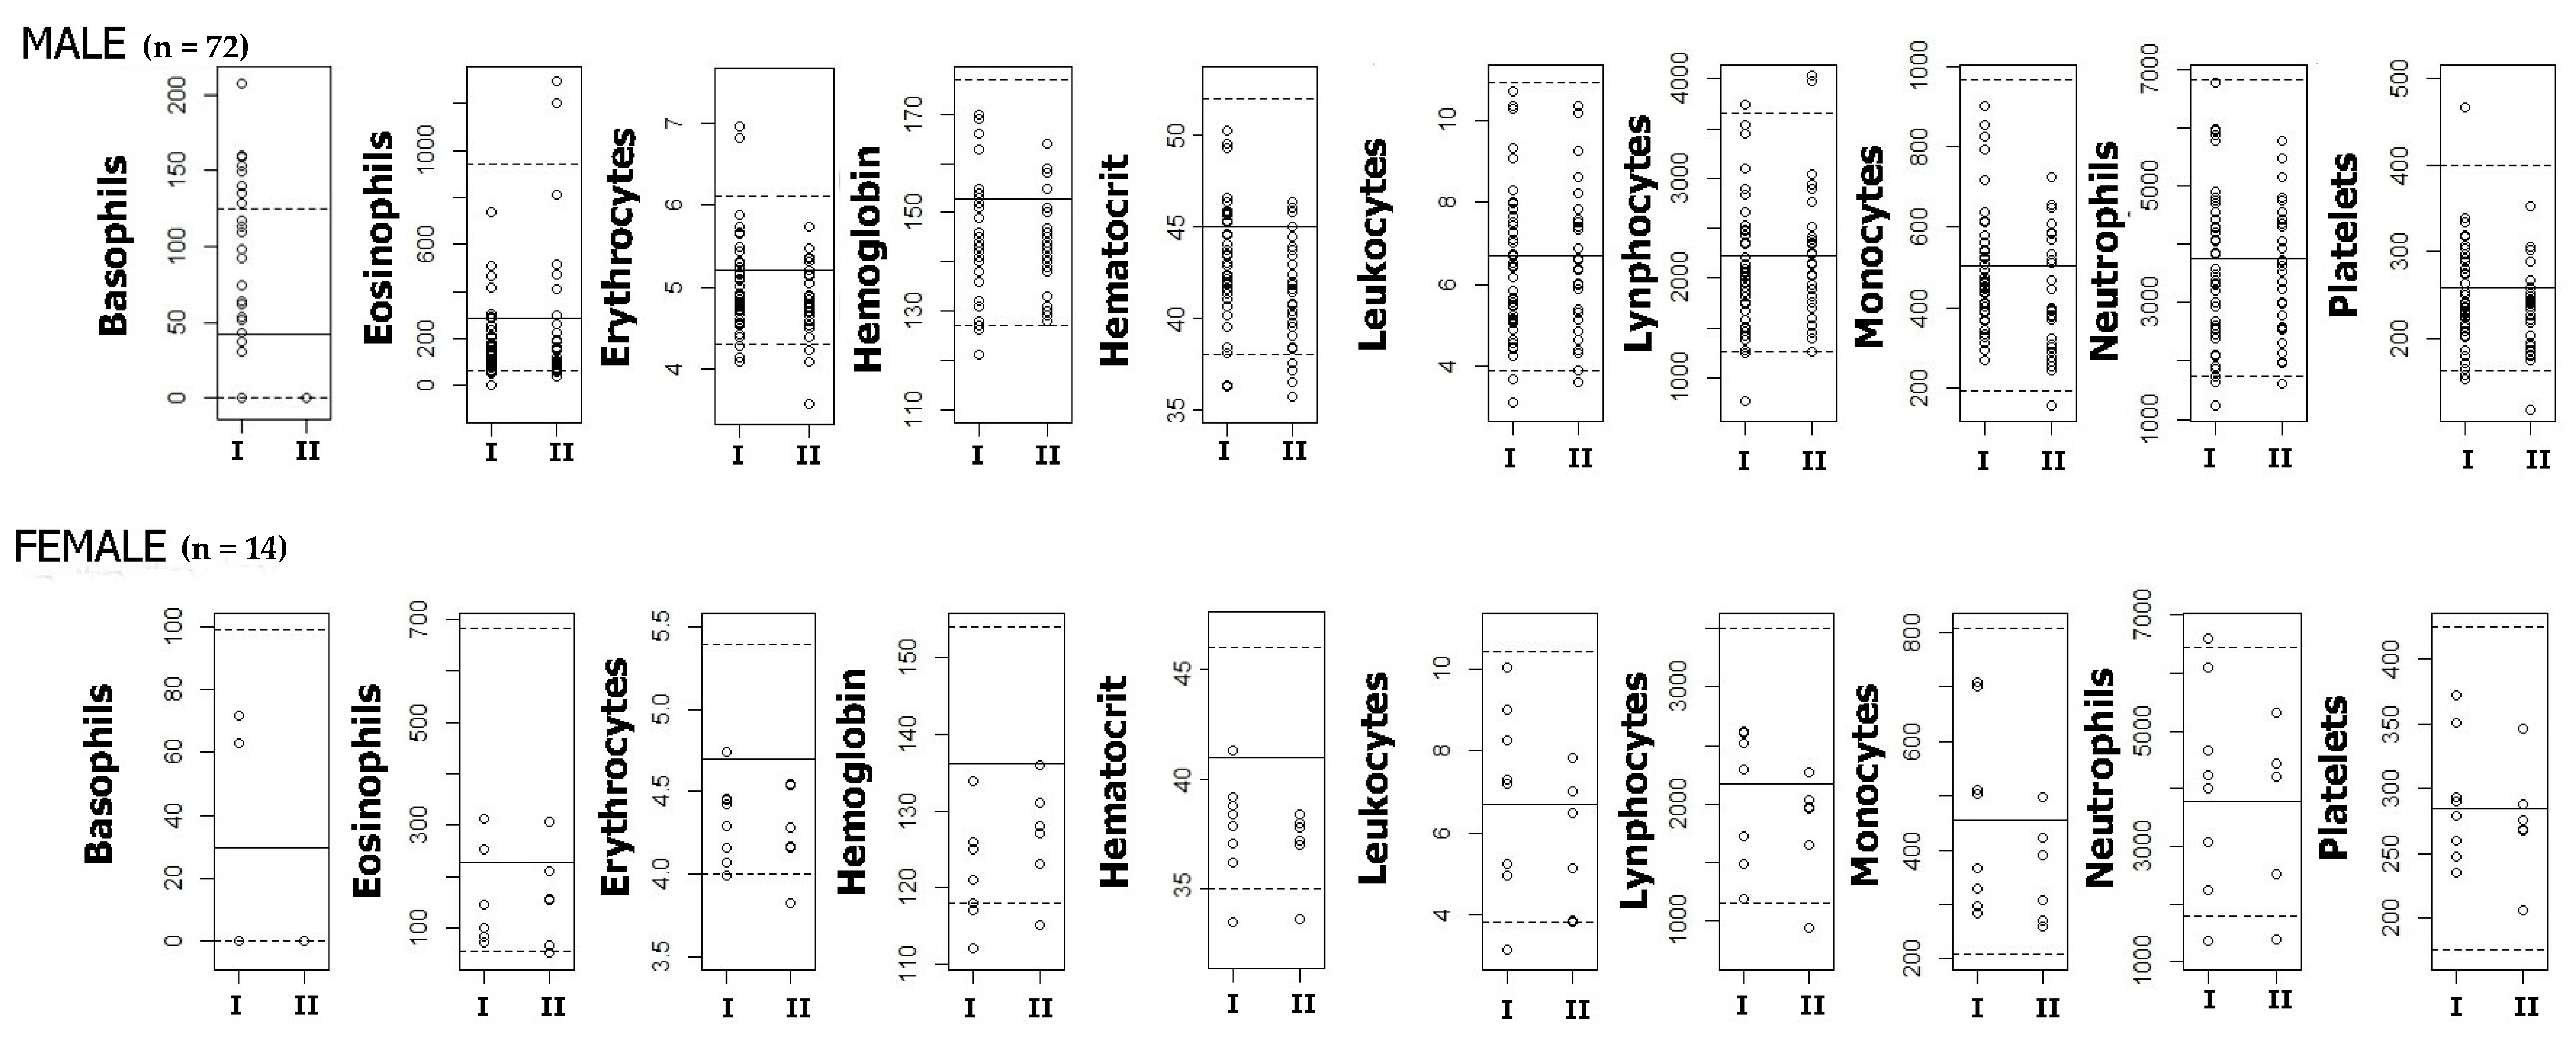
| (a) Oxidative stress biomarkers per age group, sex, length of time in current job, tobacco use, and exposure group | |||||||||||
| Oxidative Stress | |||||||||||
| n | CAT (kU/L) | GST (U/L) | SOD (U/mL) | THIOL (mM) | MDA (µM) | ||||||
| Variables | (n = 86) | Mean (SD) | CI 95% | Mean (SD) | CI 95% | Mean (SD) | CI 95% | Mean (SD) | CI 95% | Mean (SD) | CI 95% |
| Age group (years) | |||||||||||
| ≥ 18 a≤25 | 13 | 28.21 (13.12) | 19.88–36.55 | 20.20 (10.58) | 13.47–26.92 | 1.55 (0.90) | 0.98–2.13 | 0.41 (0.12) | 0.34–0.48 | 9.01 (7.77) | 3.79–14.23 |
| >25 a ≤39 | 34 | 49.68 (37.42) | 36.19–63.18 | 19.50 (20.39) | 12.15–26.85 | 2.01 (1.32) | 1.53–2.48 | 0.43 (0.14) | 0.38–0.49 | 4.77 (4.79) | 2.98–6.56 |
| ≥40 | 39 | 37.28 (16.80) | 31.83–42.72 | 14.89 (8.69) | 12.07–17.70 | 1.97 (0.92) | 1.67–2.27 | 0.41 (0.06) | 0.39–0.43 | 1.70 (1.28) | 1.27–2.13 |
| Sex | |||||||||||
| Male | 72 | 41.19 (25.09) | 35.29–47.08 | 16.82 (14.80) | 13.34–20.30 | 1.94 (1.02) | 1.70–2.18 | 0.43 (0.10) | 0.40–0.45 | 3.60 (4.70) | 2.44–4.75 |
| Female | 14 | 39.09 (35.76) | 18.44–59.73 | 19.89 (11.91) | 13.02–26.77 | 1.80 (1.35) | 0.98–2.61 | 0.39 (0.11) | 0.33–0.46 | 5.34 (5.43) | 2.06–8.62 |
| Length of time in the current job (years) | |||||||||||
| <7 | 45 | 40.33 (31.52) | 30.87–49.80 | 20.25 (18.57) | 14.58–25.73 | 1.85 (1.20) | 1.48–2.21 | 0.42 (0.13) | 0.38–0.46 | 5.77 (5.94) | 3.91–7.62 |
| 7–34 | 35 | 41.33 (22.44) | 33.62–49.04 | 13.99 (6.71) | 11.68–16.29 | 2.05 (0.95) | 1.72–2.37 | 0.42 (0.06) | 0.40–0.44 | 1.79 (1.24) | 1.33–2.23 |
| Tobacco use | |||||||||||
| Never smoked | 47 | 38.89 (26.07) | 31.24–46.55 | 15.68 (7.89) | 13.36–18.00 | 1.82 (1.06) | 1.50–2.13 | 0.41 (0.09) | 0.38–0.44 | 4.20 (5.28) | 2.60–5.81 |
| Used to smoke | 15 | 41.72 (22.44) | 29.30–54.14 | 15.01 (6.31) | 11.51–18.50 | 1.99 (1.03) | 1.42–2.56 | 0.40 (0.07) | 0.37–0.44 | 3.40 (4.44) | 0.84=5.97 |
| Smokers | 16 | 44.75 (35.31) | 25.93–63.56 | 26.44 (28.33) | 11.34–41.54 | 2.19 (1.21) | 1.55–2.83 | 0.45 (0.17) | 0.36–0.54 | 3.83 (4.16) | 1.54–6.14 |
| Groups of workers exposed to benzene | |||||||||||
| Filling Stations (I) | 51 | 42.00 (32.89) | 32.75–51.25 | 20.04 (17.84) | 15.03–25.06 | 1.90 (1.12) | 1.58–2.22 | 0.45 (0.05) | 0.43–0.47 | 5.39 (5.53) | 3.82–6.96 |
| Campus Entrances (II) | 35 | 39.16(14.46) | 34.20–44.13 | 13.35 (4.44) | 11.83–14.88 | 1.95 (0.99) | 1.60–2.29 | 0.40 (0.13) | 0.37–0.44 | 1.29 (0.73) | 1.01–1.56 |
| (b) Chromosomal aberrations per age group, sex, length of time in current job, tobacco use, and exposure group | |||||||||||
| Chromosomal Aberrations | |||||||||||
| n | MCA (%) | NCBk (%) | Frag (%) | PCS (%) | |||||||
| Variables | (n = 86) | Mean (SD) | CI 95% | Mean (SD) | CI 95% | Mean (SD) | CI 95% | Mean (SD) | CI 95% | ||
| Age group (years) | |||||||||||
| ≥ 18 a≤25 | 13 | 49.17 (51.71) | 16.31–82.02 | 3.42 (4.46) | 0.58–6.25 | 5.33 (7.24) | 0.73–9.93 | 1.92 (2.47) | 0.35–3.48 | ||
| >25 a ≤39 | 34 | 69.00 (148.82) | 15.35–122.65 | 6.59 (13.54) | 1.71–11.48 | 12.09 (26.21) | 2.65–21.54 | 2.28 (4.96) | 0.49–4.07 | ||
| ≥40 | 39 | 85.08 (111.98) | 48.78–121.38 | 3.67 (5.83) | 1.78–5.56 | 6.46 (10.42) | 3.08–9.84 | 2.46 (3.02) | 1.48–3.44 | ||
| Sex | |||||||||||
| Male | 72 | 79.68 (128.31) | 49.53–109.83 | 5.18 (10,06) | 2.82–7.54 | 9.44 (19.18) | 4.94–13.95 | 2.31 (3.90) | 1.39–3.22 | ||
| Female | 14 | 38.14 (43.08) | 13.27–63.02 | 1.64 (2,67) | 0.10–3.19 | 1.79 (2.36) | 0.42–3.14 | 2.36 (2.95) | 0.65–4.06 | ||
| Length of time in the current job (years) | |||||||||||
| <7 | 45 | 62.82 (137.69) | 21.46–104.19 | 5.56 (12.00) | 1.95–9.16 | 9.82 (22.91) | 2.94–16.70 | 2.24 (4.46) | 0.90–3.59 | ||
| 7–34 | 35 | 89.09 (102.25) | 53.96–124.21 | 3.97 (5.31) | 2.15–5.79 | 7.11 (9.94) | 3.70–10.53 | 2.23 (2.89) | 1.24–3.22 | ||
| Tobacco use | |||||||||||
| Never smoked | 47 | 81.91 (132.34) | 43.06–120.77 | 6.28 (11.73) | 2.83–9.72 | 11.47 (22.47) | 4.87–18. | 2.55 (4.39) | 1.26–3.84 | ||
| Used to smoke | 15 | 34.20 (36.31) | 14.09–54.31 | 1.67 (2.90) | 0.06–3.27 | 2.67 (4.84) | 0.01–5.34 | 0.67 (0.976) | 0.13–1.21 | ||
| Smokers | 16 | 48.13 (62.59) | 14.77–81.48 | 4.06 (6.37) | 0.67–7.46 | 6.50 (11.51) | 0.37–12.64 | 2.44 (3.22) | 0.72–4.16 | ||
| Groups of workers exposed to benzene | |||||||||||
| Filling Stations (I) | 51 | 73.25 (132.04) | 36.12–110.39 | 6.80 (11.49) | 3.57–10.04 | 11.90 (22.03) | 5.70–18.10 | 2.18 (4.37) | 0.95–3.41 | ||
| Campus Entrances (II) | 35 | 72.43 (100.21) | 38.00–106.85 | 1.4 (2.53) | 0.53–2.27 | 2.8 (5.07) | 1.06–4.54 | 2.51 (2.62) | 1.61–3.41 | ||
| (c) Nuclear abnormalities and comet assay with FPG per age group, sex, length of time in current job, tobacco use, and exposure group | |||||||||||
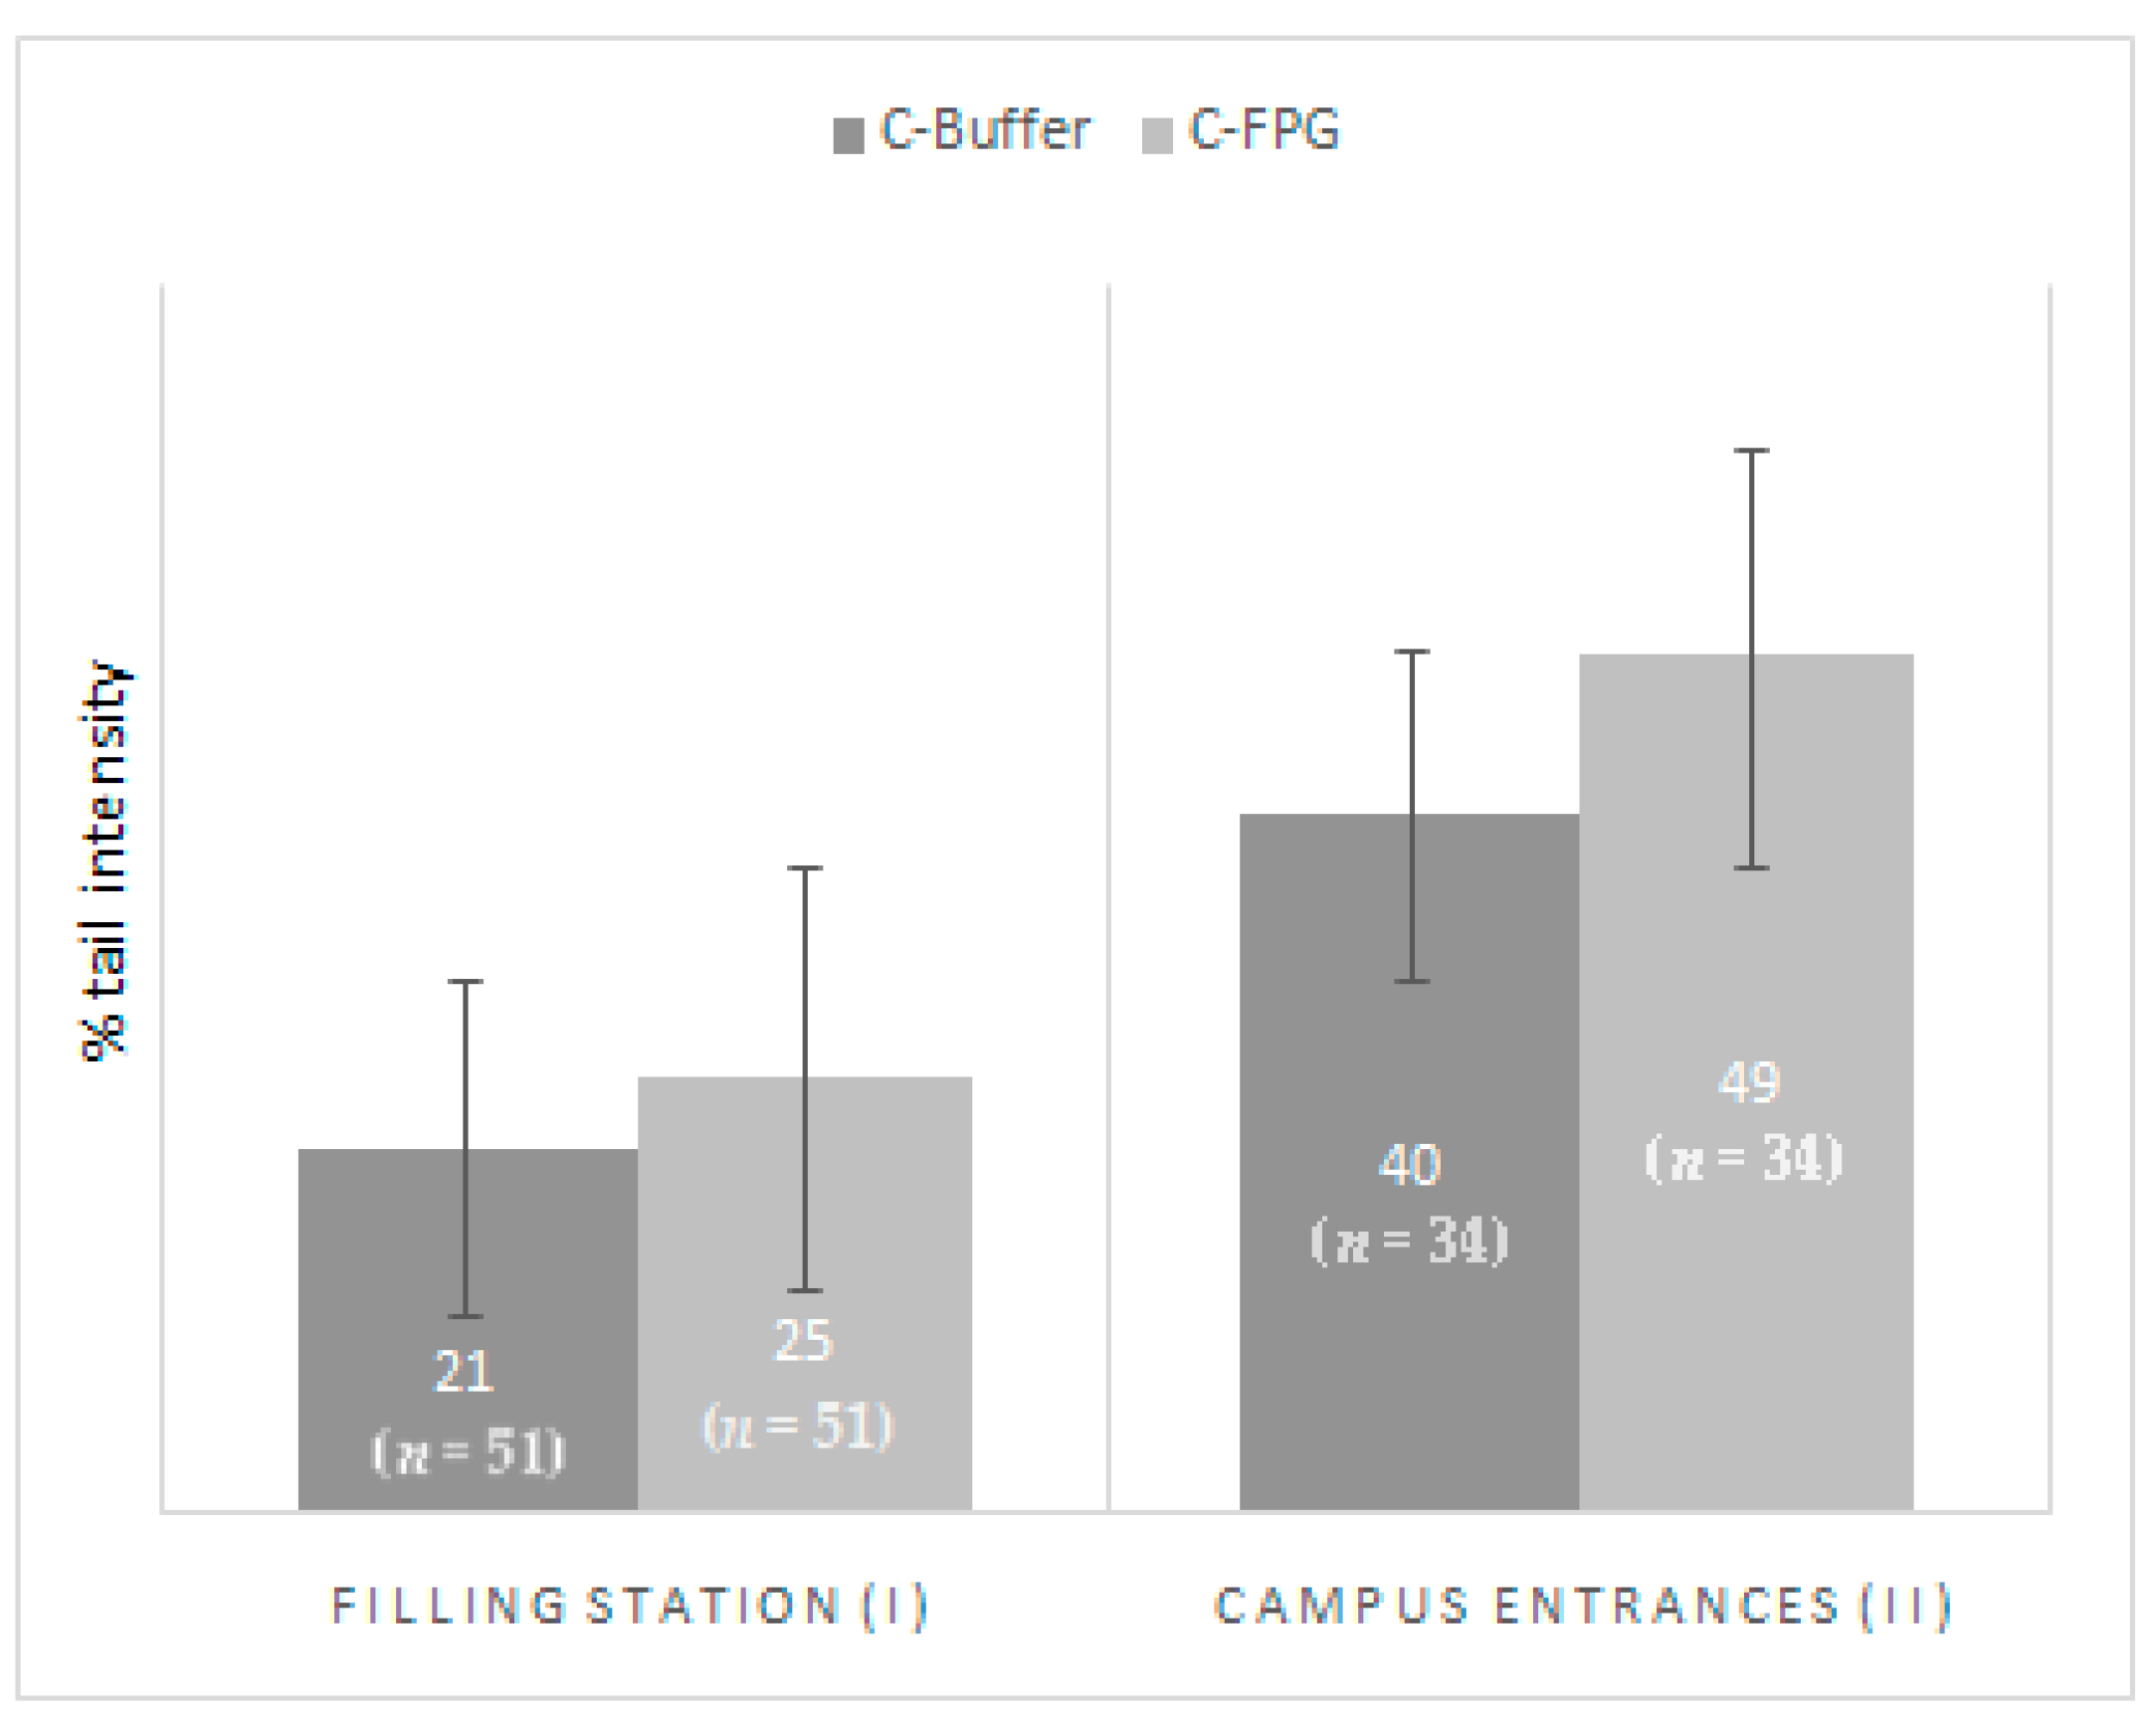
| Nuclear Abnormalities | Comet Assay | ||||||||||
| n | MN (MN/1000 cell) | BEC (BEC/1000 cell) | BNC (BNC/1000 cell) | C-Buffer (TI) | C-FPG (TI) | ||||||
| Variables | (n = 86) | Mean (SD) | CI 95% | Mean (SD) | CI 95% | Mean (SD) | CI 95% | Mean (SD) | CI 95% | Mean (SD) | CI 95% |
| Age group (years) | |||||||||||
| ≥ 18 a≤25 | 13 | 1.13 (1.46) | 0.20–2.05 | 0.96 (1.50) | 0.01–1.91 | 0.33 (0.69) | –0.10–0.77 | 20.47 (16.56) | 9.95–30.99 | 29.78 (19.94) | 17.11–42.46 |
| >25 a ≤39 | 34 | 0.97 (1.16) | 0.55–1.39 | 0.66 (1.06) | 0.27–1.04 | 0.23 (0.52) | 0.05–0.42 | 17.88 (17.42) | 11.60–24.16 | 26.22 (23.33) | 17.81–34.64 |
| ≥40 | 39 | 1.01 (0.84) | 0.74–1.28 | 1.45 (1.50) | 0.96–1.93 | 0.60 (0.81) | 0.34–0.87 | 29.46 (20.32) | 22.87–36.05 | 39.83 (27.09) | 30.93–48.73 |
| Sex | |||||||||||
| Male | 72 | 0.96 (1.00) | 0.72–1.19 | 1.06 (1.41) | 0.73–1.39 | 0.44 (0.72) | 0.28–0.61 | 24.30 (20.00) | 19.60–28.99 | 33.60 (26.40) | 27.34–39.84 |
| Female | 14 | 1.25 (1.33) | 0.48–2.02 | 1.32 (1.32) | 0.56–2.09 | 0.43 (0.76) | –0.01–0.87 | 24.62 (17.68) | 14.40–34.83 | 35.53 (22.26) | 22.67–48.38 |
| Length of time in the current job (years) | |||||||||||
| <7 | 45 | 1.18 (1.28) | 0.79–1.56 | 0.84 (1.25) | 0.50–1.22 | 0.28 (0.59) | 0.10–0.45 | 18.60 (19.10) | 12.86–24.34 | 25.42 (21.92) | 18.76–32.08 |
| 7–34 | 35 | 0.86 (0.73) | 0.61–1.12 | 1.27 (1.50) | 0.76–1.79 | 0.57 (0.76) | 0.31–0.83 | 29.03 (17.63) | 22.98–35.09 | 41.55 (26.97) | 32.29–50.82 |
| Tobacco use | |||||||||||
| Never smoked | 47 | 1.10 (1.16) | 0.75–1.44 | 1.11 (1.43) | 0.69–1.52 | 0.40 (0.64) | 0.22–0.59 | 21.75 (19.55) | 16.01–27.49 | 32.03 (26.12) | 24.36–39.70 |
| Used to smoke | 15 | 0.97 (0.90) | 0.47–1.46 | 0.90 (1.33) | 0.17–1.63 | 0.40 (0.63) | 0.05–0.75 | 35.36 (21.85) | 23.27–47.46 | 46.41 (26.33) | 31.22–61.62 |
| Smokers | 16 | 0.75 (0.86) | 0.29–1.21 | 0.81 (0.96) | 0.30–1.3 | 0.34 (0.68) | 0.02–0.70 | 24.59 (17.96) | 15.03–34.15 | 32.92 (25.97) | 19.09–46.76 |
| Groups of workers exposed to benzene | |||||||||||
| Filling Stations (I) | 51 | 1.20 (1.28) | 0.84–1.56) | 0.39 (0.74) | 0.18–0.60 | 0.12 (0.28) | 0.04–0.20 | 21.34 (20.32) | 15.63–27.06 | 29.52 (24.68) | 22.58–36.46 |
| Campus Entrances (II) | 35 | 0.73 (0.51) | 0.56–0.90 | 2.14 (1.47) | 1.64–2.65 | 0.91 (0.90) | 0.61–1.22 | 28.73 (17.72) | 22.64–34.81 | 40.49 (26.04) | 31.40–49.58 |
© 2019 by the authors. Licensee MDPI, Basel, Switzerland. This article is an open access article distributed under the terms and conditions of the Creative Commons Attribution (CC BY) license (http://creativecommons.org/licenses/by/4.0/).
Share and Cite
Costa-Amaral, I.C.; Carvalho, L.V.B.; Santos, M.V.C.; Valente, D.; Pereira, A.C.; Figueiredo, V.O.; Souza, J.M.d.; Castro, V.S.; Trancoso, M.d.F.; Fonseca, A.S.A.; et al. Environmental Assessment and Evaluation of Oxidative Stress and Genotoxicity Biomarkers Related to Chronic Occupational Exposure to Benzene. Int. J. Environ. Res. Public Health 2019, 16, 2240. https://doi.org/10.3390/ijerph16122240
Costa-Amaral IC, Carvalho LVB, Santos MVC, Valente D, Pereira AC, Figueiredo VO, Souza JMd, Castro VS, Trancoso MdF, Fonseca ASA, et al. Environmental Assessment and Evaluation of Oxidative Stress and Genotoxicity Biomarkers Related to Chronic Occupational Exposure to Benzene. International Journal of Environmental Research and Public Health. 2019; 16(12):2240. https://doi.org/10.3390/ijerph16122240
Chicago/Turabian StyleCosta-Amaral, Isabele C., Leandro V. B. Carvalho, Marcus Vinicius C. Santos, Daniel Valente, Angélica C. Pereira, Victor O. Figueiredo, Juliana Mendonça de Souza, Vinicio S. Castro, Maria de Fátima Trancoso, Antônio Sérgio A. Fonseca, and et al. 2019. "Environmental Assessment and Evaluation of Oxidative Stress and Genotoxicity Biomarkers Related to Chronic Occupational Exposure to Benzene" International Journal of Environmental Research and Public Health 16, no. 12: 2240. https://doi.org/10.3390/ijerph16122240
APA StyleCosta-Amaral, I. C., Carvalho, L. V. B., Santos, M. V. C., Valente, D., Pereira, A. C., Figueiredo, V. O., Souza, J. M. d., Castro, V. S., Trancoso, M. d. F., Fonseca, A. S. A., Milagres, V. G., Mendes, M. P. R., Paiva, M. J. N., André, L. C., Borges, R. M., Menezes, M. A. C., Alves, S. R., Gonçalves, E. S., Sisenando, H. A., ... Larentis, A. L. (2019). Environmental Assessment and Evaluation of Oxidative Stress and Genotoxicity Biomarkers Related to Chronic Occupational Exposure to Benzene. International Journal of Environmental Research and Public Health, 16(12), 2240. https://doi.org/10.3390/ijerph16122240