Longitudinal Associations between Anatomical Regions of Pain and Work Conditions: A Study from The SwePain Cohort


Abstract
1. Introduction
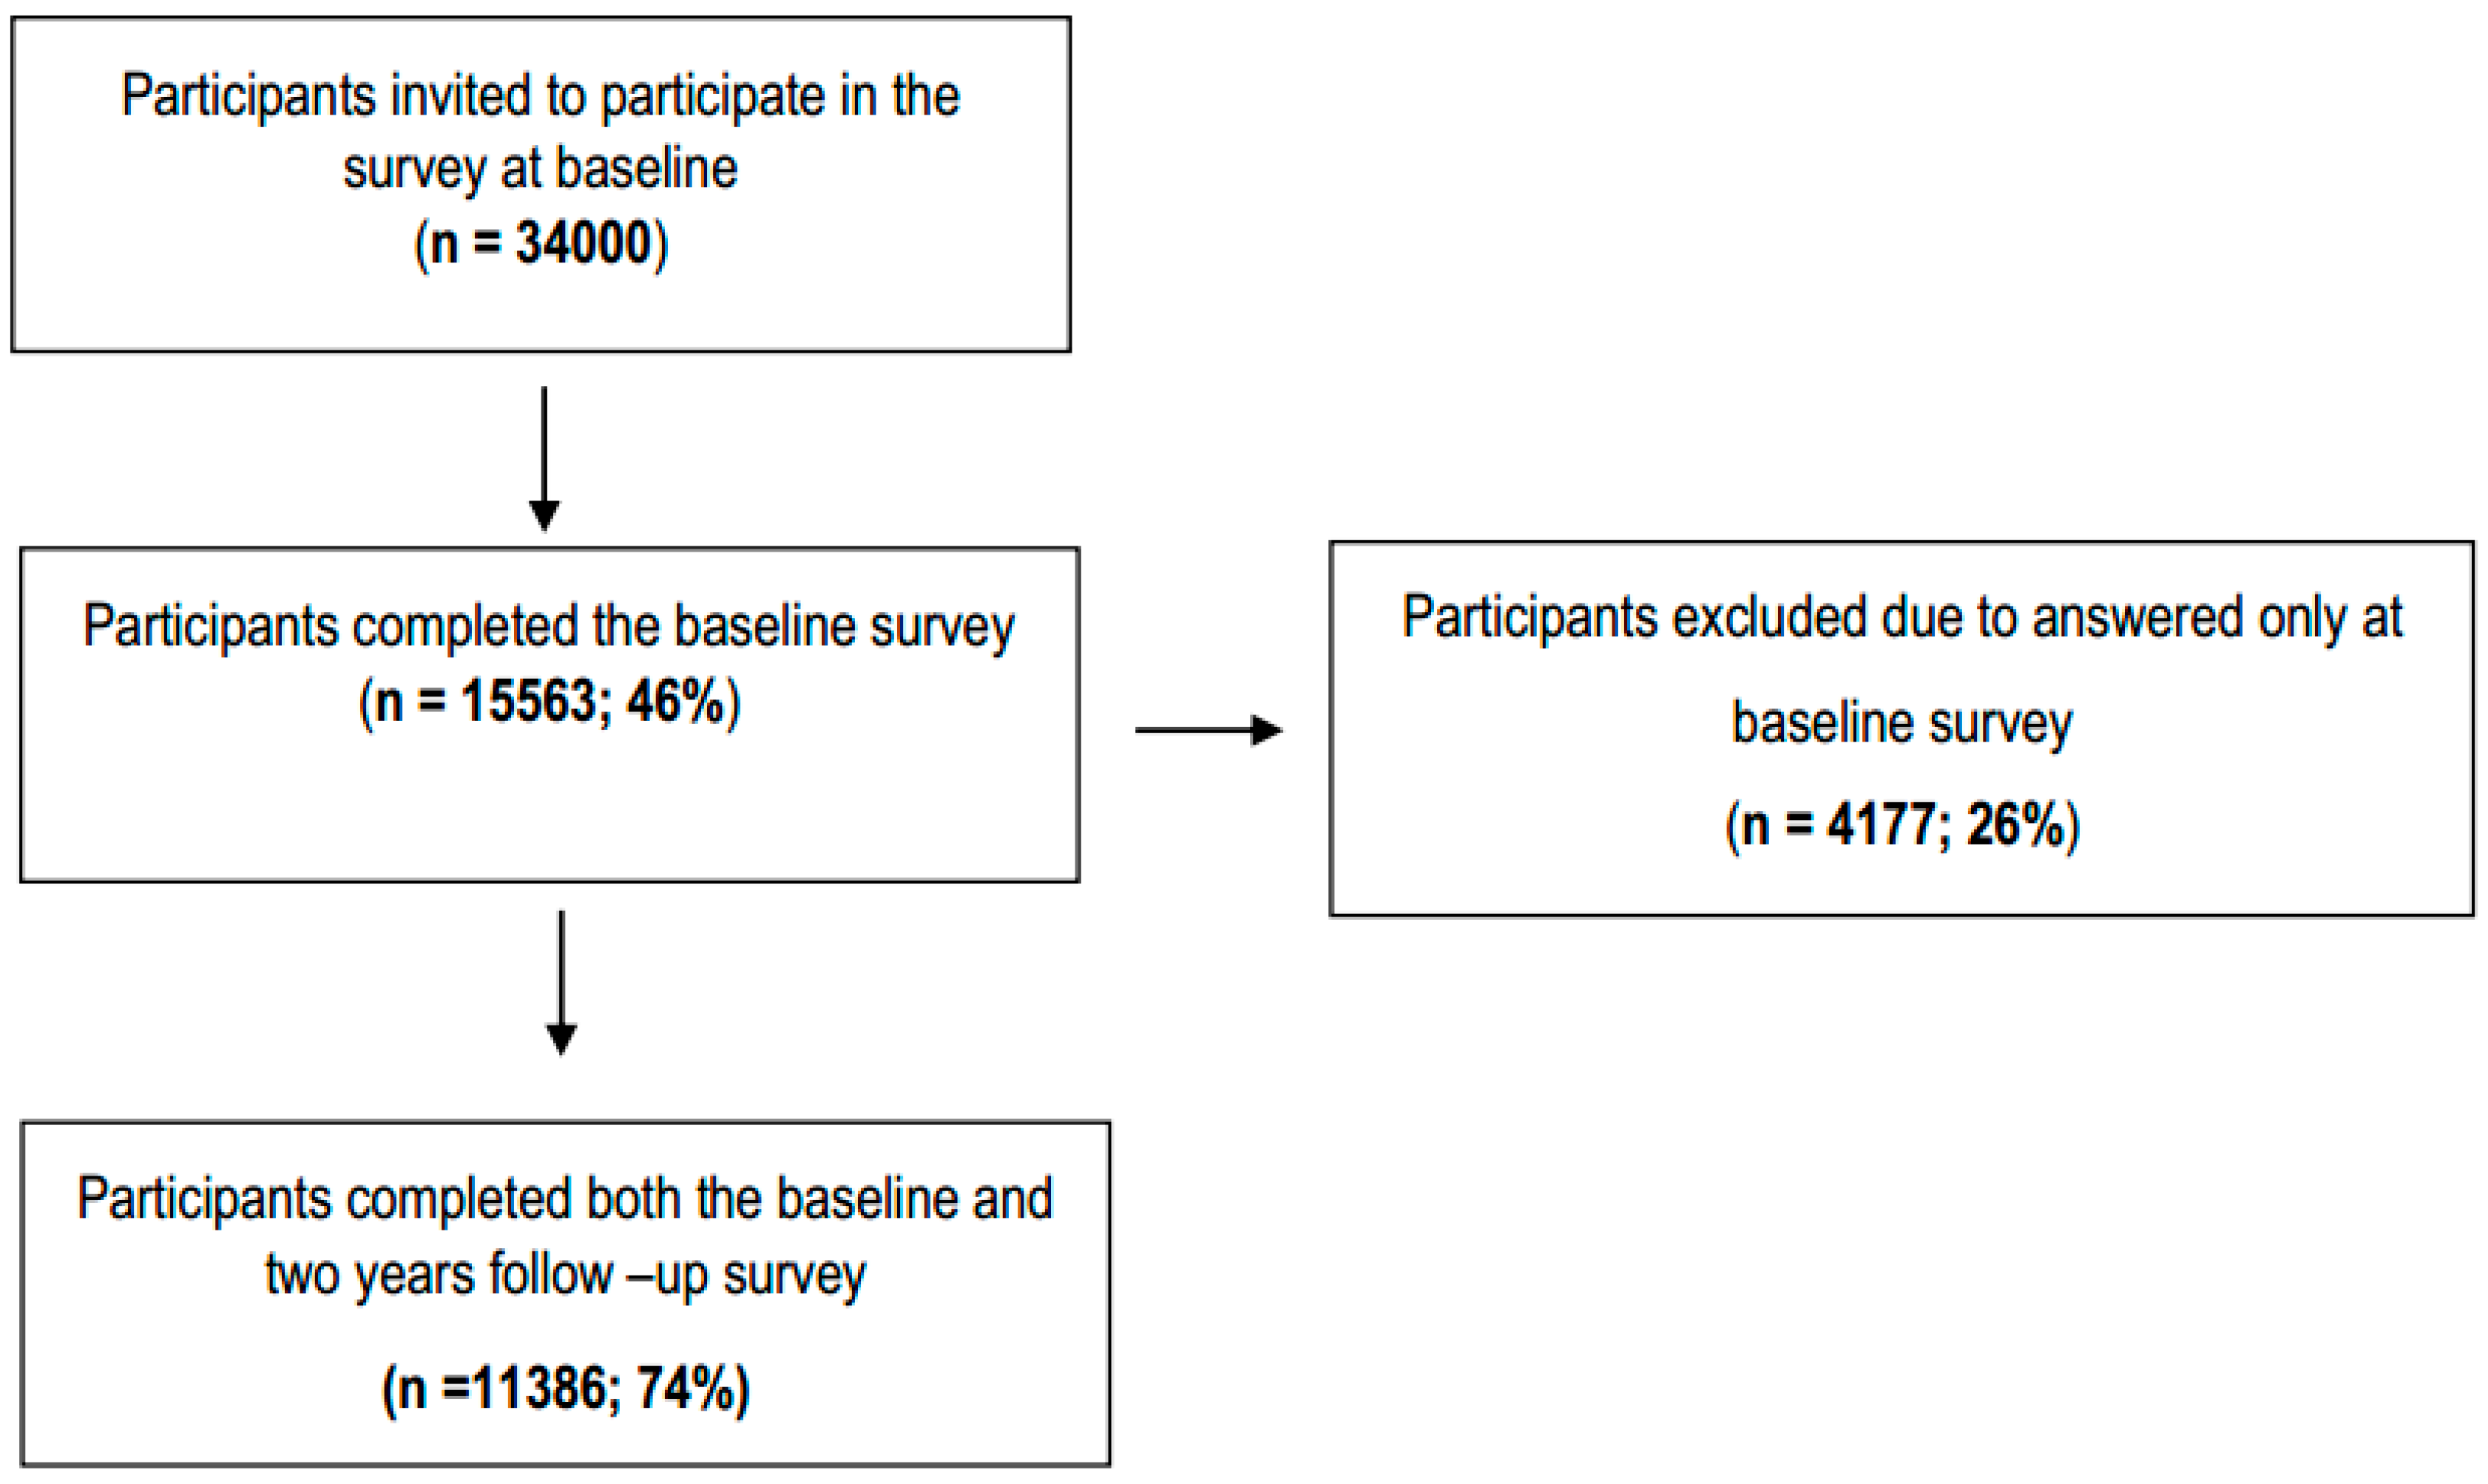
2. Methods
2.1. Outcomes
2.1.1. The Number of Anatomical Regions with Pain (ARP)
2.1.2. Workload
2.1.3. Psychosocial Work Stressors
2.2. Exposure Variables
2.3. Potential Confounders
2.4. Statistical Analysis
3. Results
3.1. Population Characteristics
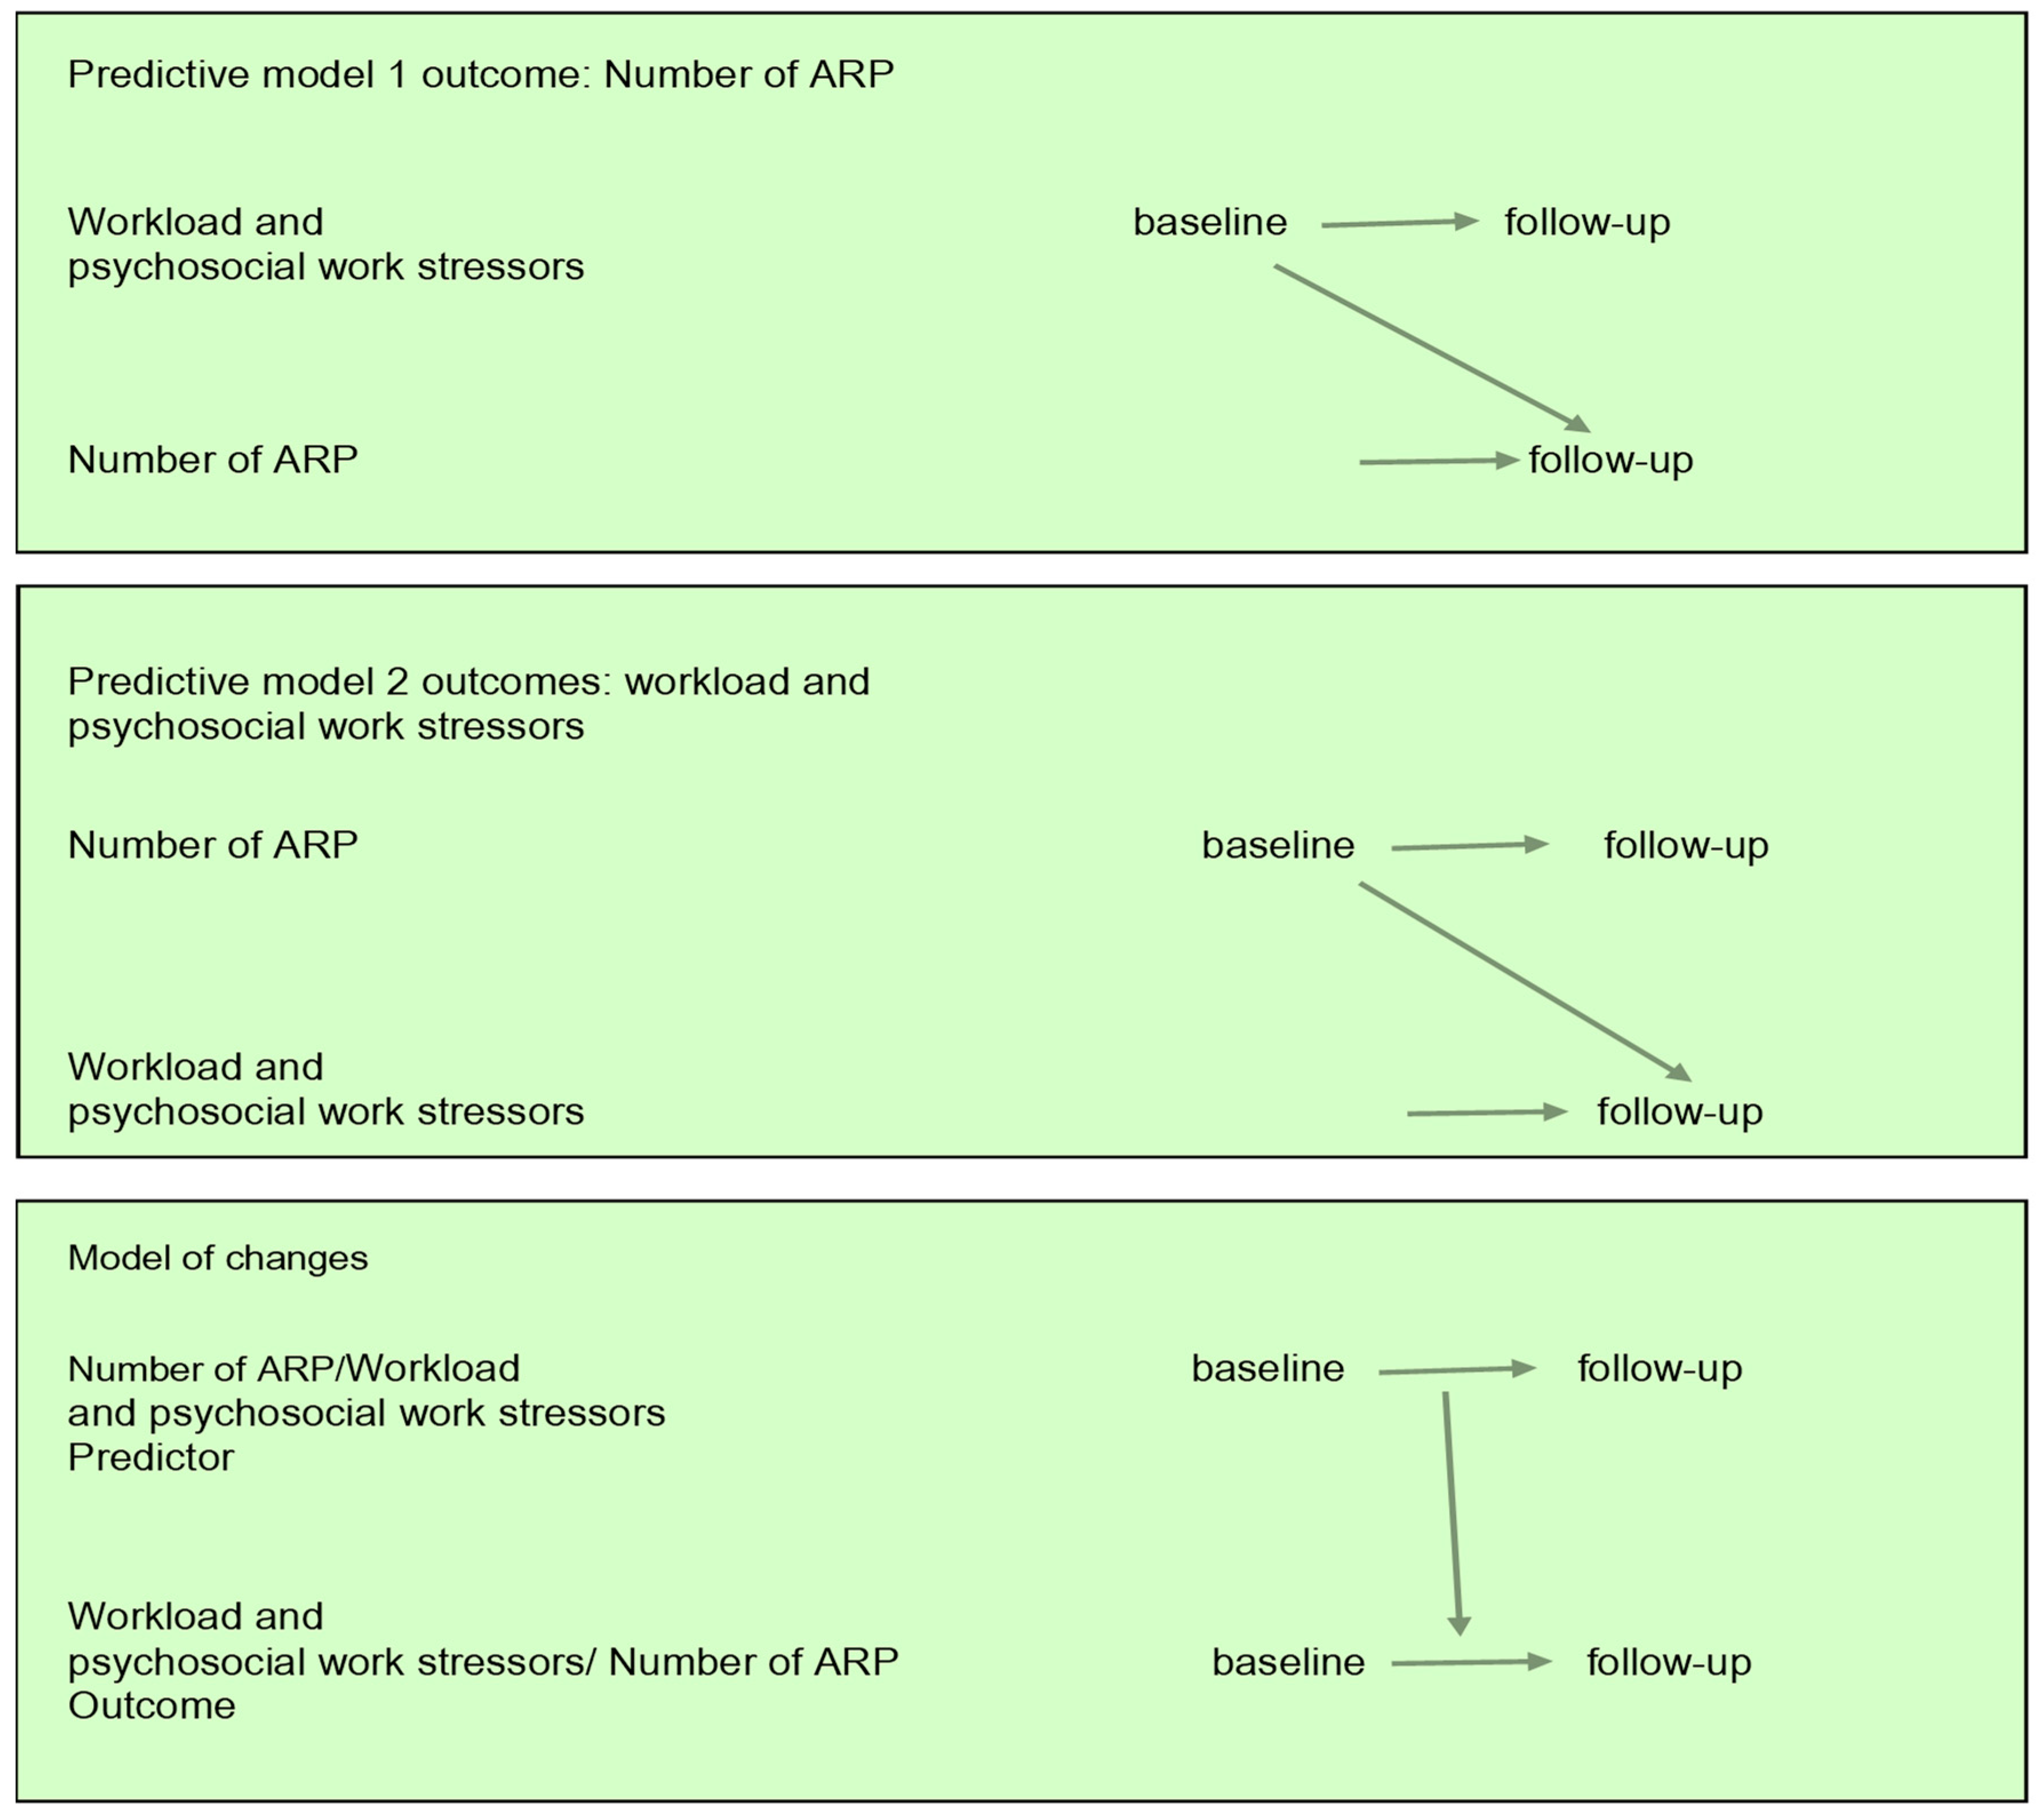
3.2. Prediction Models
3.3. Models of Changes
4. Discussion
5. Conclusions
Supplementary Materials
Author Contributions
Funding
Conflicts of Interest
References
- Parot-Schinkel, E.; Descatha, A.; Ha, C.; Petit, A.; Leclerc, A.; Roquelaure, Y. Prevalence of multisite musculoskeletal symptoms: A French cross-sectional working population-based study. BMC Musculoskelet. Disord. 2012, 13, 122. [Google Scholar] [CrossRef] [PubMed]
- Tsang, A.; Von Korff, M.; Lee, S.; Alonso, J.; Karam, E.; Angermeyer, M.C.; Borges, G.L.; Bromet, E.J.; Demytteneare, K.; de Girolamo, G.; et al. Common chronic pain conditions in developed and developing countries: Gender and age differences and comorbidity with depression-anxiety disorders. J. Pain 2008, 9, 883–891. [Google Scholar] [CrossRef] [PubMed]
- Vos, T.; Flaxman, A.D.; Naghavi, M.; Lozano, R.; Michaud, C.; Ezzati, M.; Shibuya, K.; Salomon, J.A.; Abdalla, S.; Aboyans, V.; et al. Years lived with disability (YLDs) for 1160 sequelae of 289 diseases and injuries 1990–2010: A systematic analysis for the Global Burden of Disease Study 2010. Lancet 2012, 380, 2163–2196. [Google Scholar] [CrossRef]
- Herin, F.; Vezina, M.; Thaon, I.; Soulat, J.M.; Paris, C.; ESTEV Group. Predictive risk factors for chronic regional and multisite musculoskeletal pain: A 5-year prospective study in a working population. Pain 2014, 155, 937–943. [Google Scholar] [CrossRef] [PubMed]
- Carnes, D.; Parsons, S.; Ashby, D.; Breen, A.; Foster, N.E.; Pincus, T.; Vogel, S.; Underwood, M. Chronic musculoskeletal pain rarely presents in a single body site: Results from a UK population study. Rheumatology (Oxf. Engl.) 2007, 46, 1168–1170. [Google Scholar] [CrossRef]
- Dragioti, E.; Larsson, B.; Bernfort, L.; Levin, L.A.; Gerdle, B. A cross-sectional study of factors associated with the number of anatomical pain sites in an actual elderly general population: Results from the PainS65+ cohort. J. Pain Res. 2017, 10, 2009–2019. [Google Scholar] [CrossRef] [PubMed]
- Kamaleri, Y.; Natvig, B.; Ihlebaek, C.M.; Benth, J.S.; Bruusgaard, D. Number of pain sites is associated with demographic, lifestyle, and health-related factors in the general population. Eur. J. Pain (Lond. Engl.) 2008, 12, 742–748. [Google Scholar] [CrossRef]
- Neupane, S.; Nygard, C.H.; Oakman, J. Work-related determinants of multi-site musculoskeletal pain among employees in the health care sector. Work (Read. Mass.) 2016, 54, 689–697. [Google Scholar] [CrossRef]
- de Fernandes, R.C.; Burdorf, A. Associations of multisite pain with healthcare utilization, sickness absence and restrictions at work. Int. Arch. Occup. Environ. Health 2016, 89, 1039–1046. [Google Scholar] [CrossRef]
- Haukka, E.; Kaila-Kangas, L.; Ojajarvi, A.; Saastamoinen, P.; Holtermann, A.; Jorgensen, M.B.; Karppinen, J.; Heliovaara, M.; Leino-Arjas, P. Multisite musculoskeletal pain predicts medically certified disability retirement among Finns. Eur. J. Pain (Lond. Engl.) 2015, 19, 1119–1128. [Google Scholar] [CrossRef]
- Lacey, R.J.; Belcher, J.; Rathod, T.; Wilkie, R.; Thomas, E.; McBeth, J. Pain at multiple body sites and health-related quality of life in older adults: Results from the North Staffordshire Osteoarthritis Project. Rheumatology (Oxf. Engl.) 2014, 53, 2071–2079. [Google Scholar] [CrossRef] [PubMed]
- Kamaleri, Y.; Natvig, B.; Ihlebaek, C.M.; Bruusgaard, D. Does the number of musculoskeletal pain sites predict work disability? A 14-year prospective study. Eur. J. Pain (Lond. Engl.) 2009, 13, 426–430. [Google Scholar] [CrossRef] [PubMed]
- Phongamwong, C.; Deema, H. The impact of multi-site musculoskeletal pain on work ability among health care providers. J. Occup. Med. Toxicol. (Lond. Engl.) 2015, 10, 21. [Google Scholar] [CrossRef] [PubMed][Green Version]
- Natvig, B.; Eriksen, W.; Bruusgaard, D. Low back pain as a predictor of long-term work disability. Scand. J. Public Health 2002, 30, 288–292. [Google Scholar] [CrossRef] [PubMed]
- Bernal, D.; Campos-Serna, J.; Tobias, A.; Vargas-Prada, S.; Benavides, F.G.; Serra, C. Work-related psychosocial risk factors and musculoskeletal disorders in hospital nurses and nursing aides: A systematic review and meta-analysis. Int. J. Nurs. Stud. 2015, 52, 635–648. [Google Scholar] [CrossRef] [PubMed]
- Sembajwe, G.; Tveito, T.H.; Hopcia, K.; Kenwood, C.; O’Day, E.T.; Stoddard, A.M.; Dennerlein, J.T.; Hashimoto, D.; Sorensen, G. Psychosocial stress and multi-site musculoskeletal pain: A cross-sectional survey of patient care workers. Workplace Health Saf. 2013, 61, 117–125. [Google Scholar] [CrossRef]
- Larsen, L.B.; Ramstrand, N.; Fransson, E.I. Psychosocial job demand and control: Multi-site musculoskeletal pain in Swedish police. Scand. J. Public Health 2018. [Google Scholar] [CrossRef] [PubMed]
- Sommer, T.G.; Frost, P.; Svendsen, S.W. Combined musculoskeletal pain in the upper and lower body: Associations with occupational mechanical and psychosocial exposures. Int. Arch. Occup. Environ. Health 2015, 88, 1099–1110. [Google Scholar] [CrossRef] [PubMed]
- Solidaki, E.; Chatzi, L.; Bitsios, P.; Coggon, D.; Palmer, K.T.; Kogevinas, M. Risk factors for new onset and persistence of multi-site musculoskeletal pain in a longitudinal study of workers in Crete. Occup. Environ. Med. 2013, 70, 29–34. [Google Scholar] [CrossRef] [PubMed]
- Oakman, J.; de Wind, A.; van den Heuvel, S.G.; van der Beek, A.J. Work characteristics predict the development of multi-site musculoskeletal pain. Int. Arch. Occup. Environ. Health 2017, 90, 653–661. [Google Scholar] [CrossRef] [PubMed]
- Christensen, J.O.; Knardahl, S. Work and back pain: A prospective study of psychological, social and mechanical predictors of back pain severity. Eur. J. Pain (Lond. Engl.) 2012, 16, 921–933. [Google Scholar] [CrossRef] [PubMed]
- Solidaki, E.; Chatzi, L.; Bitsios, P.; Markatzi, I.; Plana, E.; Castro, F.; Palmer, K.; Coggon, D.; Kogevinas, M. Work-related and psychological determinants of multisite musculoskeletal pain. Scand. J. Work Environ. Health 2010, 36, 54–61. [Google Scholar] [CrossRef] [PubMed]
- Larsson, B.; Balogh, I. Is There a Relationship Between Fibromyalgia Syndrome and Work Conditions? J. Musculoskelet. Pain 2010, 13, 5–14. [Google Scholar] [CrossRef]
- Arvidsson, I.; Gremark Simonsen, J.; Dahlqvist, C.; Axmon, A.; Karlson, B.; Bjork, J.; Nordander, C. Cross-sectional associations between occupational factors and musculoskeletal pain in women teachers, nurses and sonographers. BMC Musculoskelet. Disord. 2016, 17, 35. [Google Scholar] [CrossRef] [PubMed]
- De Cassia Pereira Fernandes, R.; Pataro, S.M.S.; de Carvalho, R.B.; Burdorf, A. The concurrence of musculoskeletal pain and associated work-related factors: A cross sectional study. BMC Public Health 2016, 16, 628. [Google Scholar] [CrossRef] [PubMed]
- Larsson, B.; Gerdle, B.; Bjork, J.; Grimby-Ekman, A. Pain Sensitivity and its Relation to Spreading on the Body, Intensity, Frequency, and Duration of Pain: A Cross-Sectional Population-based Study (SwePain). Clin. J. Pain 2017, 33, 579–587. [Google Scholar] [CrossRef]
- Larsson, B.; Dragioti, E.; Grimby-Ekman, A.; Gerdle, B.; Bjork, J. Predictors of chronic pain intensity, spread, and sensitivity in the general population: A two-year follow-up study from the SWEPAIN cohort. J. Rehabilit. Med. 2019, 51, 183–192. [Google Scholar] [CrossRef]
- Dragioti, E.; Larsson, B.; Bernfort, L.; Levin, L.A.; Gerdle, B. Prevalence of different pain categories based on pain spreading on the bodies of older adults in Sweden: A descriptive-level and multilevel association with demographics, comorbidities, medications, and certain lifestyle factors (PainS65+). J. Pain Res. 2016, 9, 1131–1141. [Google Scholar] [CrossRef]
- Grimby-Ekman, A.; Gerdle, B.; Bjork, J.; Larsson, B. Comorbidities, intensity, frequency and duration of pain, daily functioning and health care seeking in local, regional, and widespread pain—A descriptive population-based survey (SwePain). BMC Musculoskelet. Disord. 2015, 16, 165. [Google Scholar] [CrossRef]
- Schmidt, C.O.; Baumeister, S.E. Simple patterns behind complex spatial pain reporting? Assessing a classification of multisite pain reporting in the general population. Pain 2007, 133, 174–182. [Google Scholar] [CrossRef]
- Balogh, I.; Orbaek, P.; Winkel, J.; Nordander, C.; Ohlsson, K.; Ektor-Andersen, J.; Malmo Shoulder-Neck Study, G. Questionnaire-based mechanical exposure indices for large population studies—Reliability, internal consistency and predictive validity. Scand. J. Work Environ. Health 2001, 27, 41–48. [Google Scholar] [CrossRef] [PubMed]
- Karasek, R.; Brisson, C.; Kawakami, N.; Houtman, I.; Bongers, P.; Amick, B. The Job Content Questionnaire (JCQ): An instrument for internationally comparative assessments of psychosocial job characteristics. J. Occup. Health Psychol. 1998, 3, 322–355. [Google Scholar] [CrossRef]
- Fanavoll, R.; Nilsen, T.I.; Holtermann, A.; Mork, P.J. Psychosocial work stress, leisure time physical exercise and the risk of chronic pain in the neck/shoulders: Longitudinal data from the Norwegian HUNT Study. Int. J. Occup. Med. Environ. Health 2016, 29, 585–595. [Google Scholar] [CrossRef] [PubMed]
- Vleeshouwers, J.; Knardahl, S.; Christensen, J.O. A prospective study of work-private life conflict and number of pain sites: Moderated mediation by sleep problems and support. J. Behav. Med. 2018. [Google Scholar] [CrossRef] [PubMed]
- Godin, G.; Shephard, R.J. Godin Leisure-Time Exercise Questionnaire. Med. Sci. Sports Exerc. 1997, 26 (Suppl. 6), 36–38. [Google Scholar]
- Godin, G.; Shephard, R.J. A simple method to assess exercise behavior in the community. Can J. Appl. Sport Sci. 1985, 10, 141–146. [Google Scholar] [PubMed]
- Fazio, A.F. A concurrent validational study of the NCHS General Well-Being Schedule. Vital Health Stat. 2 1977, 73, 1–53. [Google Scholar]
- Nelder, J.A.; Wedderburn, R.W.M. Generalized Linear Models. J. Royal Stat. Soc. Ser. A (Gen.) 1972, 19, 92–100. [Google Scholar] [CrossRef]
- Zeger, S.L.; Liang, K.Y. Longitudinal data analysis for discrete and continuous outcomes. Biometrics 1986, 42, 121–130. [Google Scholar] [CrossRef] [PubMed]
- O’brien, R.M. A Caution Regarding Rules of Thumb for Variance Inflation Factors. Qual. Quant. 2007, 41, 673–690. [Google Scholar] [CrossRef]
- Sundermann, O.; Rydberg, K.; Linder, L.; Linton, S.J. When I feel the worst pain, I look like shit—Body image concerns in persistent pain. Scand. J. Pain 2018, 18, 379–388. [Google Scholar] [CrossRef] [PubMed]
- Karayannis, N.V.; Baumann, I.; Sturgeon, J.A.; Melloh, M.; Mackey, S.C. The Impact of Social Isolation on Pain Interference: A Longitudinal Study. Ann. Behav. Med. 2019, 53, 65–74. [Google Scholar] [CrossRef] [PubMed]
- Elfering, A.; Kaser, A.; Melloh, M. Relationship between depressive symptoms and acute low back pain at first medical consultation, three and six weeks of primary care. Psychol. Health Med. 2014, 19, 235–246. [Google Scholar] [CrossRef] [PubMed]
- Mallen, C.D.; Peat, G.; Thomas, E.; Dunn, K.M.; Croft, P.R. Prognostic factors for musculoskeletal pain in primary care: A systematic review. Br. J. Gen. Pract. 2007, 57, 655–661. [Google Scholar] [PubMed]
- Watanabe, S.; Takahashi, T.; Takeba, J.; Miura, H. Factors associated with the prevalence of back pain and work absence in shipyard workers. BMC Musculoskelet. Disord. 2018, 19, 12. [Google Scholar] [CrossRef]
- Coggon, D.; Ntani, G.; Walker-Bone, K.; Palmer, K.T.; Felli, V.E.; Harari, R.; Barrero, L.H.; Felknor, S.A.; Gimeno, D.; Cattrell, A.; et al. Epidemiological Differences Between Localized and Nonlocalized Low Back Pain. Spine 2017, 42, 740–747. [Google Scholar] [CrossRef]
- Böckermana, P.; Brysonb, A.; Ilmakunnas, P. Does high involvement management improve worker wellbeing? J. Econ. Behav. Organ. 2012, 84, 660–680. [Google Scholar] [CrossRef]
- Robertson, M.; Amick, B.C.; DeRango, K.; Rooneyd, T.; Bazzanid, L.; Harriste, R.; Moore, A. The effects of an office ergonomics training and chair intervention on worker knowledge, behavior and musculoskeletal risk. Appl. Ergon. 2009, 40, 124–135. [Google Scholar] [CrossRef]
- Pillastrini, P.; Mugnai, R.; Bertozzi, L.; Costi, S.; Curti, S.; Guccione, A.; Mattioli, S.; Violante, F.S. Effectiveness of an ergonomic intervention on work-related posture and low back pain in video display terminal operators: A 3 year cross-over trial. Appl. Ergon. 2010, 41, 436–443. [Google Scholar] [CrossRef]
- Kennedy, C.A.; Amick, B.C., 3rd; Dennerlein, J.T.; Brewer, S.; Catli, S.; Williams, R.; Serra, C.; Gerr, F.; Irvin, E.; Mahood, Q.; et al. Systematic Review of the Role of Occupational Health and Safety Interventions in the Prevention of Upper Extremity Musculoskeletal Symptoms, Signs, Disorders, Injuries, Claims and Lost Time. J. Occup. Rehabilit. 2010, 20, 127–162. [Google Scholar] [CrossRef]


| Characteristic; Mean (SD), Unless Otherwise Stated | Baseline | Follow-Up |
|---|---|---|
| Age | 48.8 (18.5) | 50.8 (18.5) |
| Women; n (%) | 6261 (55.0%) | 6261 (55.0%) |
| University; n (%) | 4307 (38.4%) | 4414 (39.5%) |
| Smokers; n (%) | 1315 (11.8%) | 1127 (10.2%) |
| Alcohol intake; n (%) | 9021 (80.1%) | 7355 (82.3%) |
| Psychical activity (GLTEQ index; range 0–194) | 33.6 (25.6) | 34.3 (26.0) |
| Distress (GWBS; range; 0–110) | 76.2 (18.1) | 75.9 (18.3) |
| Variables | Baseline | Follow-Up | ||
|---|---|---|---|---|
| n | Mean (SD) | n | Mean (SD) | |
| Number of anatomical regions with pain (ARP; range 0–23) | 11,386 | 1.7 (2.8) | 11,386 | 1.8 (2.8) |
| Workload | ||||
| Mechanical exposure index (MEI; range 10–30) | 9140 | 15.1 (4.0) | 9121 | 14.9 (4.1) |
| Physical exposure index (PHYI; range 6–18) | 9544 | 9.8 (3.0) | 9486 | 9.7 (3.1) |
| Psychosocial work stressors | ||||
| Job demands (mean JCQ; range 1–4) | 10,376 | 2.5 (0.6) | 10,294 | 2.5 (0.6) |
| Job control (mean JCQ; range 1–4) | 10,388 | 3.0 (0.5) | 10,299 | 3.0 (0.5) |
| Job support (mean JCQ; range 1–4) | 10,281 | 3.2 (0.5) | 10,237 | 3.2 (0.5) |
| Outcome and Exposure Variables | Crude Models | Baseline Adjusted Models * | Fully Adjusted Models ** | |||
|---|---|---|---|---|---|---|
| B (95% CI) | p-Value | B (95% CI) | p-Value | B (95% CI) | p-Value | |
| Prediction model 1, outcome: number of ARP at follow-up | ||||||
| Predictor: baseline mechanical exposure index | 0.14 (0.13 to 0.14) | <0.001 | 0.03 (0.02 to 0.03) | <0.001 | 0.03 (0.02 to 0.03) | <0.001 |
| Predictor: baseline physical exposure index | 0.11 (0.10 to 0.12) | <0.001 | 0.01 (−0.02 to 0.03) | 0.618 | 0.00 (−0.01 to 0.01) | 0.826 |
| Predictor: baseline job demands | 0.64 (0.62 to 0.66) | <0.001 | 0.17 (0.15 to 0.19) | <0.001 | 0.13 (0.10 to 0.15) | <0.001 |
| Predictor: baseline job control | −0.50 (−0.52 to −0.48) | <0.001 | −0.14 (−0.16 to −0.12) | <0.001 | −0.05 (−0.16 to 0.08) | 0.502 |
| Predictor: baseline job support | −0.63 (−0.65 to −0.60) | <0.001 | −0.07 (−0.08 to −0.05) | <0.001 | −0.04 (−0.15 to 0.07) | 0.520 |
| Prediction model 2, outcomes: workload and psychosocial work stressors at follow-up | ||||||
| Prediction model 2, outcome: mechanical exposure index at follow-up | ||||||
| Predictor: baseline number of ARP | 0.28 (0.27 to 0.29) | <0.001 | 0.04 (0.04 to 0.05) | <0.001 | 0.03 (0.02 to 0.04) | <0.001 |
| Prediction model 2, outcome: physical exposure index at follow-up | ||||||
| Predictor: baseline number of ARP | 0.11 (0.11 to 0.12) | <0.001 | 0.01 (0.00 to 0.01) | <0.001 | 0.02 (0.00 to 0.01) | 0.018 |
| Prediction model 2, outcome: job demands at follow-up | ||||||
| Predictor: baseline number of ARP | 0.03 (0.02 to 0.03) | <0.001 | 0.01 (0.00 to 0.01) | <0.001 | 0.00 (−0.00 to 0.00) | 0.829 |
| Prediction model 2, outcome: job control at follow-up | ||||||
| Predictor: baseline number of ARP | −0.01 (−0.01 to −0.01) | <0.001 | −0.01 (−0.01 to −0.01) | <0.001 | −0.01 (−0.01 to −0.00) | <0.001 |
| Prediction model 2, outcome: job support at follow-up | ||||||
| Predictor: baseline number of ARP | −0.03 (−0.03 to −0.03) | <0.001 | −0.01 (−0.01 to −0.01) | <0.001 | −0.01 (−0.01 to −0.01) | <0.001 |
| Outcome and Exposure Variables | Crude Models | Baseline Adjusted Models * | Fully Adjusted Models ** | |||
|---|---|---|---|---|---|---|
| B (95% CI) | p-Value | B (95% CI) | p-Value | B (95% CI) | p-Value | |
| Age < 50 Years | ||||||
| Prediction model 1, outcome: number of ARP at follow-up | ||||||
| Predictor: baseline mechanical exposure index | 0.12 (0.12 to 0.13) | <0.001 | 0.03 (0.02 to 0.04) | <0.001 | 0.03 (0.03 to 0.04) | <0.001 |
| Predictor: baseline physical exposure index | 0.10 (0.10 to 0.11) | <0.001 | −0.01 (−0.01 to 0.01) | 0.096 | 0.00 (−0.01 to 0.01) | 0.627 |
| Predictor: baseline job demands | 0.61 (0.58 to 0.64) | <0.001 | 0.23 (0.21 to 0.25) | <0.001 | 0.18 (0.16 to 0.20) | <0.001 |
| Predictor: baseline job control | −0.35 (−0.38 to −0.32) | <0.001 | −0.13 (−0.15 to −0.10) | <0.001 | −0.05 (−0.16 to 0.08) | 0.502 |
| Predictor: baseline job support | −0.45 (−0.48 to −0.43) | <0.001 | 0.03 (0.01 to 0.05) | 0.041 | −0.04 (−0.15 to 0.07) | 0.520 |
| Age ≥ 50 years | ||||||
| Prediction model 1, outcome: number of ARP at follow-up | ||||||
| Predictor: baseline mechanical exposure index | 0.15 (0.14 to 0.15) | <0.001 | 0.02 (0.02 to 0.03) | <0.001 | 0.01 (0.02 to 0.03) | 0.008 |
| Predictor: baseline physical exposure index | 0.13 (0.12 to 0.13) | <0.001 | 0.01 (0.00 to 0.02) | 0.009 | 0.03 (0.02 to 0.03) | <0.001 |
| Predictor: baseline job demands | 0.70 (0.67 to 0.72) | <0.001 | 0.11 (0.08 to 0.13) | <0.001 | 0.04 (0.01 to 0.07) | 0.024 |
| Predictor: baseline job control | −0.78 (−0.82 to −0.74) | <0.001 | −0.20 (−0.23 to −0.17) | <0.001 | 0.01 (−0.03 to 0.05) | 0.571 |
| Predictor: baseline job support | −0.85 (−0.89 to −0.82) | <0.001 | −0.18 (−0.21 to −0.15) | <0.001 | −0.07 (−0.10 to −0.03) | <0.001 |
| Age < 50 years | ||||||
| Prediction model 2, outcome: mechanical exposure index at follow-up | ||||||
| Predictor: baseline number of ARP | 0.26 (0.25 to 0.27) | <0.001 | 0.06 (0.05 to 0.07) | <0.001 | 0.03 (0.02 to 0.03) | <0.001 |
| Prediction model 2, outcome: physical exposure index at follow-up | ||||||
| Predictor: baseline number of ARP | 0.10 (0.09 to 0.11) | <0.001 | −0.01 (−0.01 to −0.00) | 0.001 | −0.02 (−0.02 to −0.01) | <0.001 |
| Prediction model 2, outcome: job demands at follow-up | ||||||
| Predictor: baseline number of ARP | 0.03 (0.02 to 0.03) | <0.001 | 0.01 (0.00 to 0.01) | <0.001 | 0.00 (−0.00 to 0.00) | 0.093 |
| Prediction model 2, outcome: job control at follow-up | ||||||
| Predictor: baseline number of ARP | −0.01 (−0.01 to −0.01) | <0.001 | 0.00 (0.00 to 0.00) | 0.168 | 0.01 (0.01 to 0.01) | <0.001 |
| Prediction model 2, outcome: job support at follow-up | ||||||
| Predictor: baseline number of ARP | −0.03 (−0.03 to −0.03) | <0.001 | −0.02 (−0.02 to −0.01) | <0.001 | −0.01 (−0.01 to −0.01) | <0.001 |
| Age ≥ 50 years | ||||||
| Prediction model 2, outcomes: workload and psychosocial work stressors at follow-up | ||||||
| Prediction model 2, outcome: mechanical exposure index at follow-up | ||||||
| Predictor: baseline number of ARP | 0.30 (0.29 to 0.32) | <0.001 | 0.02 (0.01 to 0.03) | <0.001 | 0.03 (0.02 to 0.04) | <0.001 |
| Prediction model 2, outcome: physical exposure index at follow-up | ||||||
| Predictor: baseline number of ARP | 0.13 (0.12 to 0.14) | <0.001 | −0.01 (−0.01 to −0.00) | 0.003 | 0.00 (−0.00 to 0.01) | 0.232 |
| Prediction model 2, outcome: job demands at follow-up | ||||||
| Predictor: baseline number of ARP | 0.03 (0.02 to 0.03) | <0.001 | 0.01 (0.00 to 0.01) | <0.001 | 0.01 (0.00 to 0.01) | <0.001 |
| Prediction model 2, outcome: job control at follow-up | ||||||
| Predictor: baseline number of ARP | −0.02 (−0.02 to −0.01) | <0.001 | −0.01 (−0.01 to −0.01) | <0.001 | 0.01 (0.00 to 0.01) | 0.004 |
| Prediction model 2, outcome: job support at follow-up | ||||||
| Predictor: baseline number of ARP | −0.03 (−0.03 to −0.03) | <0.001 | −0.01 (−0.01 to −0.01) | <0.001 | −0.01 (−0.01 to −0.01) | <0.001 |
| Outcome and Exposure Variables | Crude Models | Baseline Adjusted Models * | Fully Adjusted Models ** | |||
|---|---|---|---|---|---|---|
| B (95% CI) | p-Value | B (95% CI) | p-Value | B (95% CI) | p-Value | |
| Men | ||||||
| Prediction model 1, outcome: number of ARP at follow-up | ||||||
| Predictor: baseline mechanical exposure index | 0.10 (0.09 to 0.13) | <0.001 | 0.02 (0.02 to 0.03) | <0.001 | 0.02 (0.01 to 0.03) | <0.001 |
| Predictor: baseline physical exposure index | 0.12 (0.10 to 0.14) | <0.001 | 0.01 (−0.03 to 0.04) | 0.782 | 0.01 (−0.03 to 0.05) | 0.603 |
| Predictor: baseline job demands | 0.55 (0.43 to 0.66) | <0.001 | 0.18 (0.16 to 0.19) | <0.001 | 0.11 (0.09 to 0.13) | <0.001 |
| Predictor: baseline job control | −0.25 (−0.39 to −0.11) | <0.001 | −0.06 (−0.08 to 0.04) | <0.001 | −0.07 (−0.09 to −0.03) | <0.001 |
| Predictor: baseline job support | −0.56 (−0.69 to −0.45) | <0.001 | −0.13 (−0.16 to −0.11) | <0.001 | −0.02 (−0.04 to 0.01) | 0.180 |
| Women | ||||||
| Prediction model 1, outcome: number of ARP at follow-up | ||||||
| Predictor: baseline mechanical exposure index | 0.19 (0.16 to 0.22) | <0.001 | 0.03 (0.03 to 0.04) | <0.001 | 0.13 (0.08 to 0.17) | <0.001 |
| Predictor: baseline physical exposure index | 0.14 (0.10 to 0.17) | <0.001 | 0.01 (0.00 to 0.02) | 0.010 | −0.01 (−0.07 to 0.05) | 0.680 |
| Predictor: baseline job demands | 0.65 (0.48 to 0.81) | <0.001 | 0.26 (0.07 to 0.45) | 0.007 | 0.12 (0.09 to 0.15) | <0.001 |
| Predictor: baseline job control | −0.47 (−0.67 to −0.27) | <0.001 | −0.25 (−0.48 to −0.01) | 0.044 | 0.10 (0.06 to 0.14) | <0.001 |
| Predictor: baseline job support | −0.63 (−0.82 to −0.43) | <0.001 | −0.34 (−0.56 to −0.11) | 0.004 | 0.12 (0.09 to 0.16) | <0.001 |
| Men | ||||||
| Prediction model 2, outcomes: workload and psychosocial work stressors at follow-up | ||||||
| Prediction model 2, outcome: mechanical exposure index at follow-up | ||||||
| Predictor: baseline number of ARP | 0.42 (0.41 to 0.44) | <0.001 | 0.02 (0.01 to 0.03) | <0.001 | 0.01 (−0.01 to 0.02) | 0.284 |
| Prediction model 2, outcome: physical exposure index at follow-up | ||||||
| Predictor: baseline number of ARP | 0.23 (0.22 to 0.24) | <0.001 | 0.02 (0.00 to 0.01) | <0.001 | 0.02 (0.01 to 0.03) | <0.001 |
| Prediction model 2, outcome: job demands at follow-up | ||||||
| Predictor: baseline number of ARP | 0.03 (0.03 to 0.04) | <0.001 | 0.01 (0.00 to 0.01) | 0.029 | −0.01 (−0.01 to −0.00) | 0.002 |
| Prediction model 2, outcome: job control at follow-up | ||||||
| Predictor: baseline number of ARP | −0.01 (−0.01 to −0.00) | <0.001 | −0.01 (−0.01 to −0.00) | 0.042 | 0.01 (0.00 to 0.01) | <0.001 |
| Prediction model 2, outcome: job support at follow-up | ||||||
| Predictor: baseline number of ARP | −0.03 (−0.04 to −0.03) | <0.001 | −0.01 (−0.01 to −0.01) | <0.001 | −0.01 (−0.01 to −0.01) | 0.013 |
| Women | ||||||
| Prediction model 2, outcomes: workload and psychosocial work stressors at follow-up | ||||||
| Prediction model 2, outcome: mechanical exposure index at follow-up | ||||||
| Predictor: baseline number of ARP | 0.23 (0.22 to 0.24) | <0.001 | 0.05 (0.05 to 0.06) | <0.001 | 0.05 (0.04 to 0.05) | <0.001 |
| Prediction model 2, outcome: physical exposure index at follow-up | ||||||
| Predictor: baseline number of ARP | 0.09 (0.08 to 0.09) | <0.001 | −0.01 (−0.02 to 0.00) | <0.001 | −0.01 (−0.02 to 0.00) | <0.001 |
| Prediction model 2, outcome: job demands at follow-up | ||||||
| Predictor: baseline number of ARP | 0.02 (0.02 to 0.02) | <0.001 | 0.01 (0.00 to 0.01) | <0.001 | 0.01 (0.00 to 0.01) | <0.001 |
| Prediction model 2, outcome: job control at follow-up | ||||||
| Predictor: baseline number of ARP | −0.01 (−0.01 to −0.01) | <0.001 | −0.00 (−0.01 to 0.00) | 0.158 | 0.01 (0.00 to 0.01) | <0.001 |
| Prediction model 2, outcome: job support at follow-up | ||||||
| Predictor: baseline number of ARP | −0.03 (−0.03 to −0.02) | <0.001 | −0.01 (−0.01 to −0.01) | <0.001 | −0.01 (−0.01 to −0.01) | <0.001 |
| Outcome and Exposure Variables | Crude Models | Baseline Adjusted Models * | Fully Adjusted Models ** | |||
|---|---|---|---|---|---|---|
| B (95% CI) | p-Value | B (95% CI) | p-Value | B (95% CI) | p-Value | |
| Model of change 1, outcome: change in the number of ARP | ||||||
| Predictor: change in mechanical exposure index | 0.12 (0.10 to 0.13) | <0.001 | 0.12 (0.10 to 0.13) | <0.001 | 0.10 (0.08 to 0.12) | <0.001 |
| Predictor: change in physical exposure index | 0.09 (0.07 to 0.10) | <0.001 | −0.03 (−0.05 to −0.01) | 0.006 | −0.00 (−0.00 to 0.00) | 0.982 |
| Predictor: change in job demands | 0.39 (0.36 to 0.46) | <0.001 | 0.19 (0.11 to 0.27) | <0.001 | −0.01 (−0.10 to 0.01) | 0.815 |
| Predictor: change in job control | −0.38 (−0.47 to −0.29) | <0.001 | −0.18 (−0.28 to −0.08) | <0.001 | 0.01 (−0.10 to 0.12) | 0.877 |
| Predictor: change in job support | −0.48 (−0.44 to −0.38) | <0.001 | −0.33 (−0.43 to −0.23) | <0.001 | −0.07 (−0.17 to 0.01) | 0.228 |
| Model of change 2, outcomes: workload and psychosocial work stressors | ||||||
| Model of change 2, outcome: change in mechanical exposure index | ||||||
| Predictor: change in the number of ARP | 0.20 (0.17 to 0.22) | <0.001 | 0.13 (0.11 to 0.15) | <0.001 | 0.12 (0.10 to 0.14) | <0.001 |
| Model of change 2, outcome: change in physical exposure index | ||||||
| Predictor: change in the number of ARP | 0.08 (0.06 to 0.09) | <0.001 | −0.02 (−0.01 to −0.00) | 0.002 | 0.00 (−0.02 to 0.02) | 0.987 |
| Model of change 2, outcome: change in job demands | ||||||
| Predictor: change in the number of ARP | 0.02 (0.02 to 0.03) | <0.001 | 0.01 (0.00 to 0.02) | <0.001 | −0.01 (−0.01 to 0.01) | 0.810 |
| Model of change 2, outcome: change in job control | ||||||
| Predictor: change in the number of ARP | −0.01 (−0.02 to −0.01) | <0.001 | −0.01 (−0.01 to −0.01) | <0.001 | −0.00 (−0.00 to 0.00) | 0.998 |
| Model of change 2, outcome: change in job support | ||||||
| Predictor: change in the number of ARP | −0.02 (−0.03 to −0.02) | <0.001 | −0.01 (−0.02 to −0.01) | <0.001 | −0.01 (−0.01 to 0.01) | 0.249 |
© 2019 by the authors. Licensee MDPI, Basel, Switzerland. This article is an open access article distributed under the terms and conditions of the Creative Commons Attribution (CC BY) license (http://creativecommons.org/licenses/by/4.0/).
Share and Cite
Dragioti, E.; Gerdle, B.; Larsson, B. Longitudinal Associations between Anatomical Regions of Pain and Work Conditions: A Study from The SwePain Cohort. Int. J. Environ. Res. Public Health 2019, 16, 2167. https://doi.org/10.3390/ijerph16122167
Dragioti E, Gerdle B, Larsson B. Longitudinal Associations between Anatomical Regions of Pain and Work Conditions: A Study from The SwePain Cohort. International Journal of Environmental Research and Public Health. 2019; 16(12):2167. https://doi.org/10.3390/ijerph16122167
Chicago/Turabian StyleDragioti, Elena, Björn Gerdle, and Britt Larsson. 2019. "Longitudinal Associations between Anatomical Regions of Pain and Work Conditions: A Study from The SwePain Cohort" International Journal of Environmental Research and Public Health 16, no. 12: 2167. https://doi.org/10.3390/ijerph16122167
APA StyleDragioti, E., Gerdle, B., & Larsson, B. (2019). Longitudinal Associations between Anatomical Regions of Pain and Work Conditions: A Study from The SwePain Cohort. International Journal of Environmental Research and Public Health, 16(12), 2167. https://doi.org/10.3390/ijerph16122167