Article

Chromium Monitoring in Water by Colorimetry Using Optimised 1,5-Diphenylcarbazide Method

1
EnviroCORE, Department of Science and Health, Institute of Technology Carlow, Kilkenny Road, Co. Carlow R93 V960, Ireland
2
TE Laboratories Ltd. (TelLab), Loughmartin Business Park, Tullow, Co. Carlow R93 N529, Ireland
*
Author to whom correspondence should be addressed.
Int. J. Environ. Res. Public Health 2019, 16(10), 1803; https://doi.org/10.3390/ijerph16101803
Submission received: 1 April 2019 / Revised: 2 May 2019 / Accepted: 18 May 2019 / Published: 21 May 2019

Abstract

:
Chromium contamination of drinking water has become a global problem due to its extensive use in industry. The most commonly used methods for chromium detection in water are laboratory-based methods, such as atomic absorption spectroscopy and mass spectroscopy. Although these methods are highly selective and sensitive, they require expensive maintenance and highly trained staff. Therefore, there is a growing demand for cost effective and portable detection methods that would meet the demand for mass monitoring. Microfluidic detection systems based on optical detection have great potential for onsite monitoring applications. Furthermore, their small size enables rapid sample throughput and minimises both reagent consumption and waste generation. In contrast to standard laboratory methods, there is also no requirement for sample transport and storage. The aim of this study is to optimise a colorimetric method based on 1,5-diphenylcarbazide dye for incorporation into a microfluidic detection system. Rapid colour development was observed after the addition of the dye and samples were measured at 543 nm. Beer’s law was obeyed in the range between 0.03–3 mg·L−1. The detection limit and quantitation limit were found to be 0.023 and 0.076 mg·L−1, respectively.

1. Introduction

Environmental contamination of chromium has become a global concern because of its major role in industry [1,2,3]. Chromium is widely used in leather tanning, electroplating, paint manufacture, wood treatment, metallurgy, and mining [4,5,6,7]. Significant amounts of chromium are introduced into the environment through poorly regulated disposal of chromium containing waste [8]. As a result, chromium concentrations in surface and drinking water can exceed the World Health Organization’s maximum allowable concentration of 0.05 mg·L−1 [9,10].
In the environment, chromium can be most commonly found in two oxidation states—hexavalent (Cr VI) and trivalent (Cr III) [11]. Redox and pH conditions determine chromium speciation in water. Generally, Cr VI is more abundant under oxidizing conditions, while Cr III dominates under reducing conditions [12,13].
Cr III, at appropriate levels, is beneficial for human health and is involved in lipid and glucose metabolism, whereas Cr VI is toxic [14,15]. Health problems associated with Cr VI exposure include skin rashes, kidney and liver damage, internal haemorrhage, teeth abnormalities, and respiratory ailments, including lung cancer [16,17,18,19].
High Cr VI concentrations have been reported in numerous groundwater sources around the world [20,21,22,23]. One of the most infamous cases of Cr VI pollution took place in Hinkley, California, where concentrations as high as 0.580 mg·L−1 were reported in groundwater samples [24]. In Kanpur, India, due to poor waste disposal practices, Cr VI concentration reached 16.3 mg·L−1 [25]. In Leon Valley, Mexico, Cr VI concentrations were found to have reached 50 mg·L−1 due to industrial runoff [26].
Due to the high toxicity of Cr VI and its presence in the environment, effective and reliable monitoring of the species is required. The most commonly used methods for Cr VI detection are atomic absorption spectrophotometry (AAS) and inductively coupled plasma-mass spectrometry (ICP-MS) [27,28]. Although these are powerful and sensitive methods that can detect Cr VI even at trace levels, they are also expensive and require skilled analysts and laborious sampling. Different oxidation states of Cr VI in groundwater can be unstable when exposed to air, temperature fluctuations, and change in pH [29]. Because of this, Cr VI should ideally be detected on site, and therefore, simple, portable, sensitive, and cost-effective methods would be greatly beneficial [30].
In recent years, application of microfluidic detection systems for environmental monitoring has gained great interest [31,32,33,34,35]. Microfluidic detection systems are characterised by their small size, which offers the potential for development of portable sensing systems with the ability to analyse samples on a sub-millilitre scale [36]. There are numerous advantages associated with miniaturisation, including reduced sample volume, fast reaction time, and minimised waste production [37]. Additionally, microfluidic detection systems facilitate the development of portable and/or autonomous devices, which can be used on site without the requirement of sample collection and transportation [38].
Electrochemical sensors have been used for heavy metal monitoring in water, including Cr VI [39,40,41,42,43]. Methods based on electrochemical detection can achieve very low detection limits and high selectivity [44]. There are, however, numerous limitations associated with electrochemical detection methods that make them difficult to implement for long-term monitoring, such as inability to analyse complex water matrices, sensor drift, high maintenance cost, and biofouling [45].
Biofouling is significantly minimised in optical detection systems as they do not require direct contact between the sensor and the sample. Optical detection methods are widely used in microfluidic analysis [46,47,48,49]. Colorimetric methods can be implemented using simple and low-cost detection systems based on light emitting diodes (LEDs) as light source and photodiode detectors, making them suitable for use in portable microfluidic detection systems [50].
In recent years, paper-based microfluidic analytical devices (μPADs) have been used for environmental monitoring [51]. μPADs use capillary forces instead of pumps and have low manufacturing costs [52]. Asano et al. used μPADs based on 1,5-diphenyl-carbazide for Cr VI detection in water and obtained an LOD of 30 mg·L−1 with a linear range between 40–400 mg·L−1 [53]. Idros et al. utilised μPADs for Cr VI detection in water using colorimetric detection with LOD of 0.019 mg·L−1 and linear range between 0.019–1.4 mg·L−1 [54]. In 2018, Sun et al. developed a Cr VI detection method using a μPADs-based rotational device with linear range between 0.5–10 mg·L−1 and LOD of 0.18 mg·L−1 [55].
The use of different chromophoric dyes for spectrometric Cr VI detection in water has been described in the literature [56,57,58,59]. Onocke and Sasu developed a method for Cr VI detection in groundwater and industrial waste samples [60]. In this method, Cr VI was reacted with 1,5-diphenylcarbazide (DPC) dye, which, in acidic conditions, forms a purple-coloured species. As a result of a redox reaction, Cr VI is reduced to Cr III, and DPC is oxidised to 1,5-diphenylcarbazone (DPCA). Cr III and DPCA form a purple-coloured species with lambda max of 540 nm [61]. To date, DPC method has not been implemented into an autonomous detection system.
The aim of this study is to optimise a DPC method for low-cost and simple incorporation into a microfluidic detection system (Figure 1). The DPC method was chosen because of the intense colour development at 543 nm region. The method’s performance was evaluated in the laboratory on both macro and micro scale.

2. Materials and Methods

2.1. Apparatus

Shimadzu 1800 UV-visible spectrometer was used with Hellma 10 mm and 1 mm quartz cuvettes for the absorbance measurements. Hanna 20 pH meter was used for pH measurements. Varian 820-MS ion-coupled plasma mass spectrometer (ICP-MS) (Varian, Palo Alto, CA, USA) was used to determine Cr VI concentration in the water samples. The settings for the ICP-MS analysis are shown in Table 1.

2.2. Reagents

All chemicals were of analytical grade and purchased from Sigma-Aldrich (Arklow, Ireland), unless otherwise stated. Potassium dichromate (K2Cr2O7), iron chloride 6-hydrate (Fisher Scientific, Leicestershire, UK), magnesium sulphate (MgSO4) (Fisher Scientific, Leicestershire, UK), potassium dihydrogen phosphate (KH2PO4), manganese sulphate 1-hydrate (MnSO4·H2O), sodium nitrate (NaNO3), and chromium chloride hexahydrate (CrCl3·6H2O) were used to prepare stock solutions at concentration 1000 mg·L−1 in double-deionised water. Working standards were prepared by serial dilution. Methanol (CH3OH), Tween 20 (C58H114O26), acetonitrile (CH3CN) (Lennox, Dublin), hydrochloric acid (HCl), and nitric acid (HNO3) (SciChem, Bilston, UK) were used for sample cell cleaning validation. Ascorbic acid (C6H8O6), 1,5-diphenylcarbazide (C6H5NHNHCONHNHC6H5), and sodium hydroxide (NaOH) (Sharlab S.L., Barcelona, Spain) were prepared by weighing out an appropriate amount and dissolving it in double deionised water. Sulphuric acid (H2SO4) (97%) was used to prepare sulphuric acid solutions with various concentrations in double deionised water. Double deionised water was used for dilution of reagents and samples.

2.3. Sample Preparation
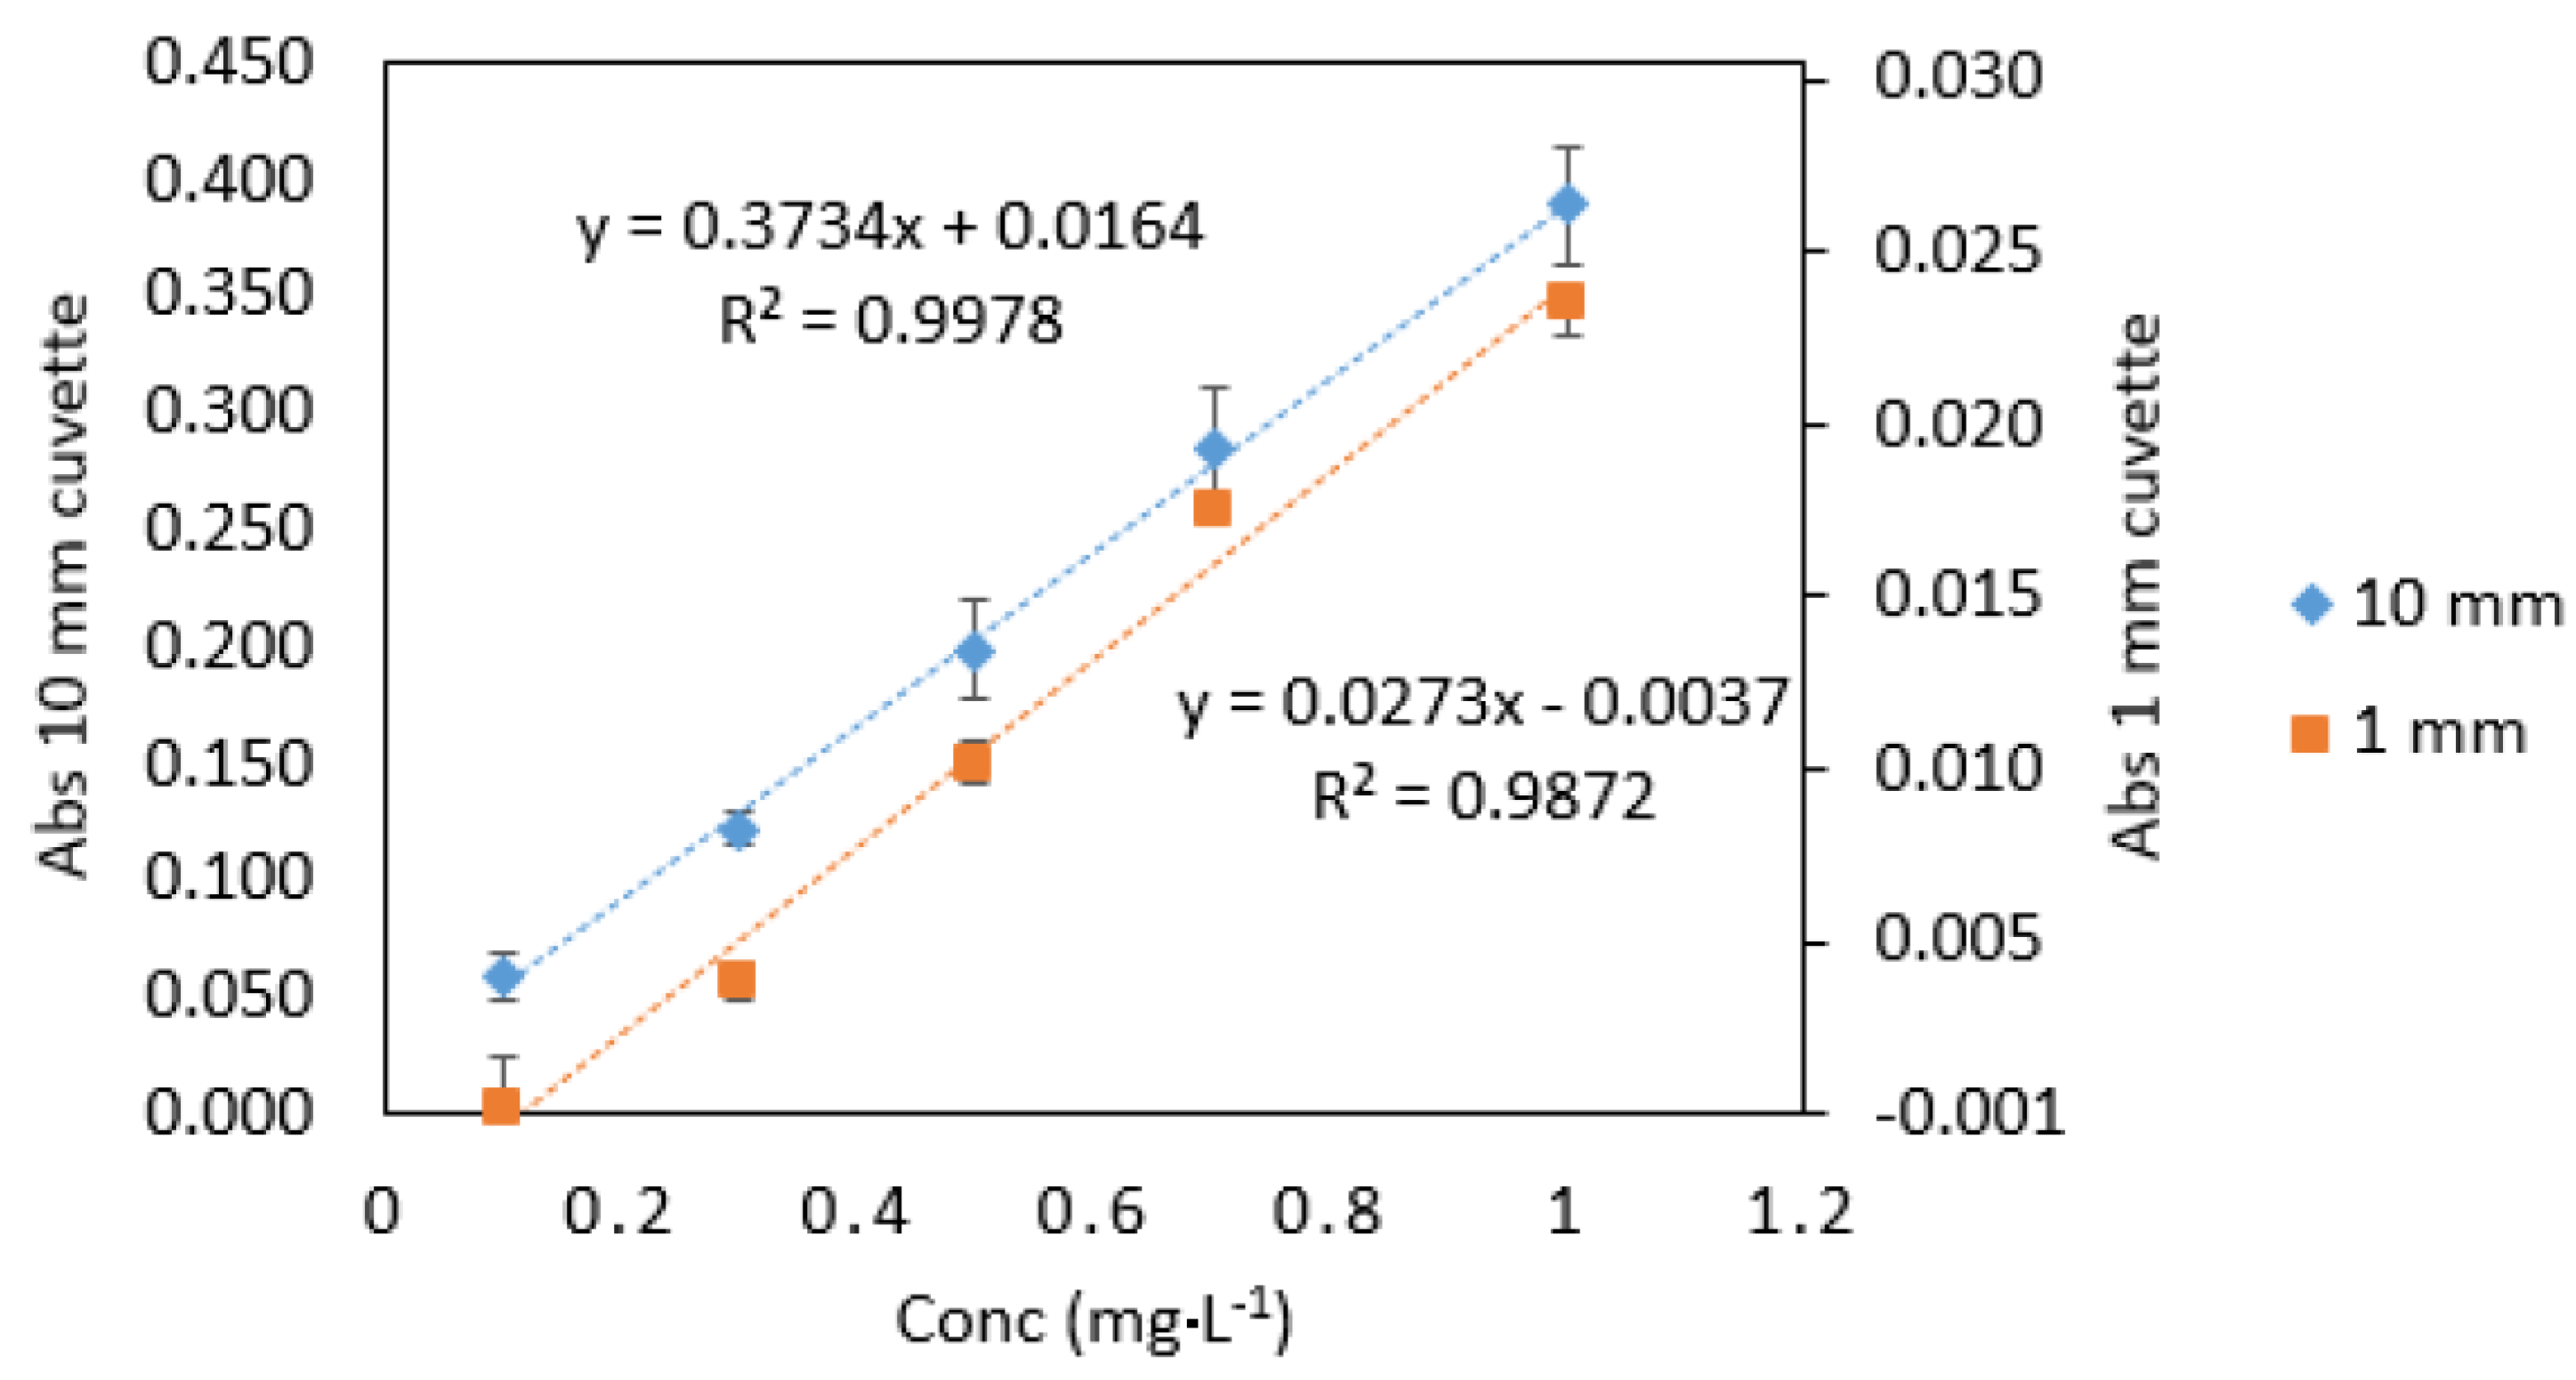
Cr VI sample (2 mL) was transferred to a glass vial. Sulphuric acid (0.2 M, 1 mL) and 1,5-diphenylcarbazide (0.5% w/v, 1 mL) were added, and the mixture was gently shaken and left for five minutes. The absorbance was measured at 543 nm against reagent blank.

2.4. Path Length

Effect of optical path length on absorbance was investigated in order to simulate the conditions in a microfluidic detection system. The procedure was carried out in standard 10 mm quartz cuvettes and microcuvettes with 1 mm light path for Cr VI solutions with concentrations of 0.1–1.0 mg·L−1. The experiment was carried out in triplicate. The average absorbance was calculated, and calibration curves were plotted.

2.5. Sample Cell Cleaning Validation

10 mm quartz cuvettes were filled with a solution containing Cr VI and reagents and left to stand for one hour. Double deionised water, 1% hydrochloric acid, 1% nitric acid, methanol, acetonitrile, acetone, Tween 20, and 1% sulphuric acid were used to rinse the cuvettes. The absorbance of cuvettes was measured at 543 nm. The absorbance obtained from different solvents was compared to clean quartz cuvettes (control). All measurements were carried out in triplicate.

2.6. Optimisation of Parameters
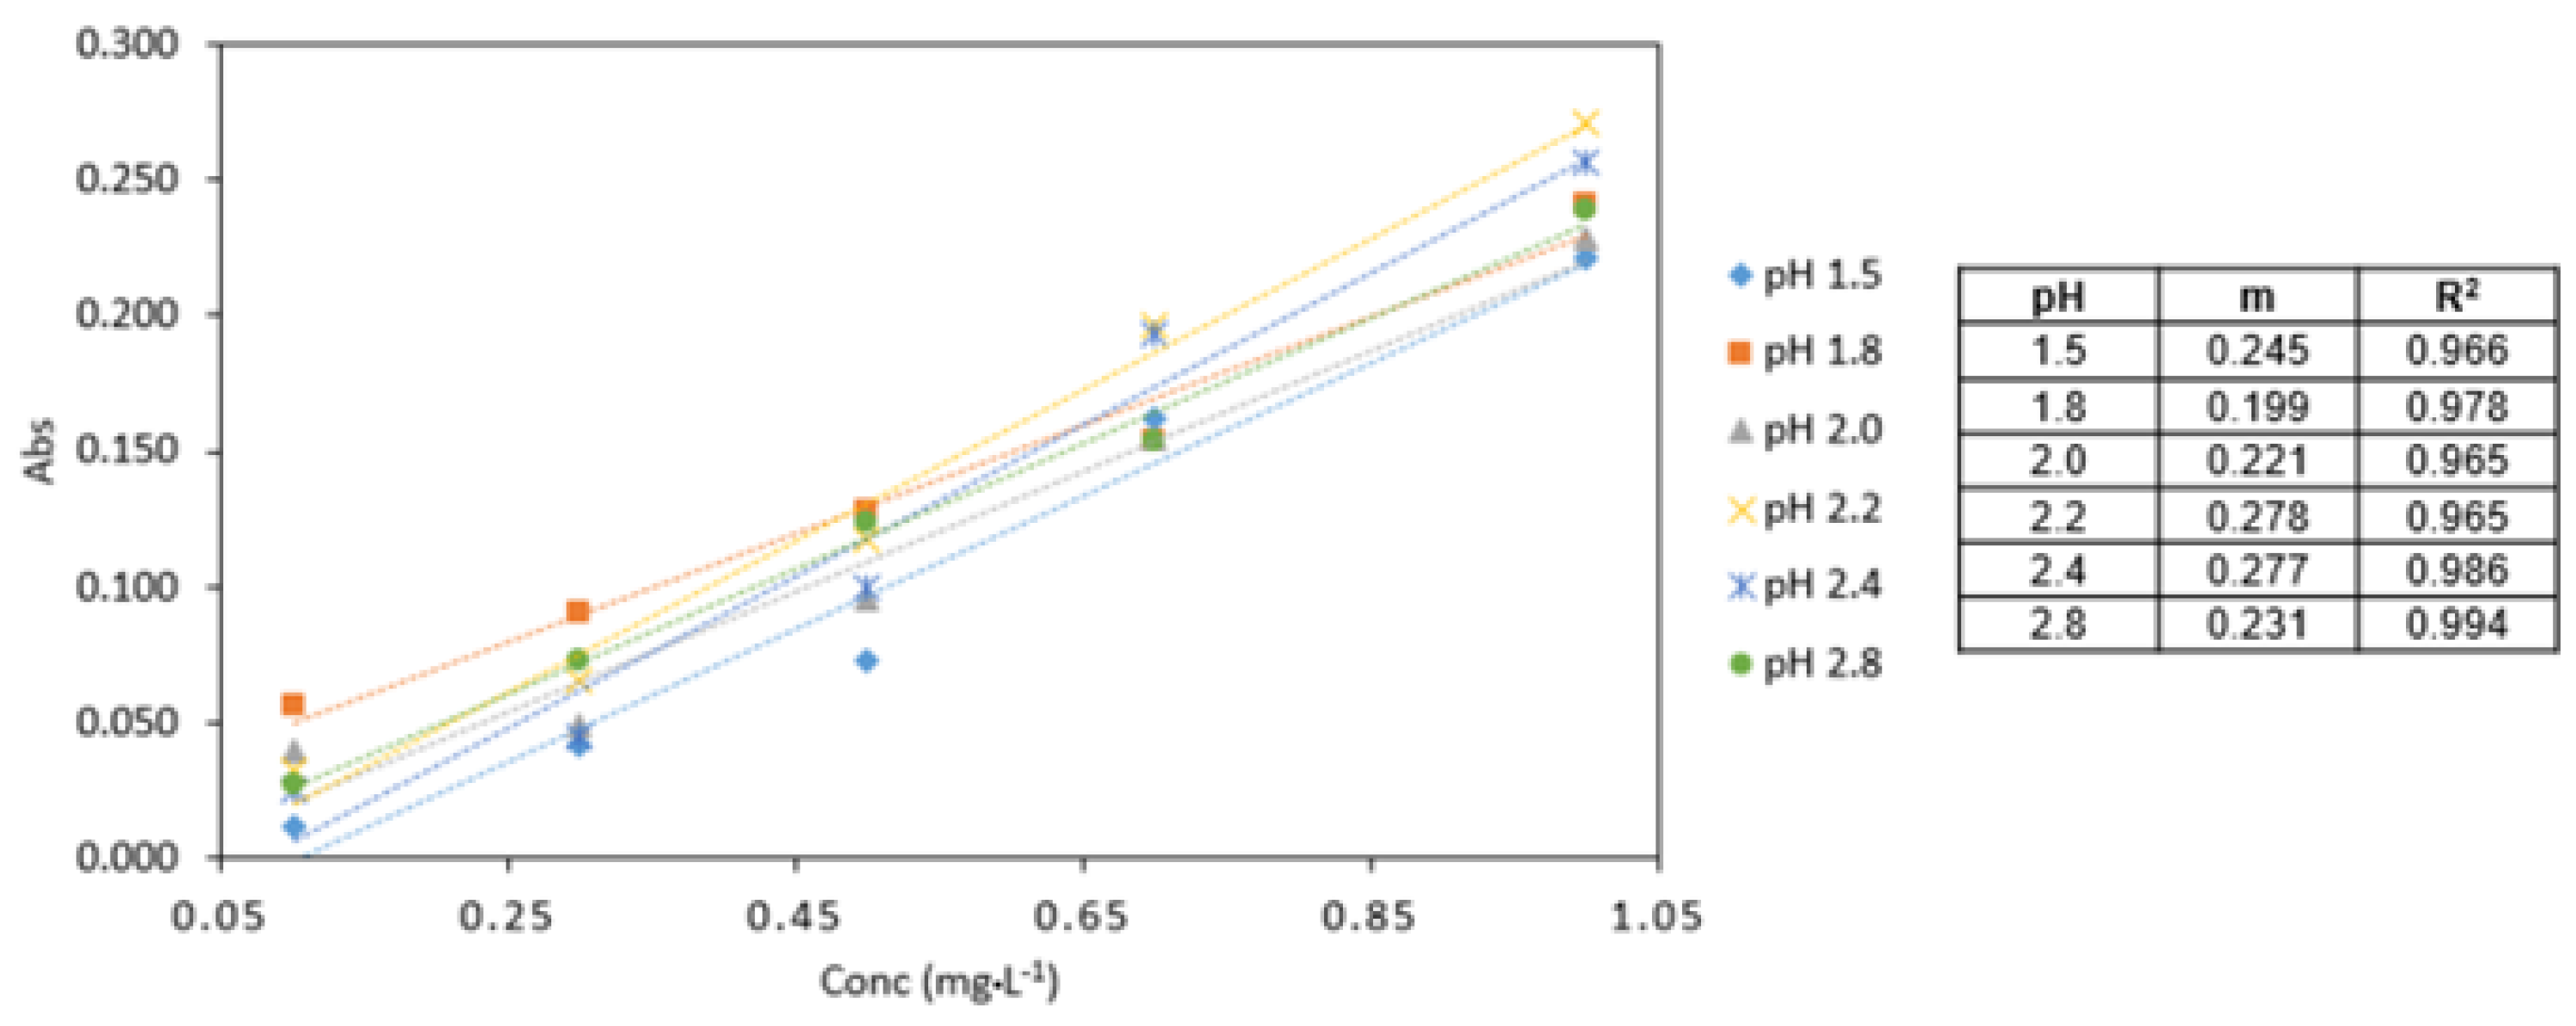
2.6.1. pH

The effect of pH on the method was studied. Sulphuric acid and sodium hydroxide were used to adjust the pH of the double deionised water in which the chromium samples (Cr VI) were prepared.

2.6.2. Sample/Reagent Ratio

The effect on absorbance of combining the different reagents into a single reagent solution was studied in order to simplify the detection process, which would in turn enable cost effective and uncomplicated microfluidic chip design and fabrication. Sulphuric acid and DPC dye were mixed together in a 1:1 ratio to form a combined reagent, which was then used for the analysis of Cr VI samples. A sample of 2 mL was placed into a glass vial to which 2 mL of combined reagent was added (sample/reagent ratio B). After five minutes, measurements were taken at 543 nm using quartz cuvettes. The absorbance was compared to the original sample/reagent ratio: 1 (sample): 1 (0.4 M sulphuric acid): 1 (DPC), described as sample/reagent ratio A in the results section.

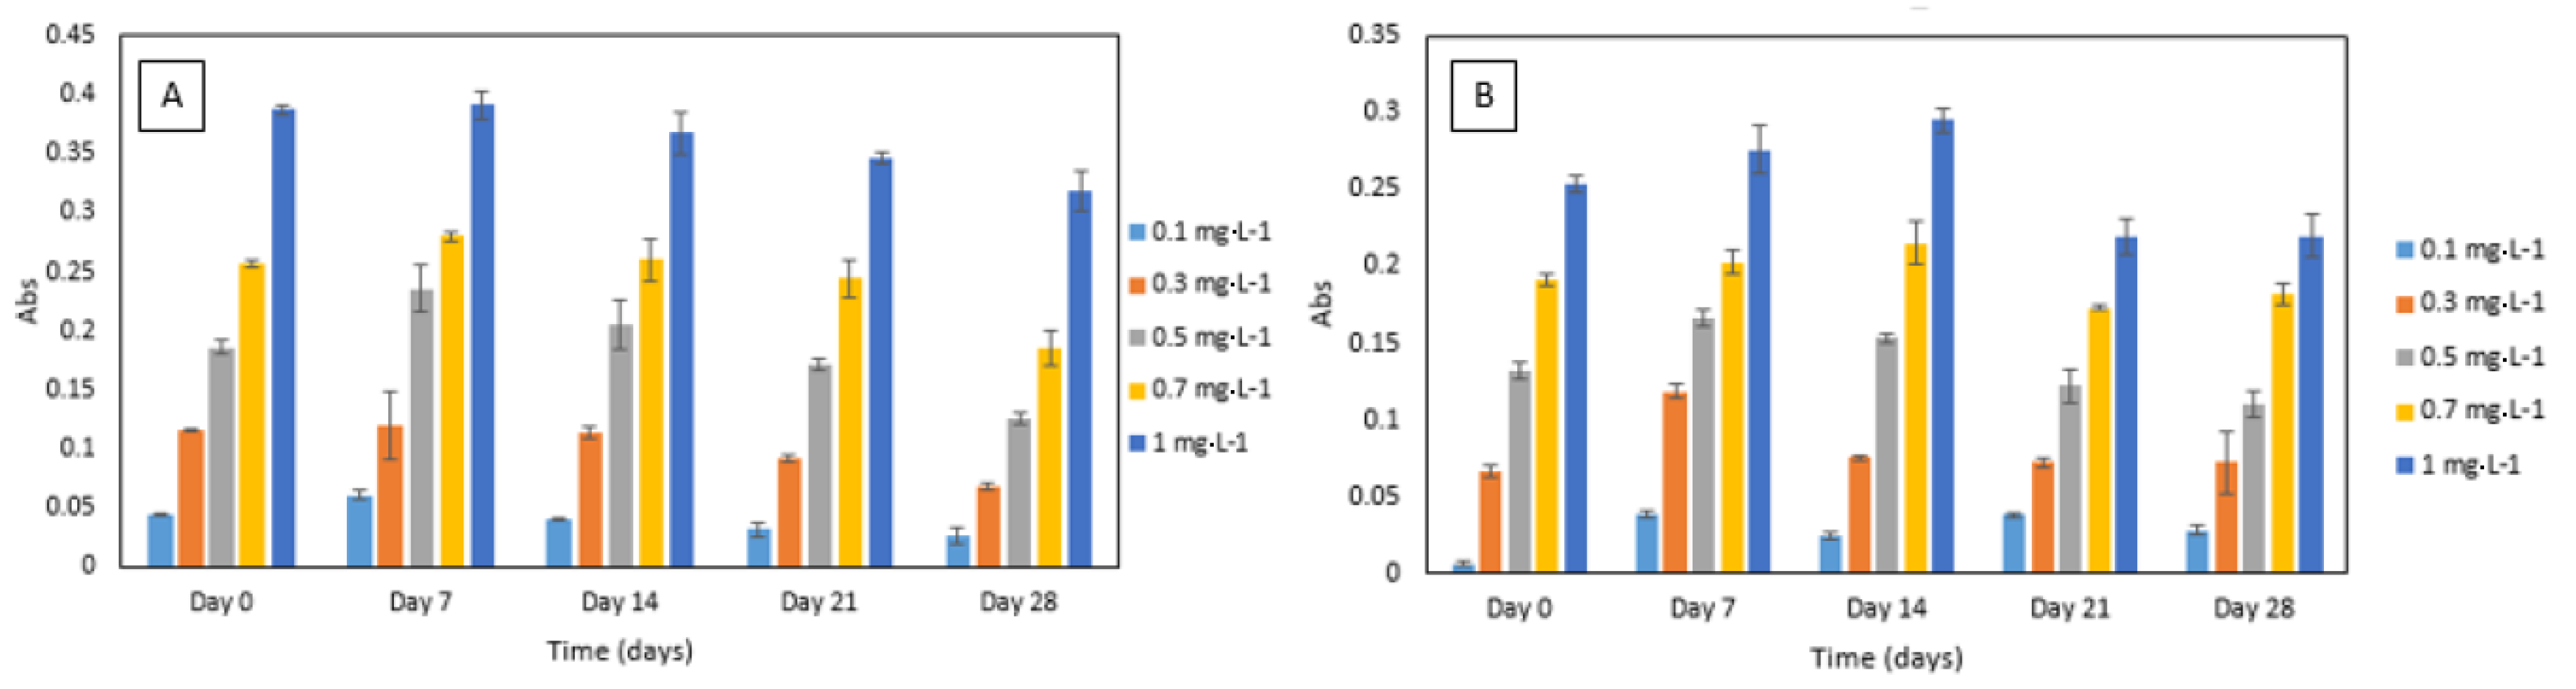
2.6.3. Reagent Stability

The effect of reagent stability on the Cr VI determination was investigated. Firstly, 0.5% DPC dye was used for Cr VI determination over 28 days with fresh 0.4 M sulphuric acid prepared every week. Secondly, 0.5% DPC and 0.4 M sulphuric acid reagent mixture was prepared and used for Cr VI determination over 28 days. Absorbance was measured every week and compared.

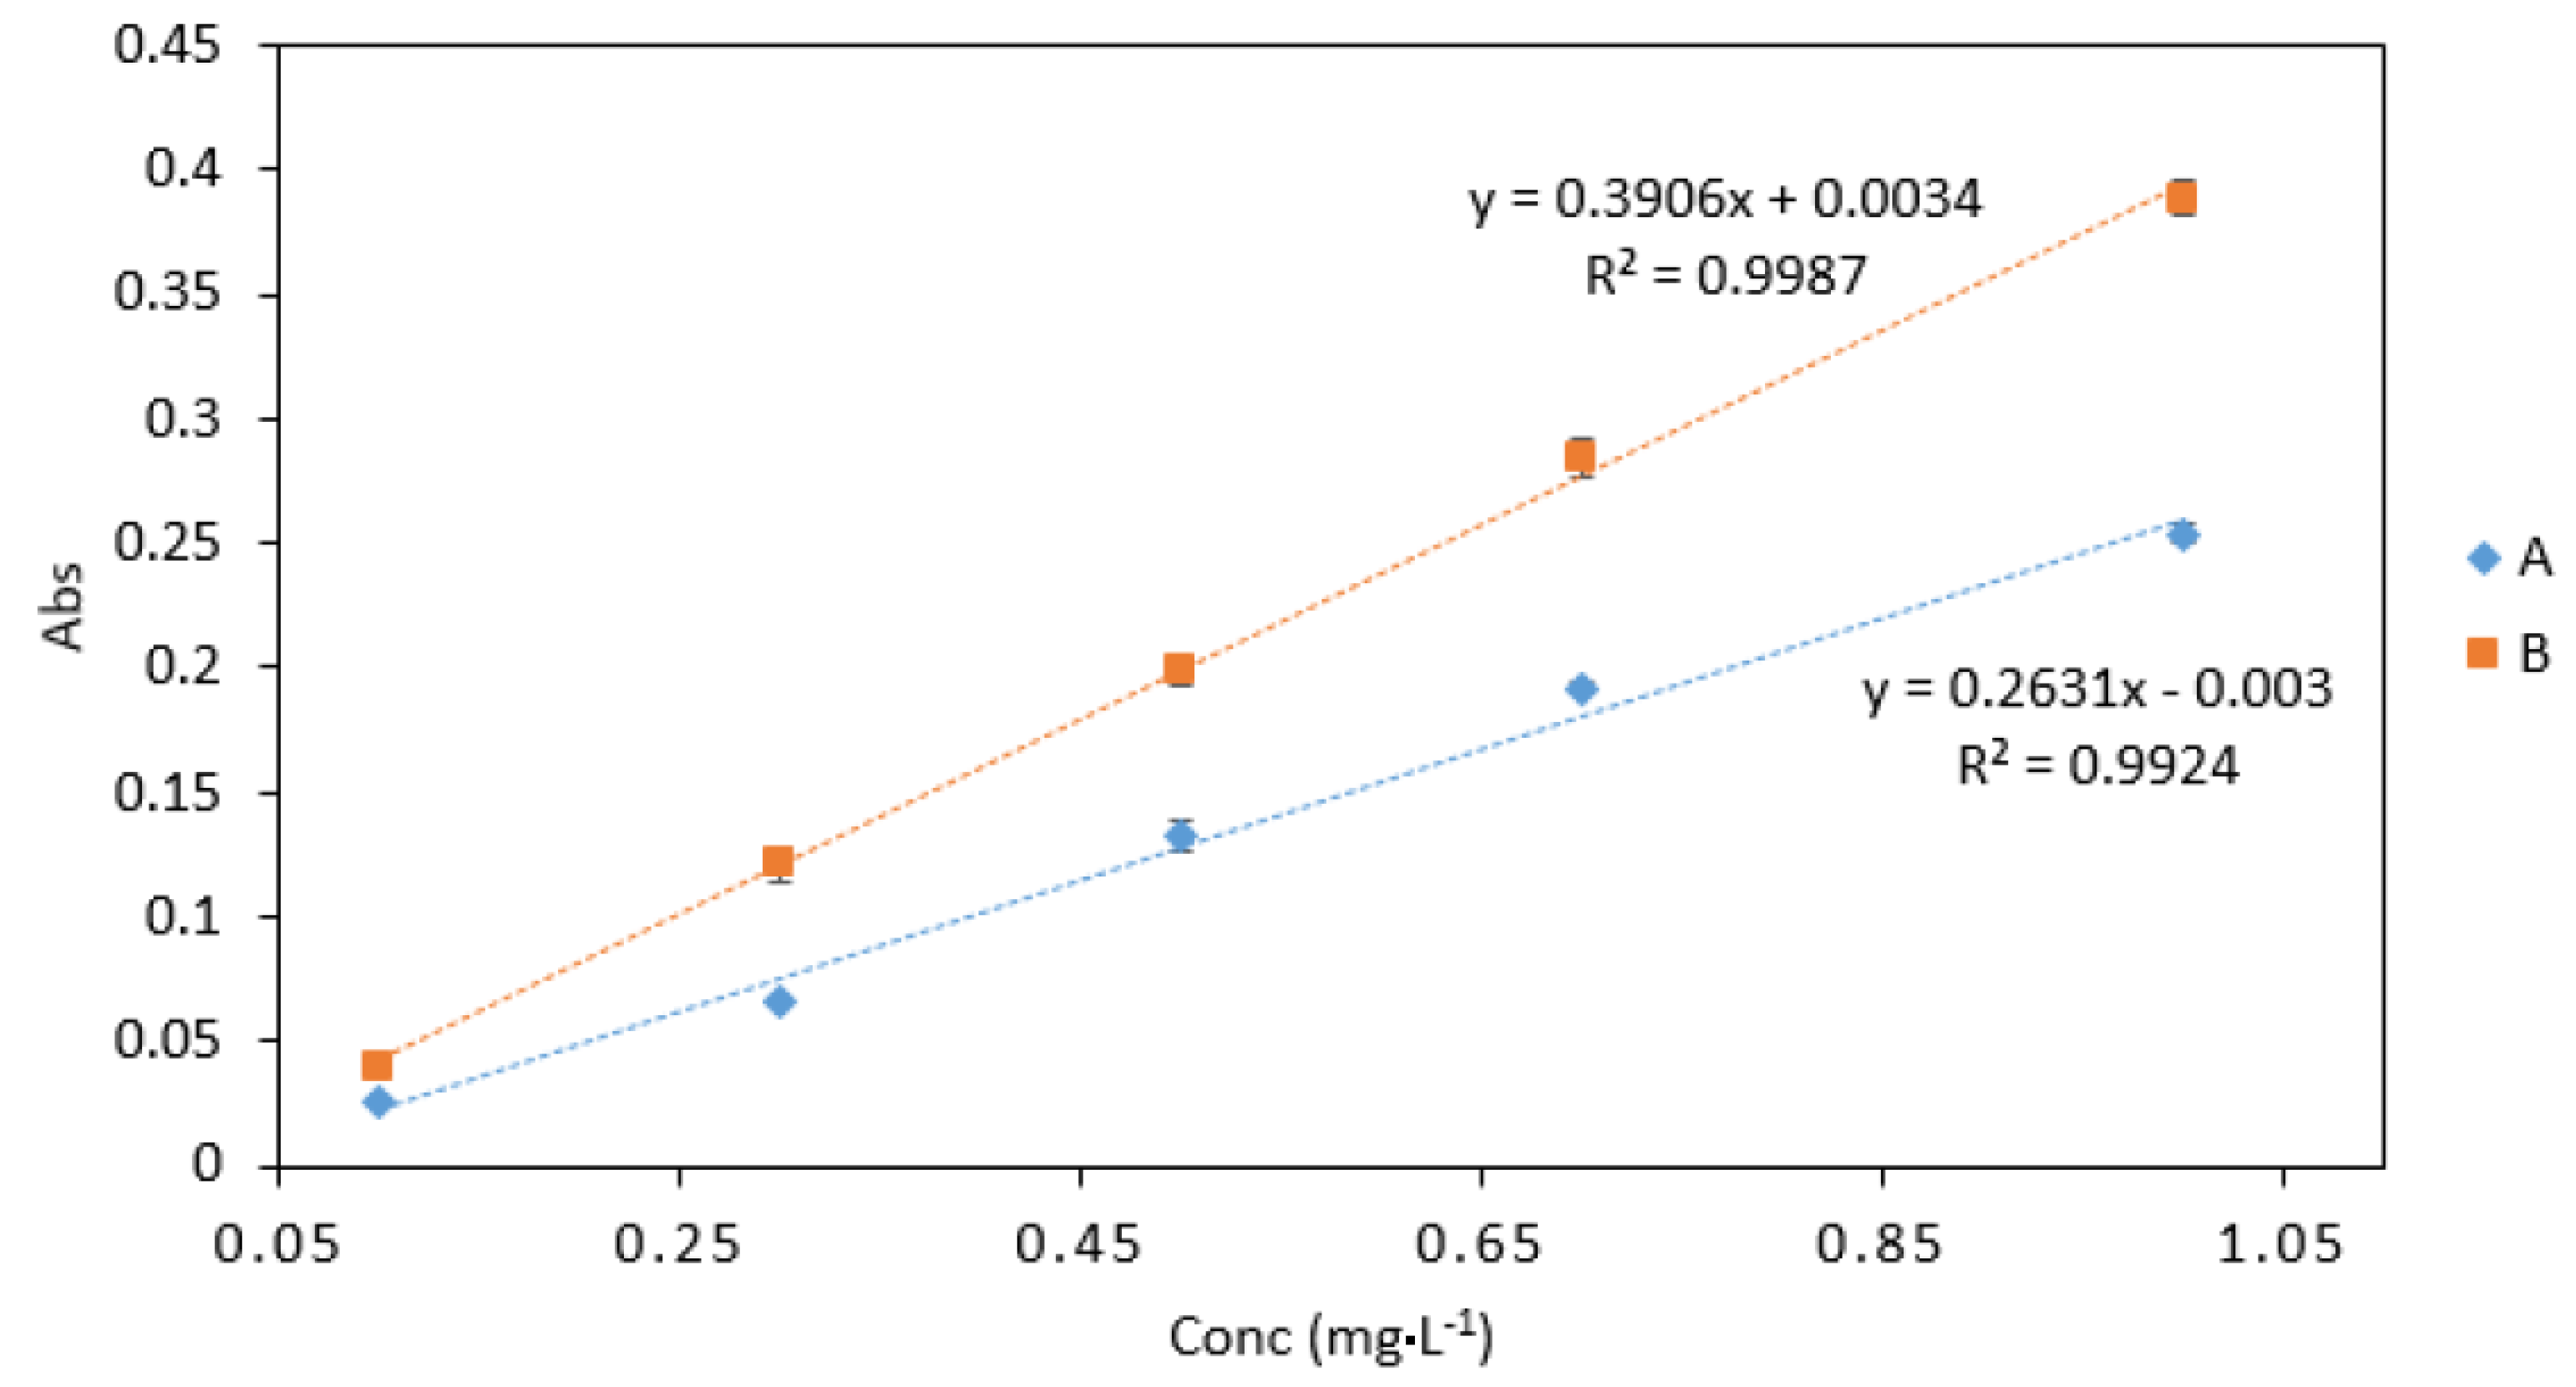
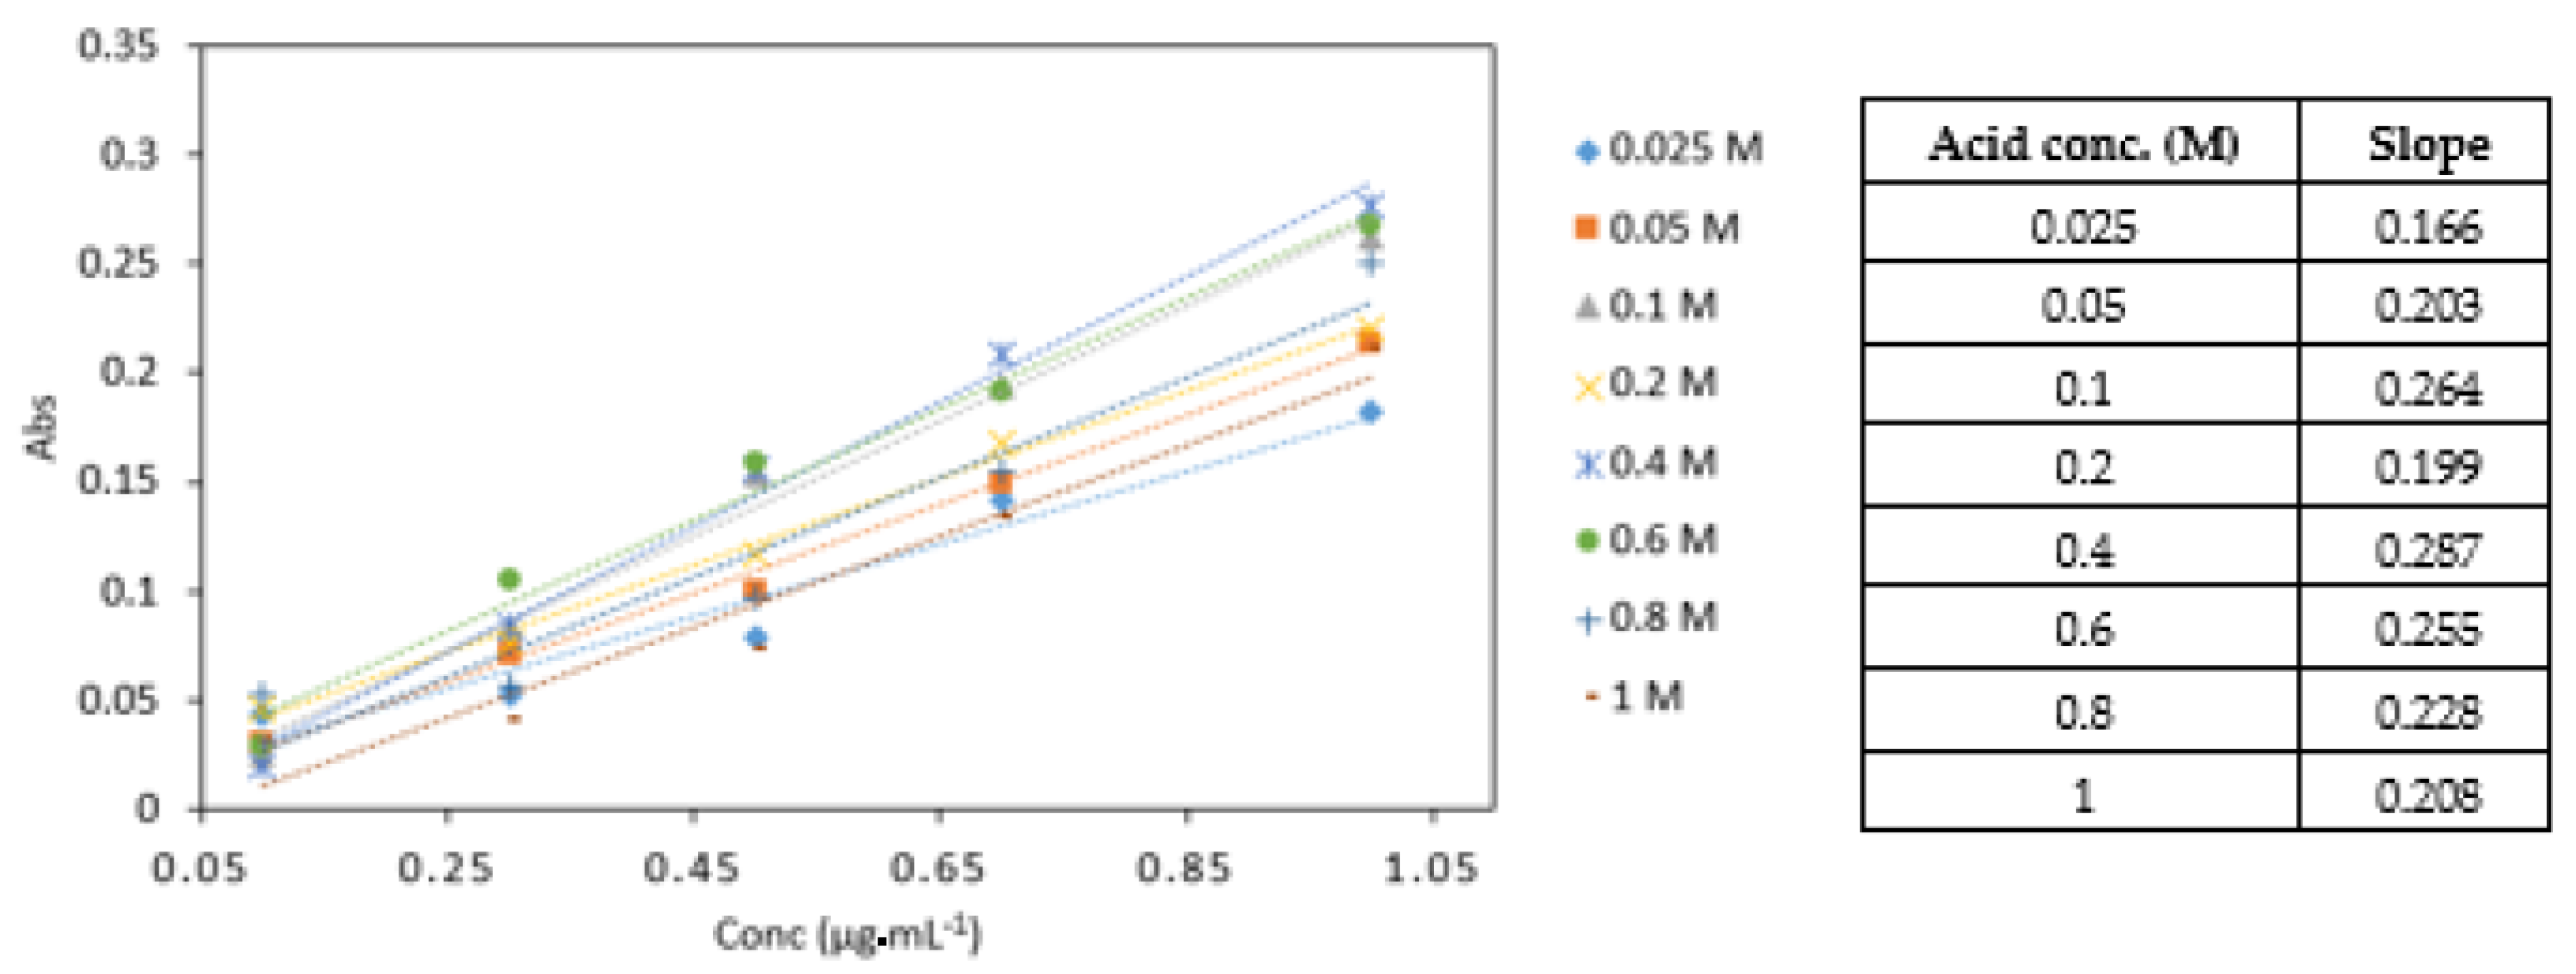
2.6.4. Effect of Different Acid Concentrations

The effect of varying sulphuric acid concentration was studied. Cr VI ranging from 0.1 to 1 mg·L−1 were analysed. One-way analysis of variance (ANOVA, single factor) was used to analyse the results obtained.

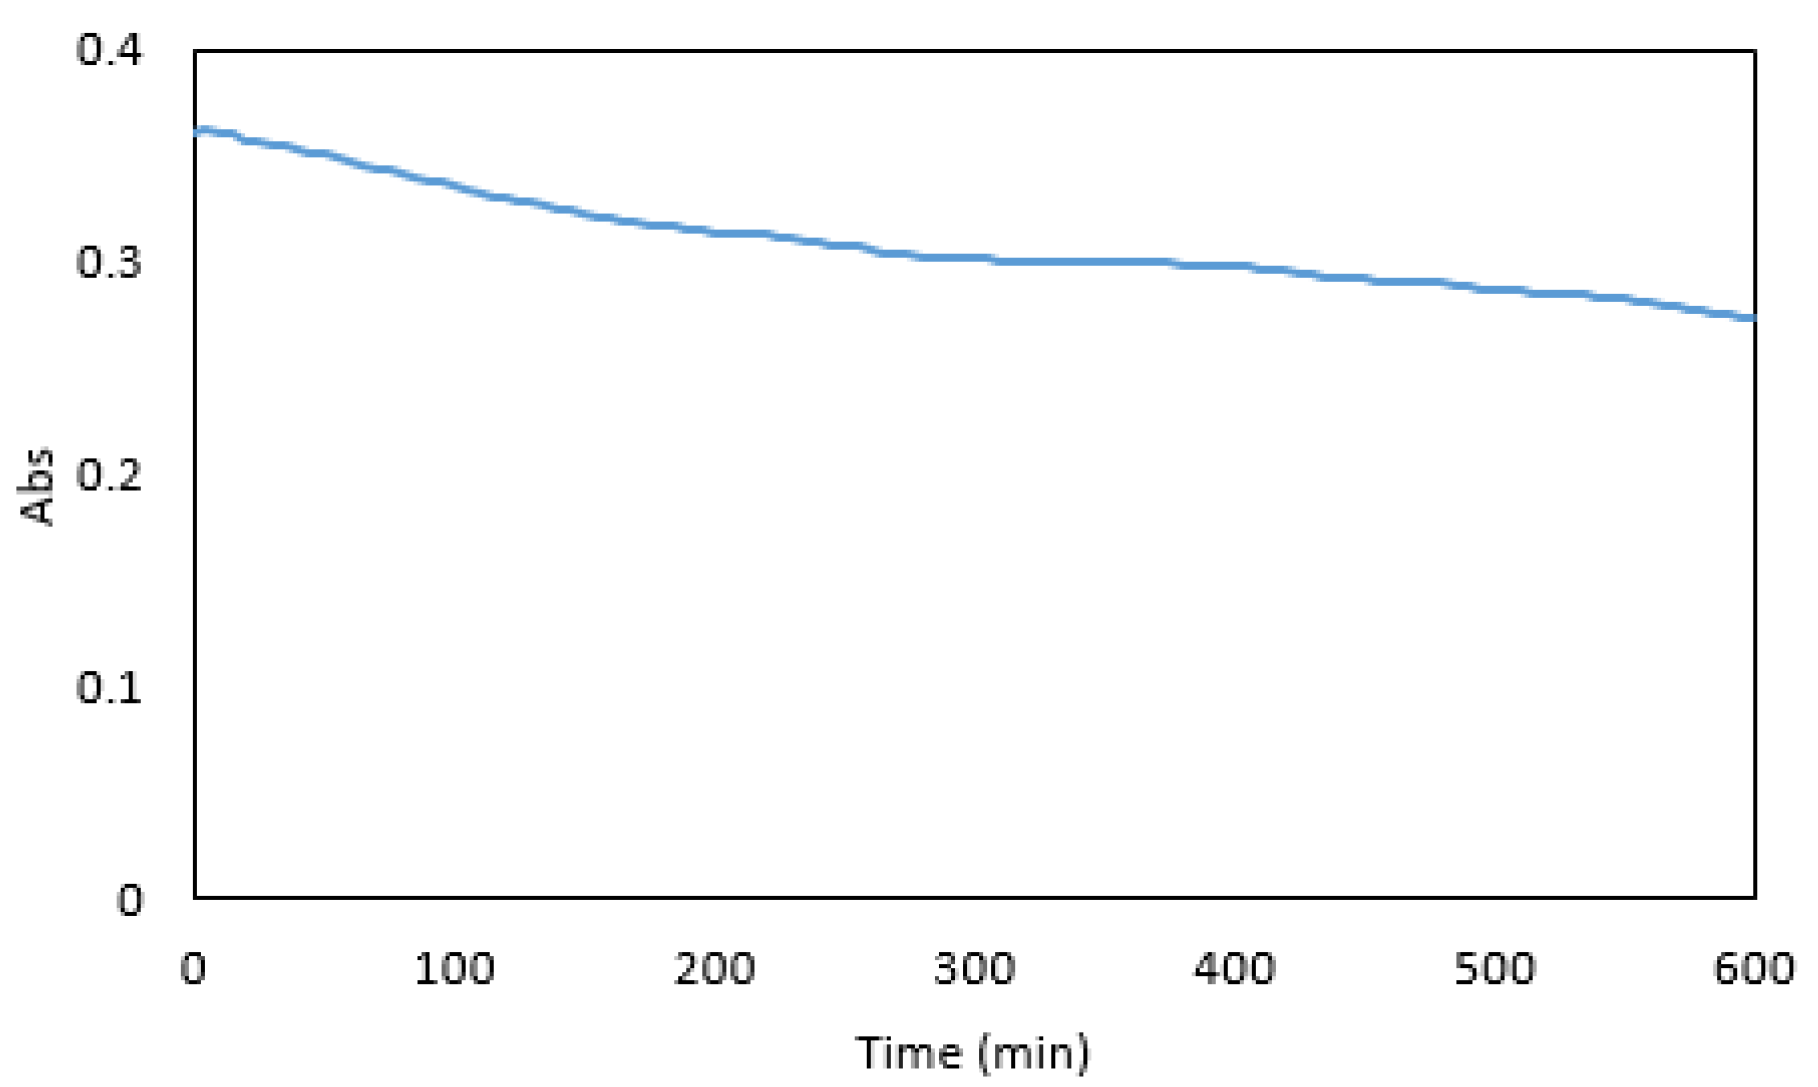
2.7. Colour Stability

1 mg·L−1 Cr VI was analysed using Shimadzu UV-Vis time scan option, the measurements were taken every 60 seconds for 600 min at 543 nm straight after addition of the reagents. The absorbance was plotted against time (min).

2.8. Interference

Fe (III), Cr (III), NO3, PO4, Mg, and Mn were introduced to 1 mg·L−1 Cr VI prepared in double deionised water prior to analysis. Tolerance limits of interfering agents were established at those concentrations that do not cause more than 5% error in the absorbance values of Cr VI at 1 mg·L−1.

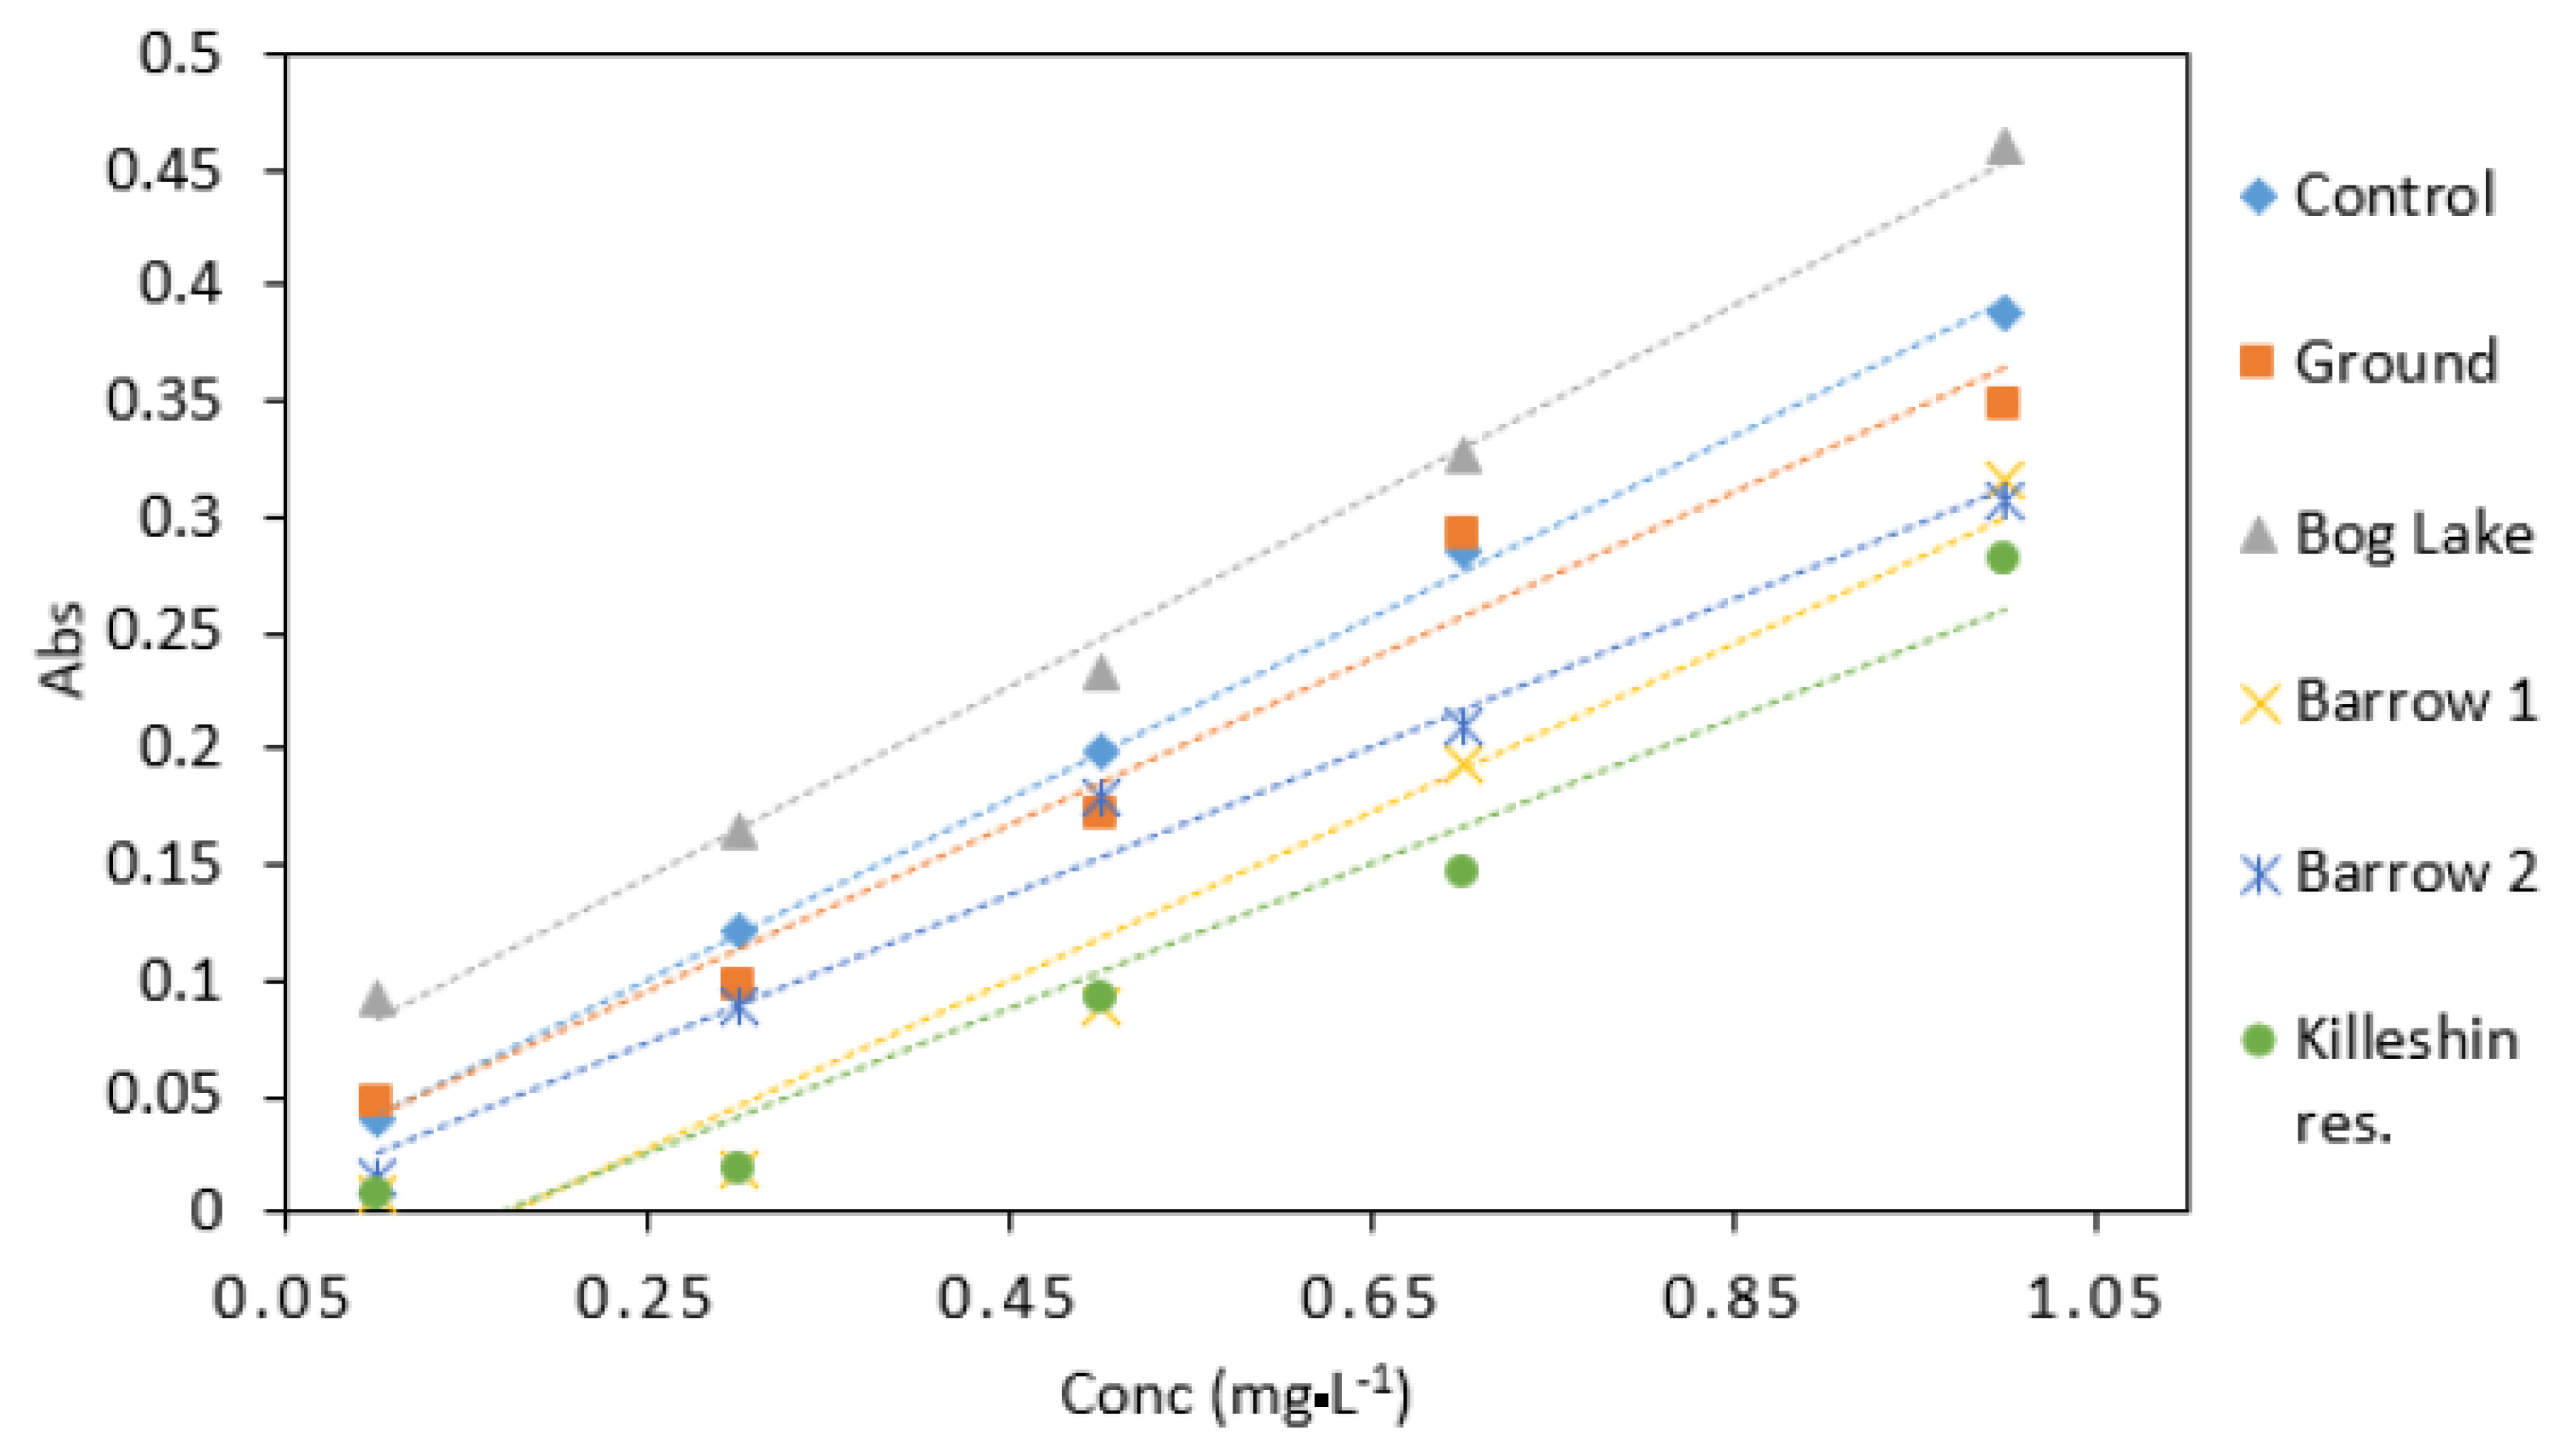
2.9. Environmental Samples

Water samples were collected from Killeshin water reservoir, Killeshin, Co. Laois, groundwater well, Co. Laois, and River Barrow at Carlow (Barrow 1) and St. Mullins, Co. Carlow (Barrow 2). All water samples were analysed in triplicate. The sample matrices were analysed using the DPC method in order to determine whether or not Cr VI was present in concentrations detectable by the method. The different water matrices were then spiked with Cr VI (0.1–1 mg·L−1) and appropriate dilutions were made. Prior to the analysis, the water samples were filtered, firstly using Whatman grade 1 filter paper and secondly with sterile 0.2 μm syringe filters. The pH of the water samples was adjusted to 2.2.

2.10. Comparison between Optimised DPC Method and ICP-MS

The optimised DPC method was compared to accredited ICP-MS, which is the gold standard method for heavy metal analysis in water. A calibration curve in a range 0.2–3 mg·L−1 was obtained using the optimised DPC method. For control purposes, a 1 mg·L−1 standard solution was analysed. The concentration of the sample was calculated from the calibration curve (y = 0.2962x − 0.0287). ICP-MS was used to analyse 1 mg·L−1 environmental water samples. The concentration for 1 mg·L−1 water samples obtained from optimised DPC method and the ICP-MS were compared. Percentage difference was calculated using formula: (Conc. ICP-MS − Conc. DPC method) × 100/Conc. ICP-MS.

3. Results

3.1. Path Length

As expected, the absorbance values and the slope for 1 mm quartz cuvette measurements were 10 times lower than those obtained from 10 mm standard cuvette measurements (Figure 2). The analytical response was strong for samples measured in microcuvettes, as can be seen from the calibration graphs (Figure 3). The good response signal and the linearity obtained from microcuvette measurements strongly indicate that the DPC method is applicable for use in microfluidic detection systems.

3.2. Sample Cell Cleaning Validation

Sample cell cleaning is important for residue removal from previous analysis that can otherwise cause low sensitivity and lack of precision. Ideally the cleaning method should be time-efficient and simple. The most effective solvent for quartz cuvette rinsing was proven to be 1% nitric acid as it removed all the stains caused by the DPC method’s colour reaction, whereas methanol was found to be the least effective (Table 2). The 1% nitric acid could be applied for rinsing sample cells in microfluidic detection systems.

3.3. Optimisation of Parameters

3.3.1. pH

The highest absorbance values were obtained at pH 2.2 (Figure 4). The analytical response pH 2.2 was found to be the optimum pH for the procedure and used in subsequent experiments.

3.3.2. Sample/Reagent Ratio

Sample/reagent ratio B gave the best response with higher absorbance values than sample/reagent ratio A (Figure 5). The slope obtained from ratio B was also higher than that of ratio A. Therefore, ratio B was chosen for use in microfluidic detection systems. Furthermore, ratio B requires a small number of separate reagents, which allows for cost efficient fabrication and a simple microfluidic design.

3.3.3. Reagent Stability

For the DPC dye stability experiment, an increase in absorbance was noted after seven days. After that, decreasing absorbance values over time were noted (Figure 6). A similar trend was observed for DPC dye and sulphuric acid reagent mixture’s stability experiment. The absorbance increased after seven to 14 days and then decreased over time (Figure 6). Furthermore, the method yielded analytically useful calibration data over the time period studied and showed good potential for application in a microfluidic analysis system. Regular calibration protocol should be implemented for correcting the change in absolute absorbance values.

3.3.4. Effect of Different Acid Concentrations

0.4 M sulphuric acid yielded the highest absorbance values and the highest slope in comparison to other acid concentrations analysed (Figure 7). The statistical analysis showed that there was a significant difference between the different acid concentrations (p < 0.05). No significant difference was found between 0.4, 0.6, and 0.8 M acid concentrations. The 0.4 M sulphuric acid was used in subsequent experiments.

3.4. Colour Stability

Maximum absorbance was reached five minutes after the addition of the dye (Figure 8). At this time the absorbance was sufficiently stable for measurements, and a five-minute reaction time was used in subsequent experiments. After 600 min, a 24% decrease in absorbance was observed. Overall, the colour stability was good and suitable for measurements in a microfluidic detection system.

3.5. Interference

From the different species investigated, Fe (III) interfered most strongly with the DPC method (Table 3). Iron interference was masked by 1% ascorbic acid. Slight interference was observed from Cr (III), Mn, Mg, and NO3. In general, Cr (III) and Mn concentrations in surface water would be expected to occur below the tolerance limit and would not pose any interference with the optimised DPC method [58]. However, the method’s effectiveness would be affected in surface waters with high magnesium and nitrate levels and should be taken into account when designing calibration protocols for detection devices [59].

3.6. Environmental Water Samples

Groundwater samples had a similar response to the control samples (Figure 9). This would indicate that groundwater samples did not contain high amount of interfering substances. The highest absorbance values were observed in samples collected from Bog Lake. The lowest absorbance was obtained from Killeshin reservoir. The difference in absorbance values could be explained by factors such as sample colour and chemical composition. Overall, different water matrices have the potential to affect the result of the DPC method. Despite the robust results shown in Table 4, this should be considered for calibration protocol development in microfluidic detection devices.

3.7. Comparison between Optimised DPC Method and ICP-MS

Evaluation of Cr VI in different water samples using ICP-MS and the optimised colorimetric DPC method showed that the Cr VI concentrations are comparable (Table 4). The largest percentage difference between ICP-MS and the optimised method was observed for the control sample as 14.6%, whereas the smallest percentage difference was found for the groundwater sample as difference of 7.5% was obtained. Therefore, it can be concluded that the optimised DPC method is effective in terms of Cr VI determination in various water matrices.

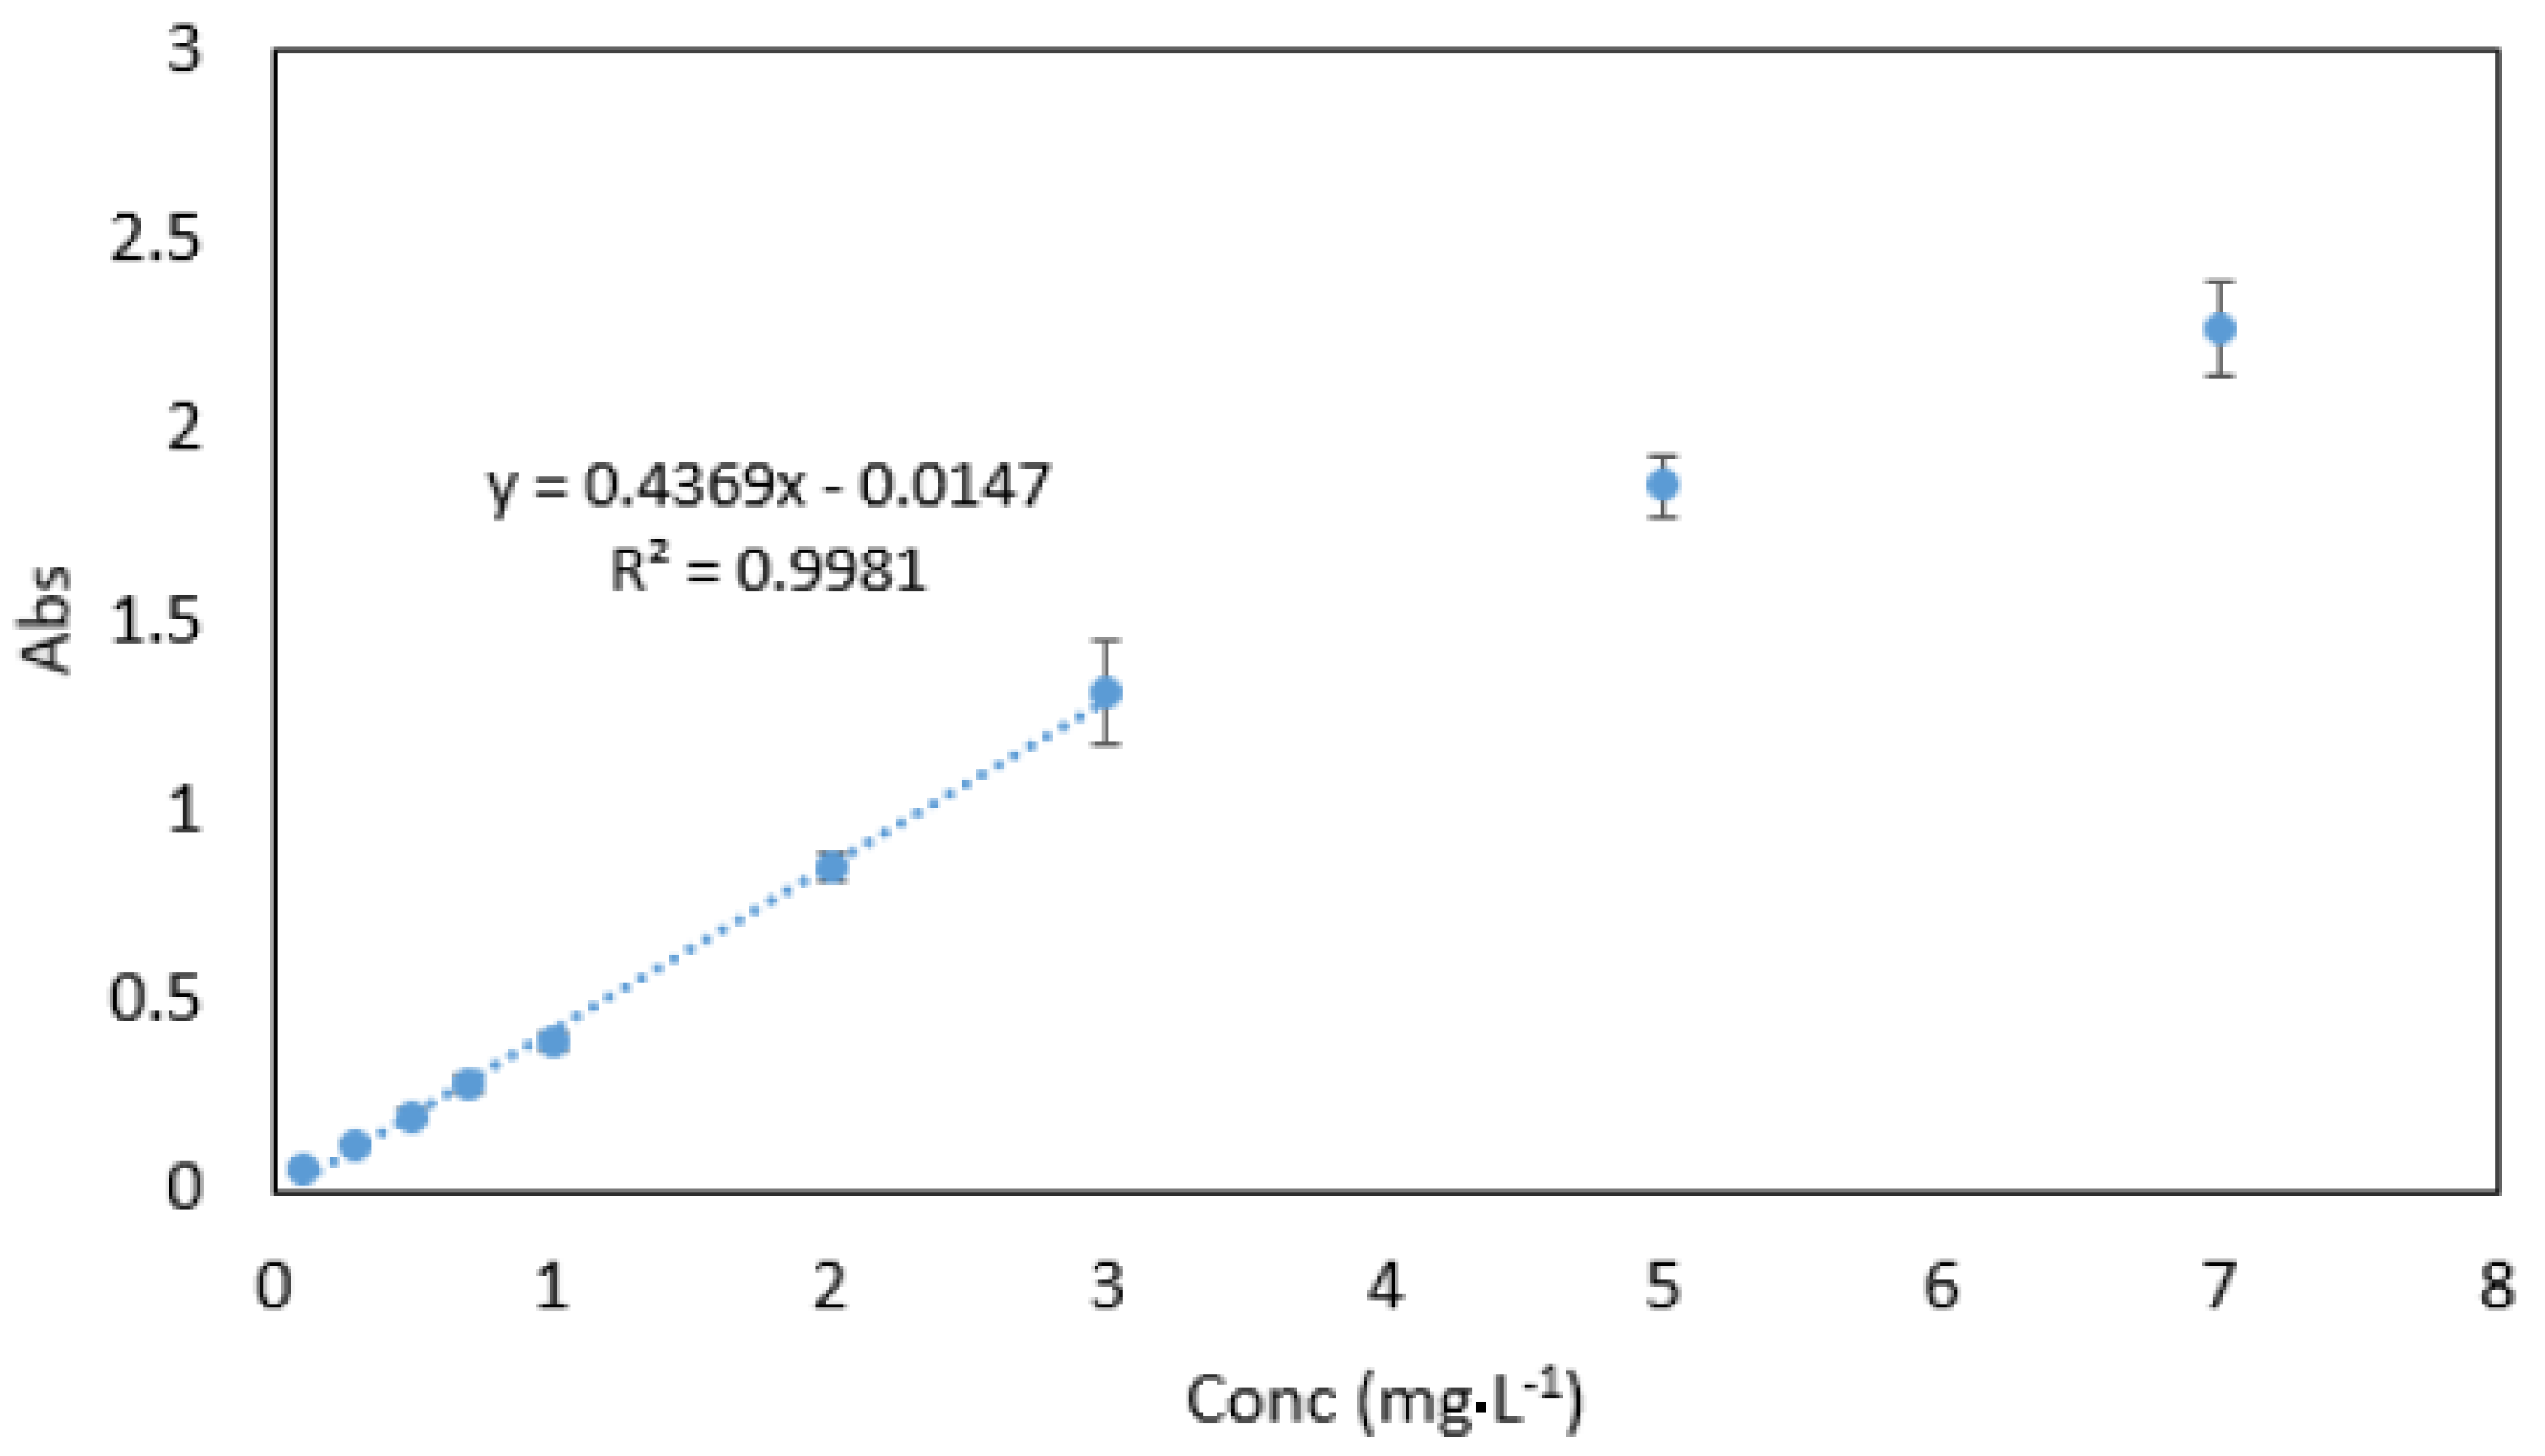
3.8. Analytical Data

Beer’s law was obeyed in the range between 0.03–3 mg·L−1 (Figure 10). The molar absorptivity coefficient was found to be 2.021 × 10⁴ mol−1·cm−1. Sandell’s sensitivity was found to be 2.574 × 10⁻³ µg·cm−2. The limit of detection (3 sdb·m−1) and the limit of quantification (10 se·m−1) (where sdb is the standard deviation of the reagent blank, and m is the slope of the calibration curve) were found to be 0.023 and 0.076 mg·L−1, respectively. Absorption spectra of 1 mg·L−1 Cr VI against reagent blank and reagent blank against double deionised water are shown in Figure 11.

4. Discussion

The results showed the optimised DPC method was more sensitive than some of the previous studies [53,55,61] (Table 5). Although the Cr VI determination method proposed by Amin et al. yielded very low detection limit [62], the ADTP reagent had to be synthesised in the laboratory prior to the analysis. One of the advantages associated with the optimised DPC method is that the reagents are commercially available. Wang et al. used gold nanoparticles to develop a method for Cr III and Cr VI determination in water with a detection limit of 0.001 mg·L−1 for Cr VI [63]. However, there are several drawbacks associated with gold nanoparticle synthesis and cost [64]. The simplicity of the method and the relatively wide linear range indicates that the proposed method is suitable for use in autonomous microfluidic detection systems and Cr VI determination in chromium-containing effluents and environmental waters.

5. Conclusions

The DPC method showed great potential for use in autonomous microfluidic detection systems for Cr VI detection in water. The method was optimised for incorporation into micro scale detection systems. The method proved to be simple, fast, and robust. Strong analytical response was obtained from 1 mm light path cuvettes, demonstrating that the method would be effective in a small-scale detection system. Furthermore, the optimised method required a small number of reagents, resulting in cost effective analysis. Strong analytical response was obtained from a simple 1:1 sample/reagent ratio. The reagent mixtures were stable for two weeks, with a gradual decrease in absorbance observed after that. Investigation of the method’s performance in different water samples and the good agreement obtained with ICP-MS measurements revealed that the method is suitable for determination of Cr VI in various water matrices. The optimised method has potential for Cr VI monitoring applications in surface and waste water using microfluidic detection systems.

Author Contributions

A.L. designed the experiments carried out the formal analysis. A.L., J.C. and D.R. interpreted the experimental data. M.B. provided technical advice and access to TE Lab facilities. J.C. and A.L. collected the water samples. A.L. prepared the original draft.

Funding

This research was funded by Irish Research Council under grant GOIPG/2016/301 and the Institute of Technology Carlow President’s Research Fellowship Programme fund.

Acknowledgments

The authors wish to acknowledge Fiachra Cunningham (TelLab, Loughmartin Business Park, Tullow, Co. Carlow R93 N529, Ireland) for his assistance with ICP–MS analysis.

Conflicts of Interest

The authors declare no conflict of interest.

References

  1. Quantin, C.; Ettler, V.; Garnier, J.; Šebek, O. Sources and extractibility of chromium and nickel in soil profiles developed on Czech serpentinites. C. R. Geosci. 2008, 340, 872–882. [Google Scholar] [CrossRef]
  2. Ashraf, A.; Bibi, I.; Niazi, N.K.; Ok, Y.S.; Murtaza, G.; Shahid, M.; Kunhikrishnan, A.; Li, D.; Mahmood, T. Chromium (VI) sorption efficiency of acid-activated banana peel over organo-montmorillonite in aqueous solutions. Int. J. Phytoremediat. 2017, 19, 605–613. [Google Scholar] [CrossRef]
  3. Sloof, R. Towards Healthier Water Resources Management. Waterlines 1990, 9, 2. [Google Scholar] [CrossRef]
  4. Kimbrough, D.E.; Cohen, Y.; Winer, A.M.; Creelman, L.; Mabuni, C. A Critical Assessment of Chromium in the Environment. Crit. Rev. Environ. Sci. Technol. 1999, 29, 1–46. [Google Scholar] [CrossRef]
  5. Richard, F.C.; Bourg, A.C.M. Aqueous geochemistry of chromium: A review. Water Res. 1991, 25, 807–816. [Google Scholar] [CrossRef]
  6. Butera, S.; Trapp, S.; Astrup, T.F.; Christensen, T.H. Soil retention of hexavalent chromium released from construction and demolition waste in a road-base-application scenario. J. Hazard. Mater. 2015, 298, 361–367. [Google Scholar] [CrossRef]
  7. Chen, X.; Liu, C.; Xu, Z.; Pan, Y.; Liu, J.; Du, L. An effective PDMS microfluidic chip for chemiluminescence detection of cobalt (II) in water. Microsyst. Technol. 2012, 19, 99–103. [Google Scholar] [CrossRef]
  8. Gao, Y.; Xia, J. Chromium Contamination Accident in China: Viewing Environment Policy of China. Environ. Sci. Technol. 2011, 45, 8605–8606. [Google Scholar] [CrossRef]
  9. WHO. Chromium in Drinking-Water. Background Document for Development of WHO Guidelines for Drinking-Water Quality; World Health Organization: Geneva, Switzerland, 1996. [Google Scholar]
  10. Sharma, D.C.; Forster, C.F. Removal of hexavalent chromium using sphagnum moss peat. Water Res. 1993, 27, 1201–1208. [Google Scholar] [CrossRef]
  11. Jin, W.; Wu, G.; Chen, A. Sensitive and selective electrochemical detection of chromium (vi) based on gold nanoparticle-decorated Titania nanotube arrays. Analyst 2014, 139, 235–241. [Google Scholar] [CrossRef]
  12. Guertin, J.; Jacobs, J.A.; Avakian, C.P. Chromium (VI) Handbook, 1st ed.; CRC Press: Boca Raton, FL, USA, 2005; p. 784. [Google Scholar]
  13. McNeill, L.S.; McLean, J.E.; Parks, J.L.; Edwards, M.A. Hexavalent chromium review, part 2: Chemistry, occurrence, and treatment. J. Am. Water Works Assoc. 2012, 104, E395–E405. [Google Scholar] [CrossRef]
  14. Owlad, M.; Aroua, M.K.; Daud, W.A.W.; Baroutian, S. Removal of Hexavalent Chromium-Contaminated Water and Wastewater: A Review. Water Air Soil Pollut. 2008, 200, 59–77. [Google Scholar] [CrossRef]
  15. Cespón-Romero, R.M.; Yebra-Biurrun, M.C.; Bermejo-Barrera, M.P. Preconcentration and speciation of chromium by the determination of total chromium and chromium (III) in natural waters by flame atomic absorption spectrometry with a chelating ion-exchange flow injection system. Anal. Chim. Acta 1996, 327, 37–45. [Google Scholar] [CrossRef]
  16. Martone, N.; Rahman, G.M.M.; Pamuku, M.; Kingston, H.M.S. Determination of Chromium Species in Dietary Supplements Using Speciated Isotope Dilution Mass Spectrometry with Mass Balance. J. Agric. Food Chem. 2013, 61, 9966–9976. [Google Scholar] [CrossRef]
  17. Kim, J.; Seo, S.; Kim, Y.; Kim, D.H. Review of carcinogenicity of hexavalent chrome and proposal of revising approval standards for an occupational cancers in Korea. Ann. Occup. Environ. Med. 2018, 30, 7. [Google Scholar] [CrossRef] [Green Version]
  18. Shahid, M.; Shamshad, S.; Rafiq, M.; Khalid, S.; Bibi, S.I.; Niazi, S.N.K.; Dumat, C.; Rashid, M.I. Chromium speciation, bioavailability, uptake, toxicity and detoxification in soil-plant system: A review. Chemosphere 2017, 178, 513–533. [Google Scholar] [CrossRef] [PubMed]
  19. Achmad, R.; Budiawan, B.; Auerkari, E. Effects of Chromium on Human Body. Annu. Res. Rev. Biol. 2017, 13, 1–8. [Google Scholar] [CrossRef]
  20. Gray, D.J. Naturally occurring Cr6+in shallow groundwaters of the Yilgarn Craton, Western Australia. Geochem. Explor. Environ. Anal. 2003, 3, 359–368. [Google Scholar] [CrossRef]
  21. Becquer, T.; Quantin, C.; Sicot, M.; Boudot, J. Chromium availability in ultramafic soils from New Caledonia. Sci. Total Environ. 2003, 301, 251–261. [Google Scholar] [CrossRef]
  22. Beaumont, J.J.; Sedman, R.M.; Reynolds, S.D.; Sherman, C.D.; Li, L.H.; Howd, R.A.; Sandy, M.S.; Zeise, L.; Alexeeff, G.V. Cancer mortality in a Chinese population exposed to hexavalent chromium in drinking water. Epidemiology 2008, 19, 12–23. [Google Scholar] [CrossRef]
  23. Fantoni, D.; Brozzo, G.; Canepa, M.; Cipolli, F.; Marini, L.; Ottonello, G.; Zuccolini, M. Natural hexavalent chromium in groundwaters interacting with ophiolitic rocks. Environ. Geol. 2002, 42, 871–882. [Google Scholar] [CrossRef]
  24. Pellerin, C.; Booker, S.M. Reflections on hexavalent chromium: Health hazards of an industrial heavyweight. Environ. Health Perspect. 2000, 108, 402–407. [Google Scholar] [CrossRef]
  25. Singh, R.K.; Sengupta, B.; Bali, R.; Shukla, B.P.; Gurunadharao, V.V.S.; Srivatstava, R. Identification and mapping of chromium (VI) plume in groundwater for remediation: A case study at Kanpur, Uttar Pradesh. J. Geol. Soc. India 2009, 74, 49–57. [Google Scholar] [CrossRef]
  26. Armienta, M.A.; Morton, O.; Rodríguez, R.; Cruz, O.; Aguayo, A.; Ceniceros, N. Chromium in a Tannery Wastewater Irrigated Area, León Valley, Mexico. Bull. Environ. Contam. Toxicol. 2001, 66, 189–195. [Google Scholar] [CrossRef]
  27. Ressalan, S.; Chauhan, R.S.; Goswami, A.K.; Purohit, D.N. Review of Spectrophotometric Methods for Determination of Chromium. Rev. Anal. Chem. 1997, 16, 69–171. [Google Scholar] [CrossRef]
  28. Parks, J.L.; McNeill, L.; Frey, M.; Eaton, A.D.; Haghani, A.; Ramirez, L.; Edwards, M. Determination of total chromium in environmental water samples. Water Res. 2004, 38, 2827–2838. [Google Scholar] [CrossRef] [PubMed]
  29. Izbicki, J.A.; Ball, J.W.; Bullen, T.D.; Sutley, S.J. Chromium, chromium isotopes and selected trace elements, western Mojave Desert, USA. Appl. Geochem. 2008, 23, 1325–1352. [Google Scholar] [CrossRef]
  30. Dong, C.; Wu, G.; Wang, Z.; Ren, W.; Zhang, Y.; Shen, Z.; Li, T.; Wu, A. Selective colorimetric detection of Cr(iii) and Cr(vi) using gallic acid capped gold nanoparticles. Dalton Trans. 2016, 45, 8347–8354. [Google Scholar] [CrossRef]
  31. Li, H.-F.; Lin, J.-M. Applications of microfluidic systems in environmental analysis. Anal. Bioanal. Chem. 2008, 393, 555–567. [Google Scholar] [CrossRef]
  32. Cogan, D.; Fay, C.; Boyle, D.; Osborne, C.; Kent, N.; Cleary, J.; Diamond, D. Development of a low cost microfluidic sensor for the direct determination of nitrate using chromotropic acid in natural waters. Anal. Methods 2015, 7, 5396–5405. [Google Scholar] [CrossRef]
  33. Milani, A.; Statham, P.J.; Mowlem, M.C.; Connelly, D.P. Development and application of a microfluidic in-situ analyzer for dissolved Fe and Mn in natural waters. Talanta 2015, 136, 15–22. [Google Scholar] [CrossRef]
  34. Liu, Y.; Wang, X. Colorimetric speciation of Cr (III) and Cr (VI) with a gold nanoparticle probe. Anal. Methods 2013, 5, 1442. [Google Scholar] [CrossRef]
  35. Provin, C.; Fukuba, T.; Okamura, K.; Fujii, T. An integrated microfluidic system for manganese anomaly detection based on chemiluminescence: Description and practical use to discover hydrothermal plumes near the Okinawa Trough. IEEE J. Ocean. Eng. 2013, 38, 178–185. [Google Scholar] [CrossRef]
  36. Nie, Z.; Nijhuis, C.A.; Gong, J.; Chen, X.; Kumachev, A.; Martinez, A.W.; Narovlyansky, M.; Whitesides, G.M. Electrochemical sensing in paper-based microfluidic devices. Lab Chip 2010, 10, 477–483. [Google Scholar] [CrossRef]
  37. Nguyen, T.; Zoëga Andreasen, S.; Wolff, A.; Duong Bang, D. From Lab on a Chip to Point of Care Devices: The Role of Open Source Microcontrollers. Micromachines 2018, 9, 403. [Google Scholar] [CrossRef]
  38. Cleary, J.; Maher, D.; Diamond, D. Development and Deployment of a Microfluidic Platform for Water Quality Monitoring. Smart Sen. Real-Time Water Qual. Monit. 2013, 4, 125–148. [Google Scholar] [CrossRef] [Green Version]
  39. Ravishankar, T.N.; Muralikrishna, S.; Suresh kumar, K.; Nagaraju, G.; Ramakrishnappa, T. Electrochemical detection and photochemical detoxification of hexavalent chromium (Cr(vi)) by Ag doped TiO2 nanoparticles. Anal. Methods 2015, 7, 3493–3499. [Google Scholar] [CrossRef]
  40. Tu, J.; Gan, Y.; Liang, T.; Wan, H.; Wang, P. A miniaturized electrochemical system for high sensitive determination of chromium(VI) by screen-printed carbon electrode with gold nanoparticles modification. Sens. Actuators B Chem. 2018, 272, 582–588. [Google Scholar] [CrossRef]
  41. Sari, T.K.; Takahashi, F.; Jin, J.; Zein, R.; Munaf, E. Electrochemical Determination of Chromium(VI) in River Water with Gold Nanoparticles–Graphene Nanocomposites Modified Electrodes. Anal. Sci. 2018, 34, 155–160. [Google Scholar] [CrossRef] [Green Version]
  42. Xing, S.; Xu, H.; Chen, J.; Shi, G.; Jin, L. Nafion stabilized silver nanoparticles modified electrode and its application to Cr(VI) detection. J. Electroanal. Chem. 2011, 652, 60–65. [Google Scholar] [CrossRef]
  43. Khanfar, M.; Al-Faqheri, W.; Al-Halhouli, A. Low Cost Lab on Chip for the Colorimetric Detection of Nitrate in Mineral Water Products. Sensors 2017, 17, 2345. [Google Scholar] [CrossRef]
  44. Li, Y.; Xue, H. Determination of Cr(III) and Cr(VI) species in natural waters by catalytic cathodic stripping voltammetry. Anal. Chim. Acta 2001, 448, 121–134. [Google Scholar] [CrossRef]
  45. Chailapakul, O.; Korsrisakul, S.; Siangproh, W.; Grudpan, K. Fast and simultaneous detection of heavy metals using a simple and reliable microchip-electrochemistry route: An alternative approach to food analysis. Talanta 2008, 74, 683–689. [Google Scholar] [CrossRef]
  46. Baker, C.A.; Duong, C.T.; Grimley, A.; Roper, M.G. Recent advances in microfluidic detection systems. Bioanalysis 2009, 1, 967–975. [Google Scholar] [CrossRef] [Green Version]
  47. Chen, T.; Chang, Q.; Liu, J.; Clevers, J.G.P.W.; Kooistra, L. Identification of soil heavy metal sources and improvement in spatial mapping based on soil spectral information: A case study in northwest China. Sci. Total Environ. 2016, 565, 155–164. [Google Scholar] [CrossRef] [PubMed]
  48. Abi Kaed Bey, S.K.; Connelly, D.P.; Legiret, F.-E.; Harris, A.J.K.; Mowlem, M.C. A high-resolution analyser for the measurement of ammonium in oligotrophic seawater. Ocean Dyn. 2011, 61, 1555–1565. [Google Scholar] [CrossRef]
  49. Yu, Y.; Lin, L.-R.; Yang, K.-B.; Zhong, X.; Huang, R.-B.; Zheng, L.-S. p-Dimethylaminobenzaldehyde thiosemicarbazone: A simple novel selective and sensitive fluorescent sensor for Mercury(II) in aqueous solution. Talanta 2006, 69, 103–106. [Google Scholar] [CrossRef] [PubMed]
  50. Yogarajah, N.; Tsai, S.S.H. Detection of trace arsenic in drinking water: Challenges and opportunities for microfluidics. Environ. Sci. Water Res. Technol. 2015, 1, 426–447. [Google Scholar] [CrossRef]
  51. Martinez, A.W.; Phillips, S.T.; Butte, M.J.; Whitesides, G.M. Patterned paper as a platform for inexpensive, low-volume, portable bioassays. Angew. Chem. Int. Ed. 2007, 46, 1318–1320. [Google Scholar] [CrossRef] [PubMed]
  52. Lin, Y.; Gritsenko, D.; Feng, S.; Teh, Y.C.; Lu, X.; Xu, J. Detection of heavy metal by paper-based microfluidics. Biosens. Bioelectron. 2016, 83, 256–266. [Google Scholar] [CrossRef]
  53. Asano, H.; Shiraishi, Y. Development of paper-based microfluidic analytical device for iron assay using photomask printed with 3D printer for fabrication of hydrophilic and hydrophobic zones on paper by photolithography. Anal. Chim. Acta 2015, 883, 55–60. [Google Scholar] [CrossRef] [PubMed]
  54. Idros, N.; Chu, D. Triple-Indicator-Based Multidimensional Colorimetric Sensing Platform for Heavy Metal Ion Detections. ACS Sens. 2018, 3, 1756–1764. [Google Scholar] [CrossRef] [PubMed]
  55. Sun, X.; Li, B.; Qi, A.; Tian, C.; Han, J.; Shi, Y.; Chen, L. Improved assessment of accuracy and performance using a rotational paper-based device for multiplexed detection of heavy metals. Talanta 2018, 178, 426–431. [Google Scholar] [CrossRef]
  56. Li, J.; Wei, H.; Guo, S.; Wang, E. Selective, peroxidase substrate based “signal-on” colorimetric assay for the detection of chromium (VI). Anal. Chim. Acta 2008, 630, 181–185. [Google Scholar] [CrossRef]
  57. Sunil, A.; Rao, S.J. Photometric and fluorimetric determination of chromium(VI) using metal-oxo mediated reaction of 1-(2-hydroxyphenyl)thiourea in micellar medium. J. Anal. Chem. 2015, 70, 159–165. [Google Scholar] [CrossRef]
  58. Revanasiddappa, H.D.; Kumar, T.N.K. Spectrophotometric determination of trace amounts of chromium with citrazinic acid. J. of Anal. Chem. 2001, 56, 1084–1088. [Google Scholar] [CrossRef]
  59. Sreevani, I.; Reddy, P.R.; Reddy, V.K. A rapid and simple spectrophotometric determination of traces of chromium (VI) in waste water samples and in soil samples by using 2-hydroxy, 3-methoxy benzaldehyde thiosemicarbazone (HMBATSC). J. Appl. Phys. 2013, 3, 40–45. [Google Scholar] [CrossRef]
  60. Onchoke, K.K.; Sasu, S.A. Determination of Hexavalent Chromium (Cr(VI)) Concentrations via Ion Chromatography and UV-Vis Spectrophotometry in Samples Collected from Nacogdoches Wastewater Treatment Plant, East Texas (USA). Adv. Environ. Chem. 2016, 2016, 3468635. [Google Scholar] [CrossRef]
  61. Wurster, S.; Kratz, E.; Lachenmeier, D.W.; Mildau, G. Spectrophotometric Quantification of Toxicologically Relevant Concentrations of Chromium(VI) in Cosmetic Pigments and Eyeshadow Using Synthetic Lachrymal Fluid Extraction. Int. J. Spectr. 2012, 2012, 985131. [Google Scholar] [CrossRef]
  62. Amin, A.S.; El-Sheikh, R.; Shaltout, M.I. Utilization of 2-Amino-6-(1,3-thiazol-2yldiazenyl)phenol for Chromium Speciation in Environmental Samples Spectrophotometrically. Can. Chem. Trans. 2015, 3, 171–183. [Google Scholar] [CrossRef]
  63. Wang, X.; Wei, Y.; Wang, S.; Chen, L. Red-to-blue colorimetric detection of chromium via Cr (III)-citrate chelating based on Tween 20-stabilized gold nanoparticles. Colloids Surf. A Physicochem. Eng. Asp. 2015, 472, 57–62. [Google Scholar] [CrossRef] [Green Version]
  64. Eustis, S.; El-Sayed, M.A. Why gold nanoparticles are more precious than pretty gold: Noble metal surface plasmon resonance and its enhancement of the radiative and nonradiative properties of nanocrystals of different shapes. Chem. Soc. Rev. 2006, 35, 209–217. [Google Scholar] [CrossRef] [PubMed]
Figure 1. (A) Conventional method analysis incorporating multiple steps for Cr VI analysis, (B) microfluidic detection-based analysis using modified 1,5-diphenylcarbazide method for Cr VI detection.
Ijerph 16 01803 g001
Figure 2. Absorption spectra of a sample containing 1 mg·L−1 Cr VI with reagents measured in 10 mm cuvettes (A) and 1 mm quartz cuvettes (B) against reagent blank.
Ijerph 16 01803 g002
Figure 3. Comparison of Cr VI standards (0.1–1 mg·L−1) measured in quartz cuvettes with 10 mm and 1 mm path lengths. All measurements were carried out in triplicate (n = 3).
Ijerph 16 01803 g003
Figure 4. Comparison of Cr VI (0.1–1 mg·L−1) analysed at various pH conditions (pH 1.5, 1.8, 2.0, 2.2, 2.4, 2.8). All measurements were carried out in triplicate (n = 3).
Ijerph 16 01803 g004
Figure 5. A comparison of Cr VI (0.1–1 mg·L−1) analysed using two sample/reagent ratios: (A), 2 (Cr): 2 (0.4 M sulphuric acid): 2 (DPC) and (B), 2 (Cr): 2 (0.4 M sulphuric acid and DPC mix). All measurements were carried out in triplicate (n = 3).
Ijerph 16 01803 g005
Figure 6. (A) Stability of 1,5-diphenylcarbazide (DPC) dye in Cr VI (0.1–1 mg·L−1) analysed periodically over day 0, 7, 14, 21 and 28. All measurements were carried out in triplicate (n = 3); (B) stability of sulphuric acid and DPC dye mixture in Cr VI (0.1–1 mg·L−1) analysed periodically over day 1, 7, 14, 21 and 28. All measurements were carried out in triplicate (n = 3).
Ijerph 16 01803 g006
Figure 7. A comparison of Cr VI (0.1–1 mg·L−1) analysed with various sulphuric acid concentrations (0.025, 0.05, 0.1, 0.2, 0.4, 0.6, 0.8 and 1 M). All measurements were carried out in triplicate (n = 3).
Ijerph 16 01803 g007
Figure 8. Absorbance of 1 mg·L−1 Cr VI premixed with the reagents over 600 min.
Ijerph 16 01803 g008
Figure 9. Comparison of Cr VI (0.1–1 mg·L−1) analysed in several water matrices. All measurements were carried out in triplicate (n = 3).
Ijerph 16 01803 g009
Figure 10. Calibration curve for Cr VI ranging between 0.03–7 mg·L−1. All measurements were carried out in triplicate (n = 3).
Ijerph 16 01803 g010
Figure 11. Absorption spectra of coloured species (1 mg·L−1 chromium) versus reagent blank (A) and reagent blank versus double deionised water (B).
Ijerph 16 01803 g011
Table 1. Ion-coupled plasma mass spectrometer (ICP-MS) settings.
Instrumental ParametersScanning Parameters
Plasma flow: 15 L·min−1Scanning mode: Peak hopping
Auxiliary flow: 1.55 L·min−1Number of replicates: 3
Nebuliser flow: 0.9 L·min−1Pump rate: 9 rpm
Sheath gas flow: 0.2 L·min−1Rinse time: 40 s
Sampling depth: 6.5·mmSample uptake delay: 50 s
Power: 1.4 kWInternal standards: Li6, Sc45, Y89, Tb159, Ho165, Th232
Table 2. A comparison between absorbance values of quartz cuvettes rinsed with different solvents.
SolventAbsAbsAbsAverageSD% RSD
Water0.0120.0180.0140.0150.00320.830
1% HCl0.0410.0170.0810.0460.03269.780
1% HNO30.0040.0030.0010.0030.00257.282
Methanol0.0880.1010.1050.0980.0099.070
Acetonitrile0.0210.0220.0330.0250.00726.283
Acetone0.0850.0810.0860.0840.0033.150
Tween 200.0130.0120.0070.0110.00330.136
1% H2SO40.0060.0050.0060.0060.00110.189
Control0.0020.0010.0020.0020.00134.641
Table 3. Effect of foreign species on the determination of Cr (VI) (1 mg·L−1).
InterferentsTolerance Limit (mg·L−1)
Fe (III)1
Cr (III), Mn, Mg, NO310
PO4100
Table 4. A comparison between Cr VI concentrations calculated using the optimised DPC method and measurements obtained from an accredited ICP-MS.
SampleICP-MS Unspiked Sample (mg·L−1)ICP-MS (mg·L−1)DPC Method (mg·L−1)Percentage Difference (%)
Control0.0000.8831.01214.607
Ground0.0020.9301.0007.544
Killeshin res.0.0020.9591.06310.805
St Mullins0.0010.9871.10111.595
Bog Lake0.0011.0600.9609.467
Barrow0.0020.9071.02413.249
Table 5. Comparison of spectrophotometric methods of the Cr VI determination.
Detection Principleʎmax (nm)LOD (mg·L−1)Linear Range (mg·L−1)Reference
µPDAs 4530.0410.041–0.07254
µPDAs 53030.00040.000–400.00053
Rotational µPDAs4450.1800.500–10.00055
Gold nanoparticles5200.0010.010–0.13063
Spectrophotometric 5030.0300.010–0.40062
Spectrophotometric 3850.0140.260–26.00059
Spectrophotometric 5430.0230.030–3.000This study

