A Systematic Measurement of Street Quality through Multi-Sourced Urban Data: A Human-Oriented Analysis


Abstract
:1. Introduction
1.1. Quality-Focused Studies on the Built Environment
1.2. Streets as a Key Element of the Built Environment
1.3. Challenges and Opportunities for Street Quality Measurement with the Help of New Urban Data
2. Literature Review
2.1. Attractive Built Environments: 3Ds and 5Ds
2.2. Conceptual Framework: Measuring Human-Oriented Street Quality as the Combination of the 5Ds
- Use of the 5Ds framework discussed above, considering the distinctive physical and cultural features of the Asian cities context. This study strives to re-integrate these five variables and examine them in the Shanghai context with the primary objective of providing a comprehensive evaluation framework.
- Use higher data resolution to measure street quality and their relation to physical activities from people’s daily behaviors, portraying a more human-oriented approach.
- Considering that intersection density cannot fully describe street layout configuration and the relationship between part and whole for pedestrian and the serial view experience of the pedestrian, this paper uses a description of street layout and network science to present a more realistic pedestrian path choice routing analysis.
3. Materials and Methods
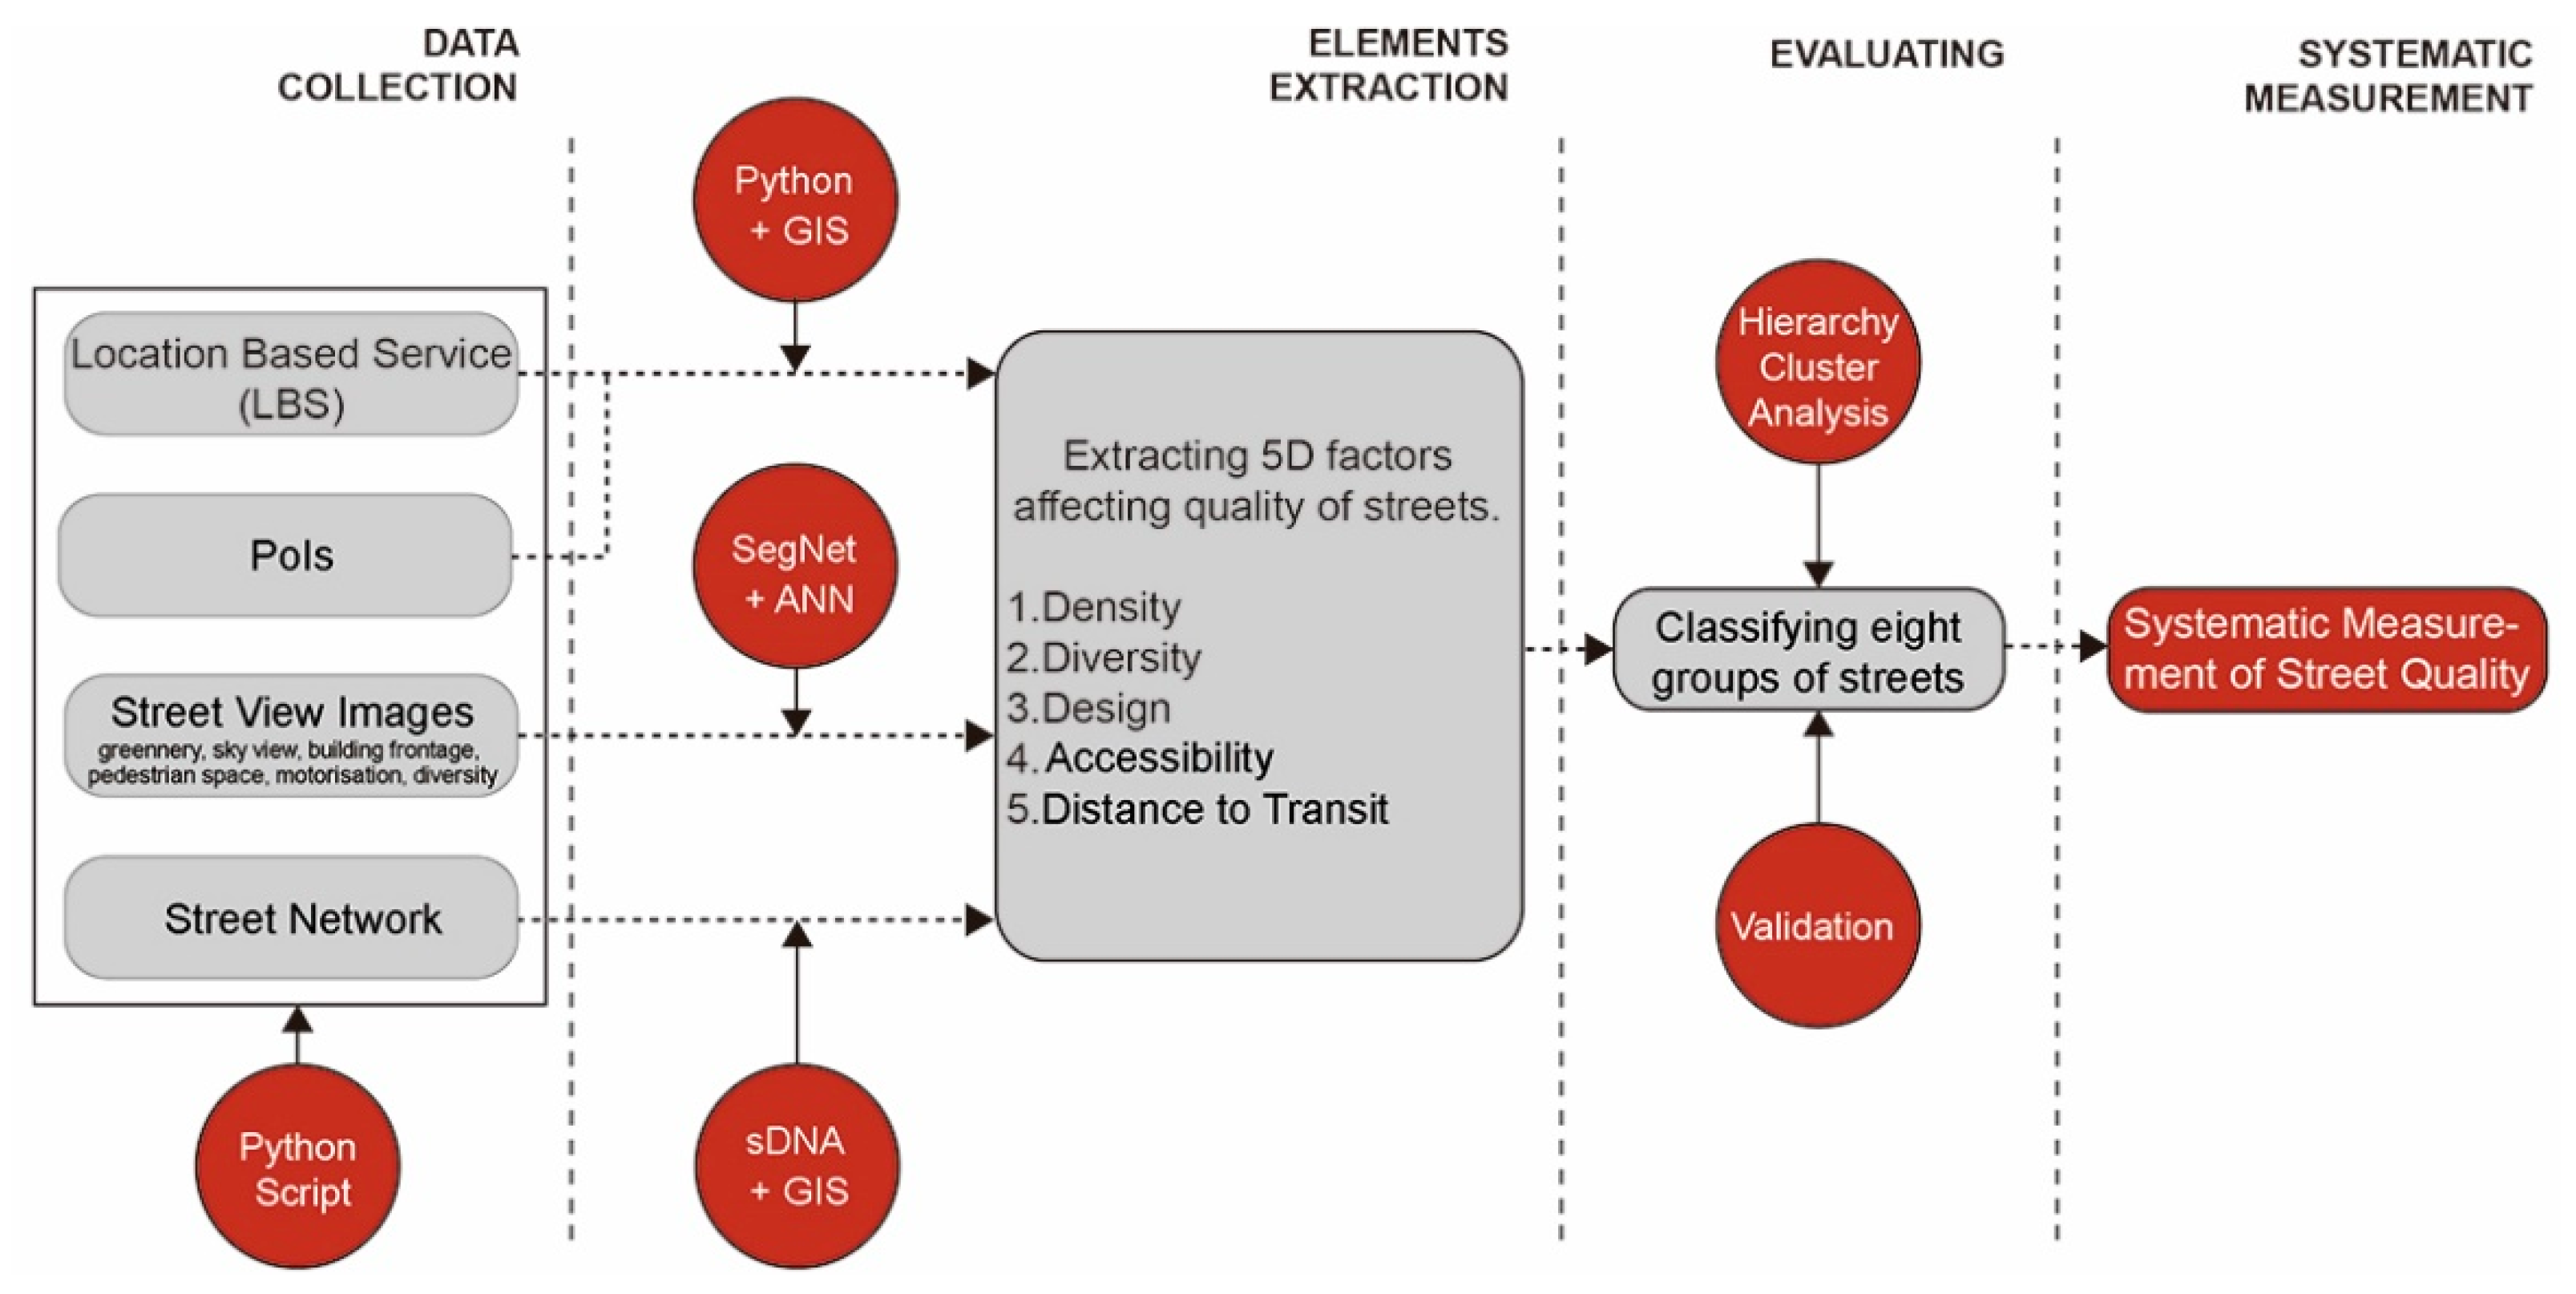
3.1. Analytical Framework
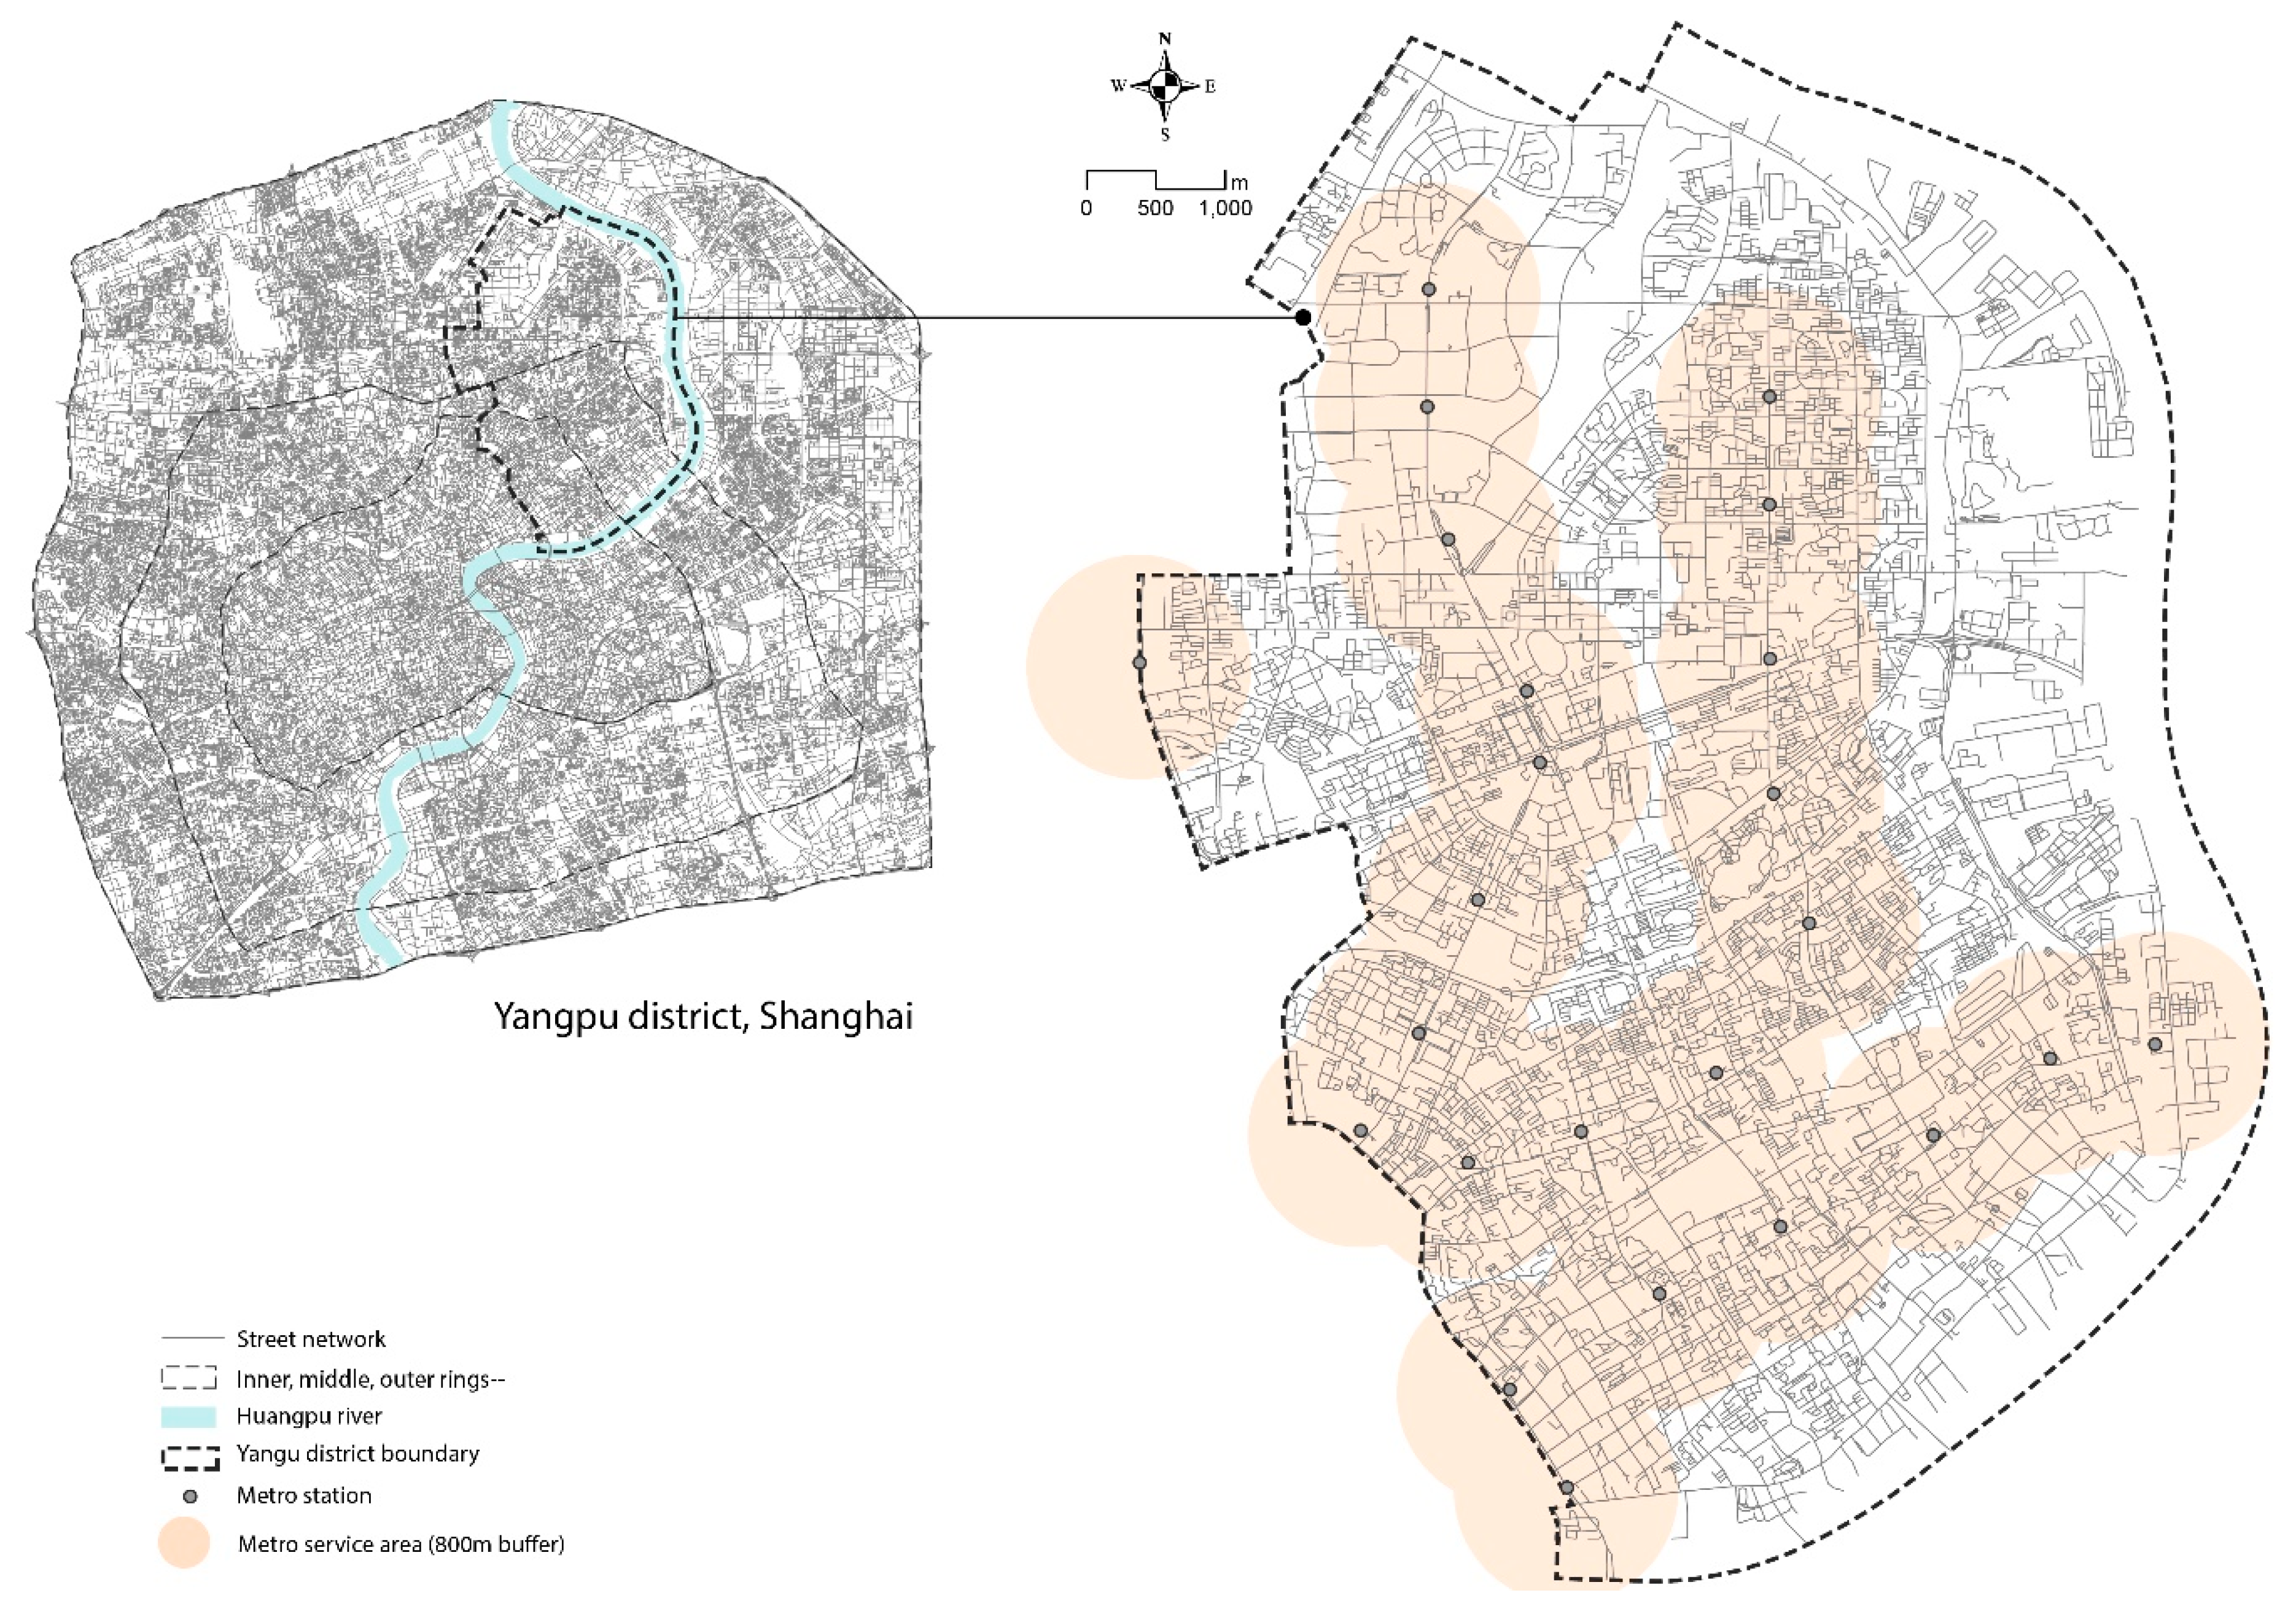
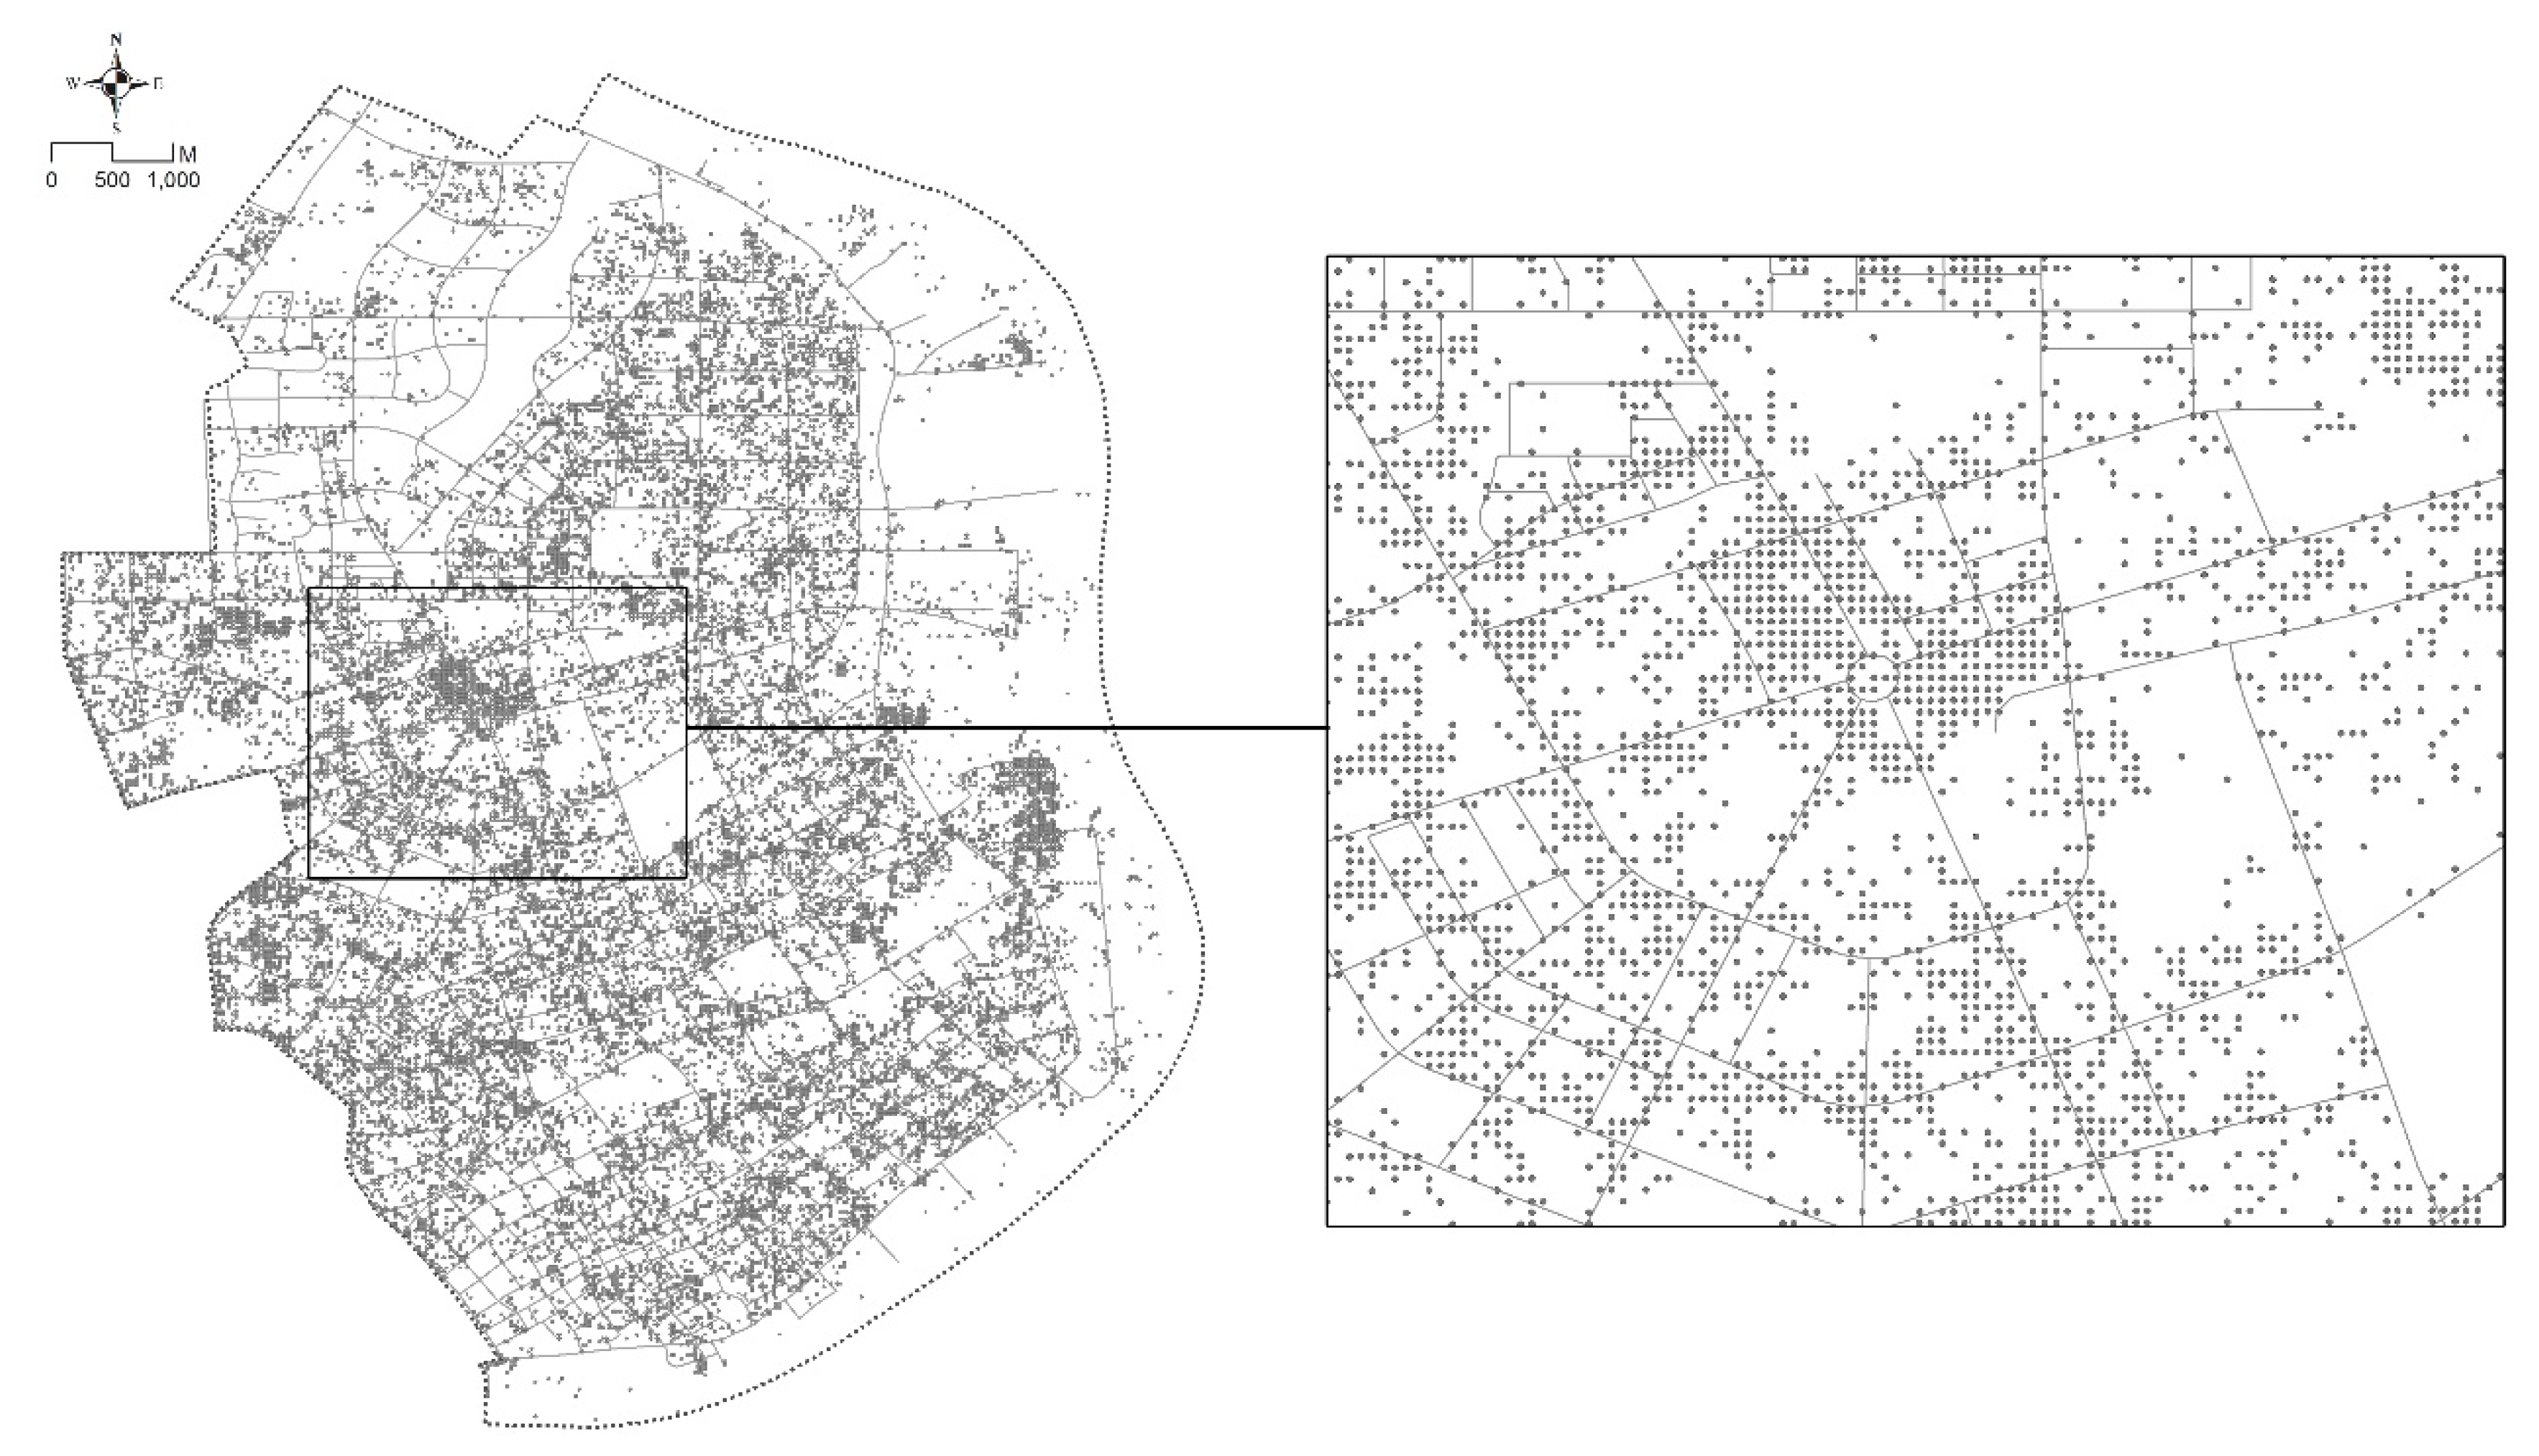
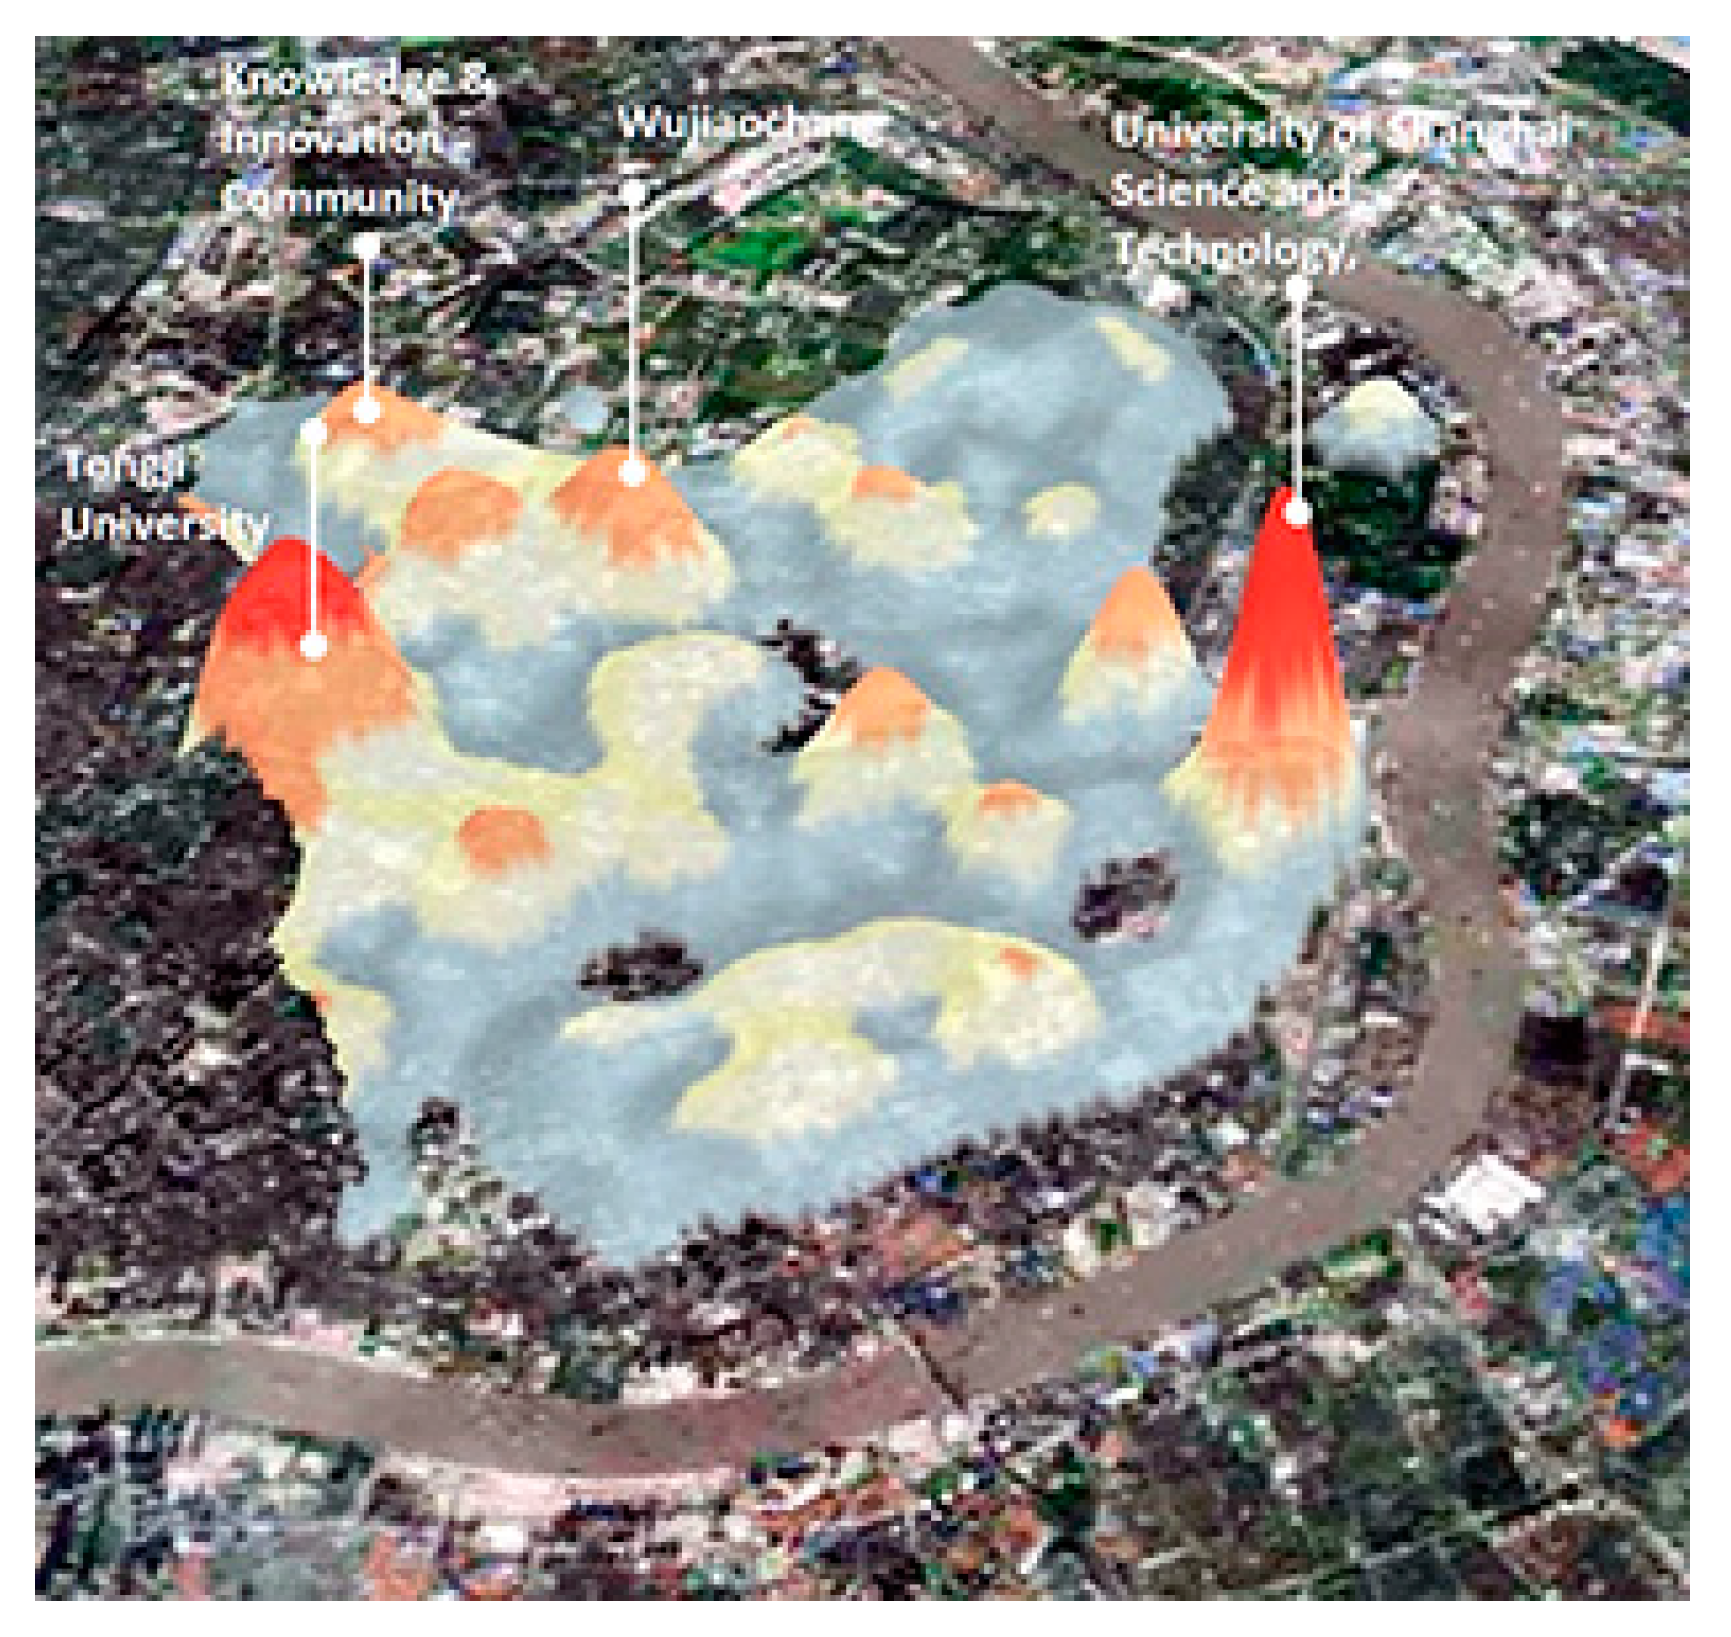
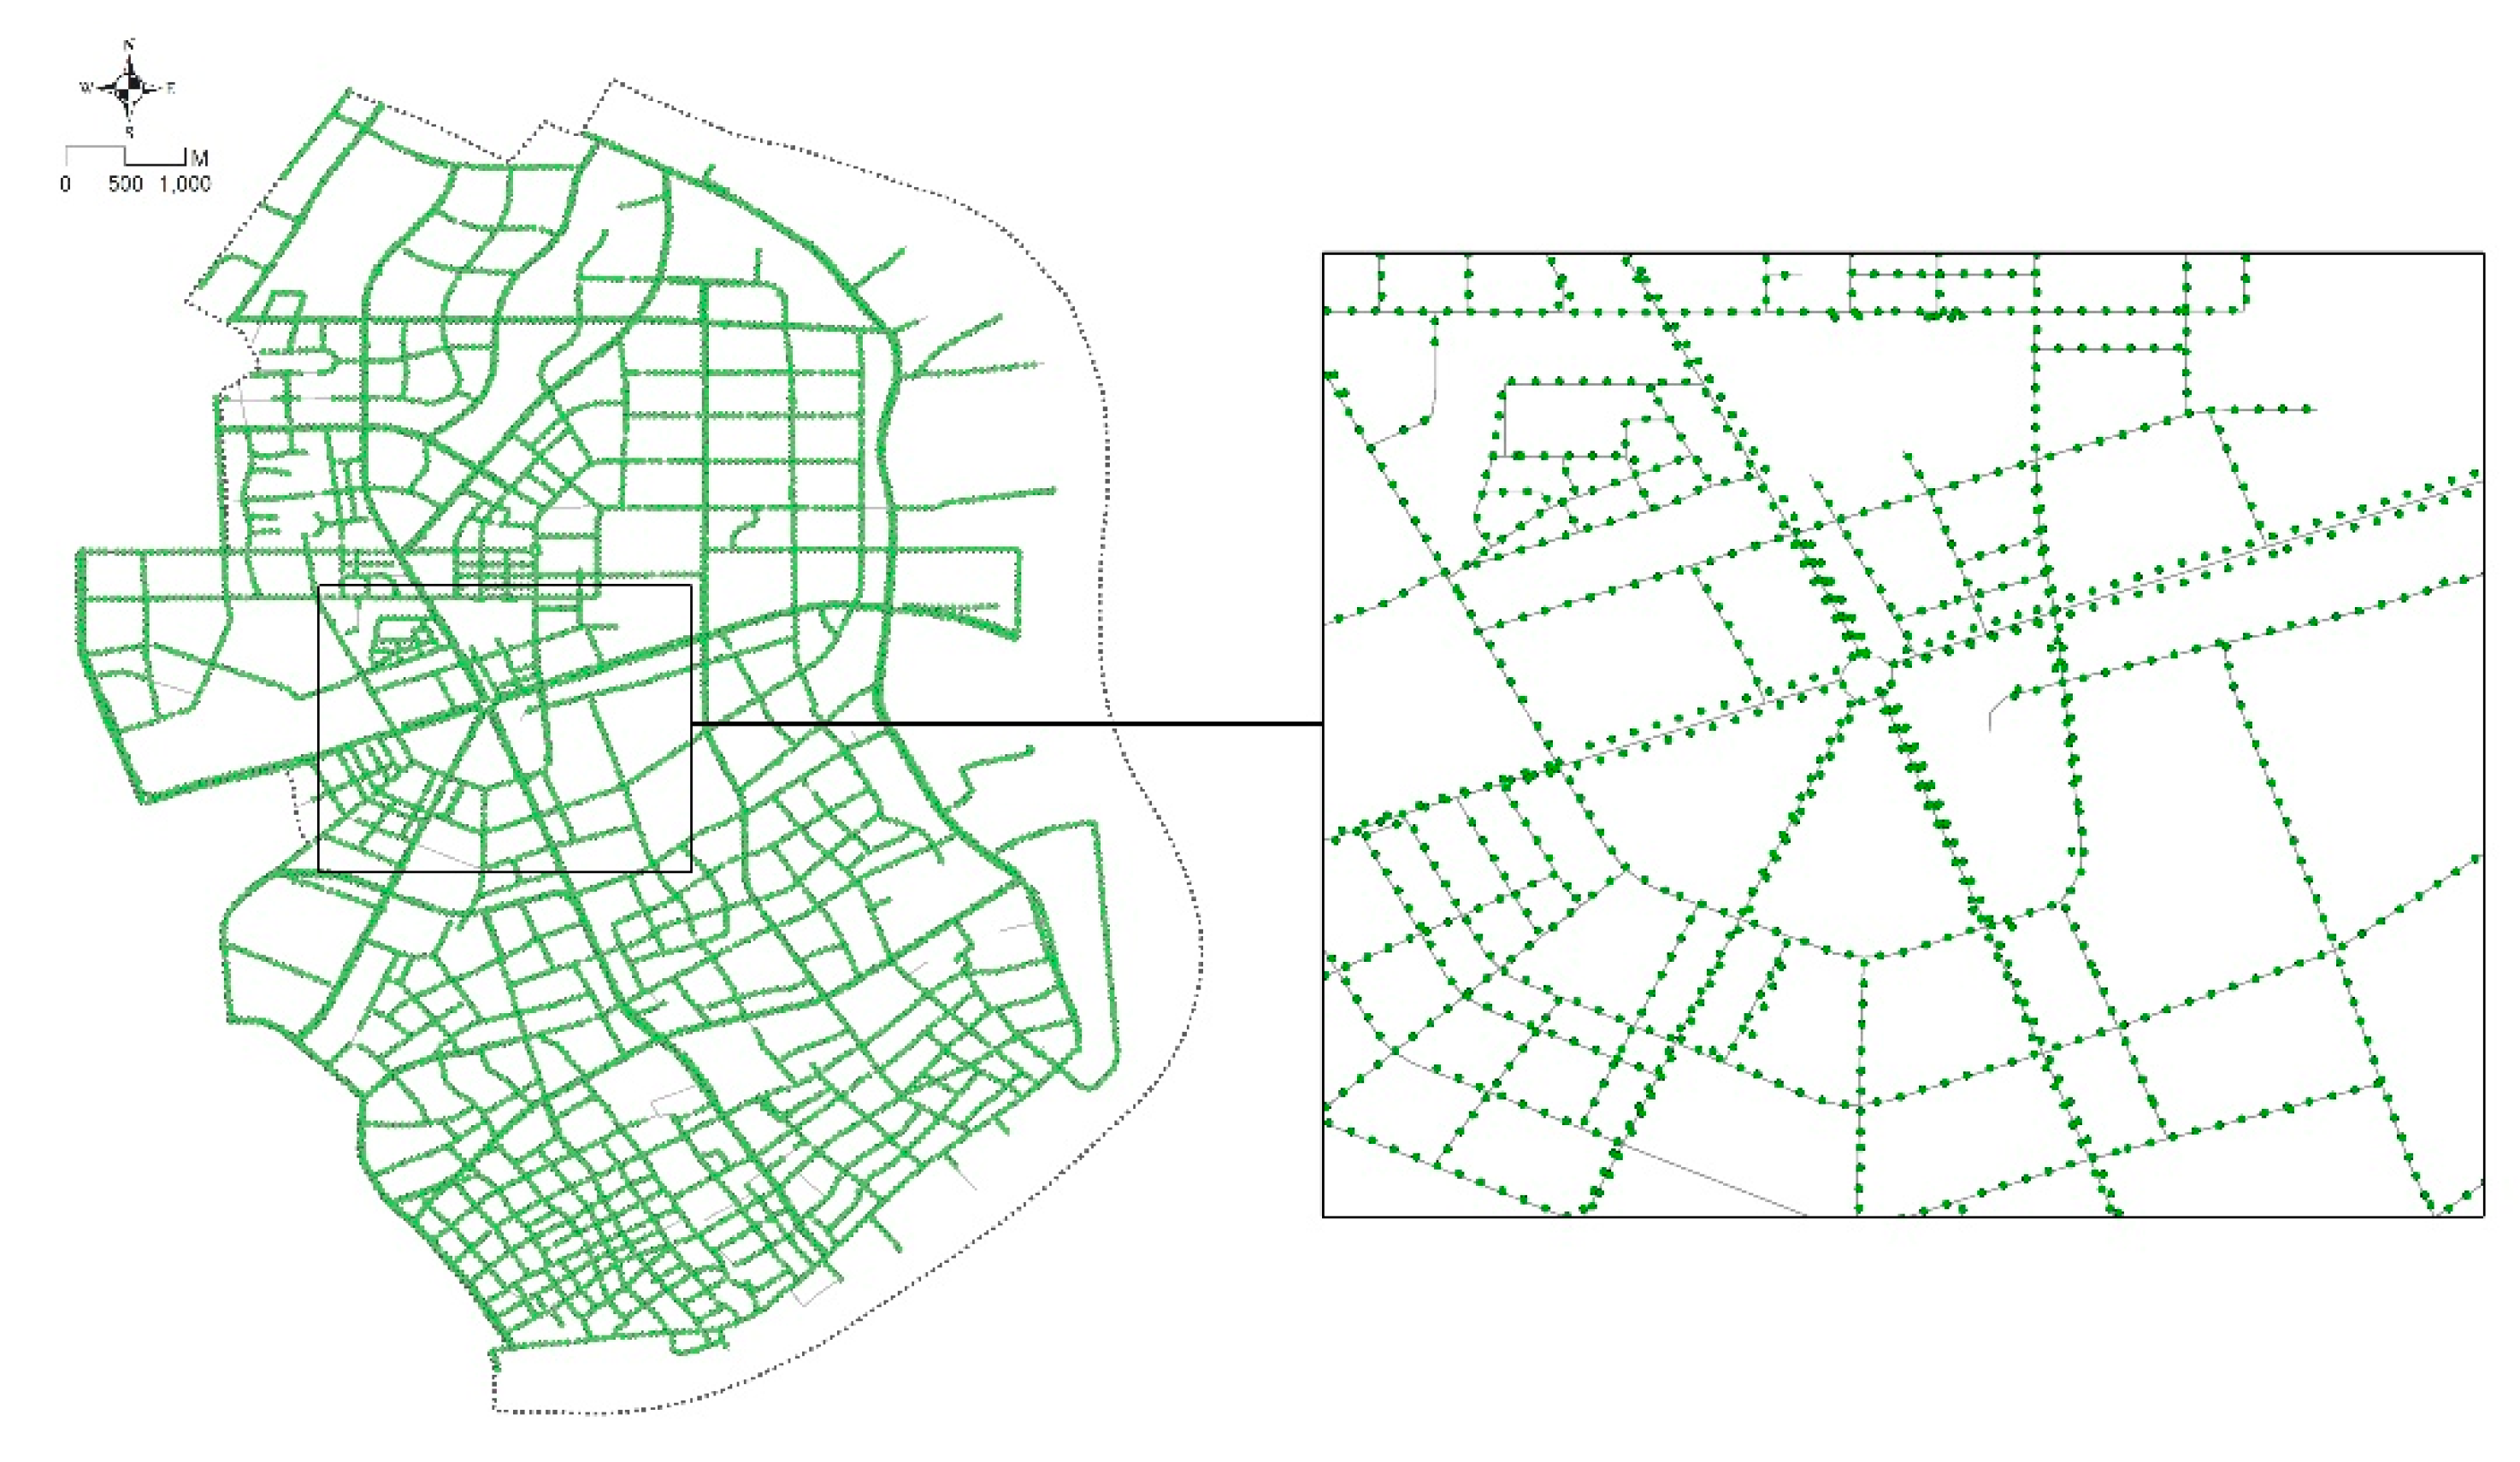
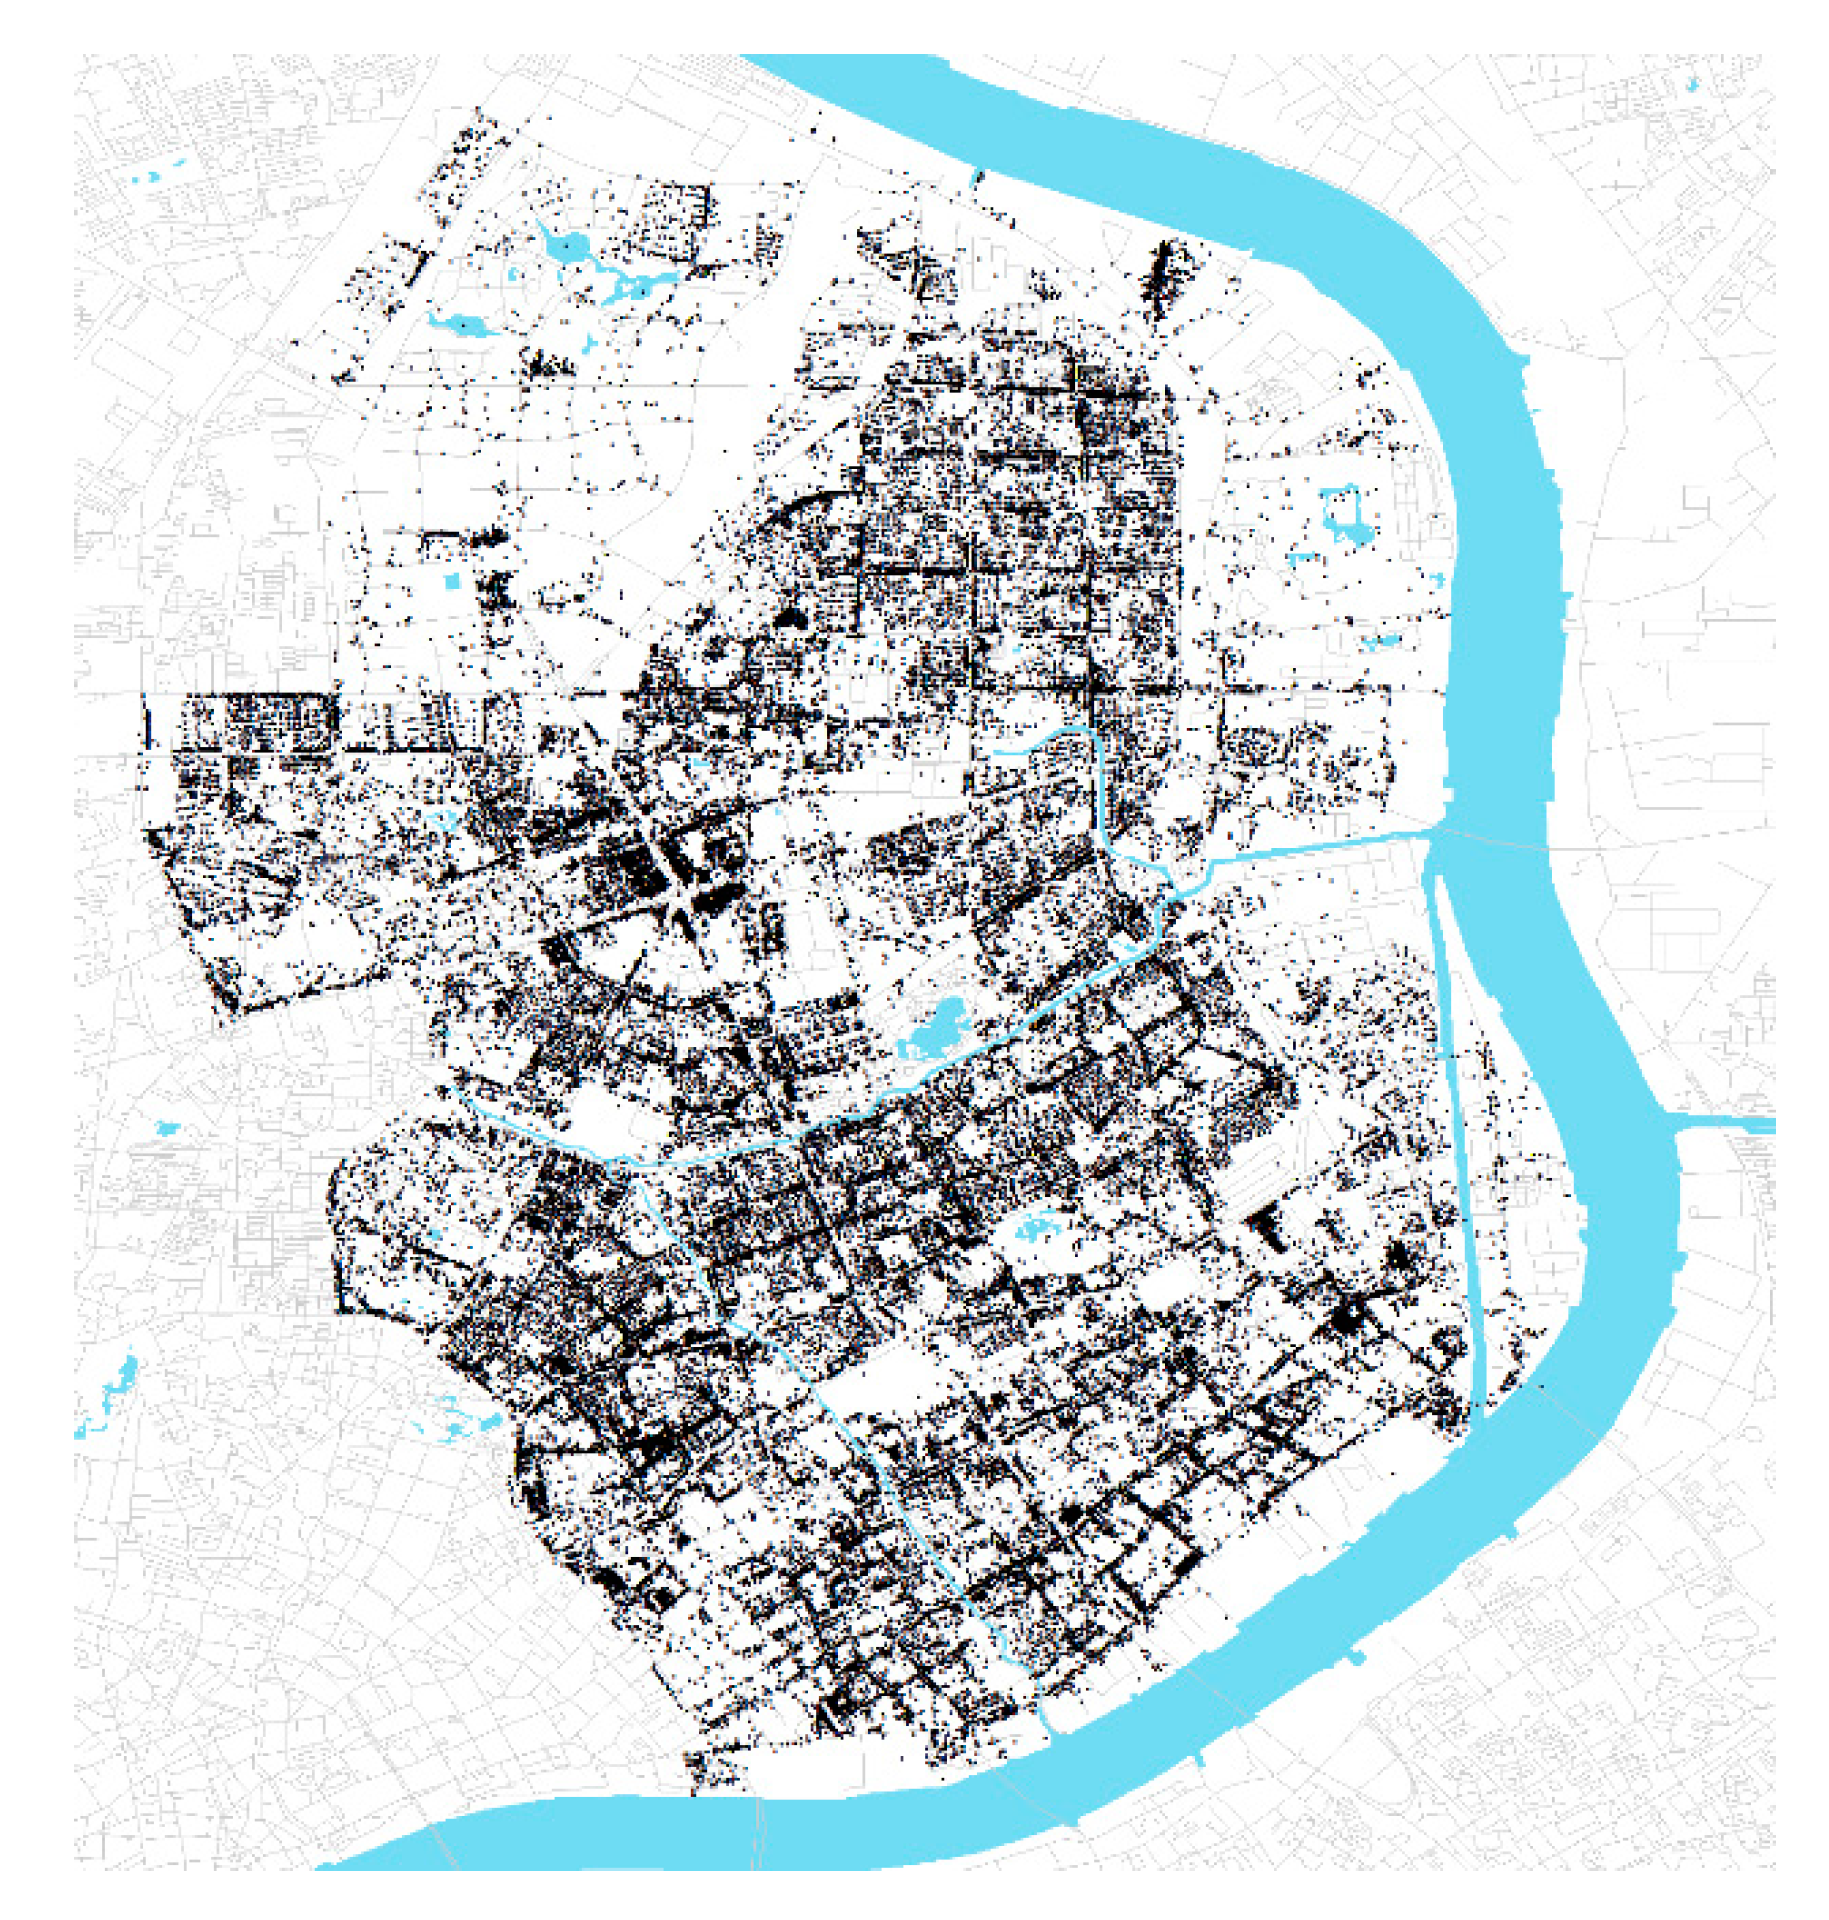
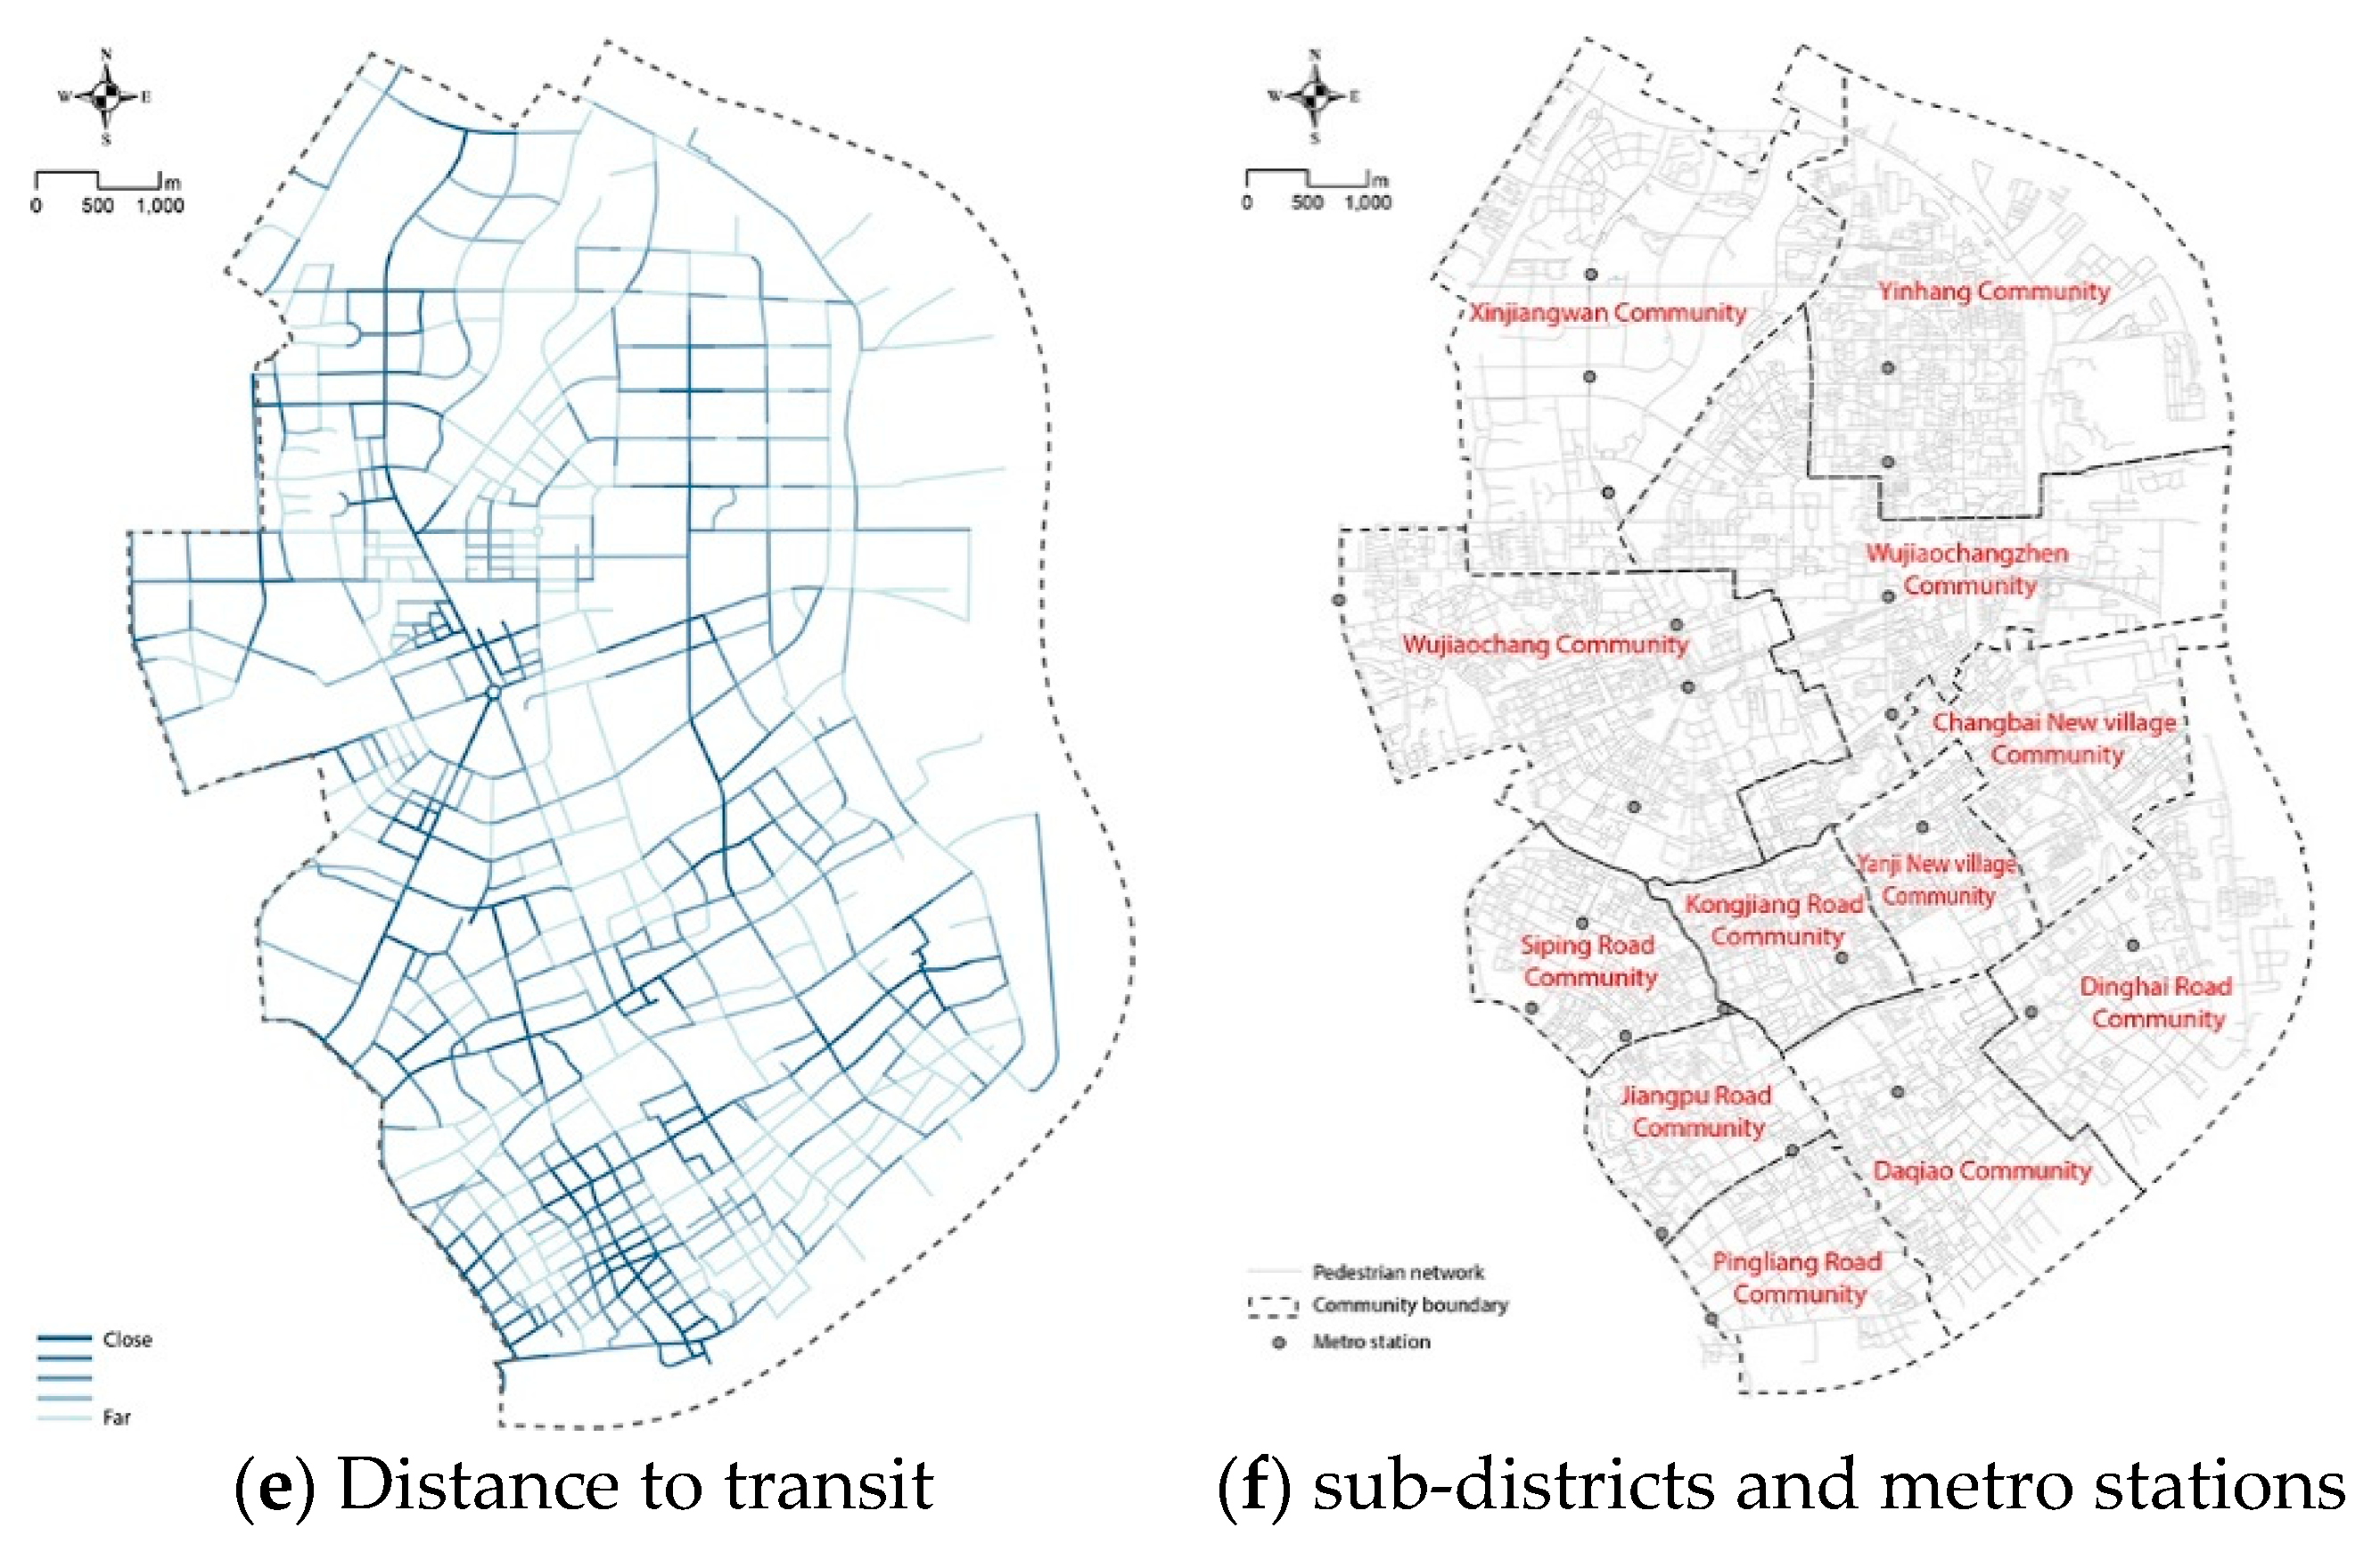
3.2. The Study Area: Shanghai Yangpu District
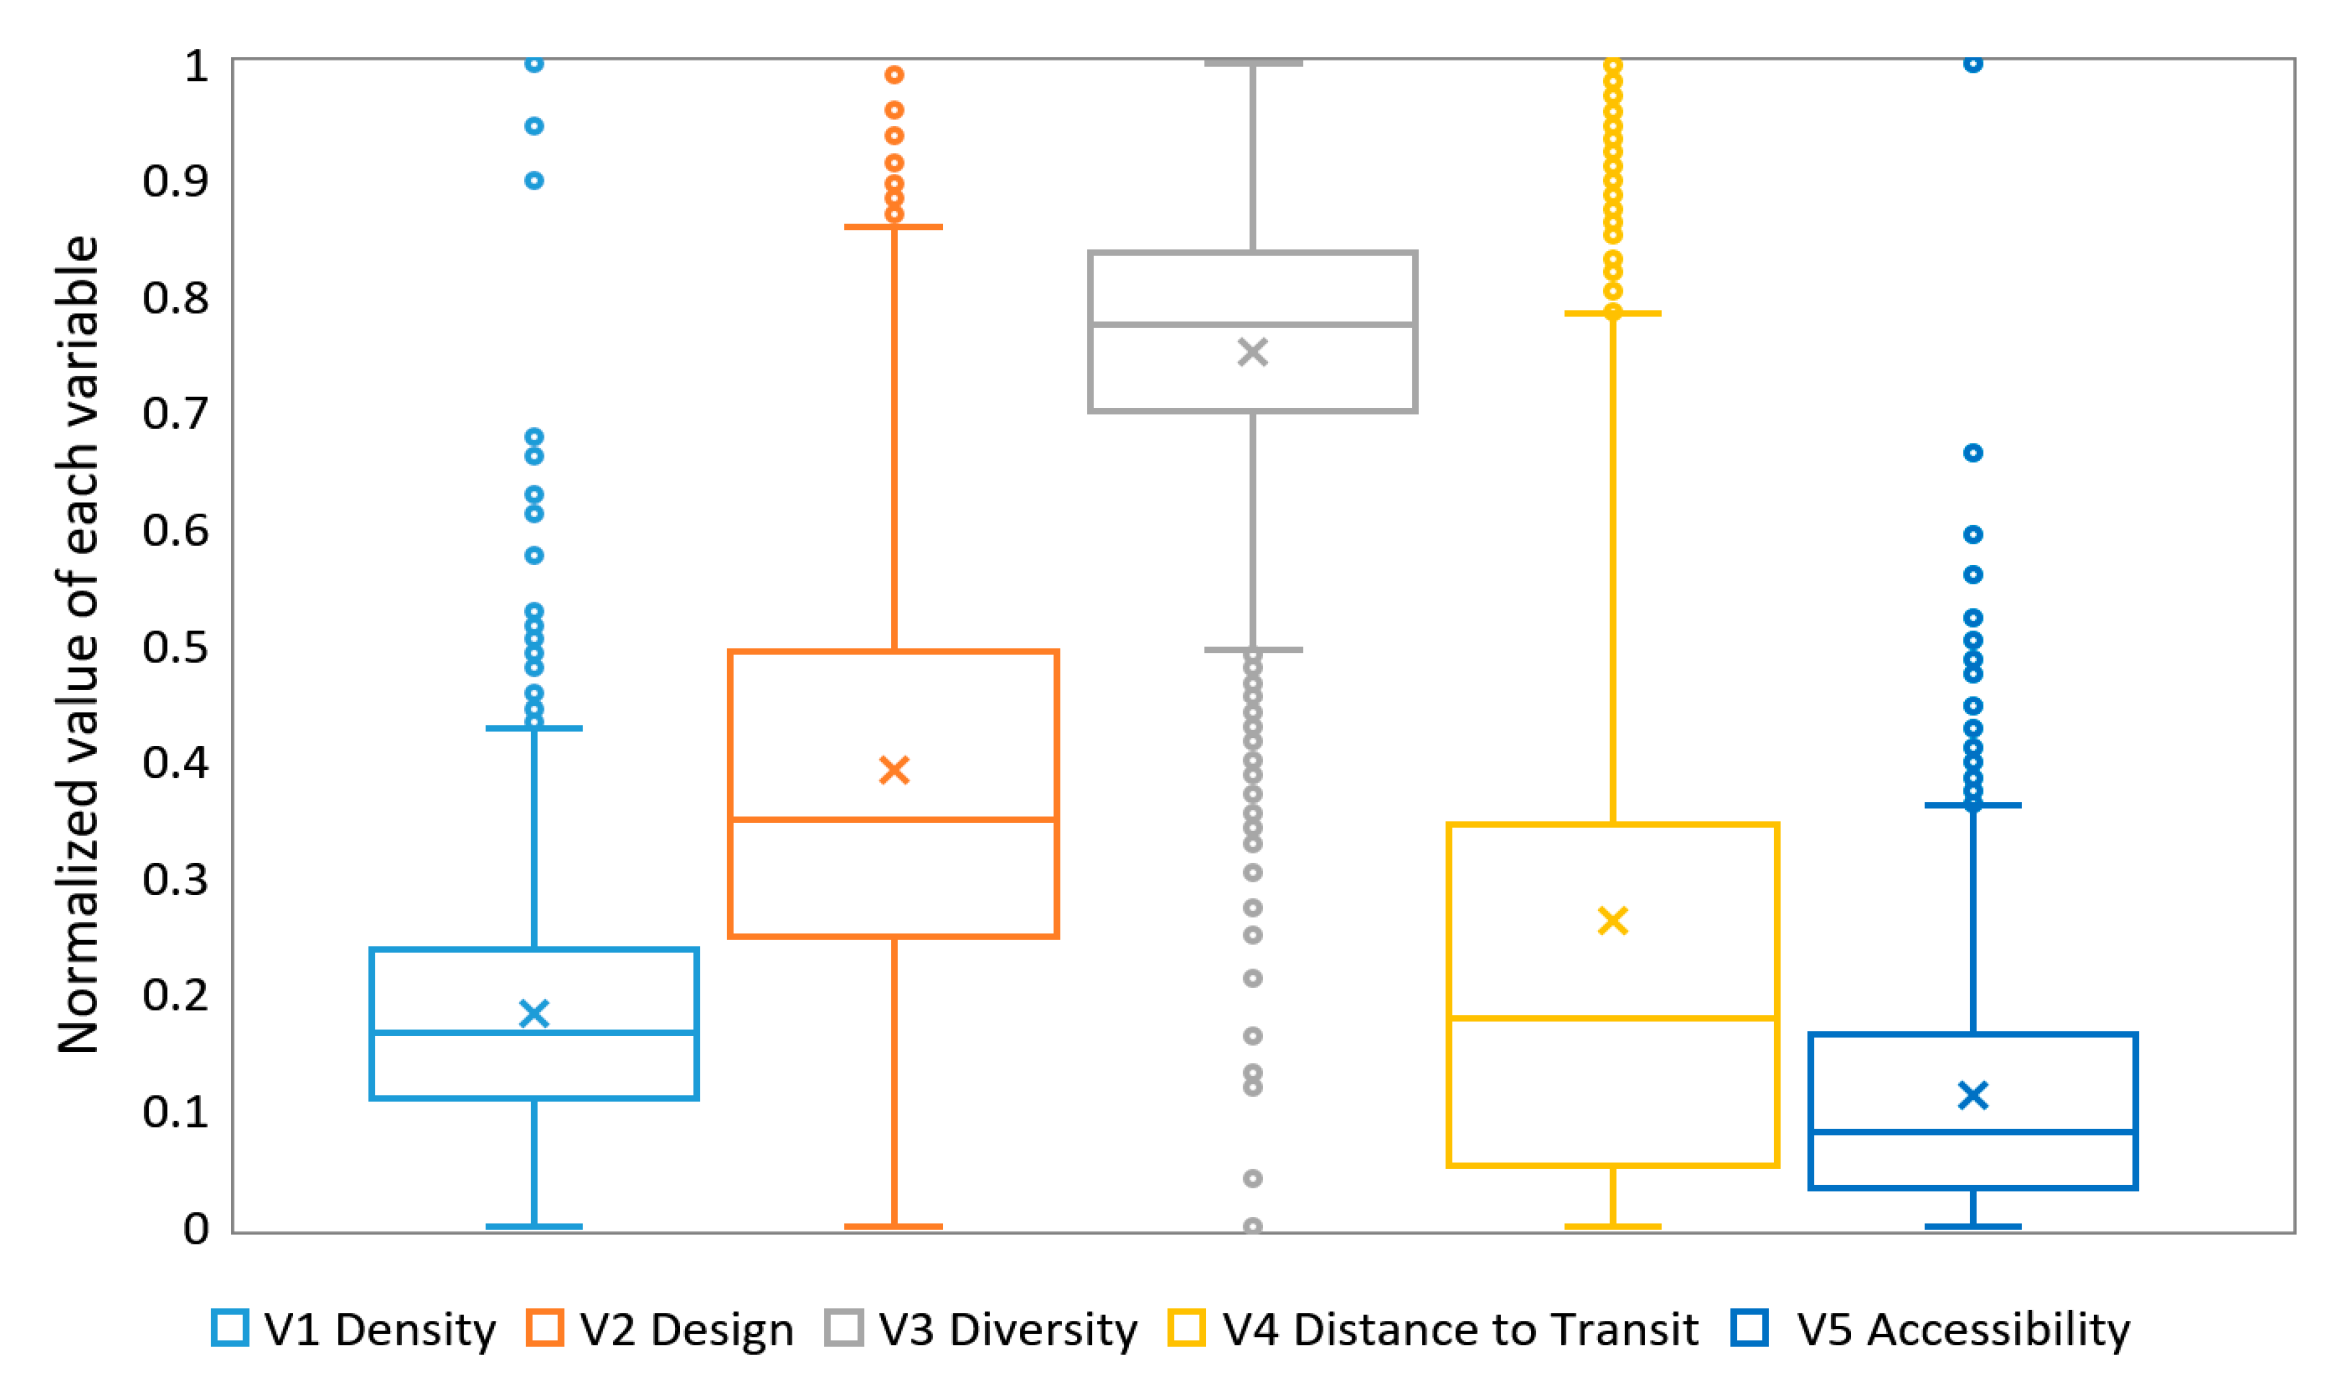
3.3. Measuring Street Quality via Five Dimensions
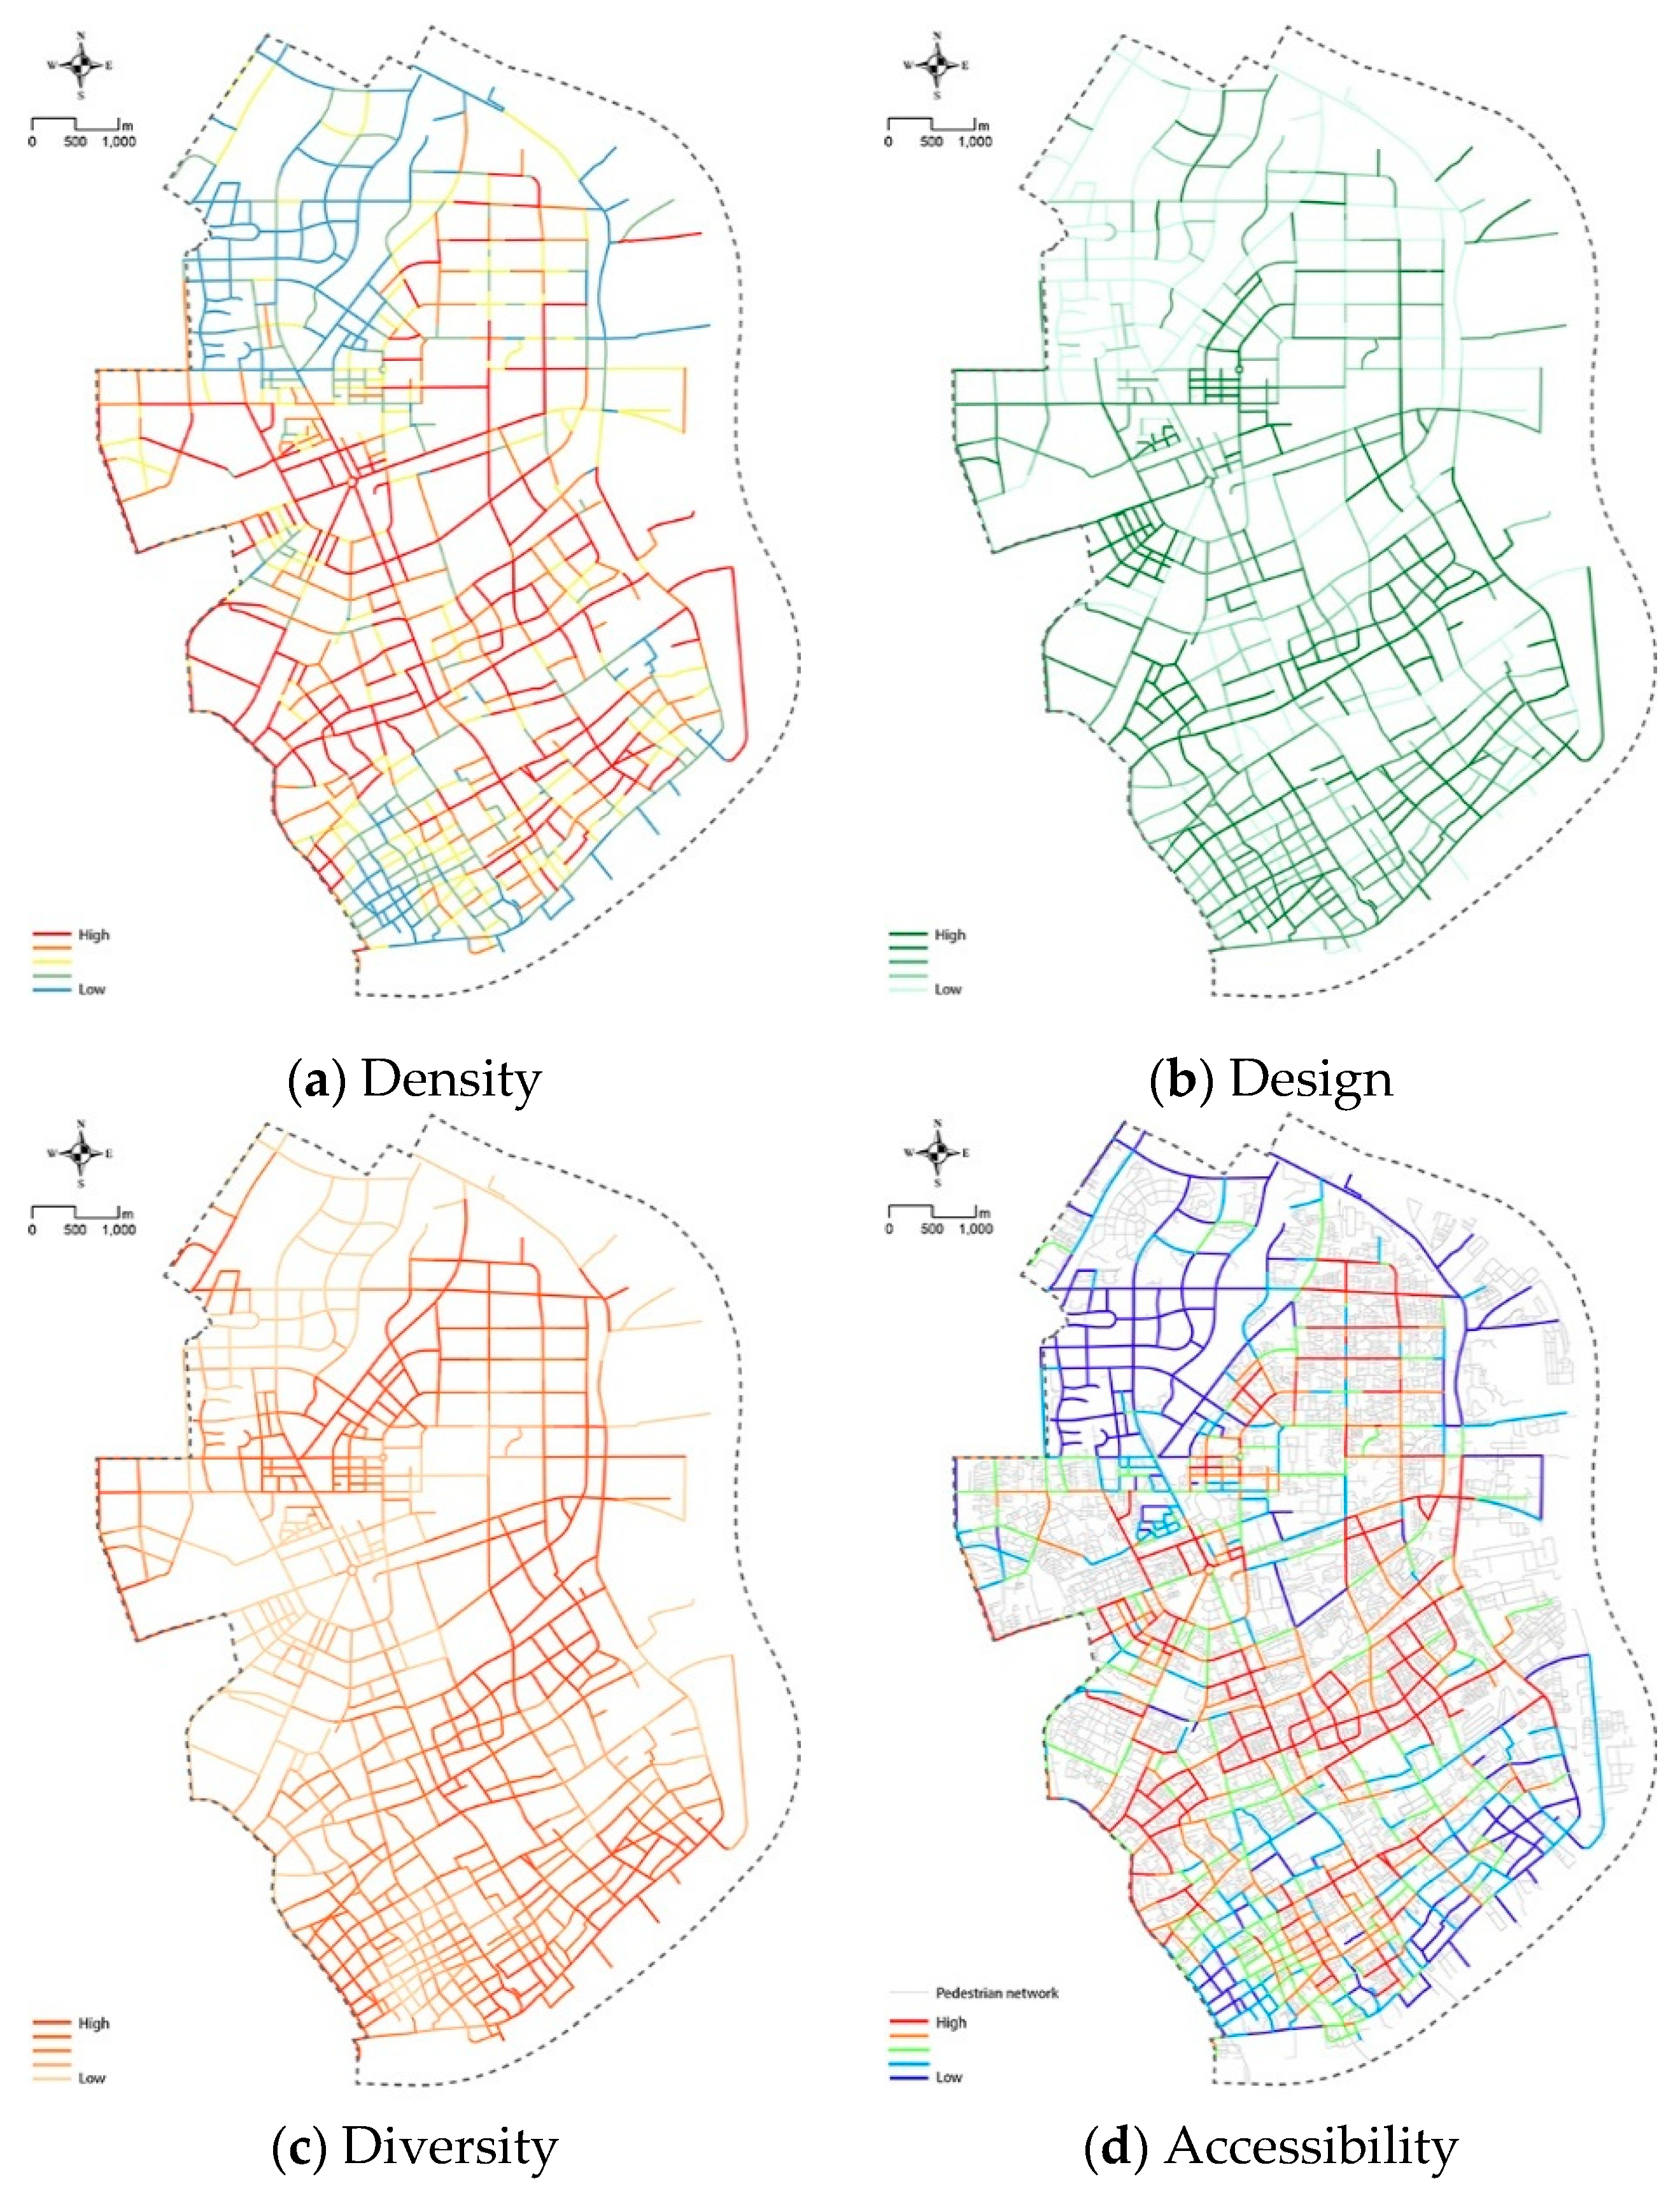
3.3.1. Density
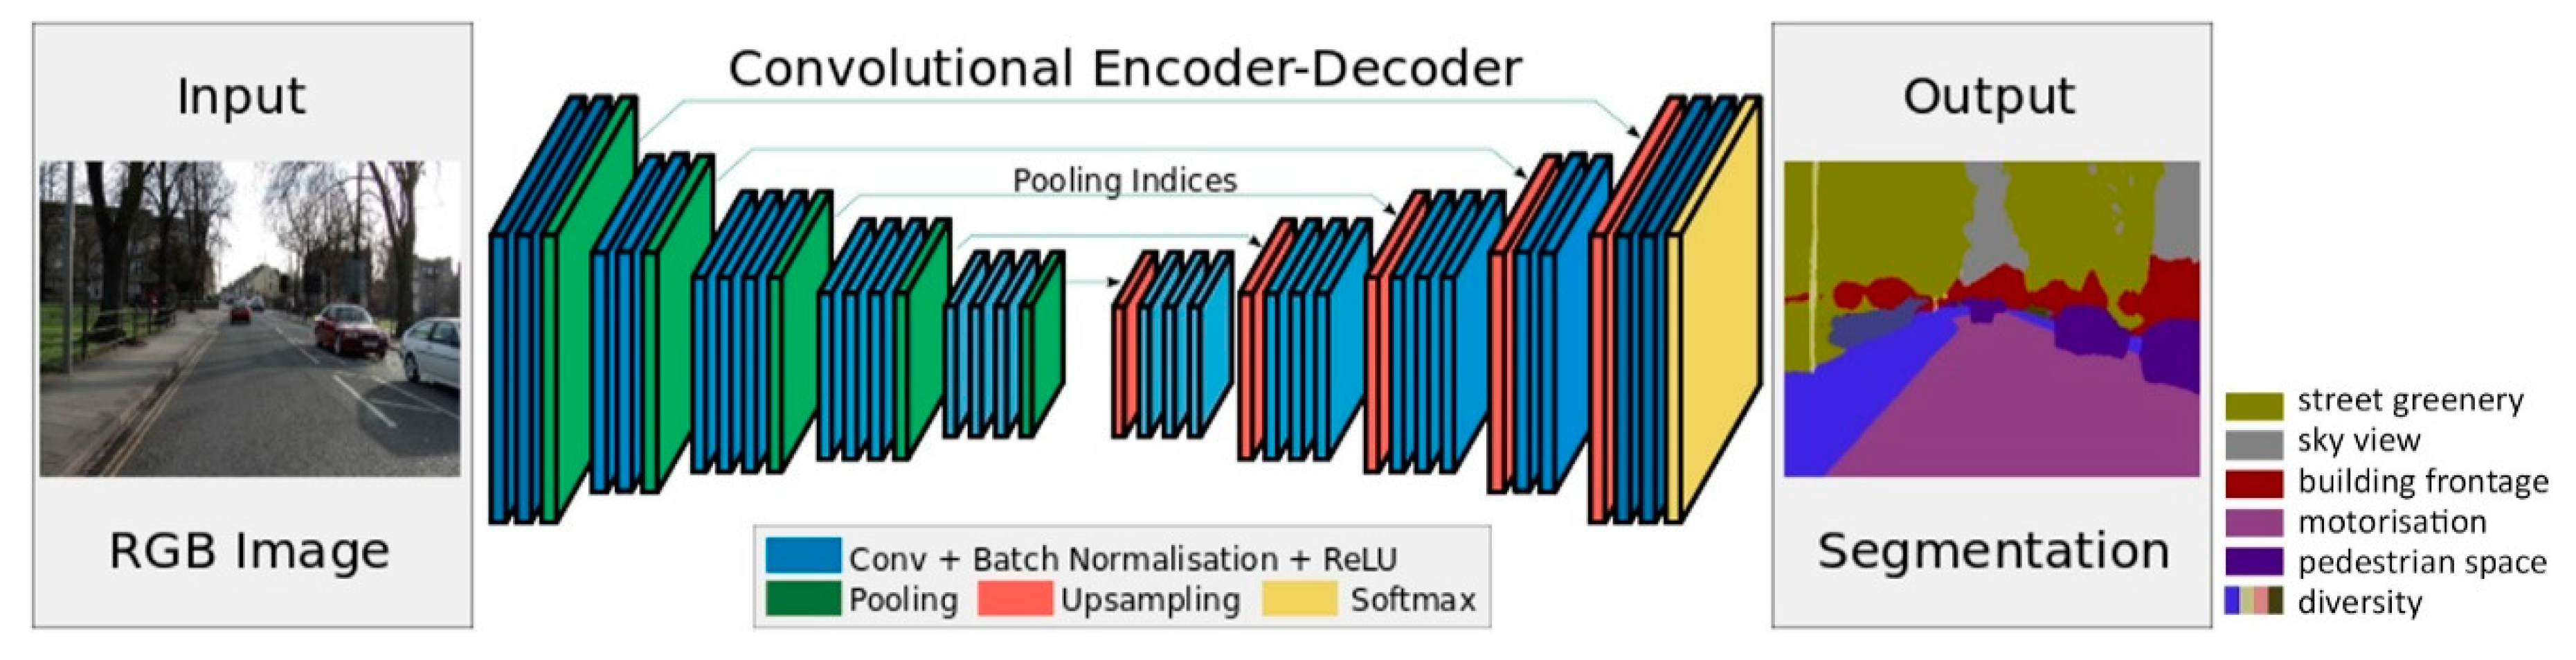
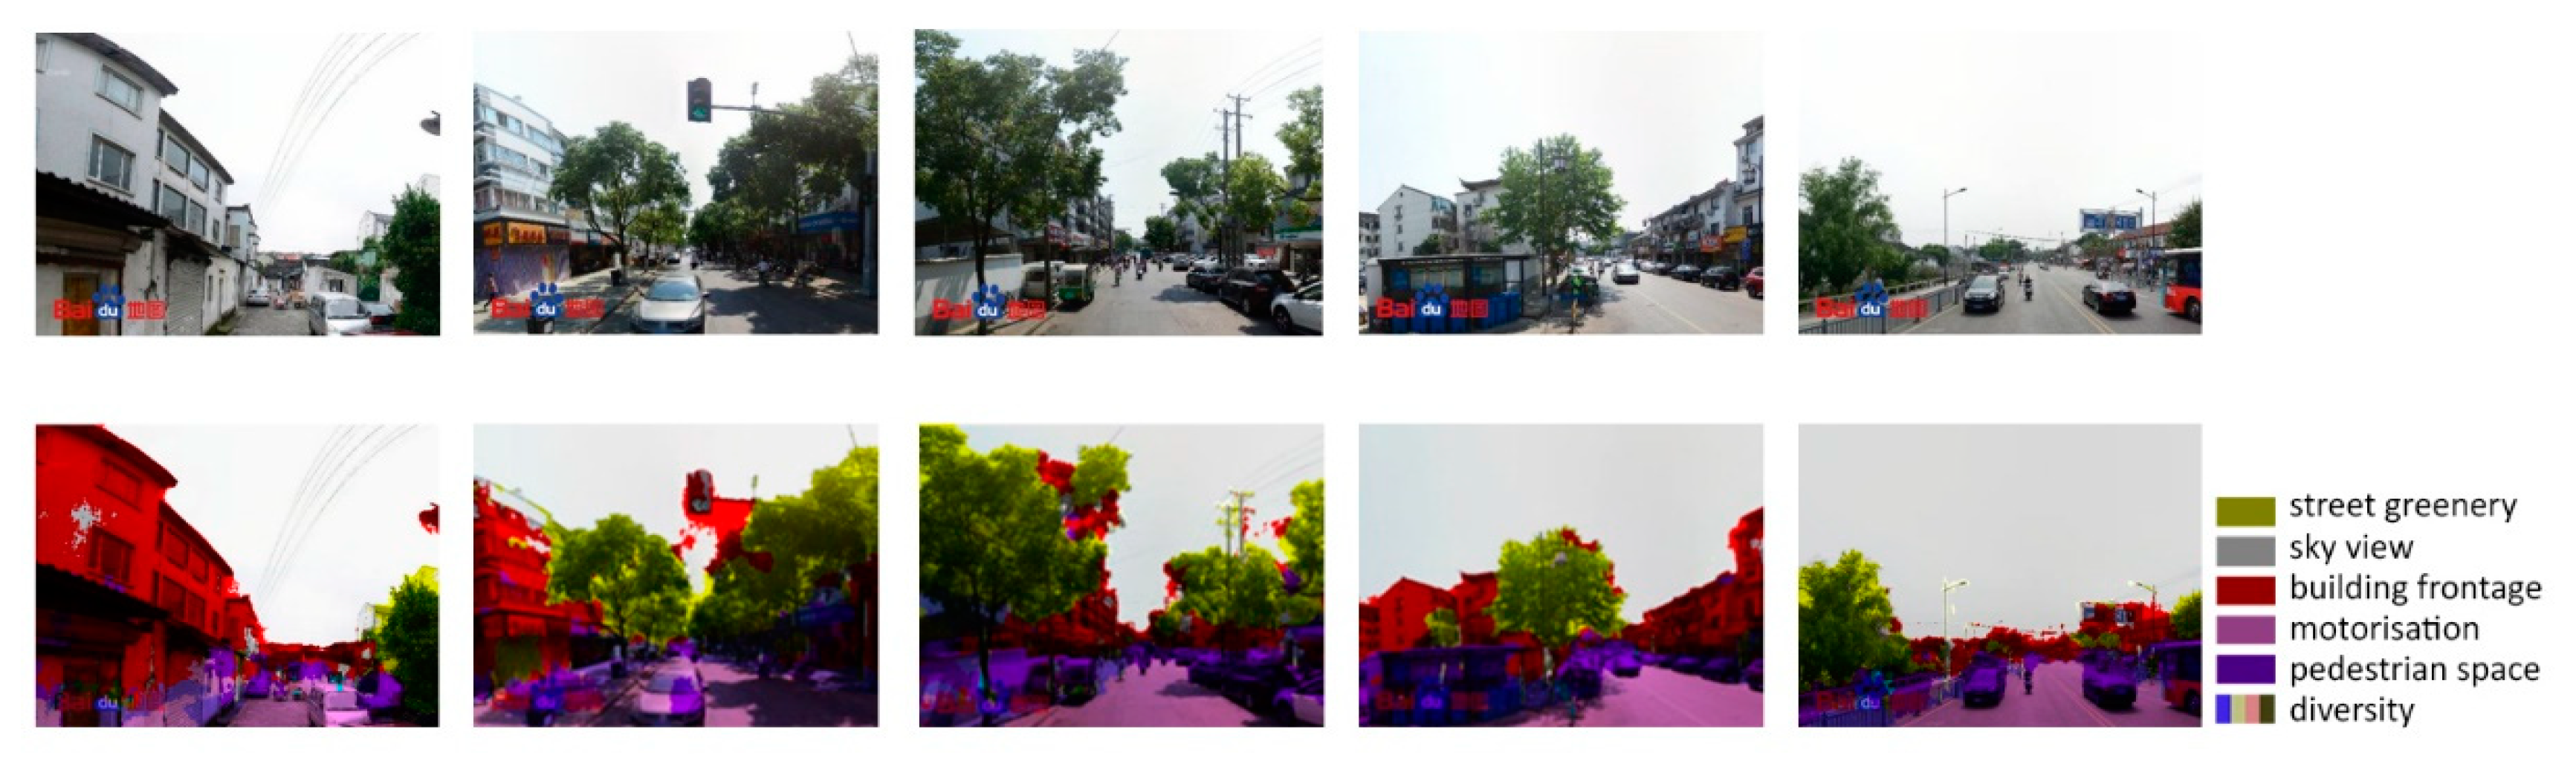
3.3.2. Design
3.3.3. Diversity
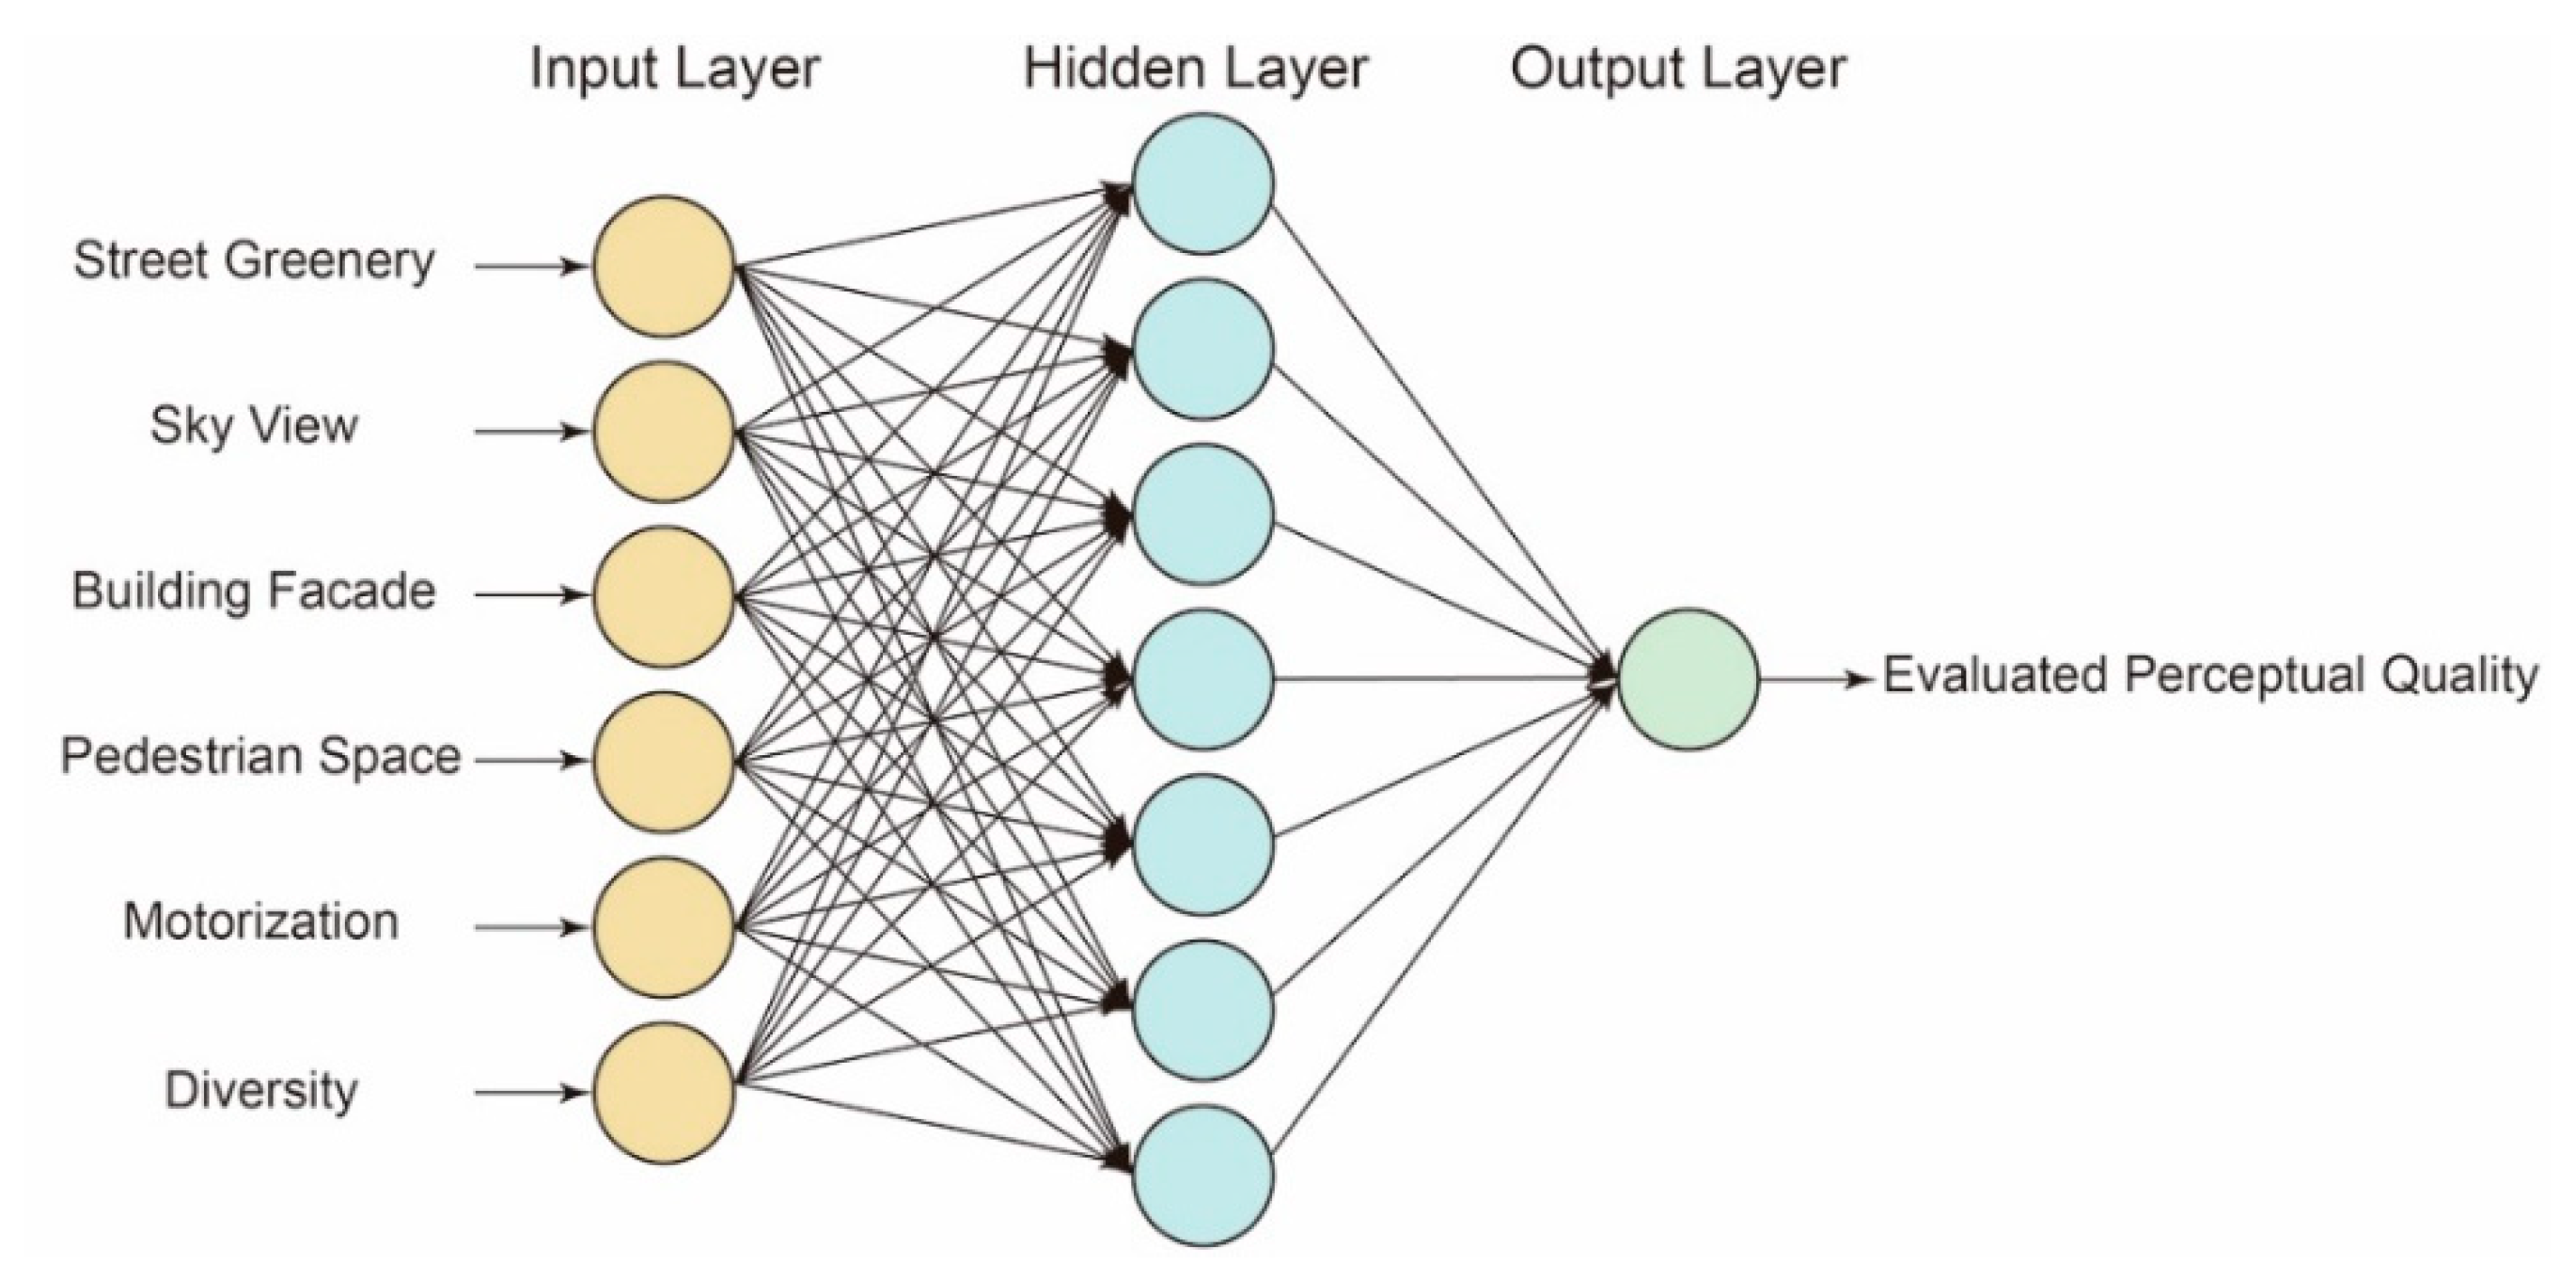
3.3.4. Measuring Accessibility
3.3.5. Distance to Transit
4. Results
4.1. Quantitatively Measuring Street Quality
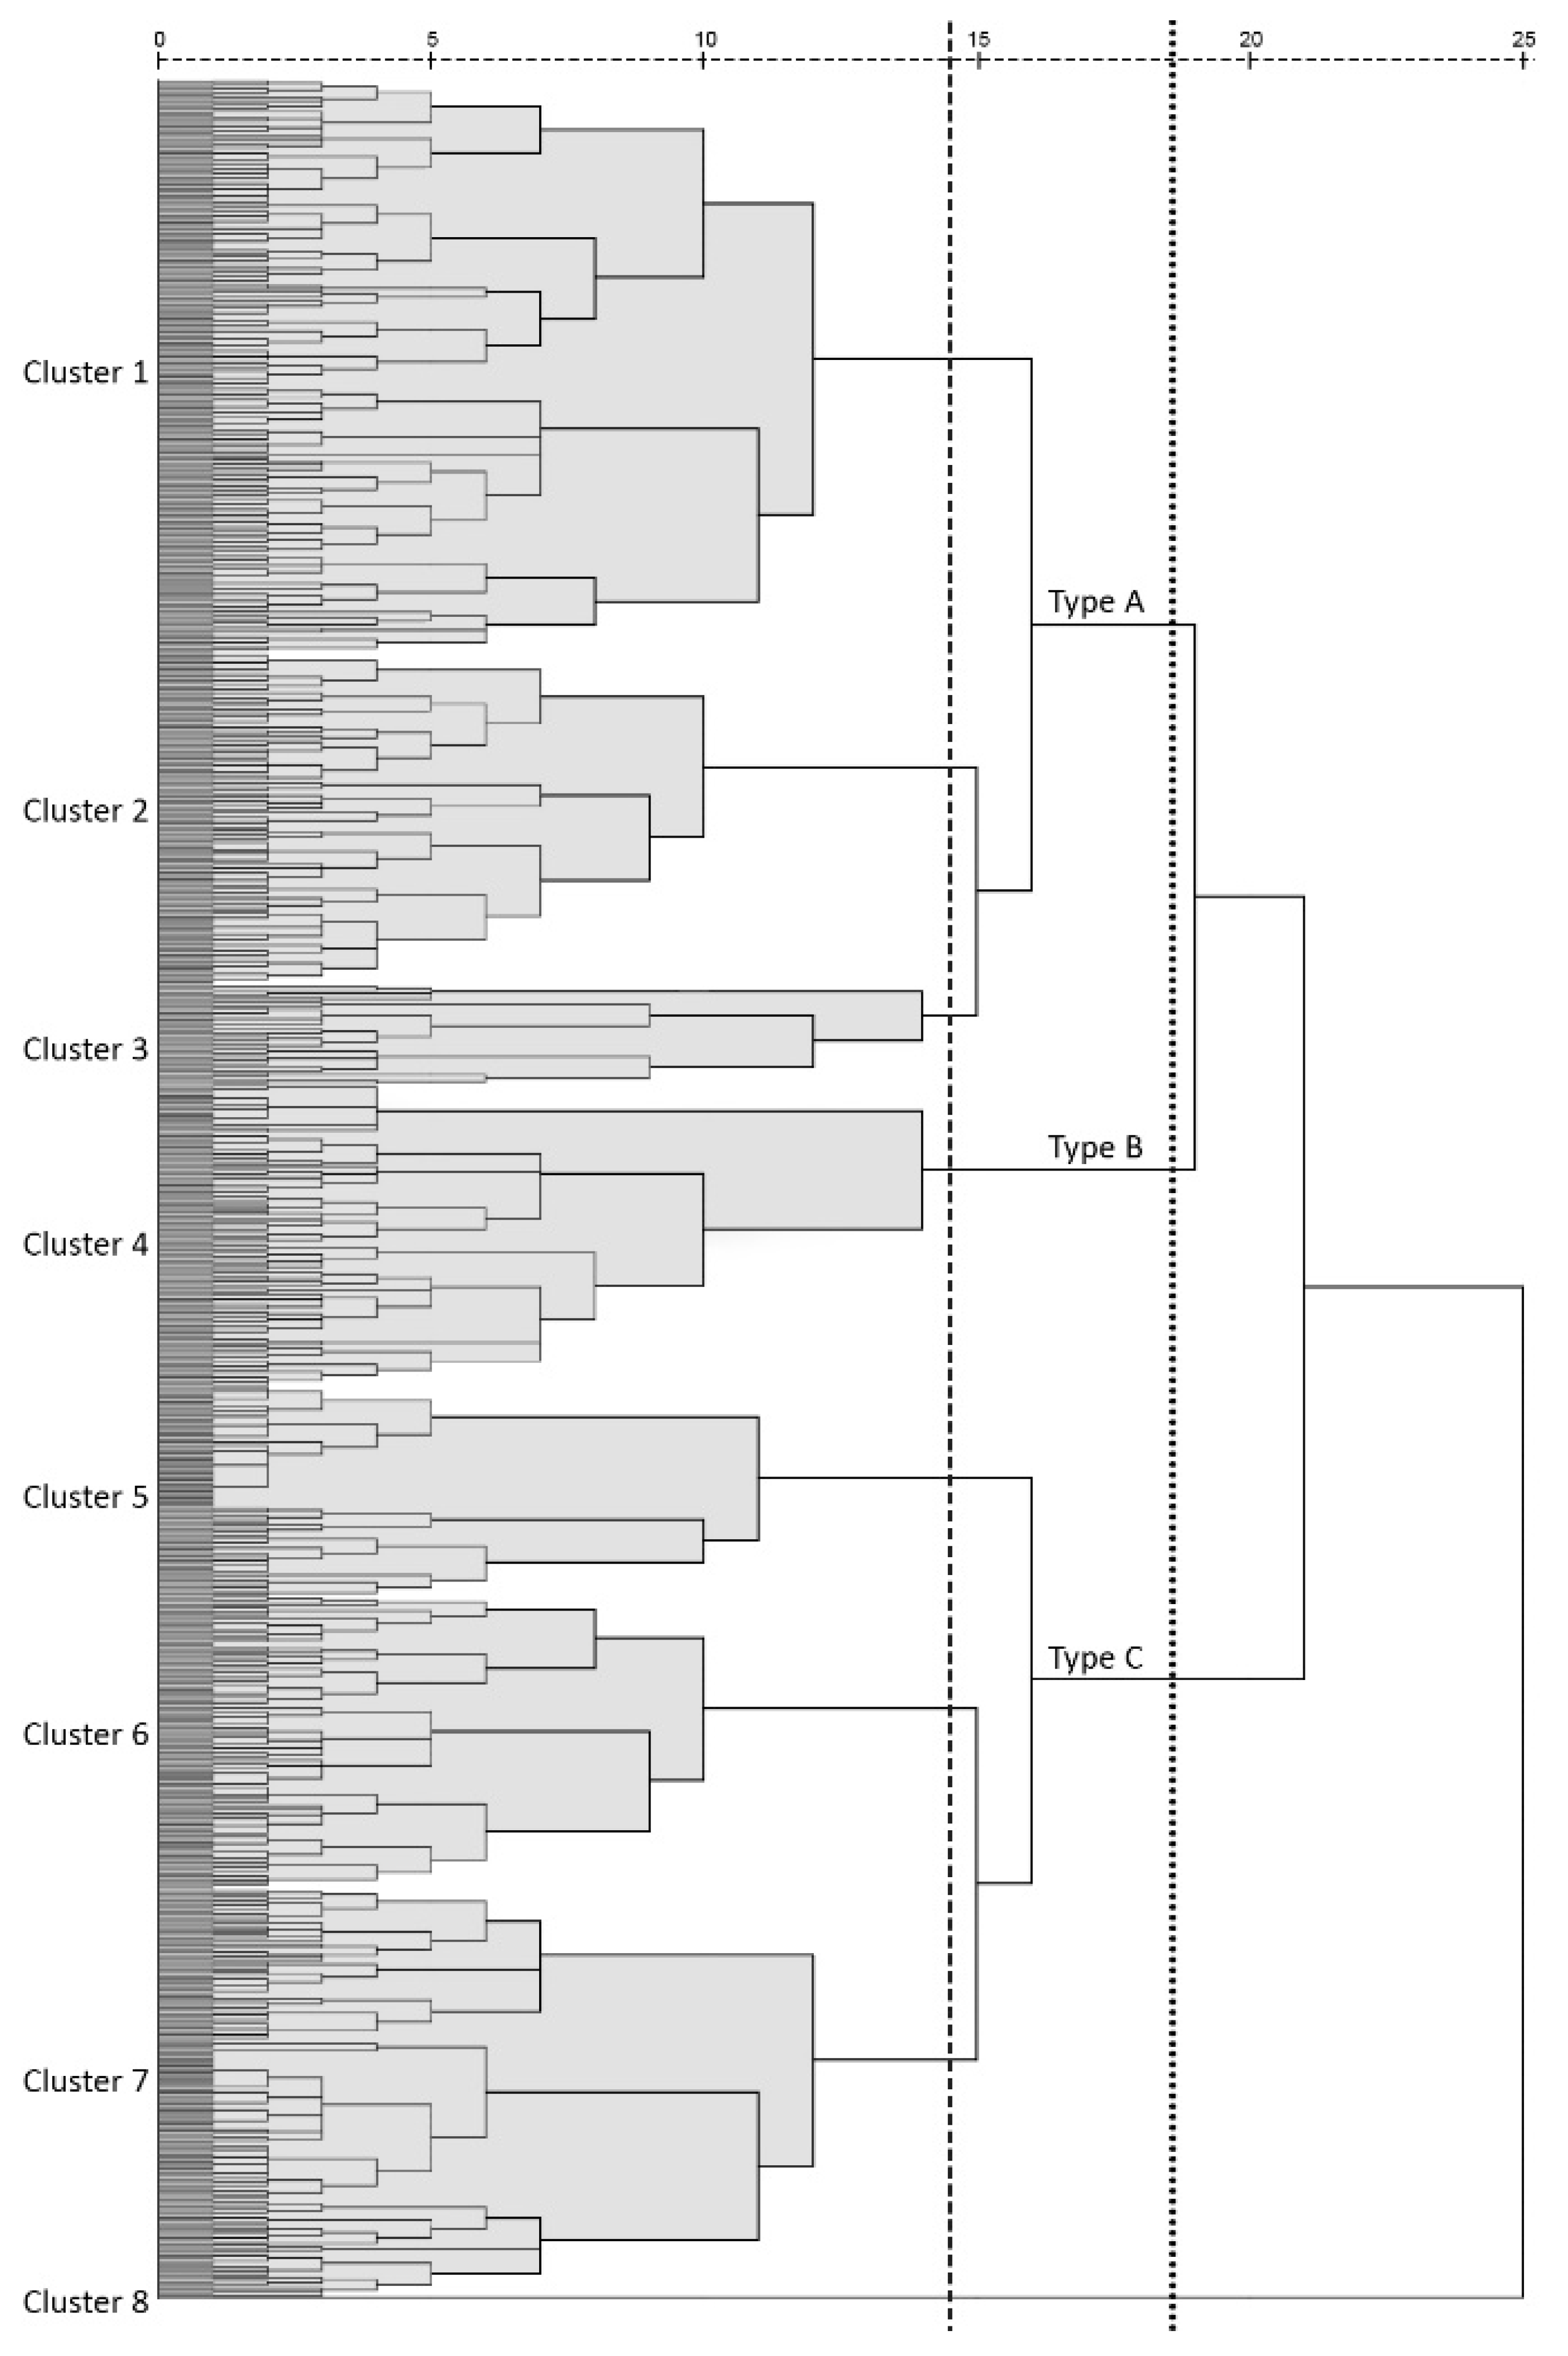
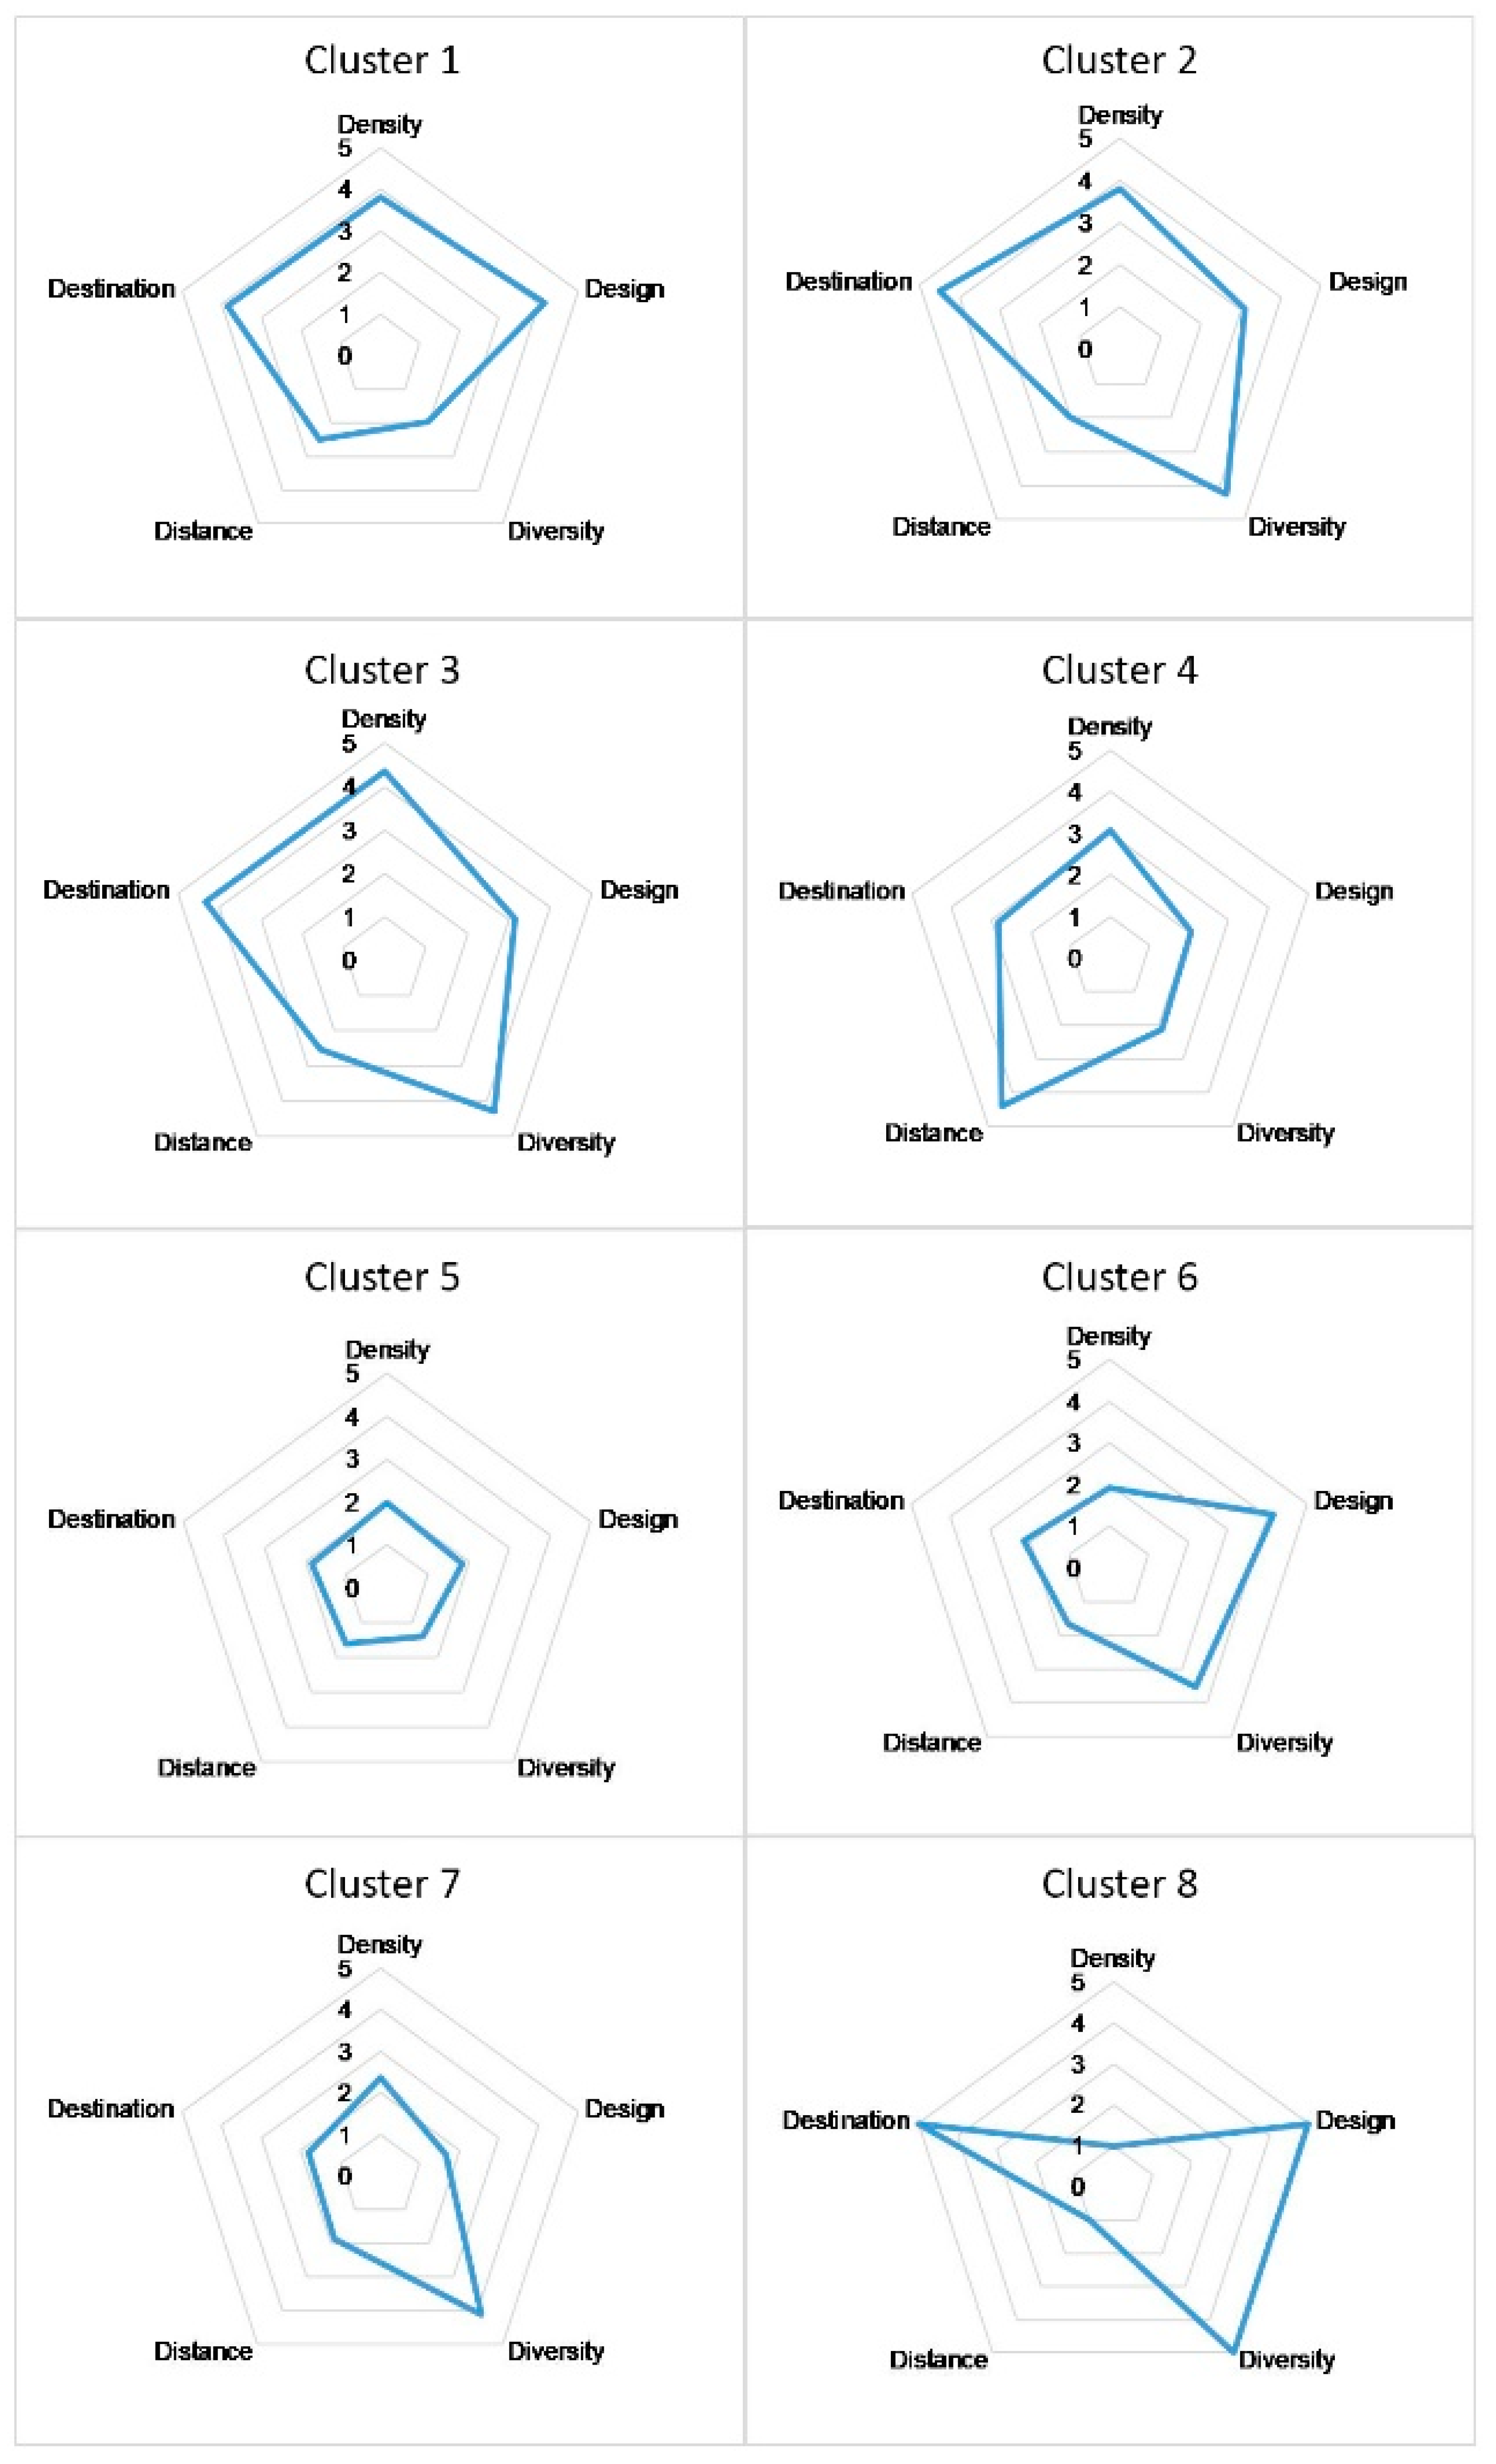
4.2. Hierarchical Cluster Analysis
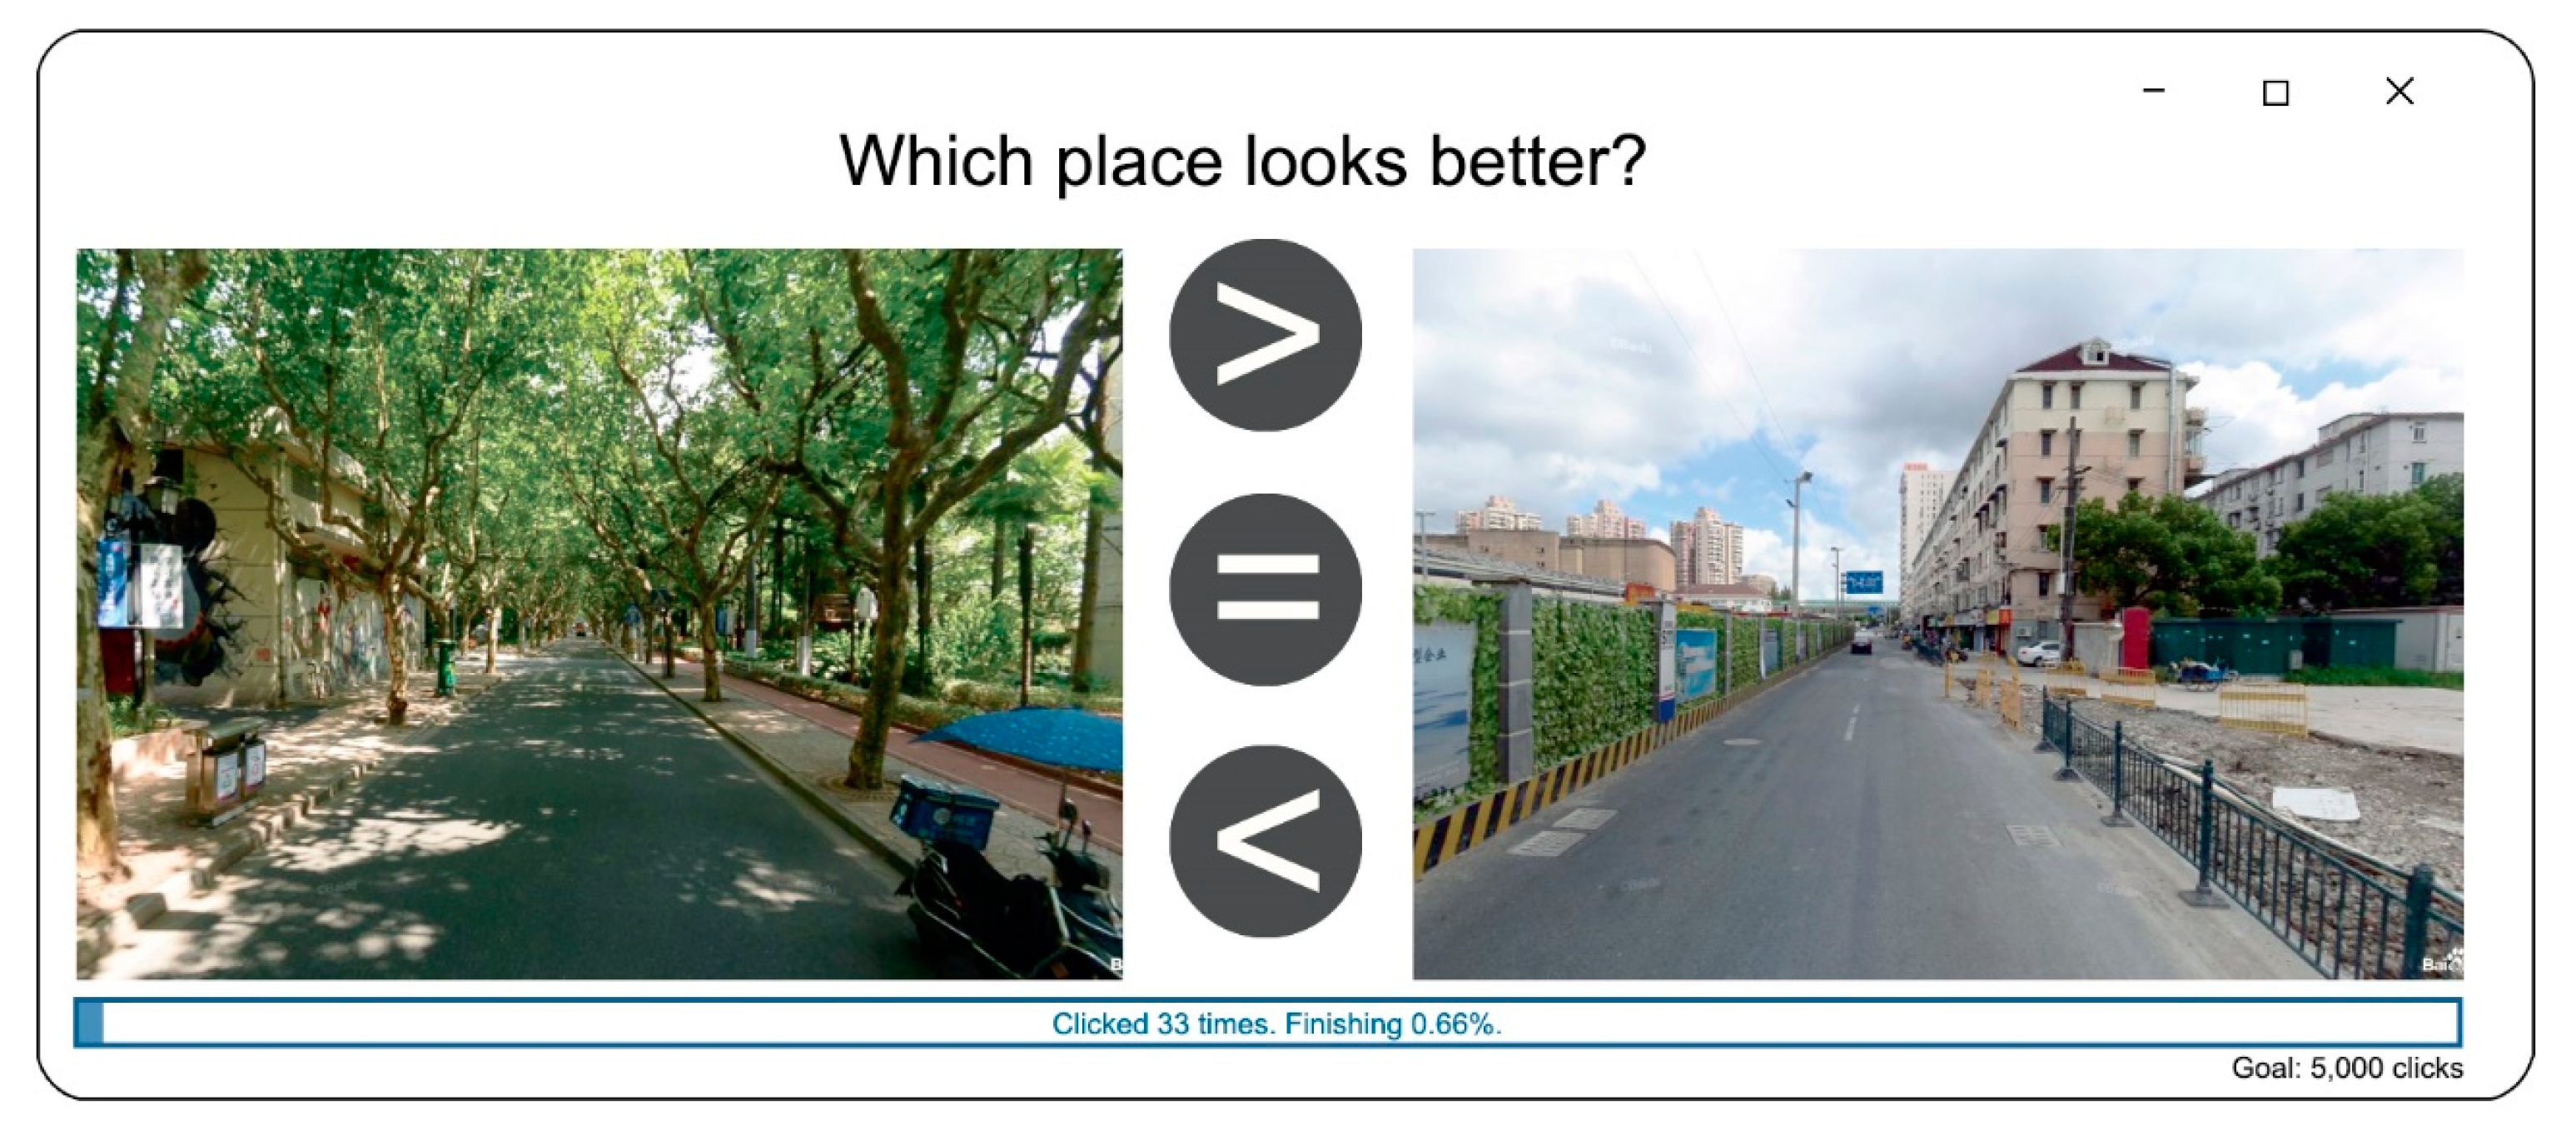
4.3. Validating the Analytical Results
5. Discussion
5.1. Measuring the Unmeasurable: Evaluating Street Quality with Large-Scale and High-Resolution Data
5.2. Multi-Factor Measurement Combining Classical Thinking and New Analytical Tools
5.3. Implications for Urban Policy and Design Practices from the Human-Oriented Perspective
5.4. Limitations and Next Steps
6. Conclusions
Author Contributions
Funding
Acknowledgments
Conflicts of Interest
Appendix A

| Road ID | Road Name | Experts’ Evaluation | Machine Evaluation | ||||
|---|---|---|---|---|---|---|---|
| Evaluation | Score | Group | Type | Score | |||
| expert 1 | 122 | Yulin Rd. | Medium | 2 | Group 4 | Type B | 2 |
| 125 | Liaoyang Rd. | Poor | 1 | Group 6 | Type C | 1 | |
| 141 | Lanzhou Rd. | Good | 3 | Group 2 | Type A | 3 | |
| 151 | Jilin Rd. | Poor | 1 | Group 6 | Type C | 1 | |
| 169 | Meizhou Rd. | Medium | 2 | Group 2 | Type A | 3 | |
| 219 | Yangshupu Rd. | Poor | 1 | Group 6 | Type C | 1 | |
| expert 2 | 229 | Meizhou Rd. | Good | 3 | Group 2 | Type A | 3 |
| 269 | Kunming Rd. | Poor | 1 | Group 6 | Type C | 1 | |
| 270 | Lanzhou Rd. | Medium | 2 | Group 1 | Type A | 3 | |
| 287 | Xuchang Rd. | Good | 3 | Group 1 | Type A | 3 | |
| 318 | Huangxing Rd. | Medium | 2 | Group 3 | Type A | 3 | |
| 325 | Changyang Rd. | Medium | 2 | Group 7 | Type C | 1 | |
| expert 3 | 339 | Dalian Rd. | Medium | 2 | Group 4 | Type B | 2 |
| 341 | Guiyan Rd. | Medium | 2 | Group 7 | Type C | 1 | |
| 380 | Zhoujiazui Rd. | Poor | 1 | Group 7 | Type C | 1 | |
| 399 | Jiangpu Rd. | Medium | 2 | Group 4 | Type B | 2 | |
| 406 | Fuxin Rd. | Good | 3 | Group 1 | Type A | 3 | |
| 423 | Neijiang Rd. | Medium | 2 | Group 4 | Type B | 2 | |
| expert 4 | 441 | Longchang Rd. | Good | 3 | Group 1 | Type A | 3 |
| 479 | Chifeng Rd. | Good | 3 | Group 1 | Type A | 3 | |
| 483 | Zhangwu Rd. | Good | 3 | Group 1 | Type A | 3 | |
| 514 | Mid Yanji Rd. | Good | 3 | Group 2 | Type A | 3 | |
| 574 | Zhengxiu Rd. | Poor | 1 | Group 5 | Type C | 1 | |
| 624 | Zhengxiu Rd. | Good | 3 | Group 2 | Type A | 3 | |
| expert 5 | 723 | Guoding Rd. | Medium | 2 | Group 1 | Type A | 3 |
| 1001 | Guohe Rd. | Good | 3 | Group 2 | Type A | 3 | |
| 1099 | Jungong Rd. | Poor | 1 | Group 7 | Type C | 1 | |
| 1269 | South Ningguo Rd. | Poor | 1 | Group 6 | Type C | 1 | |
| 401 | Neijiang Rd. | Poor | 1 | Group 5 | Type C | 1 | |
| 971 | Minzhuang Rd. | Poor | 1 | Group 7 | Type C | 1 | |
| expert 6 | 1015 | Shijie Rd. | Medium | 2 | Group 2 | Type A | 3 |
| 1030 | Minjing Rd. | Good | 3 | Group 2 | Type A | 3 | |
| 1031 | Ningcheng Rd. | Good | 3 | Group 2 | Type A | 3 | |
| 1051 | North Guoquan Rd. | Poor | 1 | Group 5 | Type C | 1 | |
| 1058 | Zhongyuan Rd. | Good | 3 | Group 7 | Type C | 1 | |
| 879 | Zhengqing Rd. | Medium | 2 | Group 4 | Type B | 2 | |
| expert 7 | 663 | East Yanji Rd. | Medium | 2 | Group 2 | Type A | 3 |
| 712 | Jiamusi Rd. | Medium | 2 | Group 6 | Type C | 1 | |
| 767 | Guohe Rd. | Poor | 1 | Group 5 | Type C | 1 | |
| 770 | Zhixing Rd. | Medium | 2 | Group 4 | Type B | 2 | |
| 780 | Shagang Rd. | Medium | 2 | Group 3 | Type A | 3 | |
| 786 | Zhixing Rd. | Medium | 2 | Group 4 | Type B | 2 | |
| expert 8 | 881 | Guoding Rd. | Poor | 1 | Group 5 | Type C | 1 |
| 825 | Zhengli Rd. | Medium | 2 | Group 6 | Type C | 1 | |
| 843 | Zhengfu Rd. | Medium | 2 | Group 1 | Type A | 3 | |
| 860 | Guoan Rd. | Poor | 1 | Group 7 | Type C | 1 | |
| 877 | North Guoquan Rd. | Medium | 2 | Group 4 | Type B | 2 | |
| 944 | Zhongyuan Rd. | Poor | 1 | Group 4 | Type B | 2 | |
| expert 9 | 19 | Dandong Rd. | Poor | 1 | Group 7 | Type C | 1 |
| 91 | Yulin Rd. | Medium | 2 | Group 4 | Type B | 2 | |
| 128 | Kunming Rd. | Medium | 2 | Group 4 | Type B | 2 | |
| 182 | Meizhou Rd. | Good | 3 | Group 1 | Type A | 3 | |
| 205 | Kunming Rd. | Poor | 1 | Group 6 | Type C | 1 | |
| 219 | Yangshupu Rd. | Medium | 2 | Group 6 | Type C | 1 | |
| expert 10 | 231 | Ningguo Rd. | Good | 3 | Group 1 | Type A | 3 |
| 236 | Jiangpu Rd. | Medium | 2 | Group 4 | Type B | 2 | |
| 254 | Xuchang Rd. | Poor | 1 | Group 1 | Type A | 3 | |
| 259 | Jiangpu Rd. | Medium | 2 | Group 4 | Type B | 2 | |
| 294 | Xuchang Rd. | Medium | 2 | Group 1 | Type A | 3 | |
| 279 | Xuchang Rd. | Good | 3 | Group 2 | Type A | 3 | |
References
- Ewing, R.; Cervero, R. Travel and the built environment. Transp. Res. Rec. 2001, 1780, 87–114. [Google Scholar] [CrossRef]
- Handy, S.; Boarnet, M.; Ewing, R.; Killingsworth, R. How the built environment affects physical activity: Views from urban planning. Am. J. Prev. Med. 2002, 23, 64–73. [Google Scholar] [CrossRef]
- Pacione, M. Urban environmental quality and human wellbeing—A social geographical perspective. Landsc. Urban Plan. 2003, 65, 19–30. [Google Scholar] [CrossRef]
- Ewing, R.; Handy, S. Measuring the unmeasurable: Urban design qualities related to walkability. J. Urban Des. 2009, 14, 65–84. [Google Scholar] [CrossRef]
- Bahrainy, H.; Khosravi, H. The impact of urban design features and qualities on walkability and health in under-construction environments: The case of Hashtgerd New Town in Iran. Cities 2013, 31, 17–28. [Google Scholar] [CrossRef]
- Ding, D.; Gebel, K. Built environment, physical activity and obesity: What have we learned from reviewing the literature? Health Place 2012, 18, 100–105. [Google Scholar] [CrossRef]
- Rodríguez, D.A.; Brisson, E.M.; Estupiñán, N. The relationship between segment-level built environment attributes and pedestrian activity’around Bogota’s BRT stations. Transp. Res. Part D Transp. Environ. 2009, 14, 470–478. [Google Scholar] [CrossRef]
- Ewing, R.; Hajrasouliha, A.; Neckerman, K.M.; Purciel-Hill, M.; Greene, W. Streetscape features related to pedestrian activity. J. Plan. Educ. Res. 2016, 36, 5–15. [Google Scholar] [CrossRef]
- Park, K.; Ewing, R.; Sabouri, S.; Larsen, J. Street life and the built environment in an auto-oriented US region. Cities 2019, 88, 243–251. [Google Scholar] [CrossRef]
- Heath, G.W.; Ross, C.B.; Kruger, J.; Powell, K.E.; Ramsey, L.T. Task Force on Community Preventive Services. The Effectiveness of Urban Design and Land Use and Transport Policies and Practices to Increase Physical Activity: A Systematic Review. J. Phys. Act. Health 2006, 3, S55–S76. [Google Scholar] [CrossRef]
- Ameli, S.H.; Hamidi, S.; Garfinkel-Castro, A.; Ewing, R. Do better urban design qualities lead to more walking in Salt Lake City, Utah? J. Urban Des. 2015, 20, 393–410. [Google Scholar] [CrossRef]
- Saelens, B.E.; Handy, S.L. Built Environment Correlates of Walking: A Review. Med. Sci. Sports Exerc. 2008, 40, S550–S566. [Google Scholar] [CrossRef]
- Transport for London. Guide to the Healthy Streets Indicators. Available online: http://content.tfl.gov.uk/guide-to-the-healthy-streets-indicators.pdf (accessed on 5 April 2019).
- City of New York. Active Design Guidelines: Promoting Physical Activity and Health in Design. Available online: https://centerforactivedesign.org/dl/guidelines.pdf (accessed on 5 April 2019).
- Erath, A.; van Eggermond, M.; Ordonez, S. Modelling for Walkability: Understanding pedestrians’ preferences in Singapore. In Proceedings of the 14th International Conference on Travel Behavior Research, IVT, ETH Zurich, Zurich, Switzerland, 19–23 July 2015. [Google Scholar]
- Myer, D. Building Knowledge about Quality of Life for Urban Planning. J. Am. Plan. Assoc. 1988, 3, 347–358. [Google Scholar] [CrossRef]
- Yang, L.; Wang, B.; Zhou, J.; Wang, X. Walking accessibility and property prices. Transp. Res. Part D Transp. Environ. 2018, 62, 551–562. [Google Scholar] [CrossRef]
- Hillier, B.; Iida, S. Network effects and psychological effects: A theory of urban movement. In Proceedings of the 5th International Symposium on Space Syntax, TU Delft, Dutch, The Netherlands, 13–17 June 2005. [Google Scholar]
- Turner, A. From Axial to Road-Centre Lines: A New Representation for Space Syntax and a New Model of Route Choice for Transport Network Analysis. Environ. Plan. B Plan. Des. 1998, 34, 539–555. [Google Scholar] [CrossRef]
- Sarkar, C.; Gallacher, J.; Webster, C. Built environment configuration and change in body mass index: The Caerphilly Prospective Study (CaPS). Health Place 2013, 19, 33–44. [Google Scholar] [CrossRef] [PubMed]
- Sarkar, C.; Gallacher, J.; Webster, C. Urban built environment configuration and psychological distress in older men: Results from the Caerphilly study. BMC Public Health 2013, 13, 695. [Google Scholar] [CrossRef] [PubMed]
- Zhang, L.; Chiaradia, A.; Zhuang, Y. A configurational accessibility study of road and metro network in Shanghai, China. In Recent Developments in Chinese Urban Planning; Pan, Q., Cao, J., Eds.; Springer International Publishing: Cham, Switzerland, 2015; pp. 219–245. [Google Scholar]
- Shatu, F.; Yigitcanlar, T.; Bunker, J. Shortest path distance vs. least directional change: Empirical testing of space syntax and geographic theories concerning pedestrian route choice behaviour. J. Transp. Geogr. 2019, 74, 37–52. [Google Scholar] [CrossRef]
- Zhuang, Y.; Song, X. Combined impacts of configurational and compositional properties of street network on vehicular flow. In Proceedings of the 10th International Symposium on Space Syntax, UCL, London, UK, 13–17 July 2015. [Google Scholar]
- Sarkar, C.; Webster, C.; Pryor, M.; Tang, D.; Melbourne, S.; Zhang, X.; Liu, J. Exploring associations between urban green, street design and walking: Results from the Greater London boroughs. Landsc. Urban Plan. 2015, 143, 112–125. [Google Scholar] [CrossRef]
- Lu, Y.; Sarkar, C.; Xiao, Y. The effect of street-level greenery on walking behavior: Evidence from Hong Kong. Soc. Sci. Med. 2018, 208, 41–49. [Google Scholar] [CrossRef] [PubMed]
- Tang, J.; Long, Y. Measuring Visual Quality of Street Space and its Temporal Variation: Methodology and its Application in the Hutong Area in Beijing. Landsc. Urban Plan. 2018. [Google Scholar] [CrossRef]
- Jin, X.; Long, Y.; Sun, W.; Lu, Y.; Yang, X.; Tang, J. Evaluating Cities’ Vitatlity and Identifying Ghost Cities in China with Emerging Geographic Data. Cities 2017, 63, 98–109. [Google Scholar] [CrossRef]
- Ye, Y.; Li, D.; Liu, X. How block density and typology affect urban vitality: An exploratory analysis in Shenzhen, China. Urban Geogr. 2018, 39, 631–652. [Google Scholar] [CrossRef]
- Lynch, K. The Image of the City; MIT Press: Cambridge, MA, USA, 1960. [Google Scholar]
- Hedman, R.; Jaszewski, A. Fundamentals of Urban Design; American Planning Association: Chicago, IL, USA, 1984. [Google Scholar]
- White, W.H. The Social Life of Small Urban Spaces; The Conservation Foundation: Washington, DC, USA, 1980. [Google Scholar]
- Jacobs, J. The Death and Life of Great American Cities, Reissue ed.; Vintage: New York, NY, USA, 1992. [Google Scholar]
- Gehl, J. Life between the Buildings: Using Public Space; Danish Architectural Press: Copenhagen, Denmark, 2006. [Google Scholar]
- Ye, Y.; Richards, D.; Lu, Y.; Song, X.; Zhuang, Y.; Zeng, W.; Zhong, T. Measuring Daily Accessed Street Greenery: A Human-Scale Approach for Informing Better Urban Planning Practices. Landsc. Urban Plan. 2018. [Google Scholar] [CrossRef]
- Ye, Y.; van Nes, A. Quantitative tools in urban morphology: Combining space syntax, spacematrix and mixed-use index in a GIS framework. Urban Morphol. 2014, 18, 97–118. [Google Scholar]
- Ye, Y.; Yeh, A.; Zhuang, Y. Form Syntax as a contribution to geodesign—A morphological tool for urbanity making in urban design. Urban Des. Int. 2017, 22, 73–90. [Google Scholar] [CrossRef]
- Yue, Y.; Zhuang, Y.; Yeh, A.G.; Xie, J.Y.; Ma, C.L.; Li, Q.Q. Measurements of POI-based mixed use and their relationships with neighbourhood vibrancy. Int. J. Geogr. Inf. Sci. 2017, 31, 658–675. [Google Scholar] [CrossRef]
- Badrinarayanan, V.; Kendall, A.; Cipolla, R. Segnet: A deep convolutional encoder-decoder architecture for image segmentation. IEEE Trans. Pattern Anal. Mach. Intell. 2017, 39, 2481–2495. [Google Scholar] [CrossRef] [PubMed]
- Redmon, J.; Farhadi, A. YOLOv3: An incremental improvement. arXiv 2018, arXiv:1804.02767. [Google Scholar]
- Middel, A.; Lukasczyk, J.; Zakrzewski, S.; Arnold, M.; Maciejewski, R. Urban form and composition of street canyons: A human-centric big data and deep learning approach. Landsc. Urban Plan. 2019, 183, 122–132. [Google Scholar] [CrossRef]
- Reades, J.; De Souza, J.; Hubbard, P. Understanding urban gentrification through machine learning. Urban Stud. 2018, 56, 922–942. [Google Scholar] [CrossRef]
- Ewing, R. Characteristics, Causes and Effects of Sprawl: A Literature Review. In Urban Ecology: An International Perspective on the Interaction between Humans and Nature; Springer: Berlin/Heidelberg, Germany, 2008; pp. 519–535. [Google Scholar]
- Cervero, R.; Kockelman, K. Travel demand and the 3Ds: Density, diversity and design. Transp. Res. Part D Transp. Environ. 1997, 2, 199–219. [Google Scholar] [CrossRef]
- Ewing, R.; Cervero, R. Travel and the built environment: A meta-analysis. J. Am. Plan. Assoc. 2010, 76, 265–294. [Google Scholar] [CrossRef]
- Forsyth, A.; Oakes, J.M.; Schmitz, K.H.; Hearst, M. Does residential density increase walking and other physical activity? Urban Stud. 2007, 44, 679–697. [Google Scholar] [CrossRef]
- Niu, X.; Wu, W.; Li, M. Influence of Built Environment on Street Vitality and Its Spatiotemporal Characteristics Based on LBS Positioning Data. Urban Plan. Int. 2019, 34, 28–37. [Google Scholar] [CrossRef]
- Lu, Y.; Xiao, Y.; Ye, Y. Urban density, diversity and design: Is more always better for walking? A study from Hong Kong. Prev. Med. 2016, 103, 99–103. [Google Scholar] [CrossRef]
- Sun, G.; Zacgaruas, J.; Ma, B.; Reskovic, N.M. Beijing, How do metro stations integrate with walking environments? Results from walking access within three types of built environment in. Cities 2016, 56, 91–98. [Google Scholar] [CrossRef]
- Yang, L.; Zhou, J.; Shyr, O.F.; Huo, D. Does bus accessibility affect property prices? Cities 2019, 84, 56–65. [Google Scholar] [CrossRef]
- Lu, Y.; Sun, G.; Sarkar, C.; Gou, Z.; Xiao, Y. Commuting mode choice in a high-density city: Do land-use density and diversity matter in Hong Kong? Int. J. Environ. Res. Public Health 2018, 15, 920. [Google Scholar] [CrossRef] [PubMed]
- Lynch, K. Good City Form; MIT press: Cambridge, MA, USA, 1984. [Google Scholar]
- Frank, L.D.; Pivo, G. Impacts of mixed use and density on utilization of three modes of travel: Single-occupant vehicle, transit and walking. Transp. Res. Rec. 1994, 1466, 44–52. [Google Scholar]
- van Eggermond, M.; Erath, A. Quantifying Diversity: An assessment of diversity indices and an application to Singapore. FCL Mag. Spec. IssueUrban Breed. Grounds 2016. [Google Scholar] [CrossRef]
- Marcus, L. Spatial capital. J. Space Syntax 2010, 1, 30–40. [Google Scholar]
- Trancik, R. Finding Lost Space: Theories of Urban Design; Van Nostrand Reinhold Company Inc.: New York, NY, USA, 1986. [Google Scholar]
- Katz, P.; Scully, V.; Bressi, T.W. The New Urbanism: Toward an Architecture of Community; McGraw-Hill: New York, NY, USA, 1994. [Google Scholar]
- Montgomery, J. Making a city: Urbanity, vitality and urban design. J. Urban Des. 1998, 3, 93–116. [Google Scholar] [CrossRef]
- Gehl, J.; Kaefer, L.J.; Reigstad, S. Close encounters with buildings. Urban Des. Int. 2006, 11, 29–47. [Google Scholar] [CrossRef]
- Shimbel, A. Structural parameters of communication networks. Bull. Math. Biophys. 1953, 15, 501–507. [Google Scholar] [CrossRef]
- Chiaradia, A.; Crispin, C.; Webster, C. sDNA a Software for Spatial Design Network Analysis. Available online: www.cardiff.ac.uk/sdna/ (accessed on 5 April 2019).
- Cooper, C.; Chiaradia, A.; Webster, C. Spatial Design Network Analysis (+). Available online: www.cardiff.ac.uk/sdna/ (accessed on 3 May 2019).
- Durand, C.P.; Tang, X.; Gabriel, K.P.; Sener, I.N.; Oluyomi, A.O.; Knell, G.; Porter, A.K.; Hoelscher, D.M.; Kohl III, H.W. The association of trip distance with walking to reach public transit: Data from the California Household Travel Survey. J. Transp. Health 2016, 3, 154–160. [Google Scholar] [CrossRef]
- Szeto, W.Y.; Yang, L.; Wong, R.C.P.; Li, Y.C.; Wong, S.C. Spatio-temporal travel characteristics of the elderly in an ageing society. Travel Behav. Soc. 2017, 9, 10–20. [Google Scholar] [CrossRef]
- Shanghai Yangpu District Government. Neighborhood Beautification Special Work Plan of Yangpu District (2018–2020). Available online: http://www.shyp.gov.cn/zwgk/Home/Info?id=cfee6e5c-75d4-4d8d-ba37-a7298d314c48 (accessed on 5 April 2019).
- Naik, N.; Philipoom, J.; Raskar, R.; Hidalgo, C. Streetscore-redicting the Perceived Safety of One Million Streetscapes. In Proceedings of the IEEE Conference on Computer Vision and Pattern Recognition Workshops, Columbus, OH, USA, 23–28 June 2014. [Google Scholar]
- Liu, L.; Silva, E.A.; Wu, C.; Wang, H. A machine learning-based method for the large-scale evaluation of the qualities of the urban environment. Comput. Environ. Urban Syst. 2017, 65, 113–125. [Google Scholar] [CrossRef]
- Ye, Y.; Zeng, W.; Shen, Q.; Zhang, X.; Lu, Y. The visual quality of streets: A human-centred continous meausrement based on machine learning algorithms and street view images. Environ. Plan. B Urban Anal. City Sci. 2019, in press. [Google Scholar]
- Vernez-Moudon, A. Public Streets for Public Use; Van Nostrand Reinhold: New York, NY, USA, 1987. [Google Scholar]
- Gehl, J.; Gemzøe, L. Public Spaces Public Life; Arkitektens Forlag: Copenhagen, Denmark, 1996. [Google Scholar]
- Southworth, M.; Ben-Joseph, E. Streets and the Shaping of Towns and Cities; McGrawHill: New York, NY, USA, 1997. [Google Scholar]
- Gehl, J.; Gemzøe, L. New City Spaces; The Danish Architectural Press: Copenhagen, Denmark, 2000. [Google Scholar]
- Porta, S.; Renne, J.L. Linking urban design to sustainability: Formal indicators of social urban sustainability field research in Perth, Western Australia. Urban Des. Int. 2005, 10, 51–64. [Google Scholar] [CrossRef]
- Gehl, J. Cities for People; Island press: Washington, DC, USA, 2010. [Google Scholar]
- Baidu Maps API. Available online: http://developer.baidu.com/map/reference/ (accessed on 15 February 2019).
- Long, Y.; Liu, L. How green are the streets? An analysis for central areas of Chinese cities using Tencent Street View. PLoS ONE 2017, 12, e0171110. [Google Scholar] [CrossRef]
- Elo, A. The Rating of Chessplayers, Past and Present; Arco Publishing Company: New York, NY, USA, 1978. [Google Scholar]
- Schalkoff, R. Artificial Neural Networks; McGraw-Hill: New York, NY, USA, 1997. [Google Scholar]
- Galster, G. On the nature of neighbourhood. Urban Stud. 2001, 38, 2111–2124. [Google Scholar] [CrossRef]
- Spellerberg, I.F.; Fedor, P.J. A tribute to Claude Shannon (1916–2001) and a plea for more rigorous use of species richness, species diversity and the ‘Shannon–Wiener’ Index. Glob. Ecol. Biogeogr. 2003, 12, 177–179. [Google Scholar] [CrossRef]
- Zhang, X.S. How do people understand convenience-of-living in cities? A multiscale geographic investigation in Beijing. Isprs J. Photogramm. Remote Sens. 2019, 148, 87–102. [Google Scholar] [CrossRef]
- Freeman, L.C. A set of measures of centrality based on betweenness. Sociometry 1997, 40, 35–41. [Google Scholar] [CrossRef]
- Calthorpe, P. The Next American Metropolis: Ecology, Community and the American Dream; Princeton Architectural Press: New York, NY, USA, 1993. [Google Scholar]
- Cooper, C.; Harvey, I.; Orford, S.; Chiaradia, A. Testing the ability of Multivariate Hybrid Spatial Network Analysis to predict the effect of a major urban redevelopment on pedestrian flows. arXiv 2018, arXiv:1803.10500. [Google Scholar]
- Zhang, L.; Chiaradia, A. Three-dimensional Spatial Network Analysis and Its Application in a High Density City Area, Central Hong Kong. Urban Plan. Int. 2019, 33, 46–53. [Google Scholar] [CrossRef]
- Shanghai Urban Planning and Design Research Institute. The Selected Works of Shanghai Urban Planning and Design Institute; China Architecture & Building Press: Beijing, China, 2010. [Google Scholar]
- Shanghai Bureau of Planning and Natural Resources. Shanghai Street Design Guidelines. Available online: http://www.shgtj.gov.cn/zcfg/zhl/201610/t20161019_696909.html (accessed on 5 April 2019).
- Ewing, R.; Clemente, O. Measuring Urban Design; Island Press: Washington, DC, USA, 2013. [Google Scholar]
- Shanghai Municipal People’s Government. Thirteenth Five Year Plan of both sides of Huangpu River. Available online: http://www.shdrc.gov.cn/wcm.files/upload/CMSshfgw/201706/201706050321045.pdf (accessed on 5 April 2019).


| Type A: Clusters 1, 2, 3 (558 of 1231, 45%), High Quality | Type B: Cluster 4 (168 of 1231, 14%), Medium Quality | Type C: Clusters 5, 6, 7 (505 of 1231, 41%), Poor Quality |
|---|---|---|
 |  |  |
 |  |  |
| Agreement | Expected Agreement | Weighted Kappa | Std. Err. | Z | Prob > Z |
|---|---|---|---|---|---|
| 84.17% | 54.61% | 0.6512 | 0.0988 | 6.59 | 0.0000 |
© 2019 by the authors. Licensee MDPI, Basel, Switzerland. This article is an open access article distributed under the terms and conditions of the Creative Commons Attribution (CC BY) license (http://creativecommons.org/licenses/by/4.0/).
Share and Cite
Zhang, L.; Ye, Y.; Zeng, W.; Chiaradia, A. A Systematic Measurement of Street Quality through Multi-Sourced Urban Data: A Human-Oriented Analysis. Int. J. Environ. Res. Public Health 2019, 16, 1782. https://doi.org/10.3390/ijerph16101782
Zhang L, Ye Y, Zeng W, Chiaradia A. A Systematic Measurement of Street Quality through Multi-Sourced Urban Data: A Human-Oriented Analysis. International Journal of Environmental Research and Public Health. 2019; 16(10):1782. https://doi.org/10.3390/ijerph16101782
Chicago/Turabian StyleZhang, Lingzhu, Yu Ye, Wenxin Zeng, and Alain Chiaradia. 2019. "A Systematic Measurement of Street Quality through Multi-Sourced Urban Data: A Human-Oriented Analysis" International Journal of Environmental Research and Public Health 16, no. 10: 1782. https://doi.org/10.3390/ijerph16101782