Effect of Sewage Irrigation on the CT-Measured Soil Pore Characteristics of a Clay Farmland in Northern China

Abstract
:1. Introduction
2. Materials and Methods
2.1. Study Site Description
2.2. Soil Sampling and Analysis
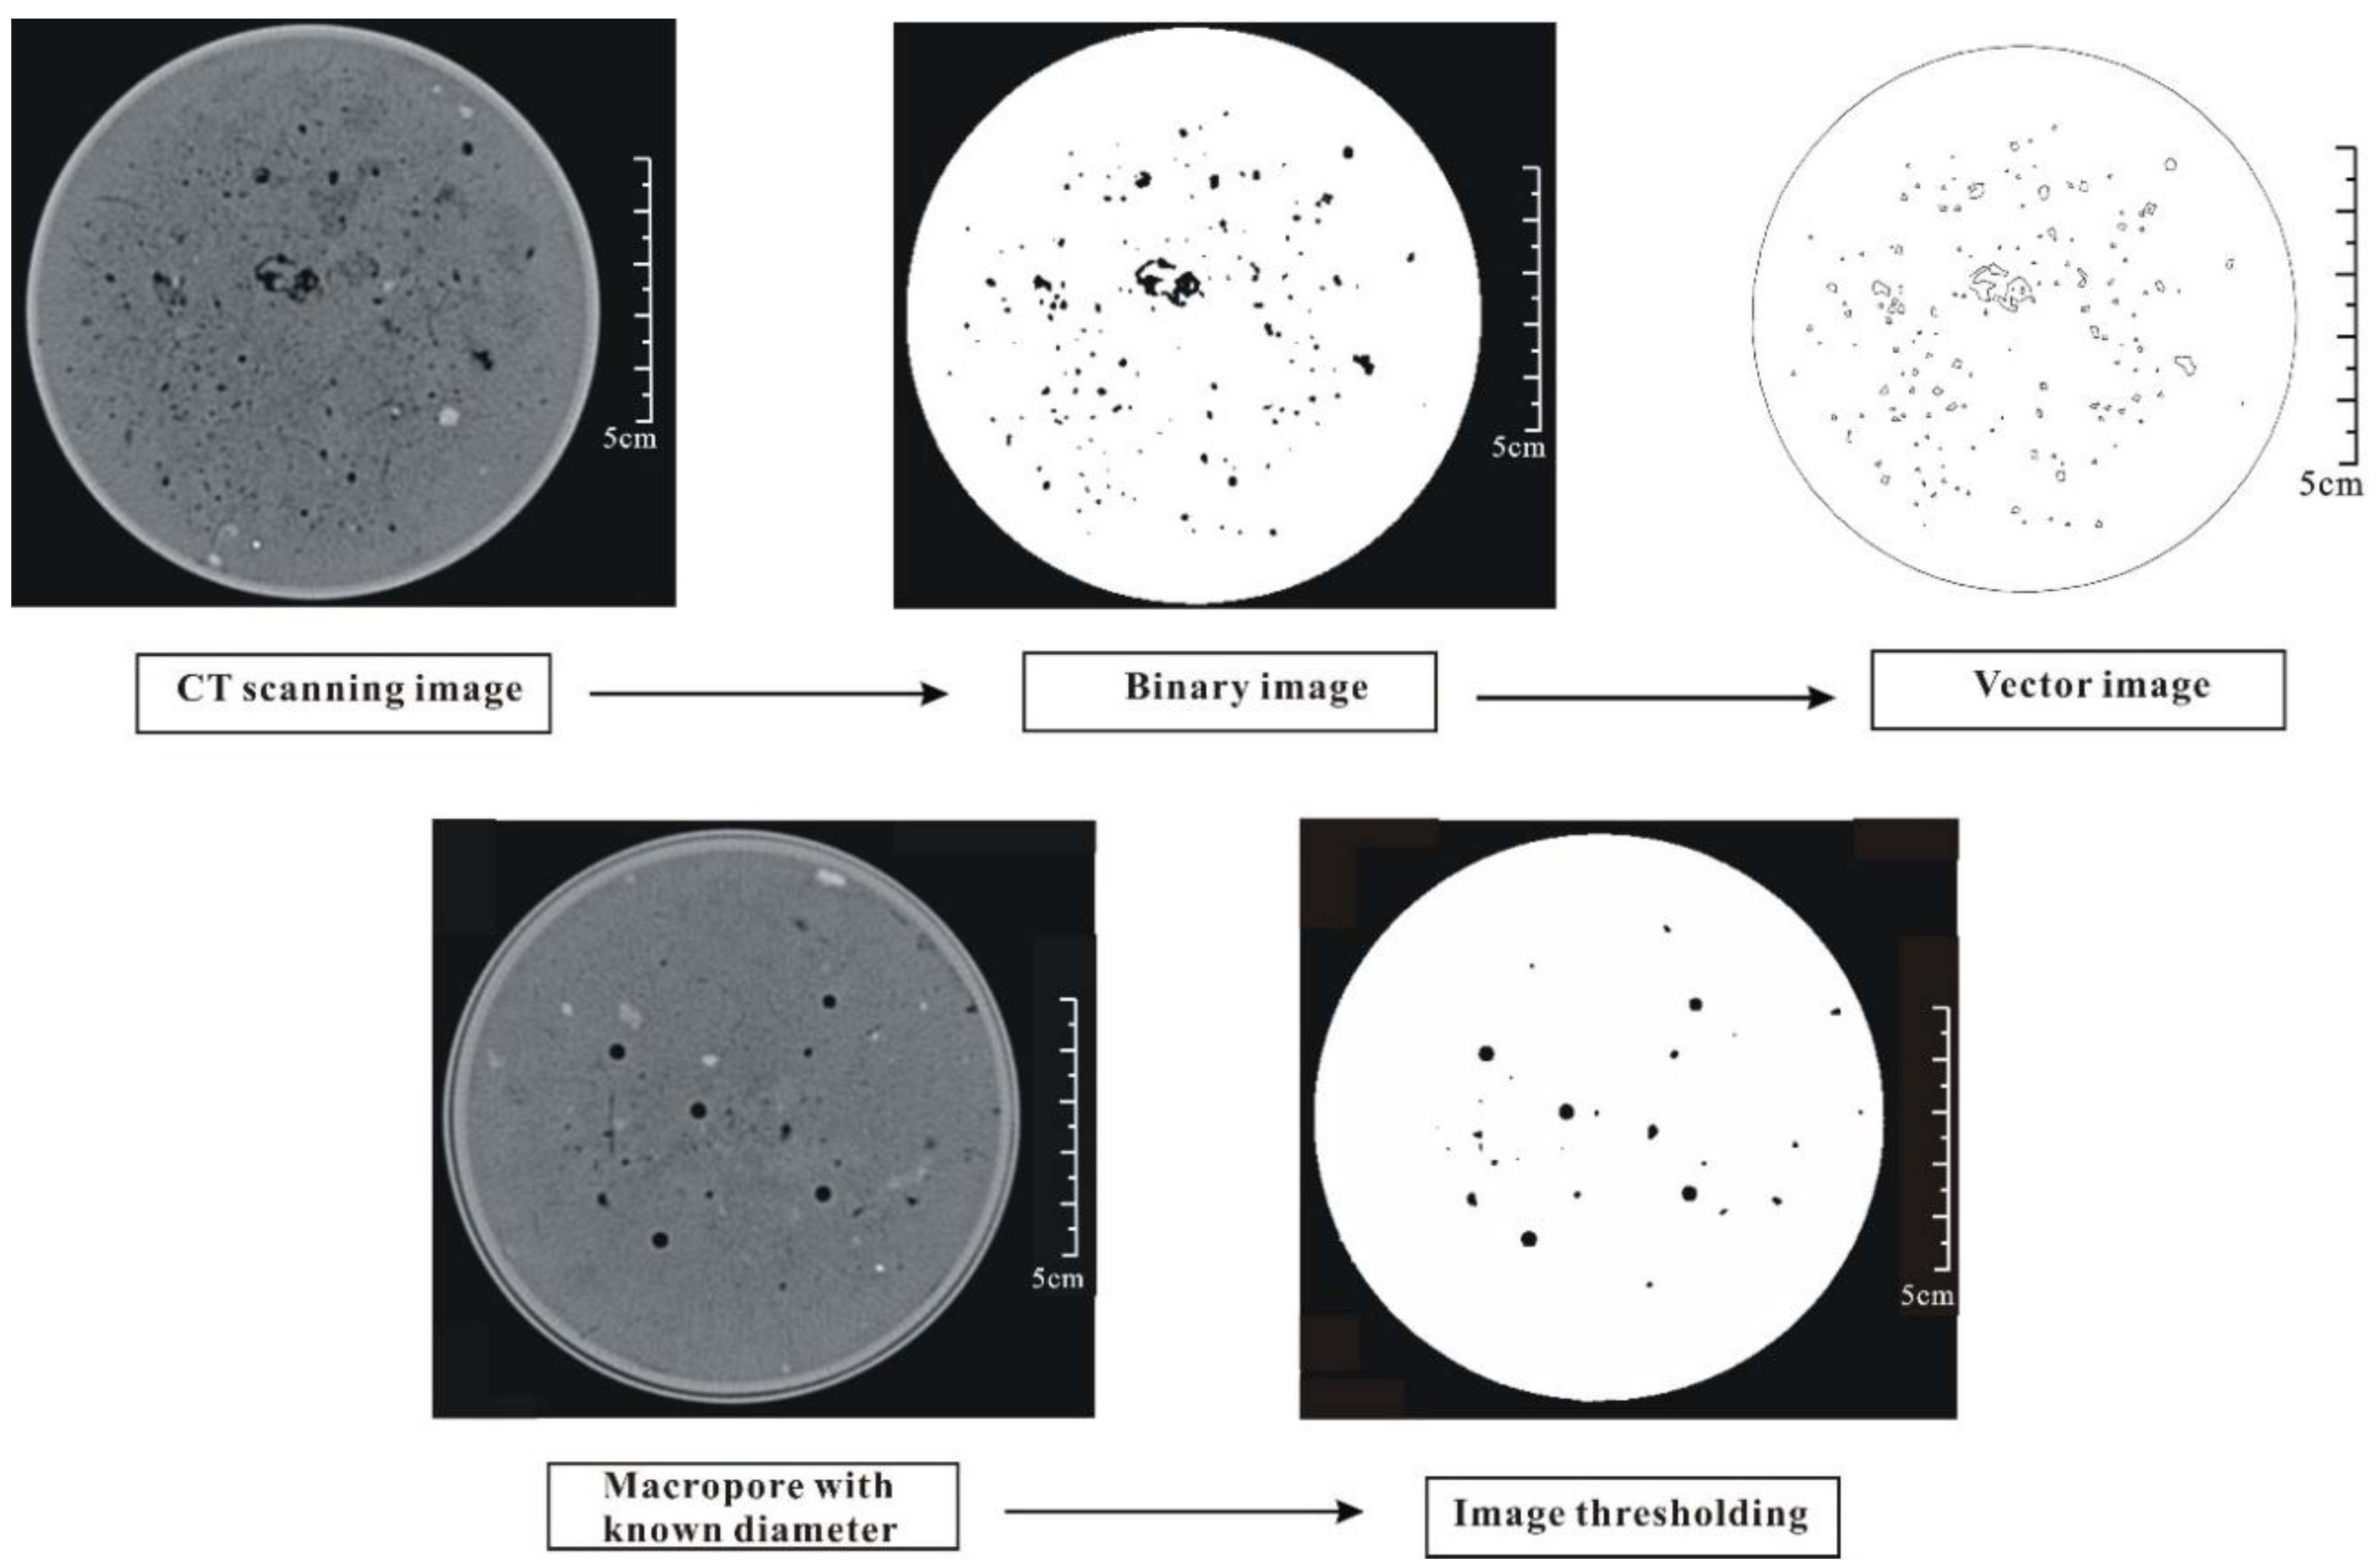
2.3. Quantification of Soil Pores Using CT
2.4. Statistical Analysis
3. Results
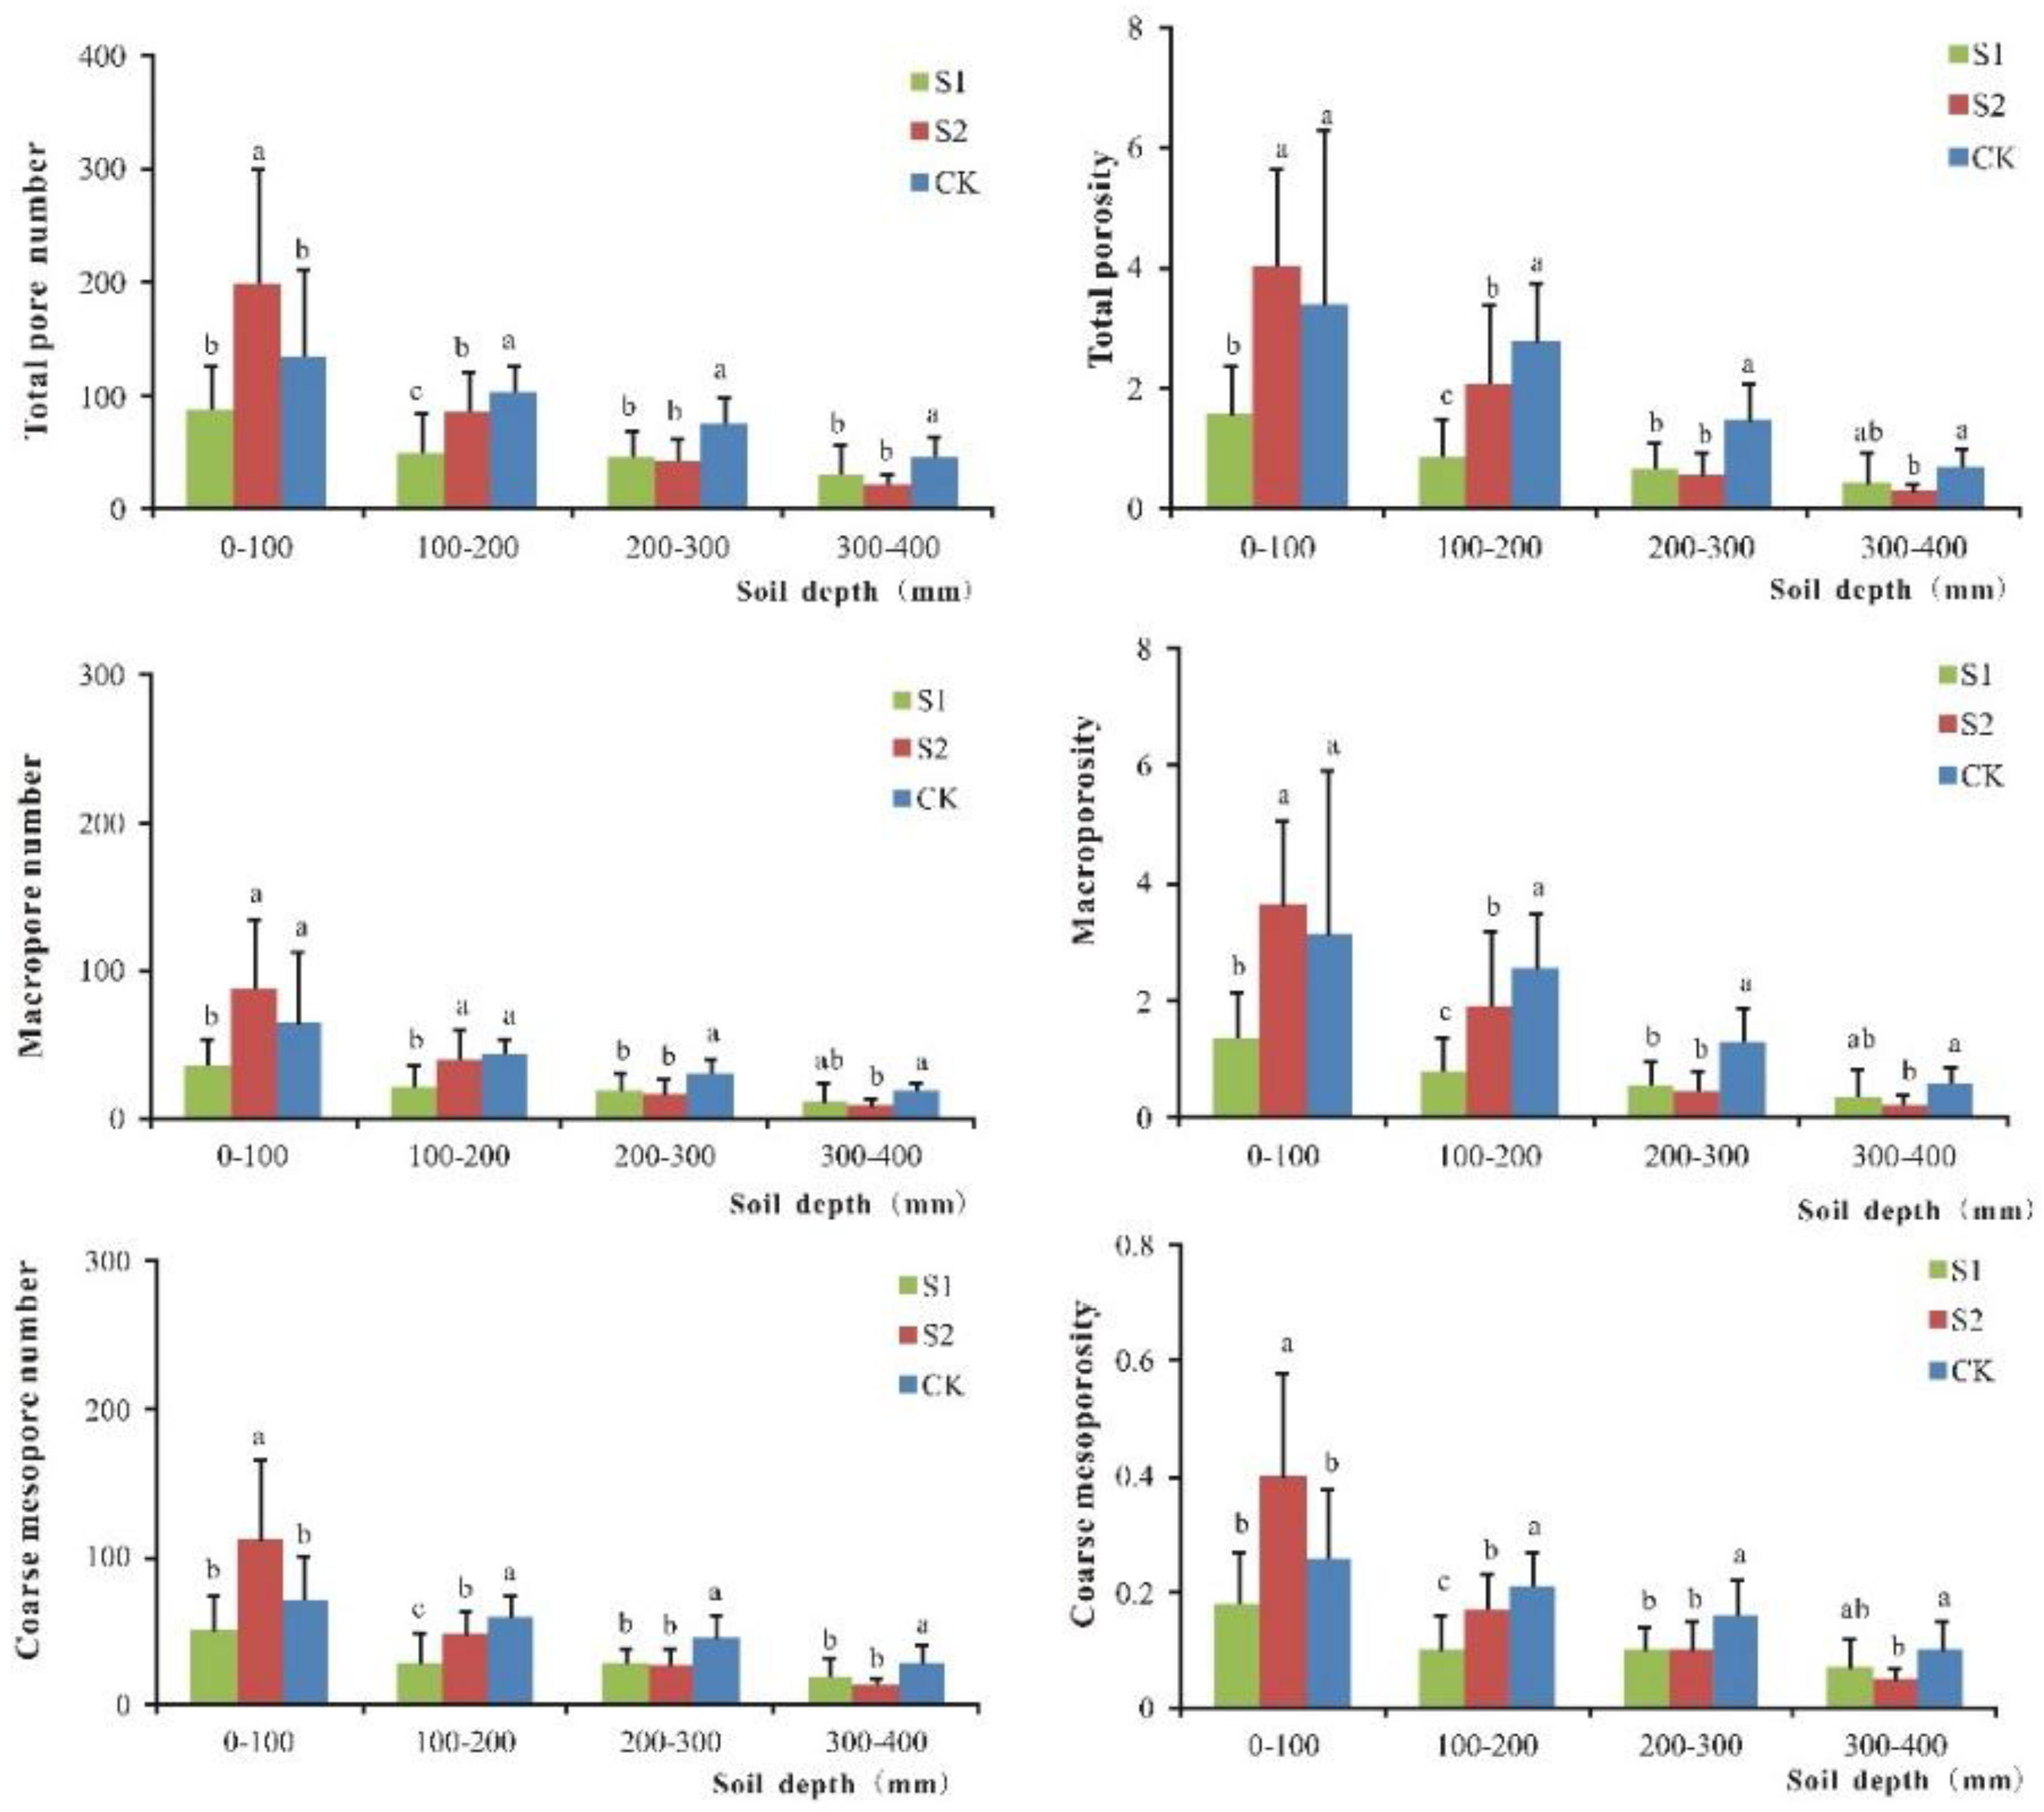
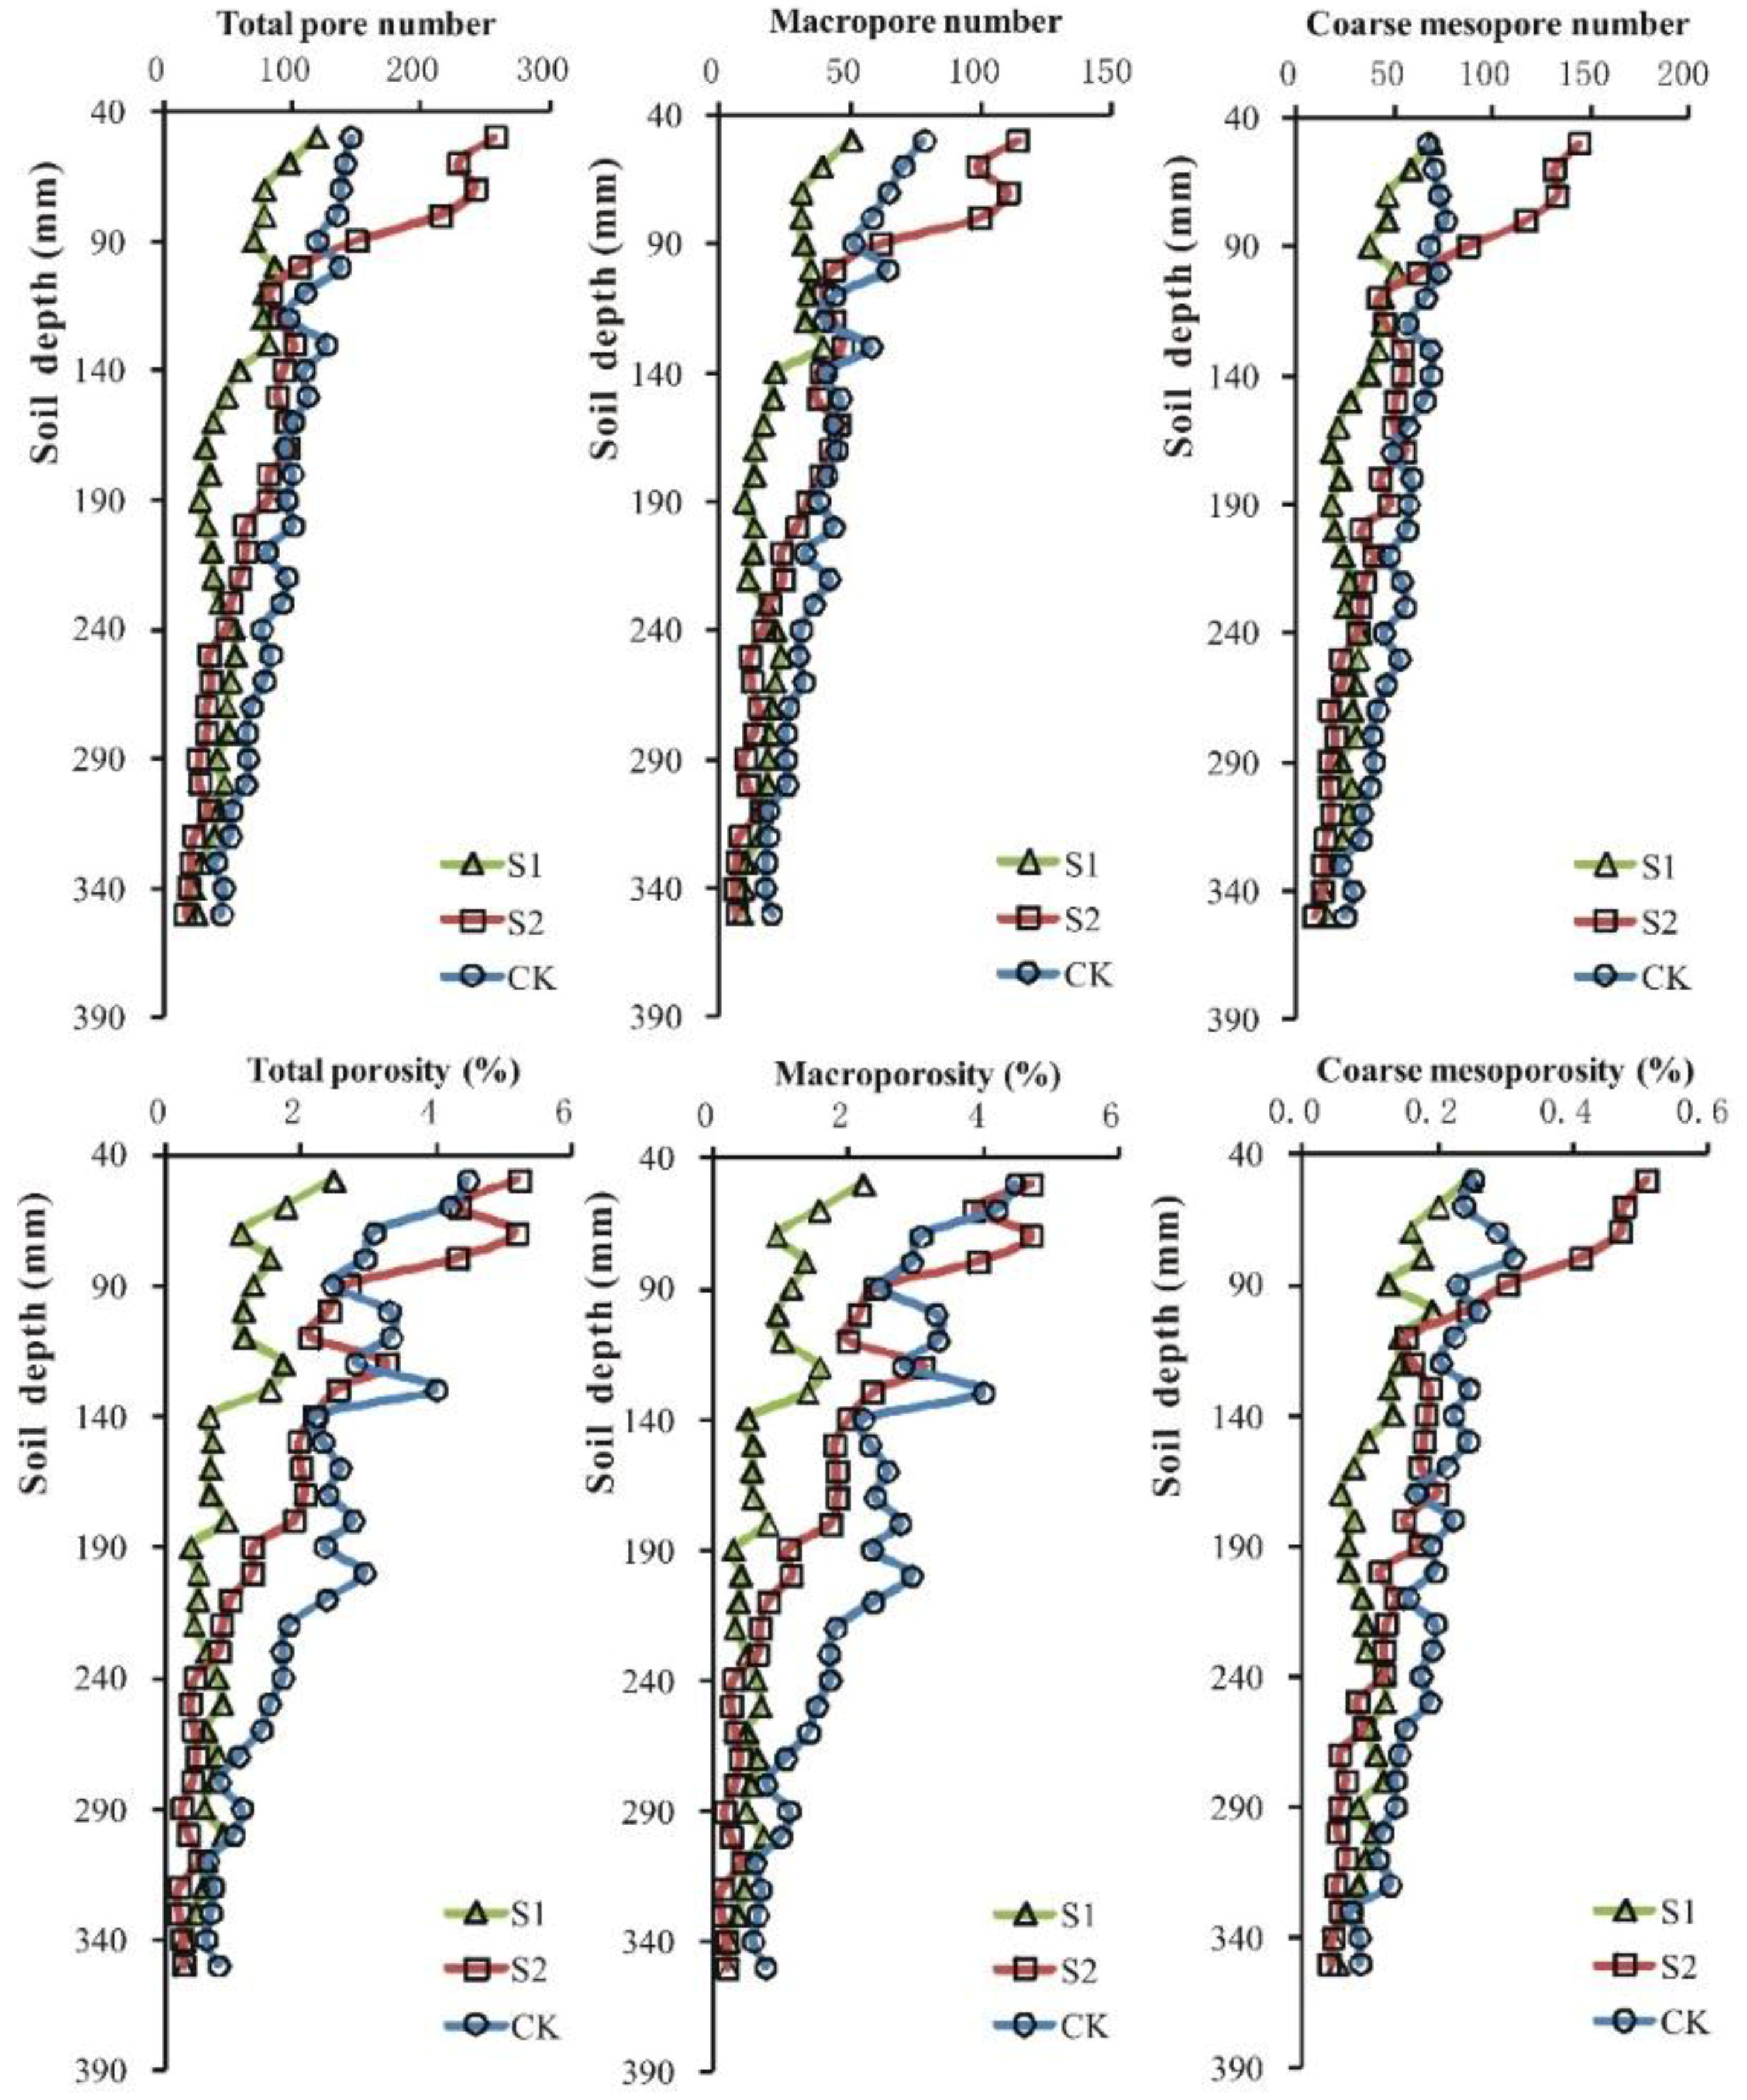
3.1. Pore Number
3.2. Porosity
3.3. Circularity
3.4. Relationships between Soil Pore Features and Soil Properties
4. Discussion
5. Conclusions
Supplementary Materials
Author Contributions
Acknowledgments
Conflicts of Interest
References
- Hamilton, A.J.; Stagnitti, F.; Xiong, X.; Kreidl, S.L.; Benke, K.K.; Maher, P. Wastewater irrigation: The state of play. Vadose Zone J. 2007, 6, 823–840. [Google Scholar] [CrossRef]
- Murtaza, G.; Ghafoor, A.; Qadir, M.; Owens, G.; Aziz, M.A.; Zia, M.H. Disposal and Use of Sewage on Agricultural Lands in Pakistan: A Review. Pedosphere 2010, 20, 23–34. [Google Scholar] [CrossRef]
- Pedrero, F.; Kalavrouziotis, I.; Jose Alarcon, J.; Koukoulakis, P.; Asano, T. Use of treated municipal wastewater in irrigated agriculture-Review of some practices in Spain and Greece. Agric. Water Manag. 2010, 97, 1233–1241. [Google Scholar] [CrossRef]
- Meena, R.; Datta, S.P.; Golui, D.; Dwivedi, B.S.; Meena, M.C. Long-term impact of sewage irrigation on soil properties and assessing risk in relation to transfer of metals to human food chain. Environ. Sci. Pollut. Res. 2016, 23, 14269–14283. [Google Scholar] [CrossRef] [PubMed]
- Shilpi, S.; Seshadri, B.; Sarkar, B.; Bolan, N.; Lamb, D.; Naidu, R. Comparative values of various wastewater streams as a soil nutrient source. Chemosphere 2018, 192, 272–281. [Google Scholar] [CrossRef] [PubMed]
- Deshmukh, S.K.; Singh, A.K.; Datta, S.P.; Annapurna, K. Impact of long-term wastewater application on microbiological properties of vadose zone. Environ. Monit. Assess. 2011, 175, 601–612. [Google Scholar] [CrossRef] [PubMed]
- Rezapour, S.; Samadi, A. Soil quality response to long-term wastewater irrigation in Inceptisols from a semi-arid environment. Nutr. Cycl. Agroecosyst. 2011, 91, 269–280. [Google Scholar] [CrossRef]
- Tunc, T.; Sahin, U. The changes in the physical and hydraulic properties of a loamy soil under irrigation with simpler-reclaimed wastewaters. Agric. Water Manag. 2015, 158, 213–224. [Google Scholar] [CrossRef]
- Lucho-Constantino, C.A.; Alvarez-Suarez, M.; Beltran-Hernandez, R.I.; Prieto-Garcia, F.; Poggi-Varaldo, H.M. A multivariate analysis of the accumulation and fractionation of major and trace elements in agricultural soils in Hidalgo State, Mexico irrigated with raw wastewater. Environ. Int. 2005, 31, 313–323. [Google Scholar] [CrossRef] [PubMed]
- Wang, F.; Li, C.; Wang, J.; Cao, W.; Wu, Q. Concentration estimation of heavy metal in soils from typical sewage irrigation area of Shandong Province, China using reflectance spectroscopy. Environ. Sci. Pollut. Res. 2017, 24, 16883–16892. [Google Scholar] [CrossRef] [PubMed]
- Meng, W.; Wang, Z.; Hu, B.; Wang, Z.; Li, H.; Goodman, R.C. Heavy metals in soil and plants after long-term sewage irrigation at Tianjin China: A case study assessment. Agric. Water Manag. 2016, 171, 153–161. [Google Scholar] [CrossRef]
- Liu, B.; Ma, X.; Ai, S.; Zhu, S.; Zhang, W.; Zhang, Y. Spatial distribution and source identification of heavy metals in soils under different land uses in a sewage irrigation region, northwest China. J. Soils Sediments 2016, 16, 1547–1556. [Google Scholar] [CrossRef]
- Chen, L.; Feng, Q.; Li, C.; Wei, Y.; Zhao, Y.; Feng, Y.; Zheng, H.; Li, F.; Li, H. Impacts of aquaculture wastewater irrigation on soil microbial functional diversity and community structure in arid regions. Sci. Rep. 2017, 7, 11193. [Google Scholar] [CrossRef] [PubMed]
- Arif, M.S.; Riaz, M.; Shahzad, S.M.; Yasmeen, T.; Buttler, A.; Garcıa-Gil, J.C.; Roohi, M.; Rasool, A. Contrasting effects of untreated textile wastewater onto the soil available nitrogen-phosphorus and enzymatic activities in Aridisol. Environ. Monit. Assess. 2016, 188. [Google Scholar] [CrossRef] [PubMed]
- Roohi, M.; Riaz, M.; Arif, M.S.; Shahzad, S.M.; Yasmeen, T.; Ashraf, M.A.; Riaz, M.A.; Mian, I.A. Low C/N ratio raw textile wastewater reduced labile C and enhanced organic-inorganic N and enzymatic activities in a semiarid alkaline soil. Environ. Sci. Pollut. Res. 2017, 24, 3456–3469. [Google Scholar] [CrossRef] [PubMed]
- Chen, J.; Tang, C.; Yu, J. Use of O-18, H-2 and N-15 to identify nitrate contamination of groundwater in a wastewater irrigated field near the city of Shijiazhuang, China. J. Hydrol. 2006, 326, 367–378. [Google Scholar] [CrossRef]
- Yadav, R.K.; Minhas, P.S.; Lal, K.; Chaturvedi, R.K.; Yadav, G.; Verma, T.P. Accumulation of Metals in Soils, Groundwater and Edible Parts of Crops Grown Under Long-Term Irrigation with Sewage Mixed Industrial Effluents. Bull. Environ. Contam. Toxicol. 2015, 95, 200–206. [Google Scholar] [CrossRef] [PubMed]
- Mandal, U.K.; Warrington, D.N.; Bhardwaj, A.K.; Bar-Tal, A.; Kautsky, L.; Minz, D.; Levy, G.J. Evaluating impact of irrigation water quality on a calcareous clay soil using principal component analysis. Geoderma 2008, 144, 189–197. [Google Scholar] [CrossRef]
- Lado, M.; Ben-Hur, M. Treated domestic sewage irrigation effects on soil hydraulic properties in arid and semiarid zones: A review. Soil Tillage Res. 2009, 106, 152–163. [Google Scholar] [CrossRef]
- Gantzer, C.J.; Anderson, S.H. Computed tomographic measurement of macroporosity in chisel-disk and no-tillage seedbeds. Soil Tillage Res. 2002, 64, 101–111. [Google Scholar] [CrossRef]
- Luo, L.; Lin, H.; Li, S. Quantification of 3-D soil macropore networks in different soil types and land uses using computed tomography. J. Hydrol. 2010, 393, 53–64. [Google Scholar] [CrossRef]
- Udawatta, R.P.; Anderson, S.H. CT-measured pore characteristics of surface and subsurface soils influenced by agroforestry and grass buffers. Geoderma 2008, 145, 381–389. [Google Scholar] [CrossRef]
- Meng, C.; Niu, J.; Li, X.; Luo, Z.; Du, X.; Du, J.; Lin, X.; Yu, X. Quantifying soil macropore networks in different forest communities using industrial computed tomography in a mountainous area of North China. J. Soils Sediments 2017, 17, 2357–2370. [Google Scholar] [CrossRef]
- Hu, X.; Li, Z.; Li, X.; Liu, Y. Influence of shrub encroachment on CT-measured soil macropore characteristics in the Inner Mongolia grassland of northern China. Soil Tillage Res. 2015, 150, 1–9. [Google Scholar] [CrossRef]
- Zhang, Y.; Zhao, W.; Fu, L. Soil macropore characteristics following conversion of native desert soils to irrigated croplands in a desert-oasis ecotone, Northwest China. Soil Tillage Res. 2017, 168, 176–186. [Google Scholar] [CrossRef]
- Pires, L.F. Gamma-ray computed tomography to evaluate changes in the structure of a clayey soil due to agricultural traffic. Acta Sci. Agron. 2011, 33, 411–416. [Google Scholar] [CrossRef]
- Li, T.C.; Shao, M.A.; Jia, Y.H. Application of X-ray tomography to quantify macropore characteristics of loess soil under two perennial plants. Eur. J. Soil Sci. 2016, 67, 266–275. [Google Scholar] [CrossRef]
- Kumar, S.; Anderson, S.H.; Udawatta, R.P. Agroforestry and Grass Buffer Influences on Macropores Measured by Computed Tomography under Grazed Pasture Systems. Soil Sci. Soc. Am. J. 2010, 74, 203–212. [Google Scholar] [CrossRef]
- Halliwell, D.J.; Barlow, K.M.; Nash, D.M. A review of the effects of wastewater sodium on soil physical properties and their implications for irrigation systems. Soil Res. 2001, 39, 1259–1267. [Google Scholar] [CrossRef]
- Zhang, Y.; Zhou, A.; Zhou, J.; Liu, C.; Cai, H.; Liu, Y.; Xu, W. Evaluating the Sources and Fate of Nitrate in the Alluvial Aquifers in the Shijiazhuang Rural and Suburban Area, China: Hydrochemical and Multi-Isotopic Approaches. Water 2015, 7, 1515–1537. [Google Scholar] [CrossRef]
- Zhou, J.; Zhang, Y.; Zhou, A.; Liu, C.; Cai, H.; Liu, Y. Application of hydrochemistry and stable isotopes (δ34S, δ18O and δ37Cl) to trace natural and anthropogenic influences on the quality of groundwater in the piedmont region, Shijiazhuang, China. Appl. Geochem. 2016, 71, 63–72. [Google Scholar] [CrossRef]
- Li, J.; Li, Y.C.; Zhang, Z.; Li, Y.; Wang, C.Y. The dispersion characteristics of airborne pollen in the Shijiazhuang (China) urban area and its relationship with meteorological factors. Aerobiologia 2018, 34, 89–104. [Google Scholar] [CrossRef]
- Yang, P.G.; Yang, M.; Mao, R.Z.; Byrne, J.M. Impact of Long-Term Irrigation with Treated Sewage on Soil Magnetic Susceptibility and Organic Matter Content in North China. Bull. Environ. Contam. Toxicol. 2015, 95, 102–107. [Google Scholar] [CrossRef] [PubMed]
- Hu, Y.; Moiwo, J.P.; Yang, Y.; Han, S.; Yang, Y. Agricultural water-saving and sustainable groundwater management in Shijiazhuang Irrigation District, North China Plain. J. Hydrol. 2010, 393, 219–232. [Google Scholar] [CrossRef]
- Cui, X.; Luan, W.; Shi, S.; Li, S.; Song, Z.; Ma, Z. Soil heavy metal pollution assessment in the sewage irrigation region of Shijiazhuang city. Earth Environ. 2010, 36–42. [Google Scholar] [CrossRef]
- Liu, X.; Tang, L.; Yang, L.; Zhang, X.; Wang, L.; Yu, F.; Liu, Y.; Chen, Q.; Liu, D. Genotoxicity Evaluation of Irrigative Wastewater from Shijiazhuang City in China. PLoS ONE 2015, 10, e144729. [Google Scholar] [CrossRef] [PubMed]
- Yu, M.; Zhang, H.; He, X.; Tan, W.; Zhang, Y.; Ma, L.; Xi, B.; Dang, Q.; Gao, R. Spectral Characteristic of Dissolved Organic Matter in Xiaohe River, Hebei. Huan Jing Ke Xue/Huanjing Kexue 2015, 36, 3194–3202. [Google Scholar] [PubMed]
- Lu, R.K. Chemical Analysis Methods of Agricultural Soil; China Agricultural Science and Technology Press: Beijing, China, 2000. [Google Scholar]
- Bao, S.D. Soil Agro-Chemical Analysis, 3rd ed.; China Agricultural Press: Beijing, China, 2000. [Google Scholar]
- Lin, X.G. Principles and Methods of Soil Microbial Research; Higher Education Press: Beijing, China, 2010. [Google Scholar]
- Feng, J.; Mang, J.B.; Zhu, A.N.; Bi, J.W. Soil macropore structure characterized by X-ray computed tomography. Pedosphere 2003, 13, 289–298. [Google Scholar]
- Liu, D.; Wang, Y.; Zhang, X.; Si, Q. Effect of sewage irrigation on wheat growth and its activate oxygen metabolism. Ying Yong Sheng Tai Xue Bao/J. Appl. Ecol. 2002, 13, 1319–1322. [Google Scholar]
- Lucho-Constantino, C.A.; Prieto-Garcia, F.; Del Razo, L.M.; Rodriguez-Vazquez, R.; Poggi-Varaldo, H.M. Chemical fractionation of boron and heavy metals in soils irrigated with wastewater in central Mexico. Agric. Ecosyst. Environ. 2005, 108, 57–71. [Google Scholar] [CrossRef]
- Guo, X.; Ma, T.; Chen, L.; Cui, Y.; Du, P.; Liao, Y. Microbial quantities and enzyme activity in soil irrigated with sewage for different lengths of time. Ecotoxicology 2014, 23, 2062–2068. [Google Scholar] [CrossRef] [PubMed]
- Helmhart, M.; O’Day, P.A.; Garciaguinea, J.; Serrano, S.; Garrido, F. Arsenic, Copper, and Zinc Leaching through Preferential Flow in Mining-Impacted Soils. Soil Sci. Soc. Am. J. 2011, 76, 449–462. [Google Scholar] [CrossRef]


| Sites | Position | Crop Type | Sewage Irrigation Time (Years) |
|---|---|---|---|
| S1 | N 37°58′26.2′′, E 114°32′34.2′′ | Corn | 25 |
| S2 | N 37°58′, E 114°31′41.1′′ | Corn | 52 |
| CK | N 37°57′36.4′′, E 114°32′30.3′′ | Corn | 0 |
| Properties | Depth (mm) | S1 | S2 | CK | |||||||||
|---|---|---|---|---|---|---|---|---|---|---|---|---|---|
| Mean | Max. | Min. | CV | Mean | Max. | Min. | CV | Mean | Max. | Min. | CV | ||
| Total pore number | 50–100 | 88 | 165 | 23 | 0.44 | 200 | 355 | 70 | 0.50 | 136 | 292 | 58 | 0.56 |
| 100–200 | 51 | 124 | 16 | 0.65 | 87 | 149 | 38 | 0.40 | 104 | 163 | 70 | 0.21 | |
| 200–300 | 47 | 99 | 14 | 0.47 | 43 | 84 | 7 | 0.47 | 77 | 123 | 45 | 0.29 | |
| 300–350 | 31 | 83 | 9 | 0.83 | 23 | 44 | 15 | 0.38 | 47 | 78 | 19 | 0.38 | |
| Macropore number | 50–100 | 37 | 78 | 8 | 0.49 | 88 | 163 | 24 | 0.53 | 65 | 166 | 18 | 0.74 |
| 100–200 | 22 | 59 | 5 | 0.68 | 40 | 80 | 14 | 0.53 | 44 | 66 | 25 | 0.25 | |
| 200–300 | 19 | 45 | 2 | 0.63 | 17 | 33 | 1 | 0.59 | 31 | 55 | 11 | 0.29 | |
| 300–350 | 12 | 40 | 1 | 1.08 | 9 | 22 | 3 | 0.56 | 19 | 29 | 10 | 0.32 | |
| Coarse mesopore number | 50–100 | 51 | 87 | 15 | 0.44 | 112 | 192 | 43 | 0.48 | 71 | 126 | 34 | 0.43 |
| 100–200 | 29 | 73 | 3 | 0.69 | 48 | 72 | 23 | 0.33 | 60 | 98 | 41 | 0.24 | |
| 200–300 | 28 | 54 | 12 | 0.38 | 27 | 52 | 5 | 0.45 | 46 | 77 | 25 | 0.32 | |
| 300–350 | 20 | 45 | 7 | 0.65 | 14 | 22 | 9 | 0.29 | 29 | 53 | 9 | 0.44 | |
| Total porosity (%) | 50–100 | 1.56 | 3.94 | 0.45 | 0.53 | 4.03 | 6.93 | 1.07 | 0.40 | 3.41 | 10.11 | 0.86 | 0.84 |
| 100–200 | 0.88 | 2.39 | 0.21 | 0.73 | 2.07 | 5.83 | 0.46 | 0.64 | 2.77 | 5.46 | 0.92 | 0.35 | |
| 200–300 | 0.66 | 1.60 | 0.10 | 0.67 | 0.55 | 1.42 | 0.05 | 0.71 | 1.46 | 2.59 | 0.43 | 0.42 | |
| 300–350 | 0.44 | 1.47 | 0.05 | 1.14 | 0.28 | 0.69 | 0.10 | 0.57 | 0.68 | 1.24 | 0.18 | 0.49 | |
| Macroposity (%) | 50–100 | 1.37 | 3.63 | 0.42 | 0.55 | 3.63 | 6.31 | 0.89 | 0.40 | 3.14 | 9.67 | 0.64 | 0.89 |
| 100–200 | 0.78 | 2.18 | 0.15 | 0.77 | 1.90 | 5.58 | 0.35 | 0.67 | 2.56 | 5.13 | 0.74 | 0.37 | |
| 200–300 | 0.56 | 1.45 | 0.04 | 0.73 | 0.46 | 1.26 | 0.03 | 0.76 | 1.30 | 2.45 | 0.30 | 0.45 | |
| 300–350 | 0.37 | 1.32 | 0.01 | 1.22 | 0.23 | 0.62 | 0.05 | 0.70 | 0.58 | 1.13 | 0.17 | 0.52 | |
| Coarse mesoporosity (%) | 50–100 | 0.18 | 0.34 | 0.04 | 0.46 | 0.40 | 0.72 | 0.18 | 0.45 | 0.26 | 0.49 | 0.11 | 0.50 |
| 100–200 | 0.10 | 0.22 | 0.01 | 0.29 | 0.17 | 0.28 | 0.07 | 0.35 | 0.21 | 0.35 | 0.12 | 0.60 | |
| 200–300 | 0.10 | 0.19 | 0.04 | 0.38 | 0.10 | 0.19 | 0.01 | 0.50 | 0.16 | 0.27 | 0.08 | 0.40 | |
| 300–350 | 0.07 | 0.17 | 0.02 | 0.50 | 0.05 | 0.08 | 0.03 | 0.40 | 0.10 | 0.20 | 0.01 | 0.71 | |
| Circularity | 50–100 | 0.64 | 0.66 | 0.61 | 0.022 | 0.64 | 0.69 | 0.60 | 0.042 | 0.64 | 0.66 | 0.61 | 0.020 |
| 100–200 | 0.65 | 0.71 | 0.56 | 0.051 | 0.66 | 0.69 | 0.63 | 0.023 | 0.64 | 0.68 | 0.62 | 0.022 | |
| 200–300 | 0.66 | 0.71 | 0.63 | 0.024 | 0.66 | 0.70 | 0.61 | 0.035 | 0.66 | 0.68 | 0.63 | 0.020 | |
| 300–350 | 0.65 | 0.68 | 0.61 | 0.035 | 0.66 | 0.70 | 0.64 | 0.035 | 0.66 | 0.72 | 0.60 | 0.044 | |
| Properties | WC | BD | CC | EC | OC | TN | TP | BN | FN | AN |
|---|---|---|---|---|---|---|---|---|---|---|
| TPN | 0.853 * | −0.485 | 0.049 | −0.344 | 0.684 | 0.674 | 0.830 * | 0.737 | 0.808 | 0.681 |
| Total porosity | 0.876 * | −0.476 | −0.016 | −0.452 | 0.637 | 0.604 | 0.773 | 0.656 | 0.813 * | 0.590 |
| MN | 0.851 * | −0.480 | 0.054 | −0.336 | 0.693 | 0.679 | 0.836 * | 0.743 | 0.816 * | 0.687 |
| Macroporosity | 0.876 * | −0.475 | −0.021 | −0.460 | 0.632 | 0.598 | 0.767 | 0.648 | 0.812 * | 0.581 |
| CMN | 0.853 * | −0.489 | 0.044 | −0.352 | 0.674 | 0.699 | 0.824 * | 0.730 | 0.800 | 0.674 |
| Coarse mesoporosity | 0.844 * | −0.482 | 0.055 | −0.321 | 0.689 | 0.683 | 0.836 * | 0.752 | 0.803 | 0.697 |
| Circularity | −0.904 * | 0.676 | 0.191 | 0.500 | −0.725 | −0.641 | −0.712 | −0.524 | −0.923 ** | −0.495 |
© 2018 by the authors. Licensee MDPI, Basel, Switzerland. This article is an open access article distributed under the terms and conditions of the Creative Commons Attribution (CC BY) license (http://creativecommons.org/licenses/by/4.0/).
Share and Cite
Guo, X.; Zhao, T.; Liu, L.; Xiao, C.; He, Y. Effect of Sewage Irrigation on the CT-Measured Soil Pore Characteristics of a Clay Farmland in Northern China. Int. J. Environ. Res. Public Health 2018, 15, 1043. https://doi.org/10.3390/ijerph15051043
Guo X, Zhao T, Liu L, Xiao C, He Y. Effect of Sewage Irrigation on the CT-Measured Soil Pore Characteristics of a Clay Farmland in Northern China. International Journal of Environmental Research and Public Health. 2018; 15(5):1043. https://doi.org/10.3390/ijerph15051043
Chicago/Turabian StyleGuo, Xiaoming, Tongqian Zhao, Lin Liu, Chunyan Xiao, and Yuxiao He. 2018. "Effect of Sewage Irrigation on the CT-Measured Soil Pore Characteristics of a Clay Farmland in Northern China" International Journal of Environmental Research and Public Health 15, no. 5: 1043. https://doi.org/10.3390/ijerph15051043
APA StyleGuo, X., Zhao, T., Liu, L., Xiao, C., & He, Y. (2018). Effect of Sewage Irrigation on the CT-Measured Soil Pore Characteristics of a Clay Farmland in Northern China. International Journal of Environmental Research and Public Health, 15(5), 1043. https://doi.org/10.3390/ijerph15051043