Factors Related to Unemployment in Europe. A Cross-Sectional Study from the COURAGE Survey in Finland, Poland and Spain

 , ,
, ,
Abstract
1. Introduction
2. Materials and Methods
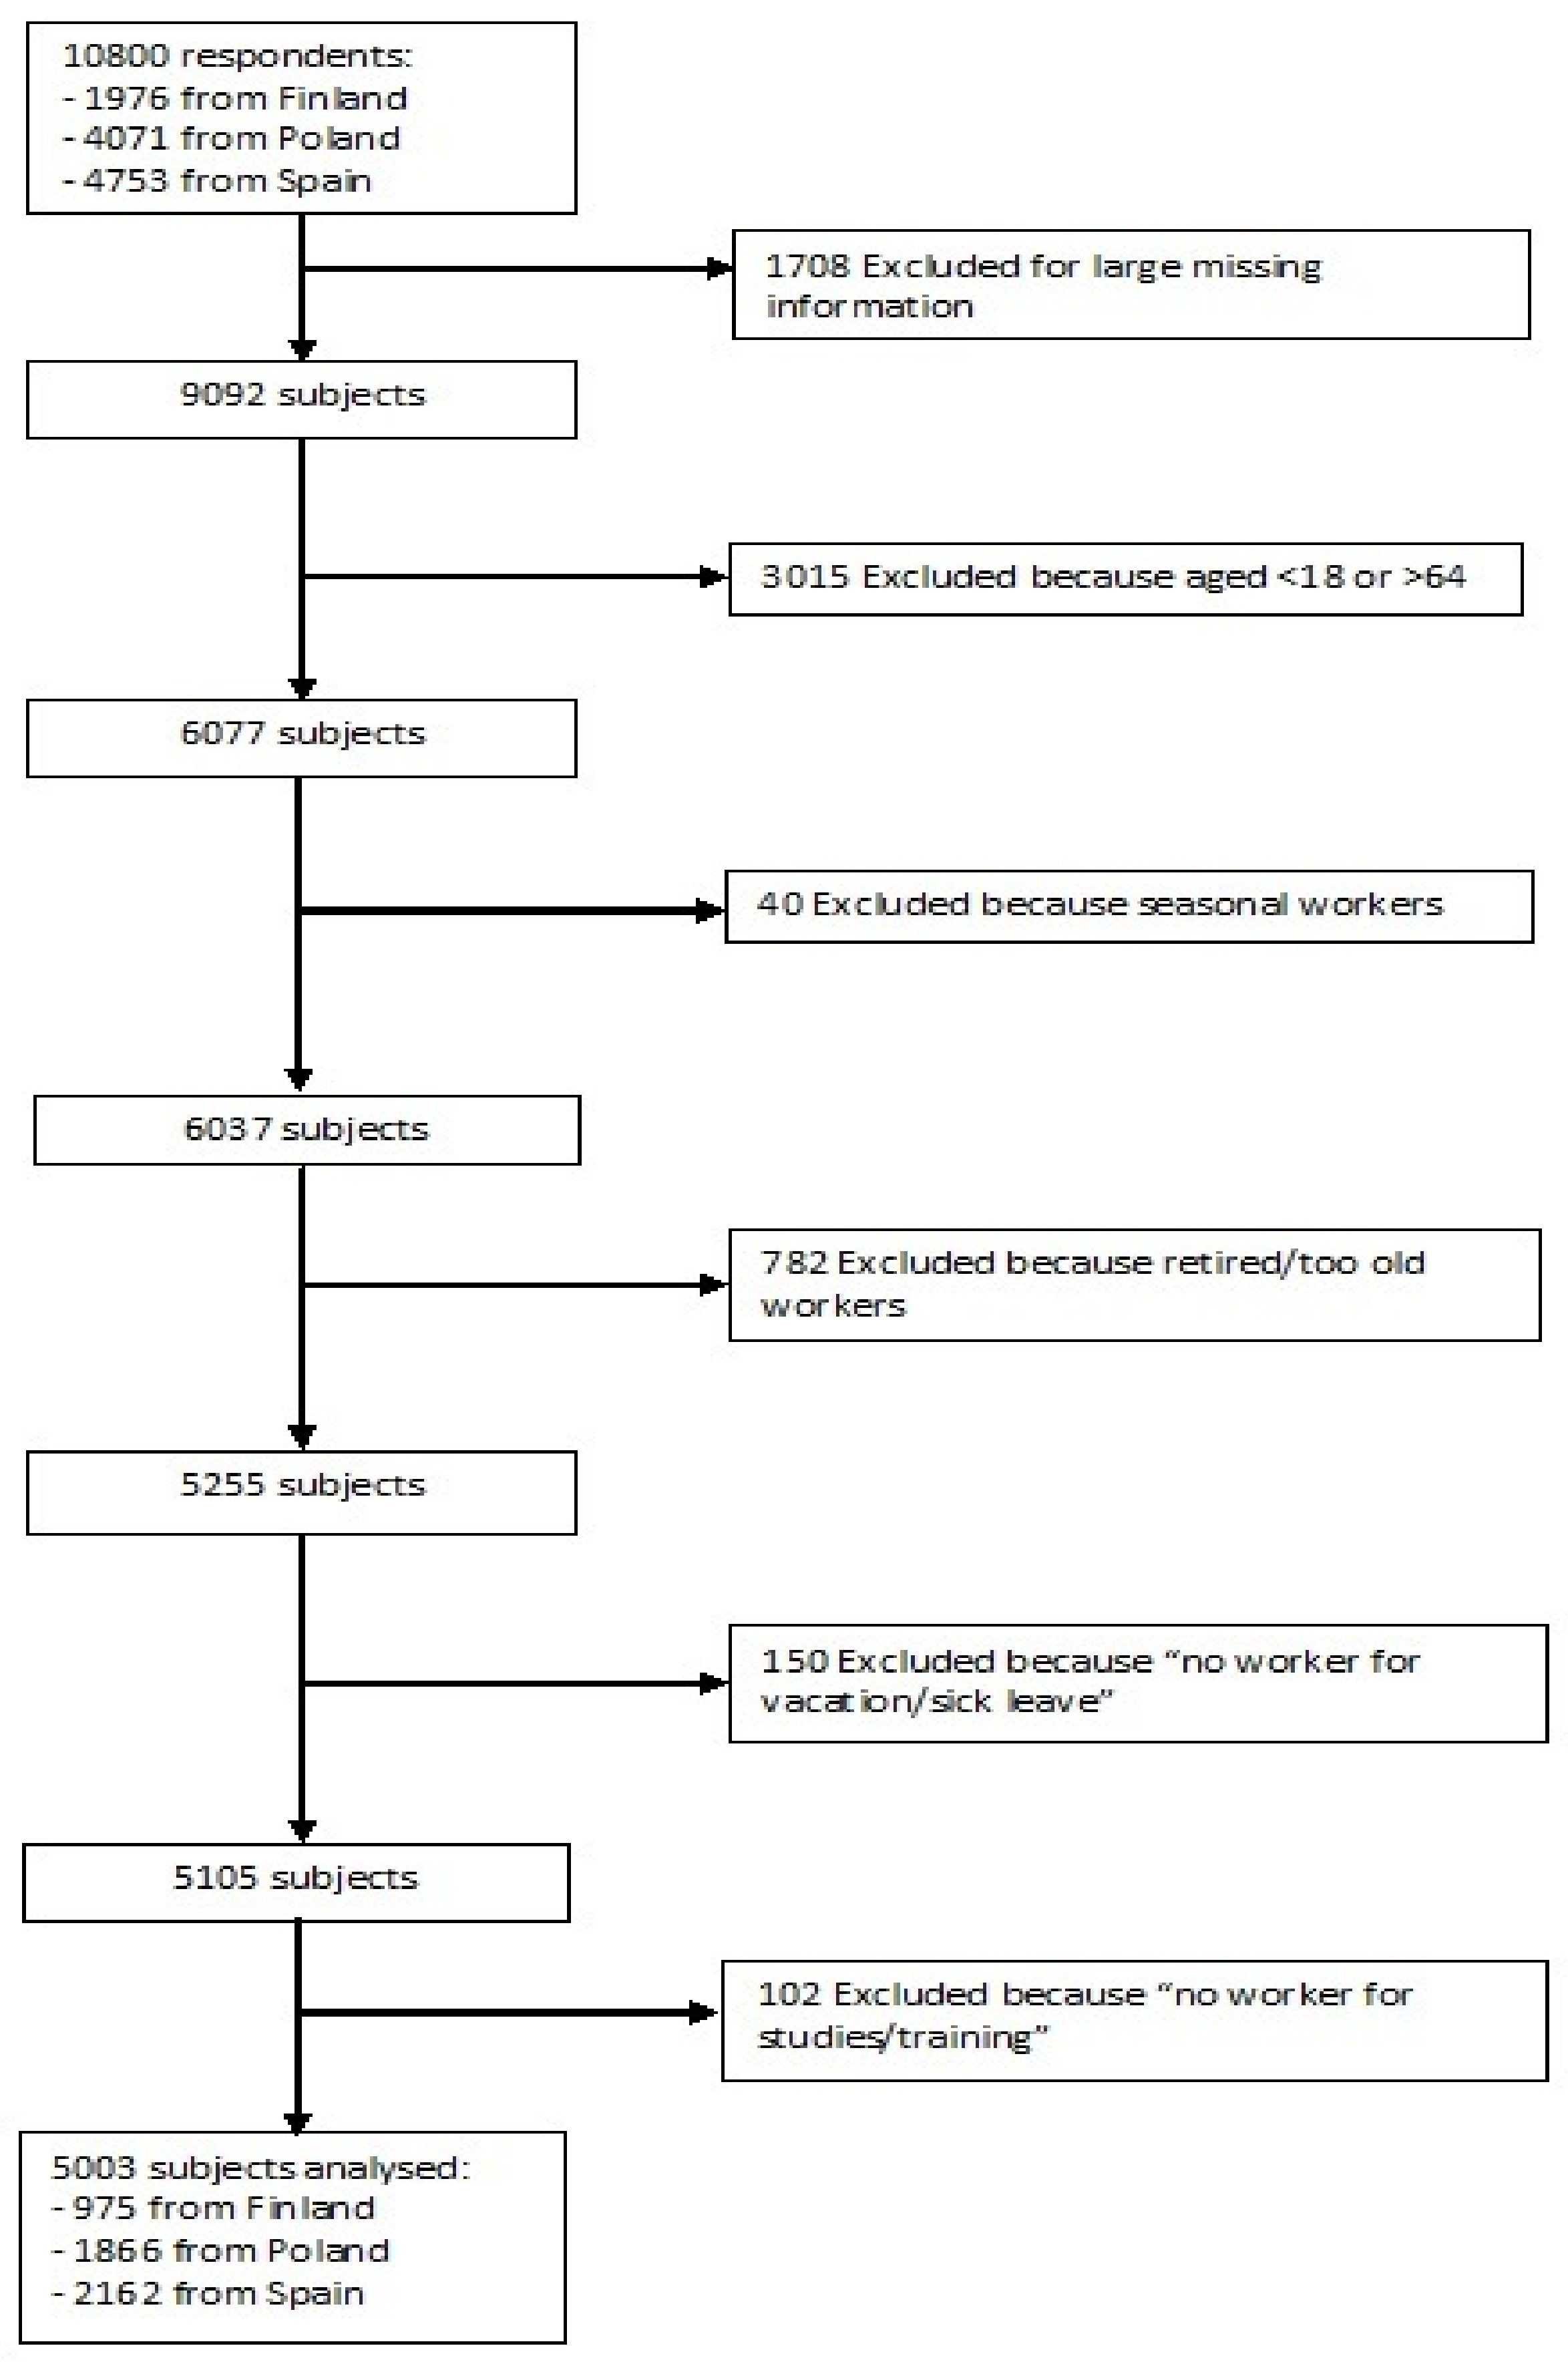
2.1. Study Design and Sample
2.2. Factors
2.2.1. Socio-Demographic Information
2.2.2. Anthropometric and Cognitive Measures
2.2.3. Vision and Hearing
- Distance vision, with the question “how much difficulty did you have in seeing and recognizing an object or a person you know across the road (from a distance of about 20 m)?”
- Near vision, with the question “how much difficulty did you have in seeing and recognizing an object at arm’s length (for example, reading)?” In addition, two dichotomous indicators (yes/no) concerning to the presence of cataracts (“Cloudy or blurry vision” and “Vision problems with light”) were also reported. People were defined to have near vision problems if they responded positively to at least one of the three questions.
- Near hearing, with the response to the question “how much difficulty did you have in: hearing someone talking on the other side of the room in a normal voice (even with your hearing aid on if you use one)?”
- Problems with conversation hearing, with the response to the question “how much difficulty did you have in: hearing what is said in a conversation between several people (even with your hearing aid on if you use one)?”
2.2.4. Health State Description
2.2.5. Health Habits
- Lifetime abstainers or occasional drinkers (i.e., those who had never consumed an alcoholic beverage or had not consumed alcohol in the last 30 days);
- Non-heavy drinkers (i.e., social drinkers who consumed alcohol in the last 30 days but were not heavy drinkers);
- Infrequent heavy drinkers (i.e., binge drinkers who consumed alcohol on 1–2 days in the past week with five or more standard drinks for men and four or more standard drinks for women);
- Frequent heavy drinkers (those who consumed alcohol on three or more days per week with five or more standard drinks for men and four or more standard drinks for women).
- High physical activity (vigorous-intensity activity on at least 3 days achieving a minimum of at least 1500 Metabolic Equivalent to Task (MET)-minutes per week or seven or more days of any combination of walking, moderate or vigorous intensity activities achieving a minimum of at least 3000 MET-minutes per week);
- Moderate physical activity (3 or more days of vigorous-intensity activity of at least 20 min per day; five or more days of moderate-intensity activity or walking of at least 30 min per day; or five or more days of any combination of walking, moderate or vigorous intensity activities achieving a minimum of at least 600 MET-minutes per week);
- Low physical activity (a person not meeting any of the above mentioned criteria).
2.2.6. Chronic Conditions
2.2.7. Social Networks
2.2.8. Built Environment
2.3. Statistical Analyses
3. Results
3.1. Characteristics of the Study Sample
3.2. Regression Analysis
3.3. Stratified Analysis by Country
3.3.1. Finland
3.3.2. Poland
3.3.3. Spain
4. Discussion
5. Conclusions
Supplementary Materials
Acknowledgments
Author Contributions
Conflicts of Interest
References
- Karanikolos, M.; Mladovsky, P.; Cylus, J.; Thomson, S.; Basu, S.; Stuckler, D.; Mackenbach, J.P.; McKee, M. Financial crisis, austerity, and health in Europe. Lancet 2013, 381, 1323–1331. [Google Scholar] [CrossRef]
- Marmot, M.G.; Bell, R. How will the financial crisis affect health? BMJ 2009, 338, b1314. [Google Scholar] [CrossRef] [PubMed]
- McKee-Ryan, F.; Song, Z.; Wanberg, C.R.; Kinicki, A.J. Psychological and physical well-being during unemployment: A meta-analytic study. J. Appl. Psychol. 2005, 90, 53–76. [Google Scholar] [CrossRef] [PubMed]
- Bowling, A. What things are important in people’s lives? A survey of the public’s judgements to inform scales of health related quality of life. Soc. Sci. Med. 1995, 41, 1447–1462. [Google Scholar] [CrossRef]
- Gallagher, S.; Sumner, R.C.; Muldoon, O.T.; Creaven, A.M.; Hannigan, A. Unemployment is associated with lower cortisol awakening and blunted dehydroepiandrosterone responses. Psychoneuroendocrinology 2016, 69, 41–49. [Google Scholar] [CrossRef] [PubMed]
- Daly, M.; Delaney, L. The scarring effect of unemployment throughout adulthood on psychological distress at age 50: Estimates controlling for early adulthood distress and childhood psychological factors. Soc. Sci. Med. 2013, 80, 19–23. [Google Scholar] [CrossRef] [PubMed]
- Booker, C.L.; Sacker, A. Psychological well-being and reactions to multiple unemployment events: Adaptation or sensitisation? J. Epidemiol. Community Health 2012, 66, 832–838. [Google Scholar] [CrossRef] [PubMed]
- La Torre, G.; Sestili, C.; Mannocci, A.; Sinopoli, A.; De Paolis, M.; De Francesco, S.; Rapaccini, L.; Barone, M.; Iodice, V.; Lojodice, B.; et al. Association between Work Related Stress and Health Related Quality of Life: The Impact of Socio-Demographic Variables. A Cross Sectional Study in a Region of Central Italy. Int. J. Environ. Res. Public Health 2018, 15, 159. [Google Scholar] [CrossRef] [PubMed]
- Steptoe, A.; Kivimäki, M. Stress and cardiovascular disease. Nat. Rev. Cardiol. 2012, 9, 360–370. [Google Scholar] [CrossRef] [PubMed]
- International Labour Organization (ILO). Resolutions Concerning Economically Active Population, Employment, Unemployment and Underemployment. Adopted by the 13th International Conference of Labour Statisticians (October 1982), p. 4. Available online: http://www.ilo.org/public/english/bureau/stat/download/res/ecacpop.pdf (accessed on 21 February 2018).
- Benach, J.; Muntaner, C. Precarious employment and health: Developing a research agenda. J. Epidemiol. Community Health 2007, 61, 276–277. [Google Scholar] [CrossRef] [PubMed]
- Norstrom, F.; Virtanen, P.; Hammarstrom, A.; Gustafsson, P.E.; Janlert, U. How does unemployment affect self-assessed health? A systematic review focusing on subgroup effects. BMC Public Health 2014, 14, 1310. [Google Scholar] [CrossRef] [PubMed]
- Carlsen, K.; Ewertz, M.; Dalton, S.O.; Badsberg, J.H.; Osler, M. Unemployment among breast cancer survivors. Scand. J. Public Health 2014, 42, 319–328. [Google Scholar] [CrossRef] [PubMed]
- Gustavsson, A.; Svensson, M.; Jacobi, F.; Allgulander, C.; Alonso, J.; Beghi, E.; Dodel, R.; Ekman, M.; Faravelli, C.; Fratiglioni, L.; et al. Cost of disorders of the brain in Europe 2010. Eur. Neuropsychopharmacol. 2011, 21, 718–779. [Google Scholar] [CrossRef] [PubMed]
- Dave, D.; Rashad, I.; Spasojevic, J. The effects of retirement on physical and mental health outcomes. South. Econ. J. 2008, 75, 497–523. [Google Scholar]
- Kruse, D.; Hale, T. Disability and employment: Symposium introduction. Ind. Relat. 2003, 42, 1–10. [Google Scholar] [CrossRef]
- Thomas, C.; Benzeval, M.; Stansfeld, S.A. Employment transitions and mental health: An analysis from the British household panel survey. J. Epidemiol. Community Health 2005, 59, 243–249. [Google Scholar] [CrossRef] [PubMed]
- Siegrist, J.; Wahrendorf, M.; von dem Knesebeck, O.; Jurges, H.; Borsch-Supan, A. Quality of work, well-being, and intended early retirement of older employees: Baseline results from the SHARE study. Eur. J. Public Health 2007, 17, 62–68. [Google Scholar] [CrossRef] [PubMed]
- Alavinia, S.M.; Burdorf, A. Unemployment and retirement and ill-health: A cross-sectional analysis across European Countries. Int. Arch. Occup. Environ. Health 2008, 82, 39–45. [Google Scholar] [CrossRef] [PubMed]
- Robroek, S.J.; Schuring, M.; Croezen, S.; Stattin, M.; Burdorf, A. Poor health, unhealthy behaviors, and unfavorable work characteristics influence pathways of exit from paid employment among older workers in Europe: A four year follow-up study. Scand. J. Work Environ. Health 2013, 39, 125–133. [Google Scholar] [CrossRef] [PubMed]
- Ahlbom, A.; Alfredsson, L. Interaction: A word with two meanings creates confusion. Eur. J. Epidemiol. 2005, 20, 563–564. [Google Scholar] [CrossRef] [PubMed]
- Hämmig, O.; Bauer, G.F. The social gradient in work and health: A cross-sectional study exploring the relationship between working conditions and health inequalities. BMC Public Health 2013, 13, 1170. [Google Scholar] [CrossRef] [PubMed]
- Barham, C.; Walling, A.; Clancy, G.; Hicks, S.; Conn, S. Young people and the labour market. Econ. Labour Market Rev. 2009, 3, 17–29. [Google Scholar] [CrossRef]
- Schuring, M.; Robroek, S.J.; Otten, F.W.; Arts, C.H.; Burdorf, A. The effect of ill health and socioeconomic status on labor force exit and re-employment: A prospective study with ten years follow-up in The Netherlands. Scand. J. Work Environ. Health 2013, 39, 134–143. [Google Scholar] [CrossRef] [PubMed]
- Van Zon, S.K.R.; Reijneveld, S.A.; Mendes de Leon, C.F.; Bültmann, U. The impact of low education and poor health on unemployment varies by work life stage. Int. J. Public Health 2017, 62, 997–1006. [Google Scholar] [CrossRef] [PubMed]
- Blanchflower, D.G. Self-employment: More may not be better. Swed. Econ. Pol. Rev. 2004, 11, 15–74. [Google Scholar] [CrossRef]
- Wilson, F.; Kickul, J.; Marlino, D. Gender, entrepreneurial self-efficacy, and entrepreneurial career intentions: Implications for entrepreneurship education. Entrep. Theory Pract. 2007, 31, 387–406. [Google Scholar] [CrossRef]
- International Labour Organization. Global Employment Trends for Women; International Labour Organization: Geneva, Switzerland, 2009; pp. 1–78. ISBN 978-92-2-122122-7. [Google Scholar]
- Campos-Serna, J.; Ronda-Pérez, E.; Artazcoz, L.; Moen, B.E.; Benavides, F.G. Gender inequalities in occupational health related to the unequal distribution of working and employment conditions: A systematic review. Int. J. Equity Health 2013, 12, 57. [Google Scholar] [CrossRef] [PubMed]
- Aguilar-Palacio, I.; Carrera-Lasfuentes, P.; Sánchez-Recio, R.; Alonso, J.P.; Rabanaque, M.J. Recession, employment and self-rated health: A study on the gender gap. Public Health 2018, 154, 44–50. [Google Scholar] [CrossRef] [PubMed]
- Leonardi, M.; Chatterji, S.; Koskinen, S.; Ayuso-Mateos, J.L.; Haro, J.M.; Frisoni, G.; Frattura, L.; Martinuzzi, A.; Tobiasz-Adamczyk, B.; Gmurek, M.; et al. Determinants of health and disability in ageing population: The COURAGE in Europe Project (collaborative research on ageing in Europe). Clin. Psychol. Psychother. 2014, 21, 193–198. [Google Scholar] [CrossRef] [PubMed]
- World Health Organization. Waist Circumference and Waist–Hip Ratio: Report of a WHO Expert Consultation, Geneva, 8–11 December 2008; World Health Organization: Geneva, Switzerland, 2011; pp. 1–39. ISBN 978-92-4-150149-1. [Google Scholar]
- World Health Organization. International Guide for Monitoring Alcohol Consumption and Related Harm; World Health Organization: Geneva, Switzerland, 2002; pp. 1–193. [Google Scholar]
- Bull, F.C.; Maslin, T.S.; Armstrong, T. Global physical activity questionnaire (GPAQ): Nine country reliability and validity study. J. Phys. Act. Health 2009, 6, 790–804. [Google Scholar] [CrossRef] [PubMed]
- World Health Organization. Global Physical Activity Surveillance. Available online: http://www.who.int/ncds/surveillance/steps/GPAQ/en/ (accessed on 21 February 2018).
- World Health Organization. Fruit and Vegetable Promotion Initiative—Report of the Meeting, Geneva, 25–27 August 2003. Available online: http://www.who.int/dietphysicalactivity/publications/f&v_promotion_initiative_report.pdf (accessed on 21 February 2018).
- Zawisza, K.; Galas, A.; Tobiasz-Adamczyk, B.; Chatterji, S.; Haro, J.M.; Miret, M.; Koskinen, S.; Power, M.; Leonardi, M. The validity of the instrument to evaluate social network in the ageing population: The Collaborative Research on Ageing in Europe Social Network Index. Clin. Psychol. Psychother. 2014, 21, 227–241. [Google Scholar] [CrossRef] [PubMed]
- Raggi, A.; Quintas, R.; Bucciarelli, P.; Franco, M.G.; Andreotti, A.; Miret, M.; Zawisza, K.; Olaya, B.; Chatterji, S.; Sainio, P.; et al. Validation of the COURAGE Built Environment Self-Reported Questionnaire. Clin. Psychol. Psychother. 2014, 21, 215–226. [Google Scholar] [CrossRef] [PubMed]
- Fox, J.; Weisberg, S. An R Companion to Applied Regression, 2nd ed.; Sage: Thousand Oaks, CA, USA, 2011; pp. 1–450. ISBN 9781412975148. [Google Scholar]
- Rico-Uribe, L.A.; Caballero, F.F.; Olaya, B.; Tobiasz-Adamczyk, B.; Koskinen, S.; Leonardi, M.; Haro, J.M.; Chatterji, S.; Ayuso-Mateos, J.L.; Miret, M. Loneliness, Social Networks, and Health: A Cross-Sectional Study in Three Countries. PLoS ONE 2016, 11, e0145264. [Google Scholar] [CrossRef] [PubMed]
- Freeman, A.; Tyrovolas, S.; Koyanagi, A.; Chatterji, S.; Leonardi, M.; Ayuso-Mateos, J.L.; Tobiasz-Adamczyk, B.; Koskinen, S.; Rummel-Kluge, C.; Haro, J.M. The role of socio-economic status in depression: Results from the COURAGE (aging survey in Europe). BMC Public Health 2016, 16, 1098. [Google Scholar] [CrossRef] [PubMed]
- Raggi, A.; Corso, B.; Minicuci, N.; Quintas, R.; Sattin, D.; De Torres, L.; Chatterji, S.; Frisoni, G.B.; Haro, J.M.; Koskinen, S.; et al. Determinants of Quality of Life in Ageing Populations: Results from a Cross-Sectional Study in Finland, Poland and Spain. PLoS ONE 2016, 11, e0159293. [Google Scholar] [CrossRef] [PubMed]
- Miret, M.; Caballero, F.F.; Olaya, B.; Koskinen, S.; Naidoo, N.; Tobiasz-Adamczyk, B.; Leonardi, M.; Haro, J.M.; Chatterji, S.; Ayuso-Mateos, J.L. Association of experienced and evaluative well-being with health in nine countries with different income levels: A cross-sectional study. Glob. Health 2017, 13, 65. [Google Scholar] [CrossRef] [PubMed]
- Lumley, T. Complex Surveys. A Guide to Analysis Using R; John Wiley & Sons, Inc.: Hoboken, NJ, USA, 2010; pp. 1–296. ISBN 978-0-470-28430-8. [Google Scholar]
- Lumley, T. Pseudo-R2 statistics under complex sampling. Aust. N. Z. J. Stat. 2017, 59, 187–194. [Google Scholar] [CrossRef]
- Lumley, T.; Scott, A. AIC and BIC for modeling with complex survey data. J. Survey Stat. Methodol. 2015, 3, 1–18. [Google Scholar] [CrossRef]
- R: A Language and Environment for Statistical Computing. R Foundation for Statistical Computing: Vienna, Austria, 2016. Available online: https://www.R-project.org/ (accessed on 21 February 2018).
- Lumley, T. “Survey: Analysis of Complex Survey Samples”. R Package Version 3.32. Available online: https://www.R-project.org/ (accessed on 21 February 2018).
- Lumley, T. Analysis of complex survey samples. J. Stat. Soft. 2004, 9, 1–19. [Google Scholar] [CrossRef]
- Long, J.A. “jtools: Analysis and Presentation of Social Scientific Data”. R Package Version 0.7.0. Available online: https://cran.r-project.org/package = jtools (accessed on 21 February 2018).
- Starace, F.; Mungai, F.; Sarti, E.; Addabbo, T. Self-reported unemployment status and recession: An analysis on the Italian population with and without mental health problems. PLoS ONE 2017, 12, e0174135. [Google Scholar] [CrossRef] [PubMed]
- Nivorozhkin, A.; Gordo, L.R. Evidence on the relationship between unemployment and health. In Unemployment: Issues, Trends and Perspectives; Wang, H.P., Ma, B.Y., Eds.; Nova Science Pub. Inc.: Hauppage, NY, USA, 2012; pp. 119–158. ISBN 978-162081172-6. [Google Scholar]
- Bassanini, A.; Duval, R. The determinants of unemployment across OECD countries: Reassessing the role of policies and institutions. OECD Econ. Stud. 2006, 2, 7–86. [Google Scholar] [CrossRef]
- Schuring, M.; Robroek, S.J.W.; Lingsma, H.F.; Burdorf, A. Educational differences in trajectories of self-rated health before, during, and after entering or leaving paid employment in the European workforce. Scand. J. Work Environ. Health 2015, 41, 441–450. [Google Scholar] [CrossRef] [PubMed]
- Tamayo-Fonseca, N.; Nolasco, A.; Quesada, J.A.; Pereyra-Zamora, P.; Melchor, I.; Moncho, J.; Calabuig, J.; Barona, C. Self-rated health and hospital services use in the Spanish National Health System: A longitudinal study. BMC Health Serv. Res. 2015, 15, 492. [Google Scholar] [CrossRef] [PubMed]
- Van Rijn, R.M.; Robroek, S.J.; Brouwer, S.; Burdorf, A. Influence of poor health on exit from paid employment: A systematic review. Occup. Environ. Med. 2014, 71, 295–301. [Google Scholar] [CrossRef] [PubMed]
- Corral, A.; Durán, J.; Isusi, I. Employment Opportunities for People with Chronic Disease, IKEI Research and Consulting. Available online: http://www.eurofound.europa.eu/sites/default/files/ef1459en.pdf (accessed on 21 February 2018).
- Wege, N.; Angerer, P.; Li, J. Effects of Lifetime Unemployment Experience and Job Insecurity on Two-Year Risk of Physician-Diagnosed Incident Depression in the German Working Population. Int. J. Environ. Res. Public Health 2017, 14, 904. [Google Scholar] [CrossRef] [PubMed]
- Rodrigues, A.P.; Sousa-Uva, M.; Fonseca, R.; Marques, S.; Pina, N.; Matias-Dias, C. Depression and unemployment incidence rate evolution in Portugal, 1995–2013: General Practitioner Sentinel Network data. Rev. Saude Publica 2017, 51, 98. [Google Scholar] [CrossRef] [PubMed]
- McGee, R.E.; Thompson, N.J. Unemployment and depression among emerging adults in 12 states, Behavioral Risk Factor Surveillance System, 2010. Prev. Chronic Dis. 2015, 12, 38. [Google Scholar] [CrossRef] [PubMed]
- Robroek, S.J.; Reeuwijk, K.G.; Hillier, F.C.; Bambra, C.L.; van Rijn, R.M.; Burdorf, A. The contribution of overweight, obesity, and lack of physical activity to exit from paid employment: A meta-analysis. Scand. J. Work Environ. Health 2013, 39, 233–240. [Google Scholar] [CrossRef] [PubMed]
- Hughes, A.; Kumari, M. Unemployment, underweight, and obesity: Findings from Understanding Society (UKHLS). Prev. Med. 2017, 97, 19–25. [Google Scholar] [CrossRef] [PubMed]
- Kaikkonen, J.E.; Mikkilä, V.; Juonala, M.; Keltikangas-Järvinen, L.; Hintsanen, M.; Pulkki-Råback, L.; Viikari, J.S.; Kähönen, M.; Lehtimäki, T.; Telama, R.; et al. Factors associated with six-year weight change in young and middle-aged adults in the Young Finns Study. Scand. J. Clin. Lab. Investig. 2015, 75, 133–144. [Google Scholar] [CrossRef] [PubMed]
- Monsivais, P.; Martin, A.; Suhrcke, M.; Forouhi, N.G.; Wareham, N.J. Job-loss and weight gain in British adults: Evidence from two longitudinal studies. Soc. Sci. Med. 2015, 143, 223–231. [Google Scholar] [CrossRef] [PubMed]
- Kinge, J.M. Waist circumference, body mass index, and employment outcomes. Eur. J. Health Econ. 2017, 18, 787–799. [Google Scholar] [CrossRef] [PubMed]
- Appelhans, B.M.; Segawa, E.; Janssen, I.; Kazlauskaite, R.; Thurston, R.C.; Lewis, T.T.; Kravitz, H.M. Employment status, depressive symptoms, and waist circumference change in midlife women: The Study of Women’s Health Across the Nation (SWAN). Ann. Epidemiol. 2014, 24, 187–192. [Google Scholar] [CrossRef] [PubMed]
- Mosca, I. Body mass index, waist circumference and employment: Evidence from older Irish adults. Econ. Hum. Biol. 2013, 11, 522–533. [Google Scholar] [CrossRef] [PubMed]
- Burkhauser, R.V.; Cawley, J. Beyond BMI: The value of more accurate measures of fatness and obesity in social science research. J. Health Econ. 2008, 27, 519–529. [Google Scholar] [CrossRef] [PubMed]
- Johansson, E.; Böckerman, P.; Kiiskinen, U.; Heliövaara, M. Obesity and labour market success in Finland: The difference between having a high BMI and being fat. Econ. Hum. Biol. 2009, 7, 36–45. [Google Scholar] [CrossRef] [PubMed]
- Doherty, E.; Queally, M.; O’Neill, C. An examination of the relationships between service use and alternative measures of obesity among community-dwelling adults in Ireland. Eur. J. Health Econ. 2015, 16, 951–956. [Google Scholar] [CrossRef] [PubMed]
- Emmett, S.D.; Francis, H.W. The socioeconomic impact of hearing loss in U.S. adults. Otol. Neurotol. 2015, 36, 545–550. [Google Scholar] [CrossRef] [PubMed]
- Pierre, P.V.; Fridberger, A.; Wikman, A.; Alexanderson, K. Self-reported hearing difficulties, main income sources, and socio-economic status; a cross-sectional population-based study in Sweden. BMC Public Health 2012, 12, 874. [Google Scholar] [CrossRef] [PubMed]
- Rahi, J.S.; Cumberland, P.M.; Peckham, C.S. Visual function in working-age adults: Early life influences and associations with health and social outcomes. Ophthalmology 2009, 116, 1866–1871. [Google Scholar] [CrossRef] [PubMed]
- Harrabi, H.; Aubin, M.J.; Zunzunegui, M.V.; Haddad, S.; Freeman, E.E. Visual difficulty and employment status in the world. PLoS ONE 2014, 9, e88306. [Google Scholar] [CrossRef] [PubMed]
- Nova, E.; Baccan, G.C.; Veses, A.; Zapatera, B.; Marcos, A. Potential health benefits of moderate alcohol consumption: Current perspectives in research. Proc. Nutr. Soc. 2012, 71, 307–315. [Google Scholar] [CrossRef] [PubMed]
- Henkel, D. Unemployment and substance use: A review of the literature (1990–2010). Curr. Drug Abuse Rev. 2011, 4, 4–27. [Google Scholar] [CrossRef] [PubMed]
- Reed, J.L.; Prince, S.A.; Elliott, C.G.; Mullen, K.A.; Tulloch, H.E.; Hiremath, S.; Cotie, L.M.; Pipe, A.L.; Reid, R.D. Impact of Workplace Physical Activity Interventions on Physical Activity and Cardiometabolic Health Among Working-Age Women: A Systematic Review and Meta-Analysis. Circ. Cardiovasc. Qual. Outcomes 2017, 10, E003516. [Google Scholar] [CrossRef] [PubMed]
- Sowa, A.; Tobiasz-Adamczyk, B.; Topór-Mądry, R.; Poscia, A.; la Milia, D.I. Predictors of healthy ageing: Public health policy targets. BMC Health Serv. Res. 2016, 16 (Suppl. 5), 289. [Google Scholar] [CrossRef] [PubMed]
- Rhodes, R.E.; Mark, R.S.; Temmel, C.P. Adult sedentary behavior: A systematic review. Am. J. Prev. Med. 2012, 42, e3–e28. [Google Scholar] [CrossRef] [PubMed]
- Lee, S.J.; Sudore, R.L.; Williams, B.A.; Lindquist, K.; Chen, H.L.; Covinsky, K.E. Functional limitations, socioeconomic status, and all-cause mortality in moderate alcohol drinkers. J. Am. Geriatr. Soc. 2009, 57, 955–962. [Google Scholar] [CrossRef] [PubMed]
- Sun, W.; Schooling, C.M.; Chan, W.M.; Ho, K.S.; Lam, T.H.; Leung, G.M. Moderate alcohol use, health status, and mortality in a prospective Chinese elderly cohort. Ann. Epidemiol. 2009, 19, 396–403. [Google Scholar] [CrossRef] [PubMed]
- French, M.T.; Zavala, S.K. The health benefits of moderate drinking revisited: Alcohol use and self-reported health status. Am. J. Health Promot. 2007, 21, 484–491. [Google Scholar] [CrossRef] [PubMed]
- Fillmore, K.M.; Stockwell, T.; Chikritzhs, T.; Bostrom, A.; Kerr, W. Moderate alcohol use and reduced mortality risk: Systematic error in prospective studies and new hypotheses. Ann. Epidemiol. 2007, 17 (Suppl. 5), S16–S23. [Google Scholar] [CrossRef] [PubMed]
- Johansson, E.; Alho, H.; Kiiskinen, U.; Poikolainen, K. The association of alcohol dependency with employment probability: Evidence from the population survey ‘Health 2000 in Finland’. Health Econ. 2007, 16, 739–754. [Google Scholar] [CrossRef] [PubMed]
- MacDonald, Z.; Shields, M. Does problem drinking affect employment? Evidence from England. Health Econ. 2004, 13, 139–155. [Google Scholar] [CrossRef] [PubMed]
- Böckerman, P.; Hyytinen, A.; Maczulskij, T. Alcohol Consumption and Long-Term Labor Market Outcomes. Health Econ. 2017, 26, 275–291. [Google Scholar] [CrossRef] [PubMed]
- Morois, S.; Lemogne, C.; Leclerc, A.; Limosin, F.; Goldberg, S.; Goldberg, M.; Herquelot, E.; Zins, M. More than Light Alcohol Consumption Predicts Early Cessation from Employment in French Middle-Aged Men. Alcohol Alcohol. 2016, 51, 224–231. [Google Scholar] [CrossRef] [PubMed]
- Bentolila, S.; García-Pérez, J.I.; Jansen, M. Are the Spanish long-term unemployed unemployable? SERIEs 2017, 8, 1–41. [Google Scholar] [CrossRef]
- Sipilä, N.; Kestilä, L.; Martikainen, P. The association between education and employment in young adulthood. What is the labour market value of primary education in the early 2000s? Yhteiskuntapolitiikka 2011, 76, 121–134. [Google Scholar]
- Herbig, B.; Dragano, N.; Angerer, P. Health in the long-term unemployed. Deutsches Ärzteblatt Int. 2013, 110, 413. [Google Scholar]
- Burdorf, A.; Schuring, M. Poor health as cause and consequence of prolonged unemployment: Mechanisms, interventions, and policy recommendations. In Sustainable Working Lives; Springer: Dordrecht, The Netherlands, 2015; pp. 215–227. [Google Scholar]
- Kraut, A.; Mustard, C.; Walld, R.; Tate, R. Unemployment and health care utilization. Scand. J. Work Environ. Health 2000, 26, 169–177. [Google Scholar] [CrossRef] [PubMed][Green Version]
- Böckerman, P.; Ilmakunnas, P. Unemployment and Self-Assessed Health: Evidence from Panel Data. Health Econ. 2009, 18, 161–179. [Google Scholar] [CrossRef] [PubMed]
- Nyman, J. Does Unemployment Contribute to Ill-Being? Results from a Panel Study Among Adult Finns 1989/90 and 1997. National Public Health Institute and Department of General Practice and Primary Health Care, University of Helsinki. Academic Dissertation; National Public Health Institute: Helsinki, Finland, 2002.
- Lamberg, T.; Virtanen, P.; Vahtera, J.; Luukkaala, T.; Koskenvuo, M. Unemployment, depressiveness and disability retirement: A follow-up study of the Finnish HeSSup population sample. Soc. Psychiatry Psychiatr. Epidemiol. 2010, 45, 259–264. [Google Scholar] [CrossRef] [PubMed]
- Hakulinen, C.; Elovainio, M.; Pulkki-Råback, L.; Böckerman, P.; Viinikainen, J.; Pehkonen, J.; Raitakari, O.T.; Keltikangas-Järvinen, L.; Hintsanen, M. Depressive symptoms and long-term income: The Young Finns Study. J. Affect. Disord. 2016, 204, 120–123. [Google Scholar] [CrossRef] [PubMed]
- García-Gómez, P. Institutions, health shocks and labour market outcomes across Europe. J. Health Econ. 2011, 30, 200–213. [Google Scholar] [CrossRef] [PubMed]
- Benavides, F.G.; Duran, X.; Gimeno, D.; Vanroelen, C.; Martínez, J.M. Labour market trajectories and early retirement due to permanent disability: A study based on 14972 new cases in Spain. Eur. J. Public Health 2015, 25, 673–677. [Google Scholar] [CrossRef] [PubMed]
- Kozieł, S.; Lopuszańska, M.; Szklarska, A.; Lipowicz, A. The negative health consequences of unemployment: The case of Poland. Econ. Hum. Biol. 2010, 8, 255–260. [Google Scholar] [CrossRef] [PubMed]
- Mojon-Azzi, S.; Sousa-Poza, A.; Mojon, D.S. Impact of Low Vision on Employment. Ophthalmologica 2010, 224, 381–388. [Google Scholar] [CrossRef] [PubMed]
- Atkinson, T.; Liem, R.; Liem, J.H. The social costs of unemployment: Implications for social support. J. Health Soc. Behav. 1986, 27, 317–331. [Google Scholar] [CrossRef] [PubMed]
- Maddy, L.M.; Cannon, J.G.; Lichtenberger, E.J. The effects of social support on self-esteem, self-efficacy, and job search efficacy in the unemployed. J. Employ. Couns. 2015, 52, 87–95. [Google Scholar] [CrossRef]
- Lee, S.A.; Ju, Y.J.; Han, K.T.; Choi, J.W.; Yoon, H.J.; Park, E.C. The association between loss of work ability and depression: A focus on employment status. Int. Arch. Occup. Environ. Health 2017, 90, 109–116. [Google Scholar] [CrossRef] [PubMed]
- Yoo, K.B.; Park, E.C.; Jang, S.Y.; Kwon, J.A.; Kim, S.J.; Cho, K.H.; Choi, J.W.; Kim, J.H.; Park, S. Association between employment status change and depression in Korean adults. BMJ Open 2016, 6, e008570. [Google Scholar] [CrossRef] [PubMed]
- Rodwell, L.; Romaniuk, H.; Nilsen, W.; Carlin, J.B.; Lee, K.J.; Patton, G.C. Adolescent mental health and behavioural predictors of being NEET: A prospective study of young adults not in employment, education, or training. Psychol. Med. 2017. [Google Scholar] [CrossRef] [PubMed]
- O’Dea, B.; Glozier, N.; Purcell, R.; McGorry, P.D.; Scott, J.; Feilds, K.L.; Hermens, D.F.; Buchanan, J.; Scott, E.M.; Yung, A.R.; et al. A cross-sectional exploration of the clinical characteristics of disengaged (NEET) young people in primary mental healthcare. BMJ Open 2014, 4, e006378. [Google Scholar] [CrossRef] [PubMed]
- Eurostat. Available online: http://ec.europa.eu/eurostat/en/web/lfs (accessed on 4 April 2018).
- Puig-Barrachina, V.; Vanroelen, C.; Vives, A.; Martínez, J.M.; Muntaner, C.; Levecque, K.; Benach, J.; Louckx, F. Measuring employment precariousness in the European Working Conditions Survey: The social distribution in Europe. Work 2014, 49, 143–161. [Google Scholar] [CrossRef] [PubMed]
- Tridico, P. Financial crisis and global imbalances: Its labour market origins and the aftermath. Cambr. J. Econ. 2012, 36, 17–42. [Google Scholar] [CrossRef]
- Scherer, S. The social consequences of insecure jobs. Soc. Indic. Res. 2009, 93, 527–547. [Google Scholar] [CrossRef]
- Senicato, C.; Lima, M.G.; Barros, M.B.A. Are there differences between paid women workers and housewives in health-related quality of life? Cad. Saude Publica 2016, 32, e00085415. [Google Scholar] [CrossRef] [PubMed][Green Version]
- Saravi, F.K.; Navidian, A.; Rigi, S.N.; Montazeri, A. Comparing health-related quality of life of employed women and housewives: A cross sectional study from southeast Iran. BMC Women’s Health 2012, 12, 41. [Google Scholar] [CrossRef] [PubMed]


| Variable (Regressor) | Total Sample N = 5003 | Finland N = 975 (19.48%) | Poland N = 1866 (37.29%) | Spain N = 2162 (43.21%) |
|---|---|---|---|---|
| N (%) or Mean ± SD | N (%) or Mean ± SD | N (%) or Mean ± SD | N (%) or Mean ± SD | |
| Outcome | ||||
| Unemployment—Yes | 1610 (32.18) | 177 (18.15) | 543 (29.09) | 890 (41.16) |
| Socio-demographic information | ||||
| Sex—Male | 2271 (45.39) | 431 (44.20) | 810 (43.40) | 1030 (47.64) |
| Age (year) | 48.11 ± 11.53 | 48.50 ± 11.23 | 46.61 ± 12.15 | 49.22 ± 10.94 |
| Marital status | ||||
| Never married and no cohabiting | 974 (19.46) | 179 (18.35) | 389 (20.84) | 406 (18.77) |
| Currently married or cohabiting | 3290 (65.76) | 680 (69.74) | 1178 (63.12) | 1432 (66.23) |
| Separated or divorced | 510 (10.19) | 98 (10.05) | 189 (10.12) | 223 (10.31) |
| Widowed | 229 (4.57) | 18 (1.84) | 110 (5.89) | 101 (4.67) |
| Years of education completed (year) | 13.14 ± 4.48 | 13.93 ± 3.74 | 13.066 ± 3.38 | 12.837 ± 5.46 |
| Location—Urban | 3689 (73.73) | 760 (77.94) | 1081 (57.93) | 1848 (85.47) |
| Anthropometric and cognitive measures | ||||
| Height (m) | 1.68 ± 0.09 | 1.70 ± 0.09 | 1.68 ± 0.09 | 1.65 ± 0.09 |
| Weight (kg) | 75.41 ± 15.74 | 77.57 ±16.12 | 75.14 ± 16.01 | 74.68 ± 15.24 |
| Body Mass Index (BMI) (kg/m2) | 26.84 ± 4.94 | 26.65 ± 4.73 | 26.53 ± 5.10 | 27.19 ± 4.87 |
| BMI in class | ||||
| underweight | 85 (1.69) | 7 (0.71) | 45 (2.41) | 33 (1.52) |
| normal weight | 1833 (36.63) | 386 (39.58) | 747 (40.03) | 700 (32.37) |
| overweight | 1958 (39.13) | 390 (40) | 661 (35.42) | 907 (41.95) |
| obese | 1127 (22.52) | 192 (19.69) | 413 (22.13) | 522 (24.14) |
| Waist Circumference (WC) (cm) | 90.43 ± 13.83 | 90.80 ± 13.58 | 88.73 ± 13.91 | 91.73 ± 13.71 |
| WC cardiovascular risk factor—High | 1764 (35.25) | 339 (34.76) | 578 (30.97) | 847 (39.17) |
| Walking test at 4 m (seconds) | 3.19 ± 1.50 | 2.40 ± 0.86 | 3.44 ± 1.93 | 3.34 ± 1.15 |
| Handgrip (Kg) | 36.60 ± 12.23 | 39.56 ± 12.90 | 36.73 ± 12.12 | 35.15 ± 11.76 |
| Verbal recall (Number of words) | 19.11 ± 5.35 | 22.64 ± 3.71 | 18.59 ± 5.57 | 17.96 ± 5.11 |
| Delayed verbal recall (Number of words) | 6.20 ± 2.32 | 7.97 ± 1.66 | 5.89 ± 2.35 | 5.66 ± 2.15 |
| Digit span forward (Enter the series number in the longest series repeated without error) | 5.88 ± 1.44 | 6.07 ± 1.12 | 5.66 ± 1.59 | 5.98 ± 1.42 |
| Digit span backward (Enter the series number in the longest series repeated without error) | 4.16 ± 1.40 | 4.63 ± 1.24 | 3.98 ± 1.58 | 4.09 ± 1.25 |
| Verbal fluency (Number of animals named correctly) | 21.76 ± 8.35 | 26.18 ± 7.29 | 21.27 ± 8.34 | 20.18 ± 8.12 |
| Vision and Hearing | ||||
| Distance Vision—Poor | 855 (17.08) | 38 (3.89) | 342 (18.32) | 475 (21.97) |
| Near Vision—Poor | 650 (12.99) | 10 (1.02) | 574 (30.76) | 66 (3.05) |
| Cloudy or blurry vision due to cataracts—Yes | 375 (7.49) | 61 (6.25) | 174 (9.32) | 140 (6.47) |
| Vision problems with light due to cataracts—Yes | 357 (7.13) | 77 (7.89) | 158 (8.46) | 122 (5.64) |
| Near Hearing—Poor | 519 (10.37) | 132 (13.53) | 200 (10.71) | 187 (8.64) |
| Conversation Hearing—Poor | 432 (8.63) | 59 (6.05) | 235 (12.59) | 138 (6.38) |
| Health State | ||||
| Health status (self-rated health status interview day)—Poor | 424 (8.47) | 34 (3.48) | 178 (9.53) | 212 (9.80) |
| Difficult with work or household activities (since 30 days)—Yes | 1427 (28.52) | 182 (18.66) | 698 (37.40) | 547 (25.30) |
| Difficulties in coping—Yes | 1653 (33.04) | 108 (11.07) | 795 (42.60) | 750 (34.69) |
| Bodily aches or pains—Yes | 2676 (53.48) | 662 (67.89) | 1056 (56.59) | 958 (44.31) |
| Mobility (score) | 91.45 ± 16.07 | 94.81 ± 11.27 | 88.45 ± 18.45 | 92.51 ± 15.26 |
| Difficulty in washing the whole body task—Yes | 305 (6.09) | 38 (3.89) | 175 (9.37) | 92 (4.25) |
| Difficulty in getting dress—Yes | 367 (7.33) | 41 (4.20) | 205 (10.98) | 121 (5.59) |
| Difficulty with getting to and using the toilet?—Yes | 203 (4.05) | 15 (1.53) | 132 (7.07) | 56 (2.59) |
| Difficulty with personal relationships or participation in the community?—Yes | 449 (8.97) | 78 (8) | 245 (13.12) | 126 (5.82) |
| Difficulty in dealing with conflicts and tensions with others?—Yes | 645 (12.89) | 142 (14.56) | 352 (18.86) | 151 (6.98) |
| Difficulty with dealing with people you do not know?—Yes | 457 (9.13) | 73 (7.48) | 263 (14.09) | 121 (5.59) |
| Difficulty in sleep—Yes | 1917 (38.31) | 444 (45.53) | 749 (40.13) | 724 (33.48) |
| Feel tired—Yes | 1948 (38.93) | 543 (55.69) | 777 (41.63) | 628 (29.04) |
| Oral health—Poor | 1017 (20.32) | 327 (33.53) | 217 (11.62) | 473 (21.87) |
| Road Traffic Accident Injuries -Yes | 95 (1.90) | 10 (1.02) | 35 (1.87) | 50 (2.31) |
| General Bodily Injuries—Yes | 272 (5.43) | 87 (8.92) | 75 (4.01) | 110 (5.08) |
| Physical Disability (from injury)—Yes | 59 (1.18) | 9 (0.92) | 16 (0.85) | 34 (1.57) |
| Inpatient care—Yes | 1011 (20.20) | 192 (19.69) | 441 (23.63) | 378 (17.48) |
| Outpatient care—Yes | 2638 (52.72) | 727 (74.56) | 518 (27.75) | 1393 (64.43) |
| Outpatient care (times in the last 12 months) | 2.67 ± 6.64 | 3.92 ± 10.00 | 1.70 ± 4.88 | 2.95 ± 5.89 |
| Health Habits | ||||
| Current smoking status—Yes | 1697 (33.91) | 223 (22.87) | 679 (36.38) | 795 (36.77) |
| Past smoking status—Yes | 989 (19.76) | 315 (32.30) | 344 (18.43) | 330 (15.26) |
| Alcohol consumption | ||||
| Abstainer or occasional | 2726 (54.48) | 385 (39.48) | 1158 (62.05) | 1183 (54.71) |
| Drinker/Not Heavy Drinker | 1786 (35.69) | 346 (35.48) | 550 (29.47) | 890 (41.16) |
| Infrequent Heavy Drinker | 437 (8.73) | 223 (22.87) | 141 (7.55) | 73 (3.37) |
| Frequent Heavy Drinker | 54 (1.07) | 21 (2.15) | 17 (0.91) | 16 (0.74) |
| Physical activity | ||||
| Inactive or low | 941 (18.80) | 112 (11.48) | 353 (18.91) | 476 (22.01) |
| Moderate | 1595 (31.88) | 376 (38.56) | 370 (19.82) | 849 (39.26) |
| High | 2467 (49.31) | 487 (49.94) | 1143 (61.25) | 837 (38.71) |
| Fruit or vegetable nutrition (servings per day <5)—Yes | 3825 (76.45) | 775 (79.48) | 1455 (77.97) | 1595 (73.77) |
| Chronic Conditions | ||||
| Arthritis | 915 (18.28) | 287 (29.43) | 318 (17.04) | 310 (14.33) |
| Stroke | 65 (1.29) | 9 (0.92) | 33 (1.76) | 23 (1.06) |
| Angina | 164 (3.27) | 13 (1.33) | 97 (5.19) | 54 (2.49) |
| Diabetes | 333 (6.65) | 55 (5.64) | 118 (6.32) | 160 (7.40) |
| Lung disease | 204 (4.07) | 17 (1.74) | 96 (5.14) | 91 (4.20) |
| Asthma | 324 (6.47) | 106 (10.87) | 90 (4.82) | 128 (5.92) |
| Depression | 756 (15.11) | 145 (14.87) | 192 (10.28) | 419 (19.38) |
| Hypertension | 1094 (21.86) | 185 (18.97) | 491 (26.31) | 418 (19.33) |
| Social Network | ||||
| Social Network index (score) | 69.45 ± 13.11 | 64.79 ± 10.74 | 66.03 ± 12.85 | 74.48 ± 12.57 |
| Build Environment Assessment scores | ||||
| Reachability and usability of the neighborhood environment | 64.95 ± 21.86 | 58.25 ± 17.90 | 62.79 ± 23.87 | 69.82 ± 20.54 |
| Hindrance of walkable environment | 27.93 ± 19.96 | 20.14 ± 10.50 | 34.40 ± 22.77 | 25.85 ± 18.90 |
| Open-to-public buildings, places and facilities | 72.88 ± 19.84 | 75.69 ± 12.06 | 63.81 ± 22.40 | 79.44 ± 17.17 |
| Usability of the living place/home | 78.13 ± 19.37 | 83.07 ± 11.93 | 70.65 ± 22.72 | 82.34 ± 16.80 |
| Areas | Regressors | Adjusted OR (95% CI) | |||
|---|---|---|---|---|---|
| Overall N = 5003 | Finland N = 975 | Poland N = 1866 | Spain N = 2162 | ||
| Socio-demographic information | Years of education completed | 0.92 *** [0.90; 0.95] | 0.92 * [0.86; 0.98] | 0.86 *** [0.82; 0.91] | 0.94 *** [0.91; 0.97] |
| Country (ref. Finland) | Not expected | Not expected | Not expected | ||
| Poland | 1.01 [0.74; 1.40] | Not expected | Not expected | Not expected | |
| Spain | 2.17 *** [1.67; 2.83] | Not expected | Not expected | Not expected | |
| Marital status (Ref. never married) | Not included | Not included | Not included | ||
| Currently married or cohabiting | 0.73 * [0.56; 0.96] | ||||
| Separated or divorced | 0.58 ** [0.39; 0.87] | ||||
| Widowed | 0.92 [0.52; 1.61] | ||||
| Age (years) | 0.991 * [0.982; 0.999] | Not included | 0.973 *** [0.95; 0.98] | Not included | |
| Anthropometric and cognitive measures | Handgrip | 0.979 *** [0.969; 0.988] | 0.982 * [0.967; 0.998] | 0.964 *** [0.948; 0.981] | 0.983 * [0.971; 0.996] |
| Digit span forward | 0.89 ** [0.82; 0.97] | Not included | Not included | 0.81 *** [0.72; 0.91] | |
| WC cardiovascular risk factor (ref. Low) | 1.26 ° [0.99; 1.59] | Not included | 1.94 ** [1.24; 3.02] | Not included | |
| Walking test at 4 m (seconds) | 1.08 ° [0.99; 1.17] | 1.86 ** [1.20; 2.88] | 1.12 ° [1.00; 1.28] | Not included | |
| Verbal fluency | 0.99 ° [0.97; 1.00] | Not included | Not included | Not included | |
| Vision and hearing | Distant Vision (ref. Good) | 0.69 ** [0.53; 0.89] | Not included | Not included | Not included |
| Near Vision (ref. Good) | 1.58 * [1.10; 2.28] | Not included | 1.48 ° [1.00; 2.19] | Not included | |
| Cloudy or blurry vision due to cataracts (ref. No) | Not included | 2.75 * [1.17; 6.47] | Not included | Not included | |
| Conversation Hearing (ref. Good) | 1.60 * [1.10; 2.31] | Not included | 2.35 ** [1.38; 3.98] | Not included | |
| Health state | Inpatient care (ref. No) | 1.98 *** [1.54; 2.55] | 4.77 *** [2.94; 7.75] | 1.75 * [1.12; 2.70] | 1.54 * [1.06; 2.22] |
| Self-rated health status (ref. Good) | 2.63 *** [1.75; 3.98] | Not included | 4.14 *** [2.20; 8.04] | 2.27 ** [1.29; 4.07] | |
| Physical Disability (from injury) (ref. No) | 2.94 ** [1.47; 6.04] | Not included | Not included | 3.07 * [1.21; 8.51] | |
| Difficulty with getting to and using the toilet? (ref. No) | 2.04 ** [1.26; 3.33] | Not included | Not included | Not included | |
| Difficulty in washing the whole body task (ref. No) | Not included | Not included | 2.16 ** [1.23; 3.79] | Not included | |
| Difficulty with personal relationships or participation in the community? (ref. No) | 1.45 ° [0.96; 2.18] | Not included | Not included | 2.72 ** [1.45; 5.23] | |
| Difficulty in dealing with conflicts and tensions with others (ref. No) | Not included | Not included | Not included | 0.53 ° [0.28; 1.01] | |
| Difficulty with dealing with people you do not know (ref. No) | Not included | 5.35 *** [2.61; 10.99] | Not included | Not included | |
| Outpatient care (times in the last 12 months) | 1.03 ° [1.00; 1.06] | Not included | Not included | 1.03 * [1.01; 1.07] | |
| Road Traffic Accident Injuries (ref. No) | Not included | ≈0 *** [≈0; ≈0] | Not included | Not included | |
| General Bodily Injuries (ref. No) | Not included | 0.36 * [0.15; 0.84] | Not included | Not included | |
| Health Habits | Alcohol consumption (ref. Abstainer/Occasional) | Not included | |||
| Non-Heavy Drinker | 0.73 ** [0.59; 0.90] | 0.77 [0.52; 1.13] | 0.68 ** [0.52; 0.89] | ||
| Infrequent Heavy Drinker | 0.57 ** [0.40; 0.81] | 0.37 ** [0.18; 0.73] | 0.74 [0.36; 1.47] | ||
| Frequent Heavy Drinker | 1.12 [0.53; 2.25] | 0.83 [0.22; 2.46] | 0.64 [0.13; 2.60] | ||
| Physical activity (ref. Inactive or low) | Not included | Not included | Not included | ||
| Moderate physical activity | 0.50 ° [0.25; 1.00] | ||||
| High physical activity | 0.46 * [0.24; 0.92] | ||||
| Chronic Conditions | Depression (ref. No) | 1.38 * [1.03; 1.85] | 2.46 ** [1.36; 4.46] | Not included | Not included |
| Arthritis (ref. No) | Not included | Not included | Not included | 1.46 ° [0.97; 2.18] | |
| Asthma (ref. No) | Not included | Not included | 0.49 ° [0.22; 0.97] | Not included | |
| Build Environment Assessment | Reachability and usability of the neighborhood environment | Not included | Not included | 0.993 ° [0.98; 1.00] | Not included |
| Usability of the living place/home | Not included | Not included | Not included | 0.992 ° [0.984; 1.001] | |
© 2018 by the authors. Licensee MDPI, Basel, Switzerland. This article is an open access article distributed under the terms and conditions of the Creative Commons Attribution (CC BY) license (http://creativecommons.org/licenses/by/4.0/).
Share and Cite
Leonardi, M.; Guido, D.; Quintas, R.; Silvaggi, F.; Guastafierro, E.; Martinuzzi, A.; Chatterji, S.; Koskinen, S.; Tobiasz-Adamczyk, B.; Haro, J.M.; et al. Factors Related to Unemployment in Europe. A Cross-Sectional Study from the COURAGE Survey in Finland, Poland and Spain. Int. J. Environ. Res. Public Health 2018, 15, 722. https://doi.org/10.3390/ijerph15040722
Leonardi M, Guido D, Quintas R, Silvaggi F, Guastafierro E, Martinuzzi A, Chatterji S, Koskinen S, Tobiasz-Adamczyk B, Haro JM, et al. Factors Related to Unemployment in Europe. A Cross-Sectional Study from the COURAGE Survey in Finland, Poland and Spain. International Journal of Environmental Research and Public Health. 2018; 15(4):722. https://doi.org/10.3390/ijerph15040722
Chicago/Turabian StyleLeonardi, Matilde, Davide Guido, Rui Quintas, Fabiola Silvaggi, Erika Guastafierro, Andrea Martinuzzi, Somnath Chatterji, Seppo Koskinen, Beata Tobiasz-Adamczyk, Josep Maria Haro, and et al. 2018. "Factors Related to Unemployment in Europe. A Cross-Sectional Study from the COURAGE Survey in Finland, Poland and Spain" International Journal of Environmental Research and Public Health 15, no. 4: 722. https://doi.org/10.3390/ijerph15040722
APA StyleLeonardi, M., Guido, D., Quintas, R., Silvaggi, F., Guastafierro, E., Martinuzzi, A., Chatterji, S., Koskinen, S., Tobiasz-Adamczyk, B., Haro, J. M., Cabello, M., & Raggi, A. (2018). Factors Related to Unemployment in Europe. A Cross-Sectional Study from the COURAGE Survey in Finland, Poland and Spain. International Journal of Environmental Research and Public Health, 15(4), 722. https://doi.org/10.3390/ijerph15040722