1. Introduction
The concern about risk and its implications for patient safety has always been present in the agenda of health-care managers, although, traditionally it has dealt with a reactive vision rather than proactive management [
1]. Based on the risk factor, it is split into clinical and non-clinical risk. The clinical risk includes any undesirable situation or factor related to the health-care environment that contributes to it, which can have negative consequences for the patient or be susceptible to generate what in medicine is known as adverse events (AEs) [
2,
3,
4]. Therefore, the risk of the patient may be related—by commission or omission—to a failure to execute a plan or the wrong procedure to achieve a goal, that is, with a medical error (ME) [
5]. In addition to generating risks to patient safety, these events can lead to large economic losses for the organization arising from compensation, leading to higher insurance premiums or loss of prestige and reputational risk [
6]. On the other hand, the non-clinical risk is linked to the health organization’s management system, producing losses due to deliberate deviant behavior (e.g., internal fraud), or unintentional human errors (e.g., in data processing).
As Carey and Stefos [
7] point out, the research on patient safety issues in the 1990s focused on widespread occurrence of AEs and their nature [
8,
9,
10,
11]. In this sense, although in 1980 the American Society for Healthcare Risk Management (ASHRM) was born, it was not until the publication of “
To Err is Human: Building a Safer Health System” (hereinafter, the IOM report) [
12] when risk management became a priority. This report found that 44,000 to 98,000 patients died each year in U.S. hospitals due to MEs, and on average the cost of non-fatal MEs stood between 17,000 and 19,000 million dollars annually. The IOM report [
12] stimulated the development of several studies and discussion to understand and respond to AEs [
13,
14], to establish reporting systems for [
15] or how quality could be adequately measured [
16]. Following the release of the IOM report the rate of patient safety papers increased from 59 to 164 papers per 100,000 MEDLINE
® publications [
17]; but this did not translate equally into better patient safety in practice [
18], which still has a long way to go [
19].
Therefore, the importance of health-care risk management is a current and relevant issue on the agenda of many institutions. Thus, the European Union (EU) estimates that between 8 and 12 percent of hospitalized patients suffer from AEs. In terms of costs, it amounts to an economic burden for the public health sector with direct costs of about €21 billion or 1.5% of health spending by EU member states. In the context of the financial crisis, the economic burden related with unsafe patient care received more attention [
20]. In the last decade, some relevant research on economic evaluation of clinical risk have been published (see [
7,
21,
22] for literature reviews).
The objective in the health-care sector has evolved from identifying AEs to determining cost-effective and efficient measures that improve control [
23,
24,
25]. Consequently, the goal of the paper is to enhance the advancement of the hospital control system, through the development of a new Key Risk Indicator (KRI) within the frame of balanced scorecard (BSC). This planning and management control tool, proposed by Kaplan and Norton [
26,
27,
28], enables to monitor the consequences arising from these actions by means of the integration of financial and non-financial measures. Moreover, its application is frequently limited to the use of performance measures (key performance indicator, KPI) without considering risk exposure measures (KRIs); which are presented in isolation. In this sense, this paper facilitates a comprehensive risk management framework for the healthcare organizations.
The BSC was designed according to four categories: financial performance, customer knowledge, internal business processes and learning and growth. Since then, the use and development of the BSC has been remarkable [
29]. There is an interesting academic discussion on the theoretical foundations of the tool [
30,
31,
32]. As Banchieri et al. [
30] indicate the scientific production on BSC in the health-care sector has been profuse, while in practice, the implementation has been relatively slow, unlike other industries [
33]. In the health sector, Naranjo-Gil [
34] indicates it has not been easy to effectively implement the BSC due its complexity in relation to the immaturity of the management framework itself [
35,
36], but at the same time, many researchers have proposed it as a necessary tool in the hospital management strategy to improve quality and cost-effectiveness and have strived to perfect and adapt the tool for its practical application [
37,
38,
39,
40].
In this line of research, the contribution of the paper is to test the empirical application a proactive management tool to monitor the health-care risk. Specifically, both the Value at Risk (VaR) concept and Loss Distribution Approach (LDA) are proposed as a clinical a non-clinical risk metrics, indicating the maximum potential loss that could be incurred within a given period. Originally confined to actuarial discipline [
41], the application of LDA to operational risk is explained by Embrechts and Puccetti [
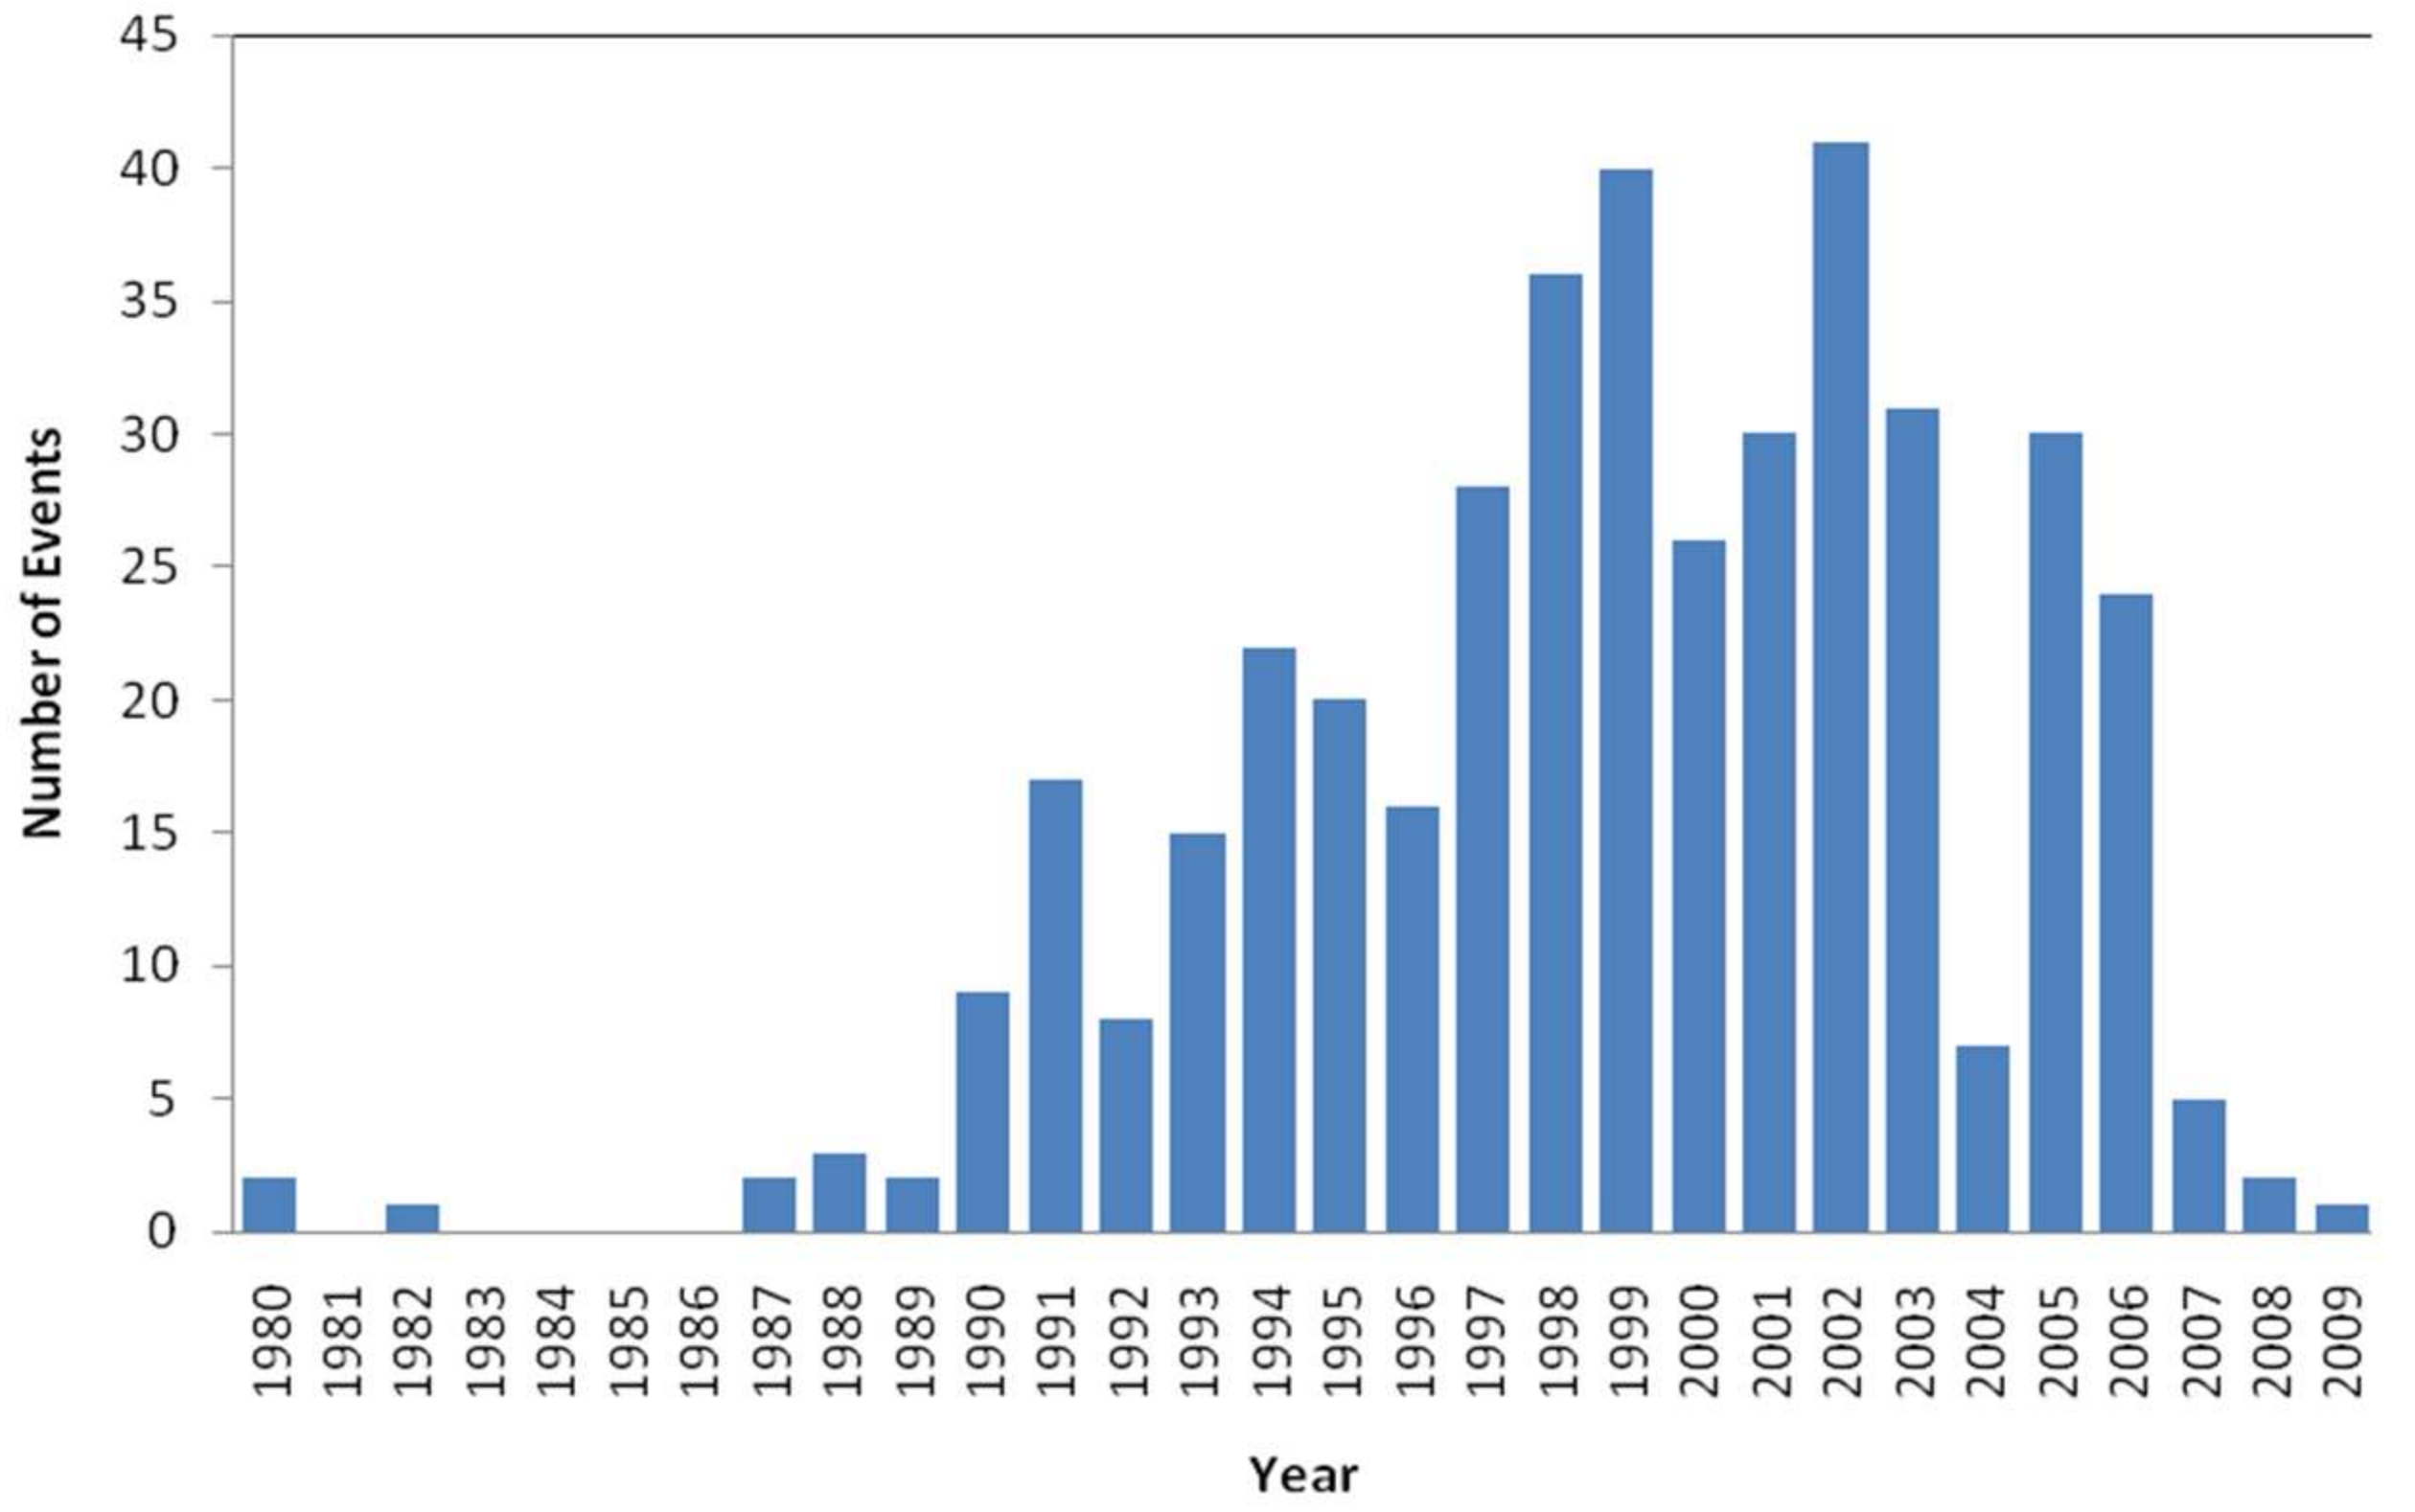
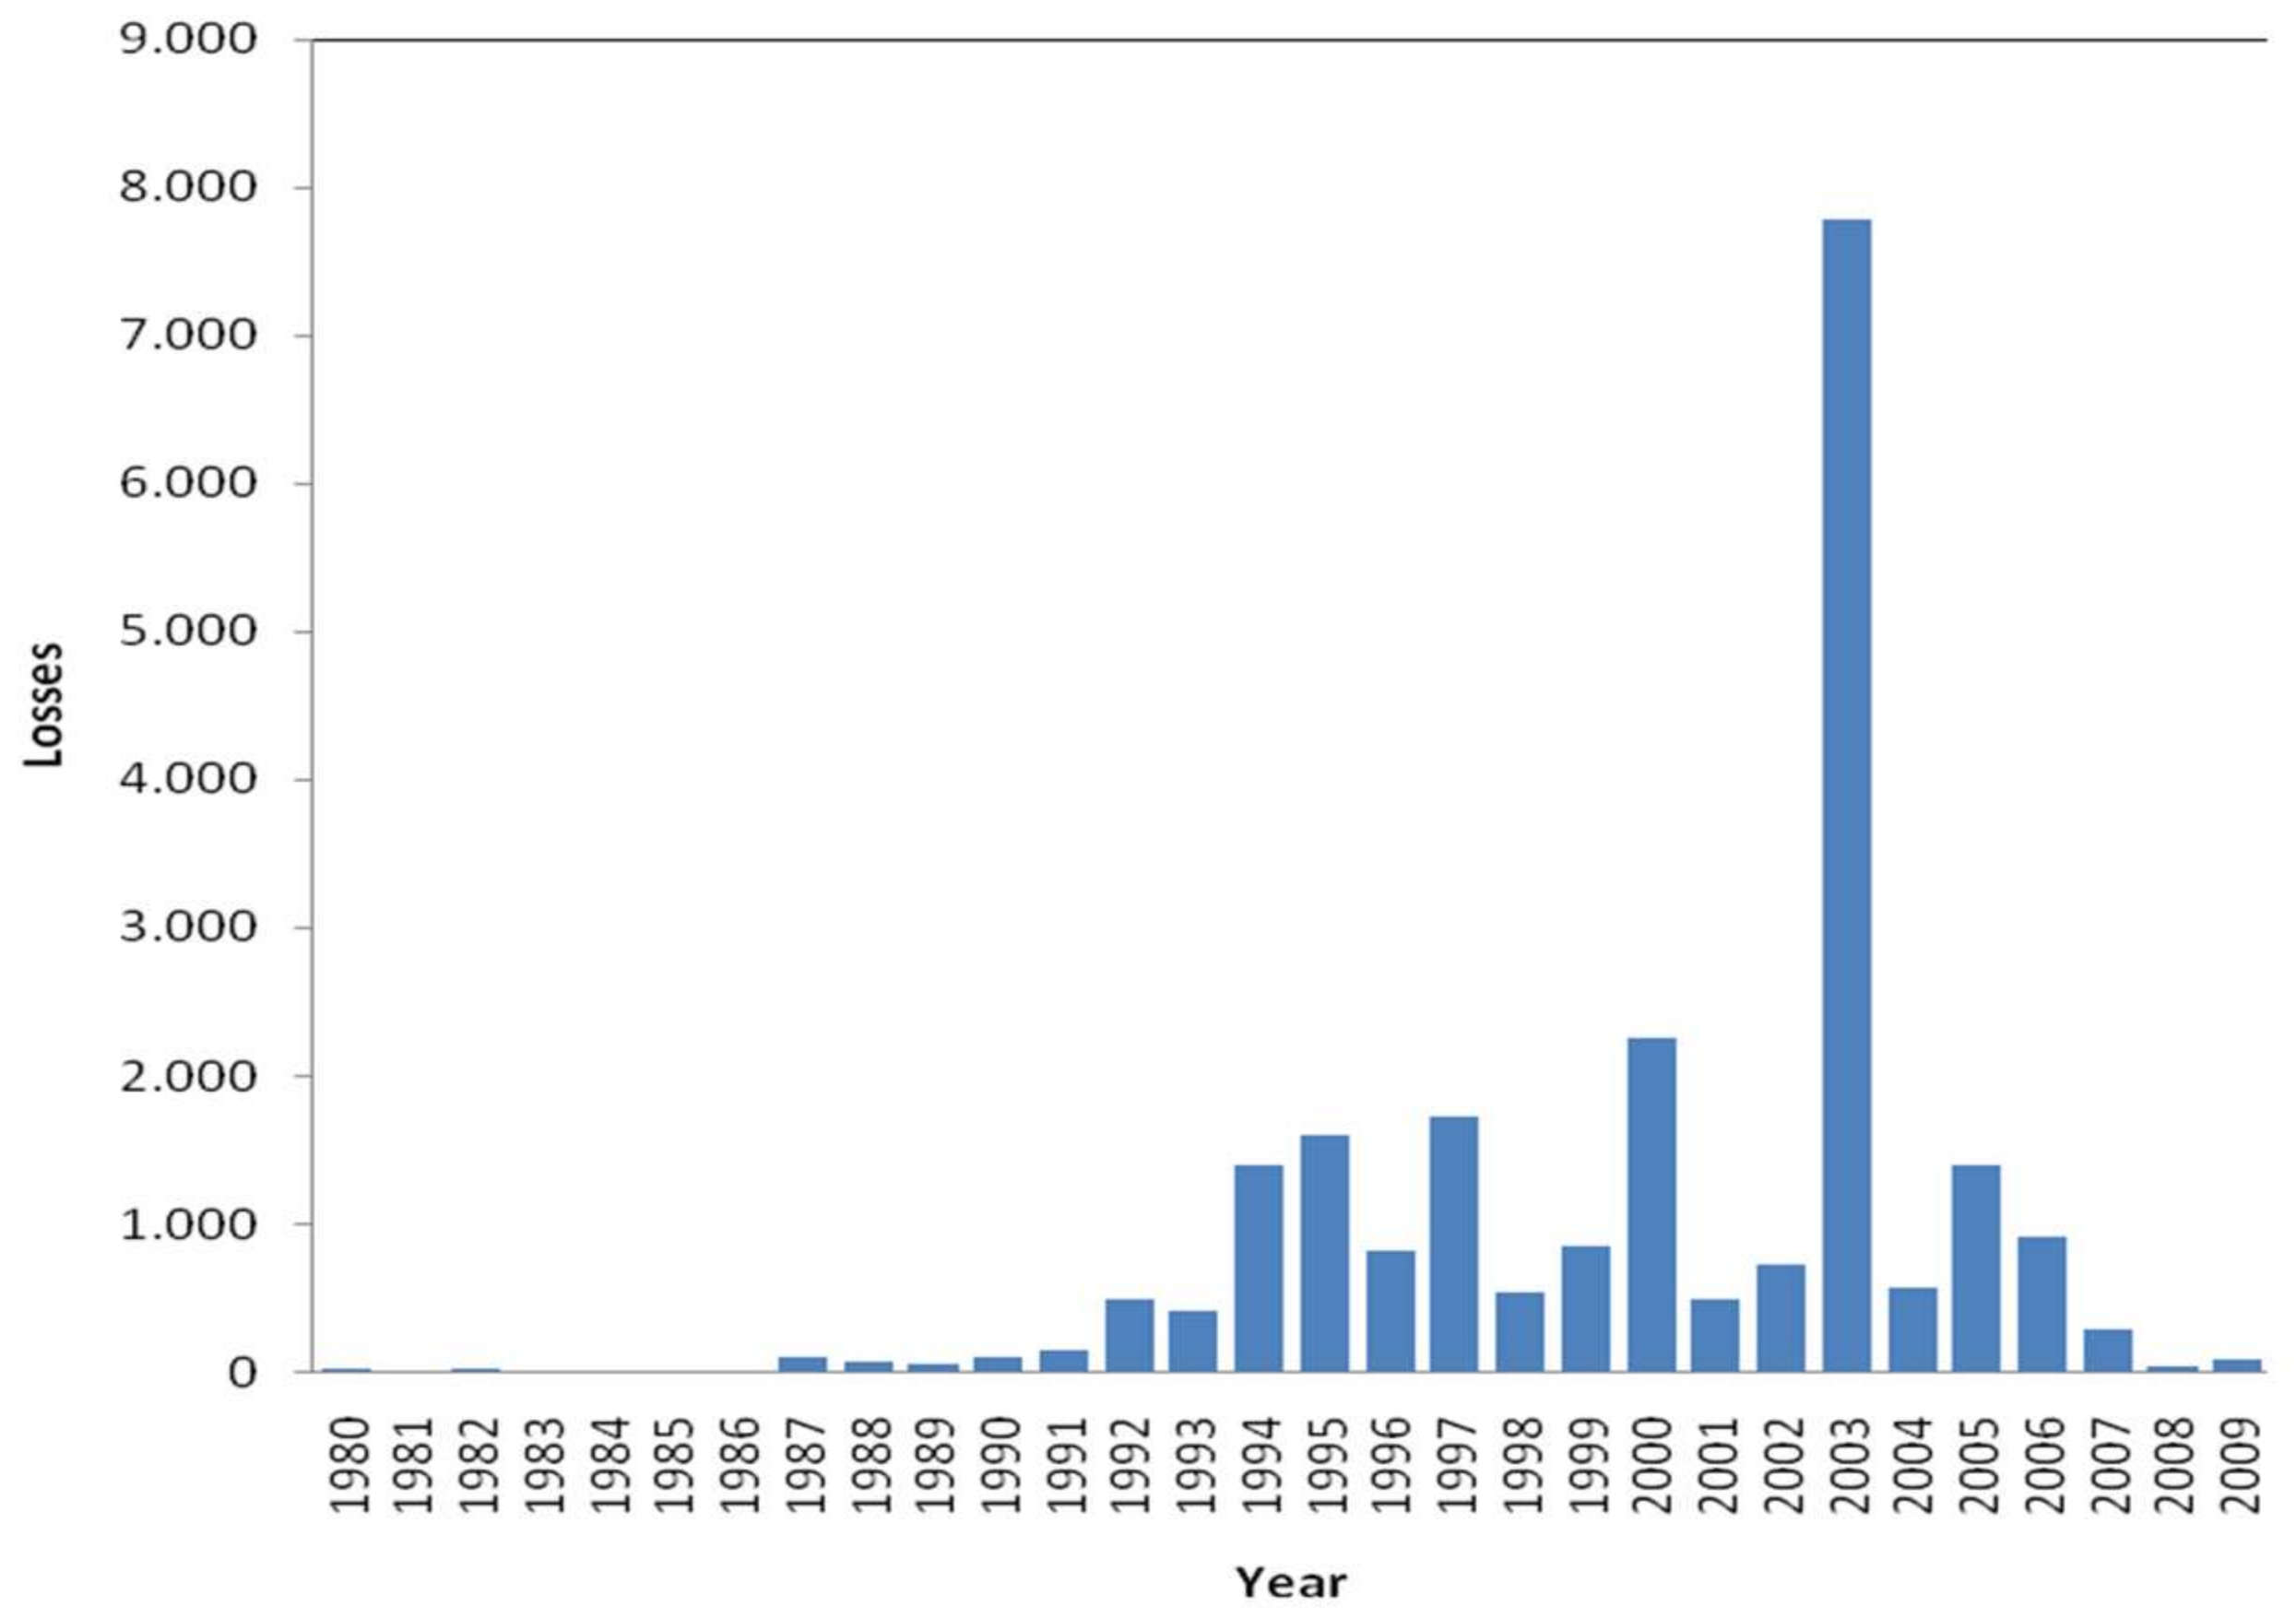
42]; in the next section, the methodological background is described. The empirical study has focused on the US health system. This study has been based on the losses due to operational events—clinical and non-clinical risk—recorded, from 1972 to 2009, in the database Algo-OpData
® provided by Algorithmics Inc. (IBM).
The results obtained show the financial impact of the health-care in the income. Therefore, analysis carried out on the performance of VaR highlight the utility of the estimating and monitoring such risk for the hospital management control system. The paper is structured as follows:
Section 2 describes the methodology.
Section 3 analyzes de data. The
Section 4 and
Section 5 summarizes the most important results and conclusions.
2. Methodology
Although risk is inherent to health activity and it is not possible to eradicate it, it can be managed, controlled and mitigated. In the academic field, there is abundant literature addressing the issue of risk management and patient safety [
43,
44]. Thus, it is assumed that the implementation of clinical risk management system improves the quality of care and the patient safety. Zineldin et al. [
5] propose an integrated approach based on five quality dimensions (5Qs) for reducing medical errors and increasing patient safety [
45].
In the strategy framework, the BSC allows identifying and monitoring the clinical risk ongoing and the sustainability of the risk control. The tool enables metrics to be linked together in a series of cause-and-effect relationships, affecting cost-effectiveness performance [
46]. The classic BSC is based on the four main dimensions: financial performance, customer knowledge, internal processes and learning and growth. For each of them, the healthcare organization should define: (i) objectives; (ii) KPIs; (iii) measures; (iii) target; and (iv) initiatives. Consequently, the goodness of the BSC will be based on the usefulness of the previous indicators.
From an exhaustive literature review for the period 1975 to 2012, Azami-Aghdash et al. [
25] identified 361 health-care indicators: 129 risk management indicators and 232 clinical effectiveness indicators; the highest number of indicators was related to patient safety.
In this paper, the BSC is enriched by introducing a new KRI based on the Value at Risk (VaR) concept. The adaptation of VaR to the hospital management system improves the supervision and control by linking the KPI to KRI, i.e., by integrating performance with risk management. Patient Wait Time, for example, is a frequently used KPI. In this regard, the objective of a healthcare organization should be to reduce the average amount of time that patient must wait between checking-in and being treated. But the checking-in process is exposed to potential errors—such as the data registration or find and attach medical history, for example—that could generate adverse event (AE) for the patient by providing an inadequate treatment. Consequently, the achievement of the targeted KPI must be linked to the success of the critical risk factor (KRI). Moreover, its implementation can improve the hospital’s management system.
VaR is accepted as a standard risk measure in the financial sector [
47]. According to Embrechts et al. [
48], there are four essential VaR applications: risk management, financial control, financial reporting and estimating regulatory capital in banking. Although its usefulness in the health sector can be large, e.g., Dehlendorff et al. [
49] apply the Conditional Value at Risk (CVaR) as an indicator of hospital waiting time.
Mathematically, for a given confidence level
,
VaR is defined as follows:
where the probability
P that the loss
L exceeds the value
l will not be higher than (1 −
α).
Although this approach comes from the financial risk management field, it can be transposed to any other risk-exposed industries, such as healthcare. It indicates the maximum expected loss that a hospital or clinical management unit could incur due to the risks associated to its processes, during a period and within a confidence interval established; in this paper, it is named as Clinical-VaR or Non-Clinical-VaR. Thus, for financial control and management purposes, parameters α for VaR as 1%, 5% or 10% and times horizon quarterly, semesters or annual could be suitable combinations.
In any case, for the health-care manager, Clinical-VaR shouldn’t be a simple figure, it must be a management system. As Jorion [
50] points out, the main goodness of a VaR-based risk management is the continuous improvement of processes. The system is to run periodically estimating the Clinical-VaR, that is, exposure to inherent risk. This risk metric forces hospital managers to set up corrective actions or controls, improving the management system. These improvements can be transferred to the BSC through risk scores, thus reflecting the residual risk or the Clinical-VaR
Net (see
Figure 1).
2.1. Loss Distribution Approach
Since VaR is a percentile applied to the distribution function of a certain variable, in the case of AEs it is linked to the Loss Distribution Approach (LDA). Developed for Bühlmann [
41], this statistical technique aims to obtain a probability distribution of aggregate losses. The model is based on historical events from which the function of both severity and frequency are estimated. Consequently, the implementation of Clinical-VaR as a management tool is linked to the development of an Adverse Event Reporting System (AERS) that allows building a database.
2.2. Frequency Model
The random variable N represents the number of events occurred in a determined time known as risk horizon τ. The loss frequency distribution P
t is a discrete variable defined by:
where p represents the probability function of events (k).
A priori, any nonnegative discrete probability distribution would be a potential candidate to fit the frequency [
51]. Fountnouvelle et al. [
52] suggest the Poisson distribution (Po) as the best starting point to modelling recurring and random events. The Poisson is characterized by a single parameter, λ, representing the mean and the variance of the distribution. In this study, the Negative-Binomial (NB) and Geometric (Ge) distributions are also showed; commonly used in the modelling of the frequency of operational risk [
53]. These functions are described in detail below:
2.3. Severity Model
Severity refers to the economic impact caused by an AE (clinical risk) or other operatives and management events (non-clinical risk). The severity is defined as: “a continuous random variable, (
Xk)
k ∈
N, that takes positive values, which are independent of each other, and identically distributed (iid)” [
54]. Panjer [
51] provides a compendium of functions that could be used. In practice, the sample of events shows both high asymmetry and kurtosis. In order to determine which probabilistic function best fit the data, Dutta and Perry [
55] suggest:
Goodness of fit (GOF): Statistically, which is the degree of adjustment of adverse event data related to the distribution?
Realistic: The estimated Clinical-VaR through the model; is it a realistic vision? Does it make economic sense?
Well specified: are the characteristics of the theoretical distribution and the ones of the empirical sample of loss events consistent?
Flexible: Can the model be extrapolated to a wide range of samples of losses due to clinical risk?
Simple: Is the implementation of the model workable from the hospital management system?
Moscadelli [
56] considers studying the distributions according to theirs kurtosis: he proposes the Weibull function for soft tail; the Lognormal or Gumbel in medium tail; and for the ones of heavy tails the Pareto’s function. On the other hand, Fountnouvelle et al. [
52] agree on the reasoning, so for heavy-tail distributions suggest the Pareto, Pareto-generalized, the Burr, the Log-Logistic and the Log-Gamma functions. In line with the above-mentioned studies, it seemed appropriate to use a range of functions with features different in terms of their tail. Thus, the selected candidates are the following: Burr (Bu), Inverse-Gaussian (IG), Log-Logistic (LL), Log-Normal (LN), Normal (N), Pareto (Pa) and (We) Weibull. The Normal function has been included to discard the Gaussian path of operational losses in the health-care organizations.
2.4. Goodness of Fit
Since the Clinical-VaR is a statistical estimate, the success of its application will depend on determining the most suitable probability distribution to the existing data. Thus, once the families of distributions have been proposed, the consistency of these with the empirical distribution function (EDF) must be tested. The contrast of Kolmogorov-Smirnov (KS) is recommended in the study of continuous variables. The KS statistic is denoted by “
D” and represents the maximum distance, in absolute terms, between the theoretical,
, and empirical,
, distribution function:
where
and
. To make comparable samples of different sizes, the supremum class statistics are multiplied by
and the quadratic class by
n [
57]. The resulting statistic
D has been compared with the appropriate critical value for a stated level of significance (α) and is denoted by
dα. In expression (14) are represented the null,
, and alternative,
, hypothesis:
so if
D ≤ dα,
is accepted for a level of significance α, in other words, if
p-value ≥
α → accept
. In addition, to validate the choice of distribution and therefore to reduce the risk of the model, it has been fit to be supported by graphical tools such as the Probability-Probability (PP) Plots.
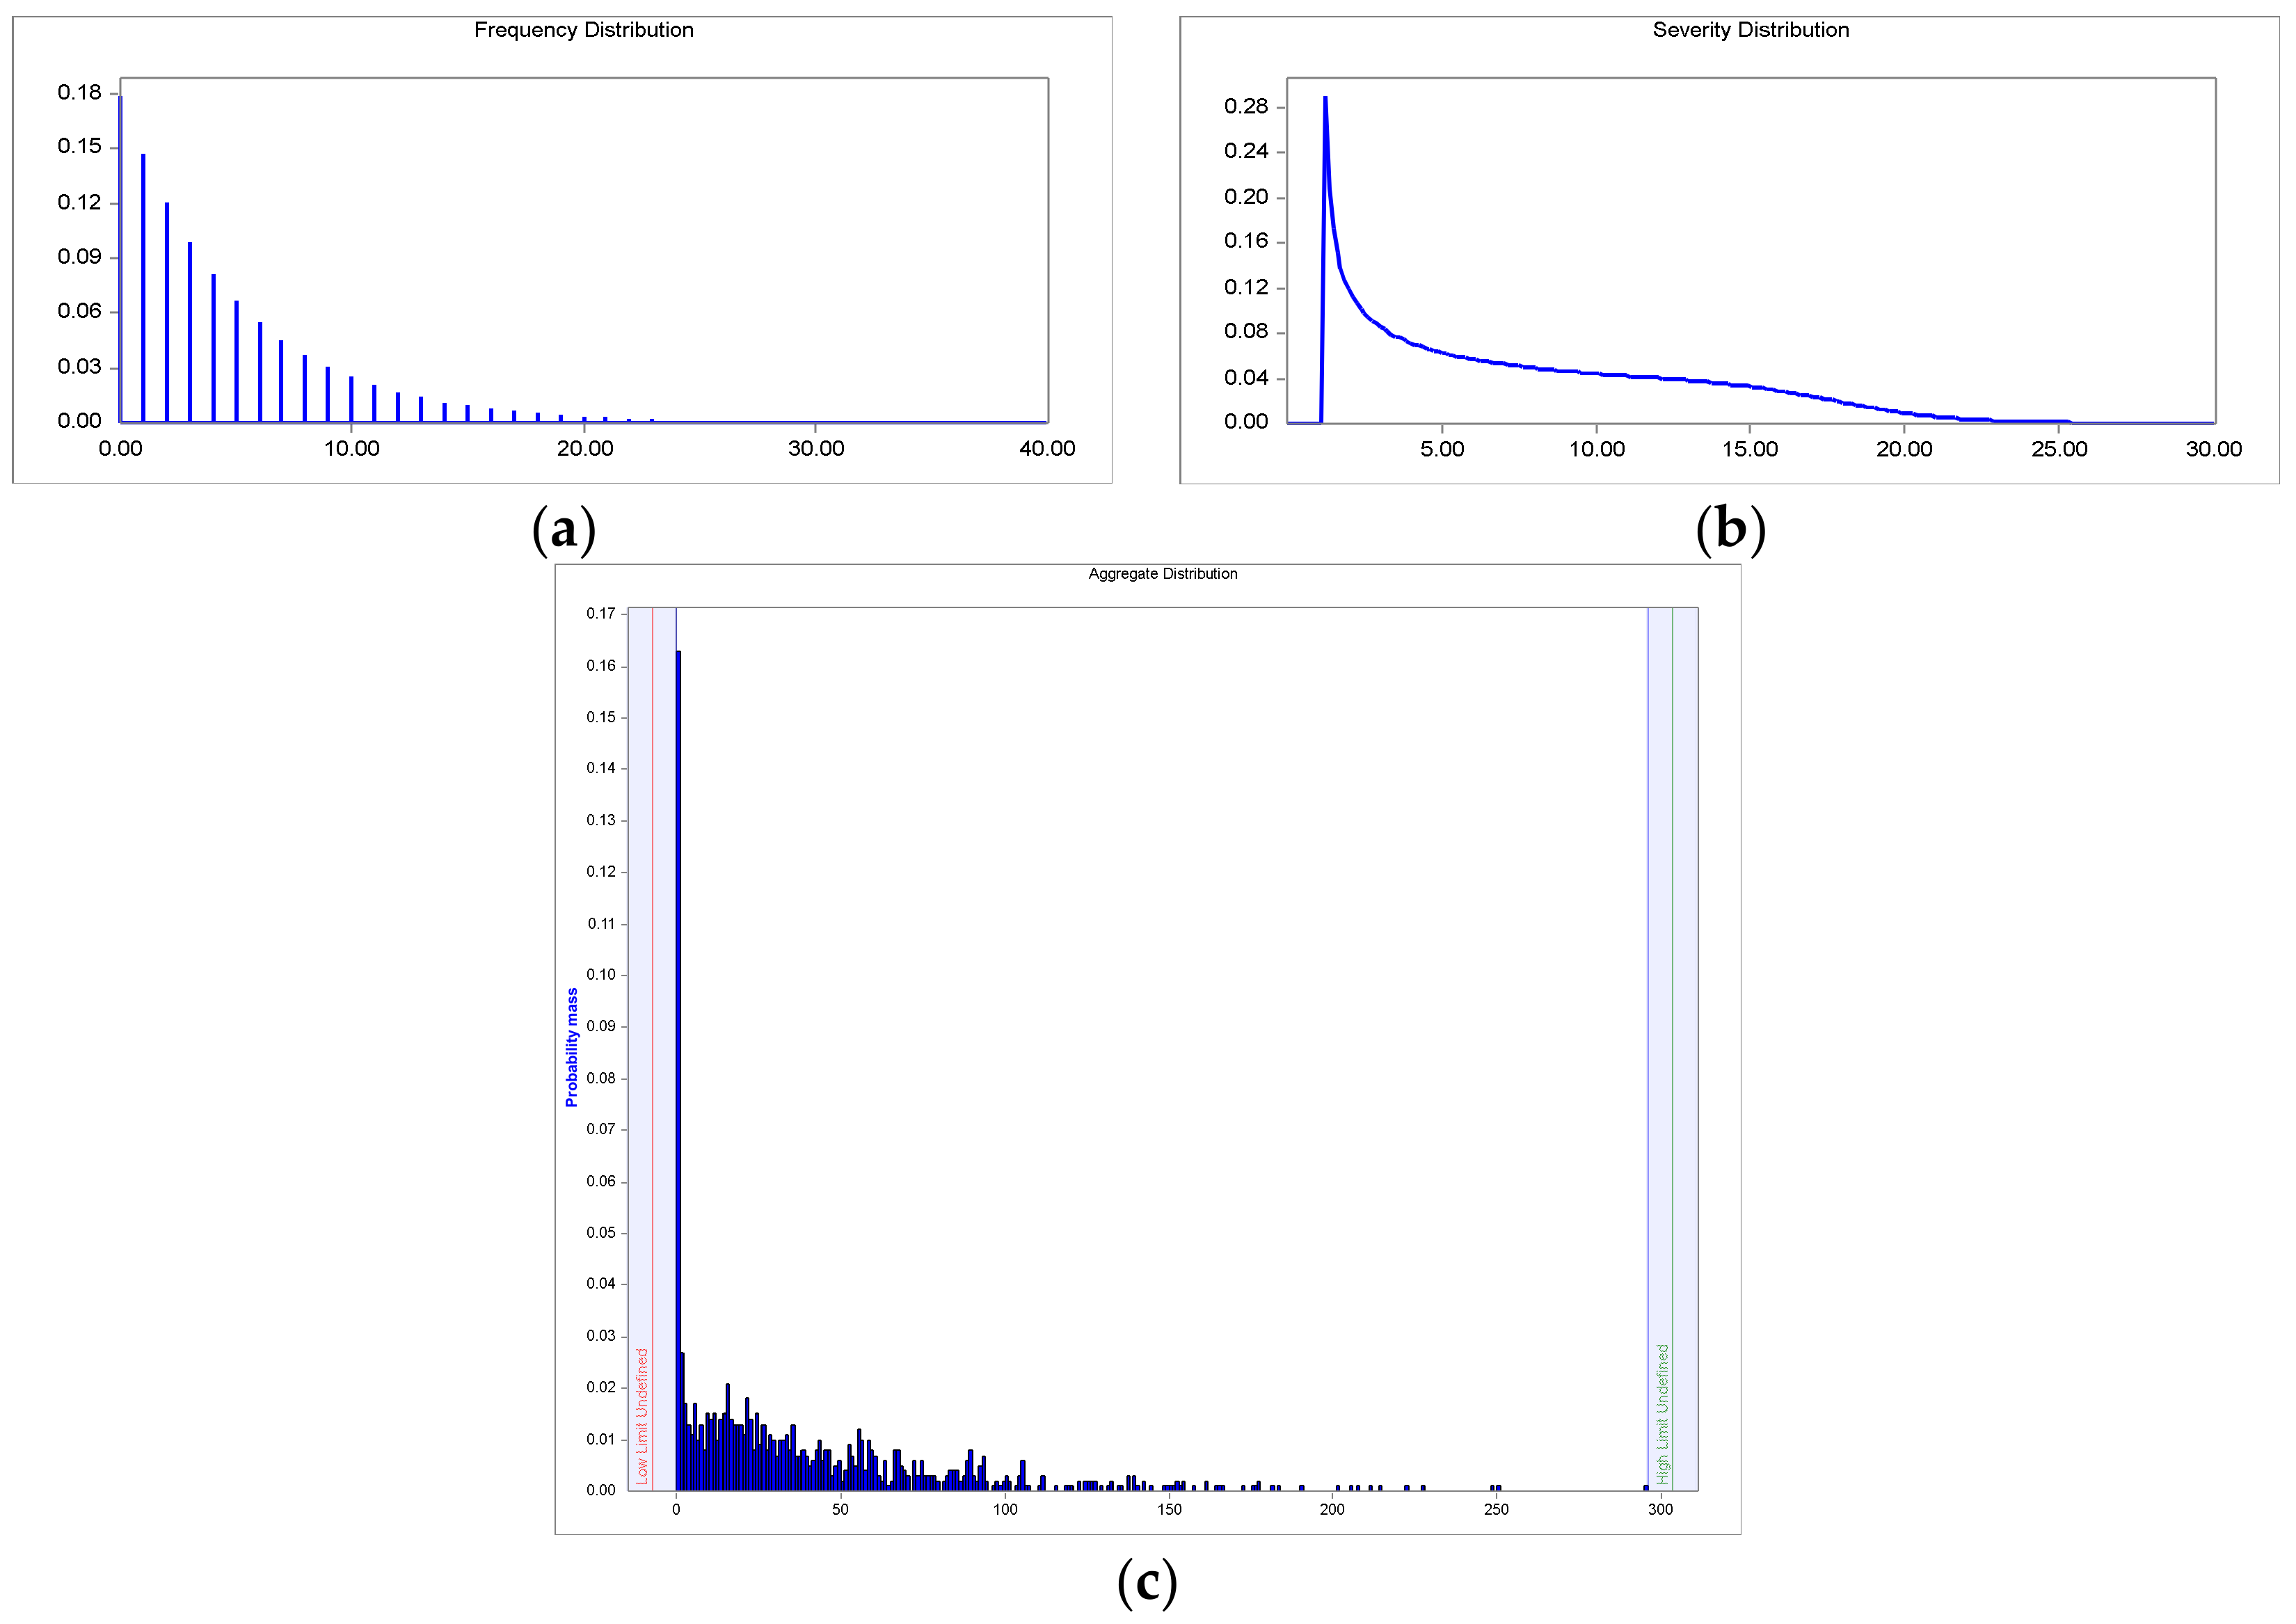
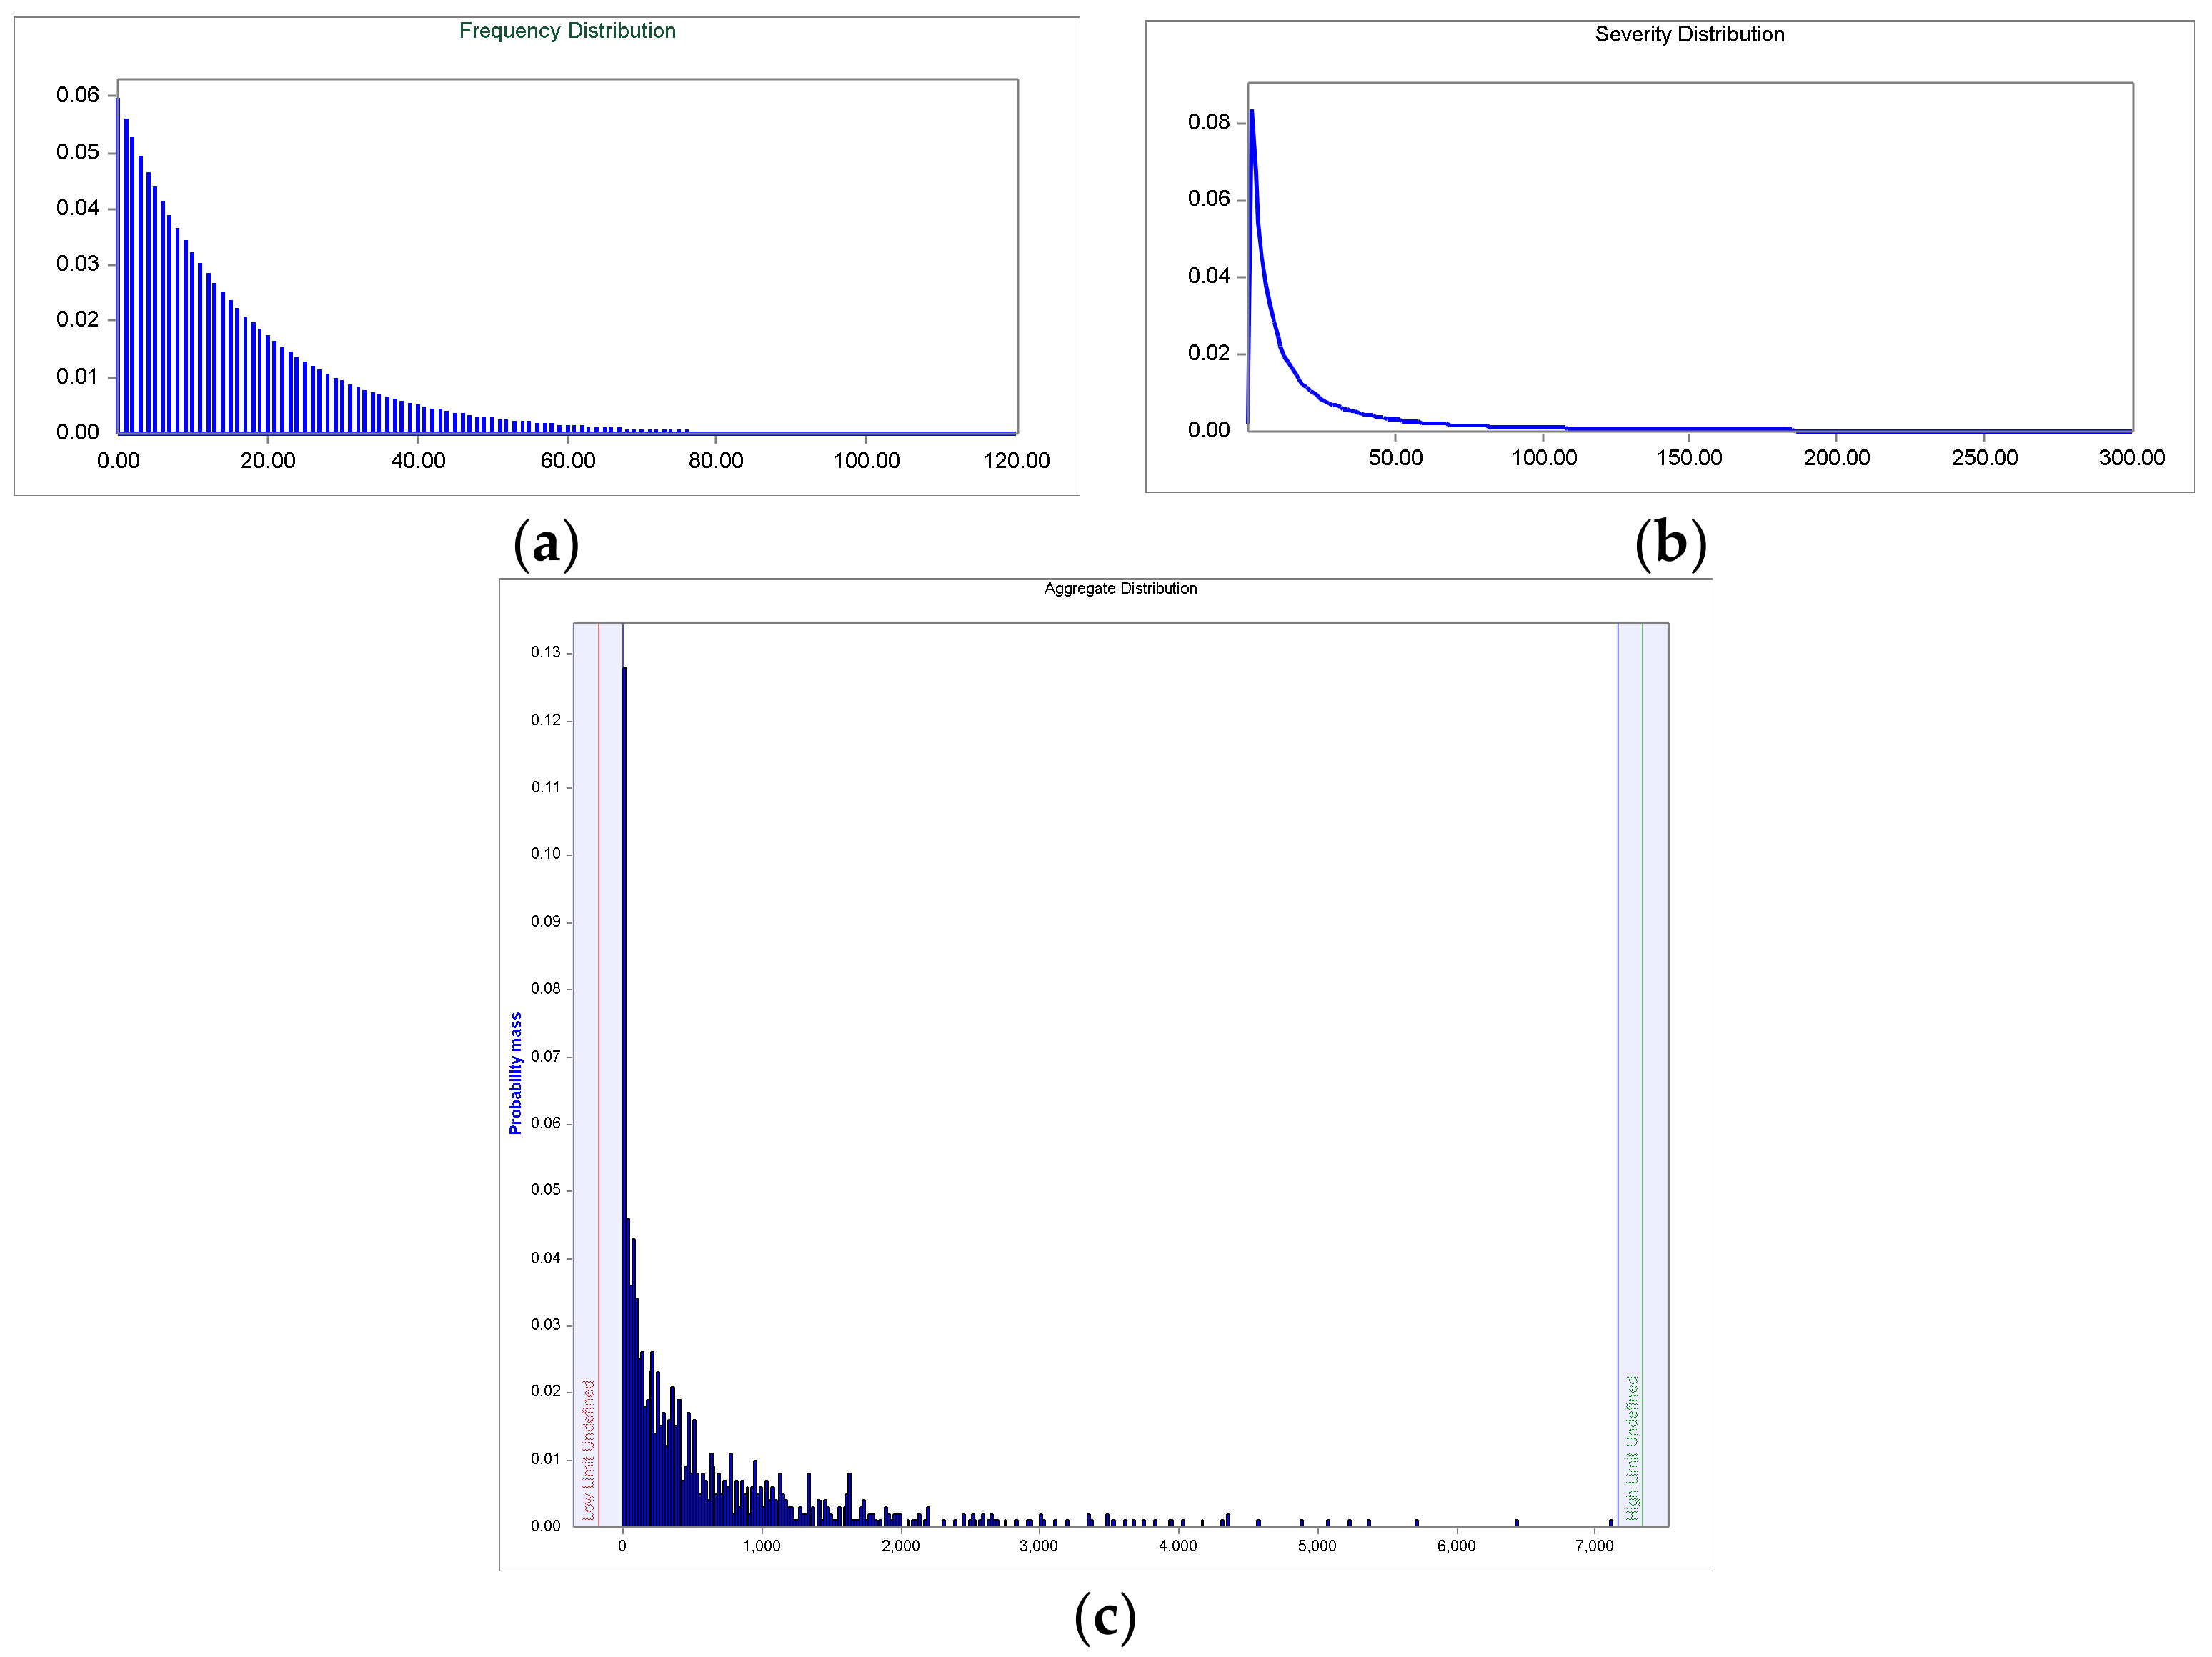
2.5. Estimation of the Aggregated Loss Distribution
Having described the distributions of severity and frequency, the aggregated losses distribution (ALD) is obtained by compounding of both. If the aggregate losses are denoted as a sum,
S, associated to a set of
N observed individual losses, (
), being
where,
Xi is the severity and N the number of events in the time interval [0, t], i.e., the event count. Assuming the severity and the frequency processes are independent [
58], the aggregated loss distribution is defined as:
The distribution function of
S is denoted as F. The cumulative distribution function of the loss aggregated is represented as
:
The asterisk denotes the convolution in function
, where
n-times is the convolution of F with itself, i.e.:
Convolution is a mathematical process that converts the frequency and severity distributions on third distribution (ALD) by superimposing both [
59]. For the estimation of the
a Monte-Carlo simulation has been applied:
A random sample of the frequency distribution is generated, i.e., n loss events per year are simulated.
N random samples of the distribution of severity are taken: L1 + L2 + L3+ … + Ln
The computation of the n simulated losses represents the total loss: X = L1 + L2 + L3 + … + Ln
Return to step 1, and it is repeated m times: X1, X2, X3, …, Xm
Therefore, m represents the number of generated simulations. In this study, for each of the convolutions made it has been made a million simulations, obtaining relative errors well below 1%.
2.6. Clinical-Value at Risk
For the Clinical-VaR and Non-Clinical-VaR calculation only apply the selected percentile to ALD. In this case, VaR is an internal variable management in the health-care, consequently, the risk managers may select the percentile discretionally based on their management criterion. In the study, there have been selected the 90, 95 and 99 percent to analyze their impact. Expression (18) represents the synthetic Clinical-VaR formula:


