Figure 1.
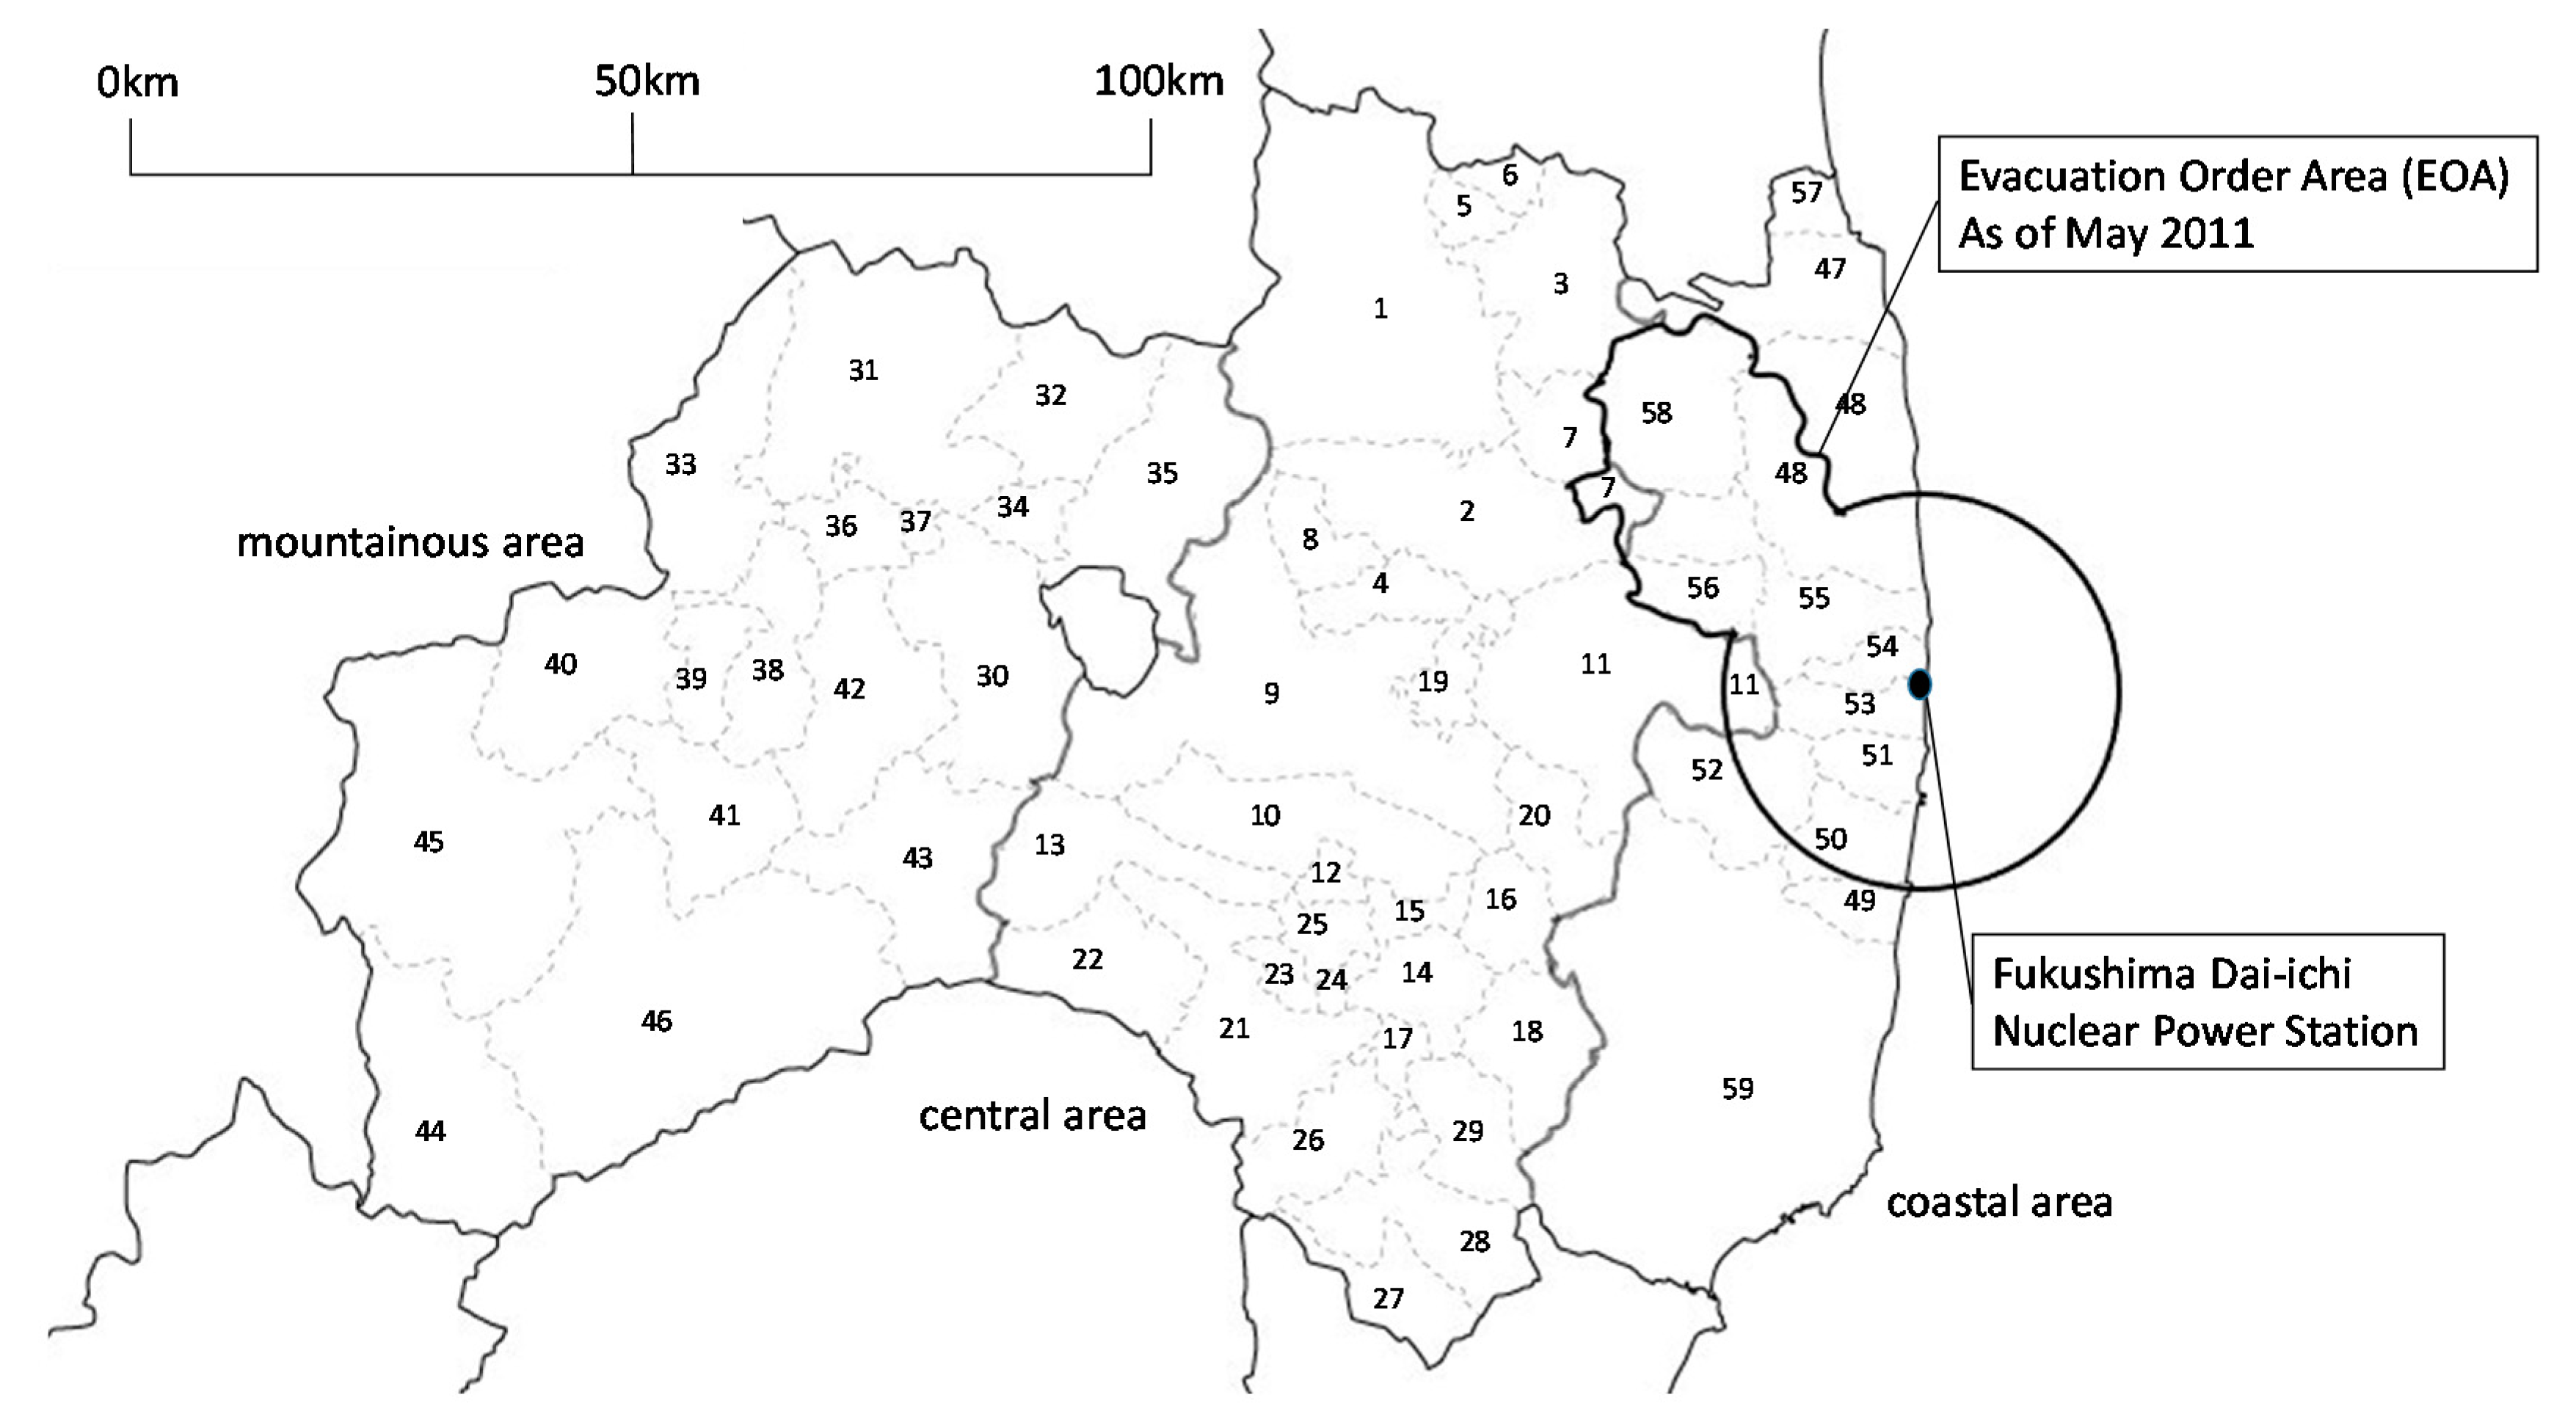
Map of municipalities in Fukushima Prefecture. EOA = evacuation order areas. Central area: 1. Fukushima City, 2. Nihonmatsu City, 3. Date city, 4. Motomiya City, 5. Ko-ori Town, 6. Kunimi Town, 7. Kawamata Town, 8. Otama Town, 9. Koriyama City, 10. Sukagawa City, 11. Tamura City, 12. Kagamiishi Town, 13. Tenei Village, 14. Ishikawa Town, 15. Tamakawa Village, 16. Hirata Village, 17. Asakawa Town, 18. Furudono Town, 19. Miharu Town, 20. Ono Town, 21. Shirakawa Town, 22. Nishigou Village, 23. Izumizaki Village, 24. Nakajima Village, 25. Yabuki Village, 26. Tanagura Village, 27. Yamatsuri Town, 28. Hanawa Town, 29. Samegawa Village. Mountainous area, 30. Aizuwakamatsu City, 31. Kitakata City, 32. Kitashiobara Village, 33. Nishiaizu Town, 34. Bandai Town, 35. Inawashiro Town, 36. Aizubange Town, 37. Yugawa Village, 38. Yanaizu Town, 39. Mishima Town, 40. Kaneyama Town, 41. Showa Village, 42. Aizumisato Town, 43. Shimogo Town, 44. Hinoemata Village, 45. Tadami Town, 46. Minami-aizu Town. Coastal area other than EOAs, 47. Soma City, 57. Shinchi Town, 59. Iwaki City. EOAs, 48. Minamisoma City, 49. Hirono Town, 50. Naraha Town, 51. Tomioka Town, 52. Kawauchi Village, 53. Okuma Town, 54. Futaba Town, 55. Namie Town, 56. Katsurao Village, 58. Iitate Village. Survey area for each year. 2010: 1–5, 8–12, 15, 19, 21, 22, 28–31, 35, 38, 42, 46–48, 51, 54, 57, 59. 2011: 1–5, 7, 9–12, 14, 16, 21, 23, 25, 26, 36, 40, 42, 43, 47, 48, 50–52, 59. 2012: 1–4, 6, 8–11, 13, 17, 19, 21, 22, 25, 30, 31, 34, 36, 42, 45, 47, 48, 51, 53, 57, 59. 2013: 1–5, 7, 9–12, 18, 20, 21, 23, 26, 27, 30, 31, 33, 38, 42, 46–49, 51, 52, 59. 2014: 1–4, 6, 8–11, 14, 18, 20–22, 24, 26, 30, 31, 33, 37, 42, 46–49, 52, 55, 59. 2015: 1–5, 7, 9–12, 15, 19, 21, 22, 25, 26, 30, 31, 34, 36, 42, 46–48, 51, 54, 57, 59.
Figure 1.
Map of municipalities in Fukushima Prefecture. EOA = evacuation order areas. Central area: 1. Fukushima City, 2. Nihonmatsu City, 3. Date city, 4. Motomiya City, 5. Ko-ori Town, 6. Kunimi Town, 7. Kawamata Town, 8. Otama Town, 9. Koriyama City, 10. Sukagawa City, 11. Tamura City, 12. Kagamiishi Town, 13. Tenei Village, 14. Ishikawa Town, 15. Tamakawa Village, 16. Hirata Village, 17. Asakawa Town, 18. Furudono Town, 19. Miharu Town, 20. Ono Town, 21. Shirakawa Town, 22. Nishigou Village, 23. Izumizaki Village, 24. Nakajima Village, 25. Yabuki Village, 26. Tanagura Village, 27. Yamatsuri Town, 28. Hanawa Town, 29. Samegawa Village. Mountainous area, 30. Aizuwakamatsu City, 31. Kitakata City, 32. Kitashiobara Village, 33. Nishiaizu Town, 34. Bandai Town, 35. Inawashiro Town, 36. Aizubange Town, 37. Yugawa Village, 38. Yanaizu Town, 39. Mishima Town, 40. Kaneyama Town, 41. Showa Village, 42. Aizumisato Town, 43. Shimogo Town, 44. Hinoemata Village, 45. Tadami Town, 46. Minami-aizu Town. Coastal area other than EOAs, 47. Soma City, 57. Shinchi Town, 59. Iwaki City. EOAs, 48. Minamisoma City, 49. Hirono Town, 50. Naraha Town, 51. Tomioka Town, 52. Kawauchi Village, 53. Okuma Town, 54. Futaba Town, 55. Namie Town, 56. Katsurao Village, 58. Iitate Village. Survey area for each year. 2010: 1–5, 8–12, 15, 19, 21, 22, 28–31, 35, 38, 42, 46–48, 51, 54, 57, 59. 2011: 1–5, 7, 9–12, 14, 16, 21, 23, 25, 26, 36, 40, 42, 43, 47, 48, 50–52, 59. 2012: 1–4, 6, 8–11, 13, 17, 19, 21, 22, 25, 30, 31, 34, 36, 42, 45, 47, 48, 51, 53, 57, 59. 2013: 1–5, 7, 9–12, 18, 20, 21, 23, 26, 27, 30, 31, 33, 38, 42, 46–49, 51, 52, 59. 2014: 1–4, 6, 8–11, 14, 18, 20–22, 24, 26, 30, 31, 33, 37, 42, 46–49, 52, 55, 59. 2015: 1–5, 7, 9–12, 15, 19, 21, 22, 25, 26, 30, 31, 34, 36, 42, 46–48, 51, 54, 57, 59.
![Ijerph 15 00516 g001]()
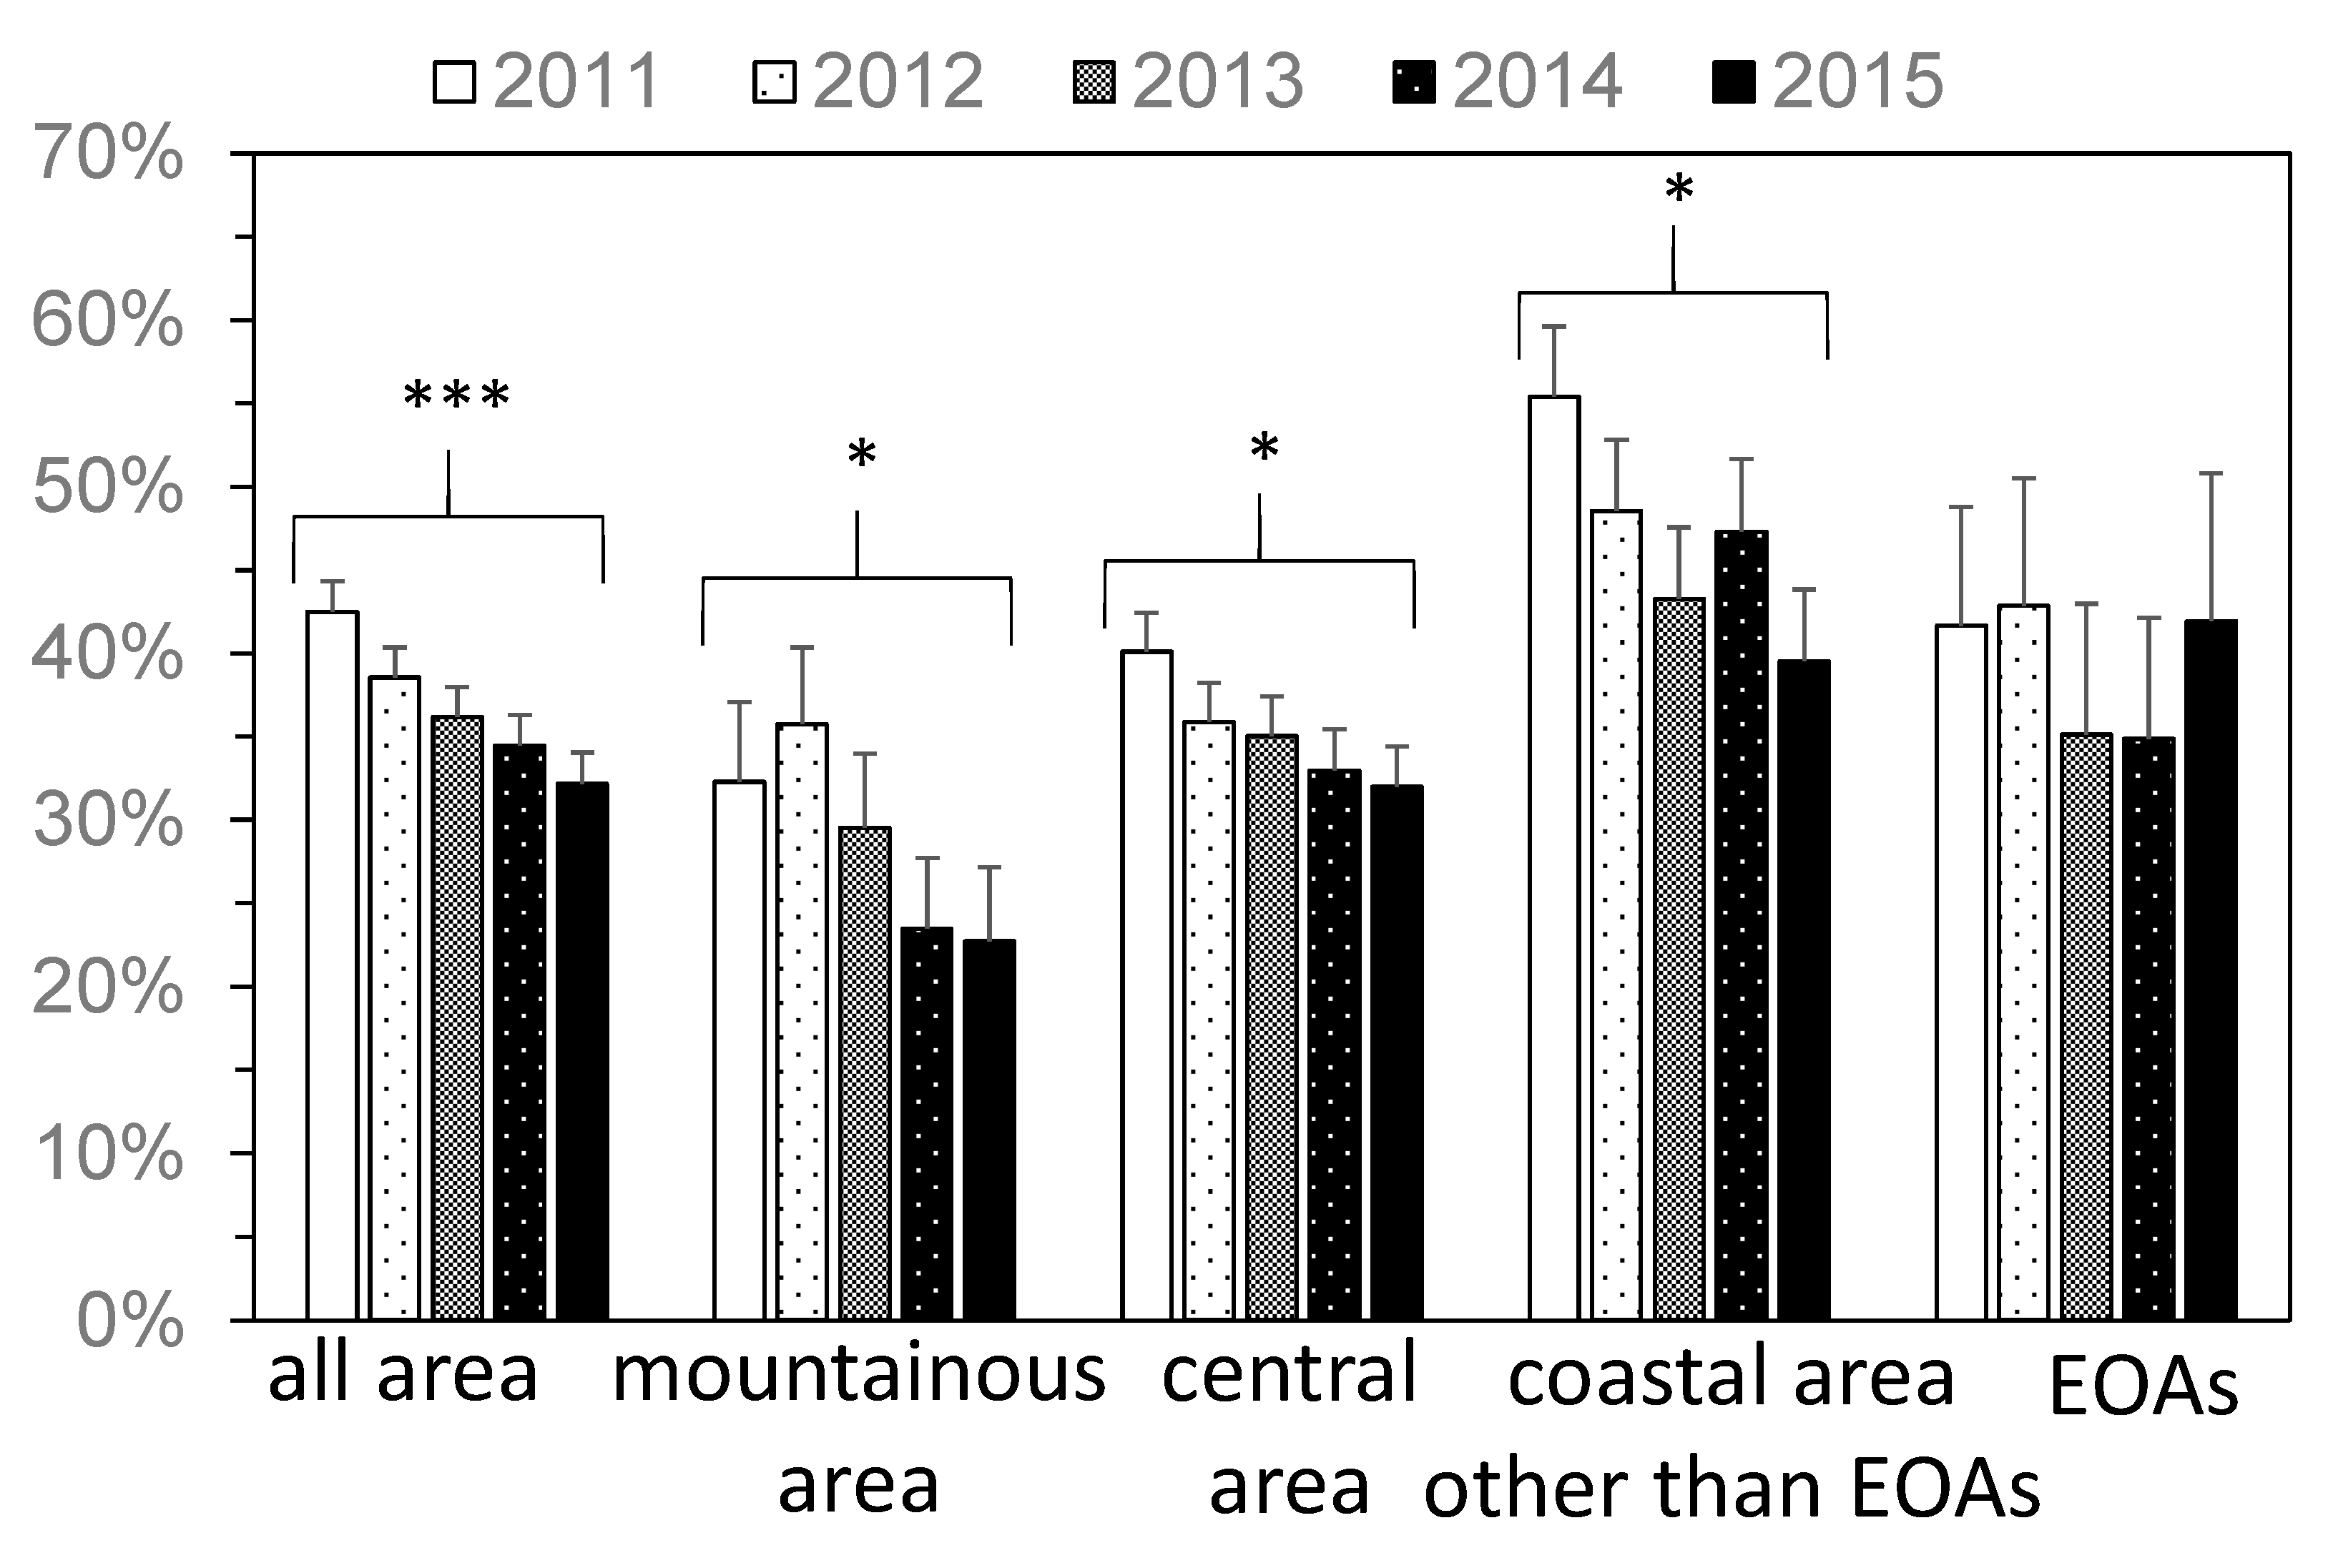
Figure 2.
The yearly change in the percentage of people who prepared for disasters (A1). Error bar represents standard error. EOA = evacuation order areas. * p ≤ 0.05, *** p ≤ 0.001.
Figure 2.
The yearly change in the percentage of people who prepared for disasters (A1). Error bar represents standard error. EOA = evacuation order areas. * p ≤ 0.05, *** p ≤ 0.001.
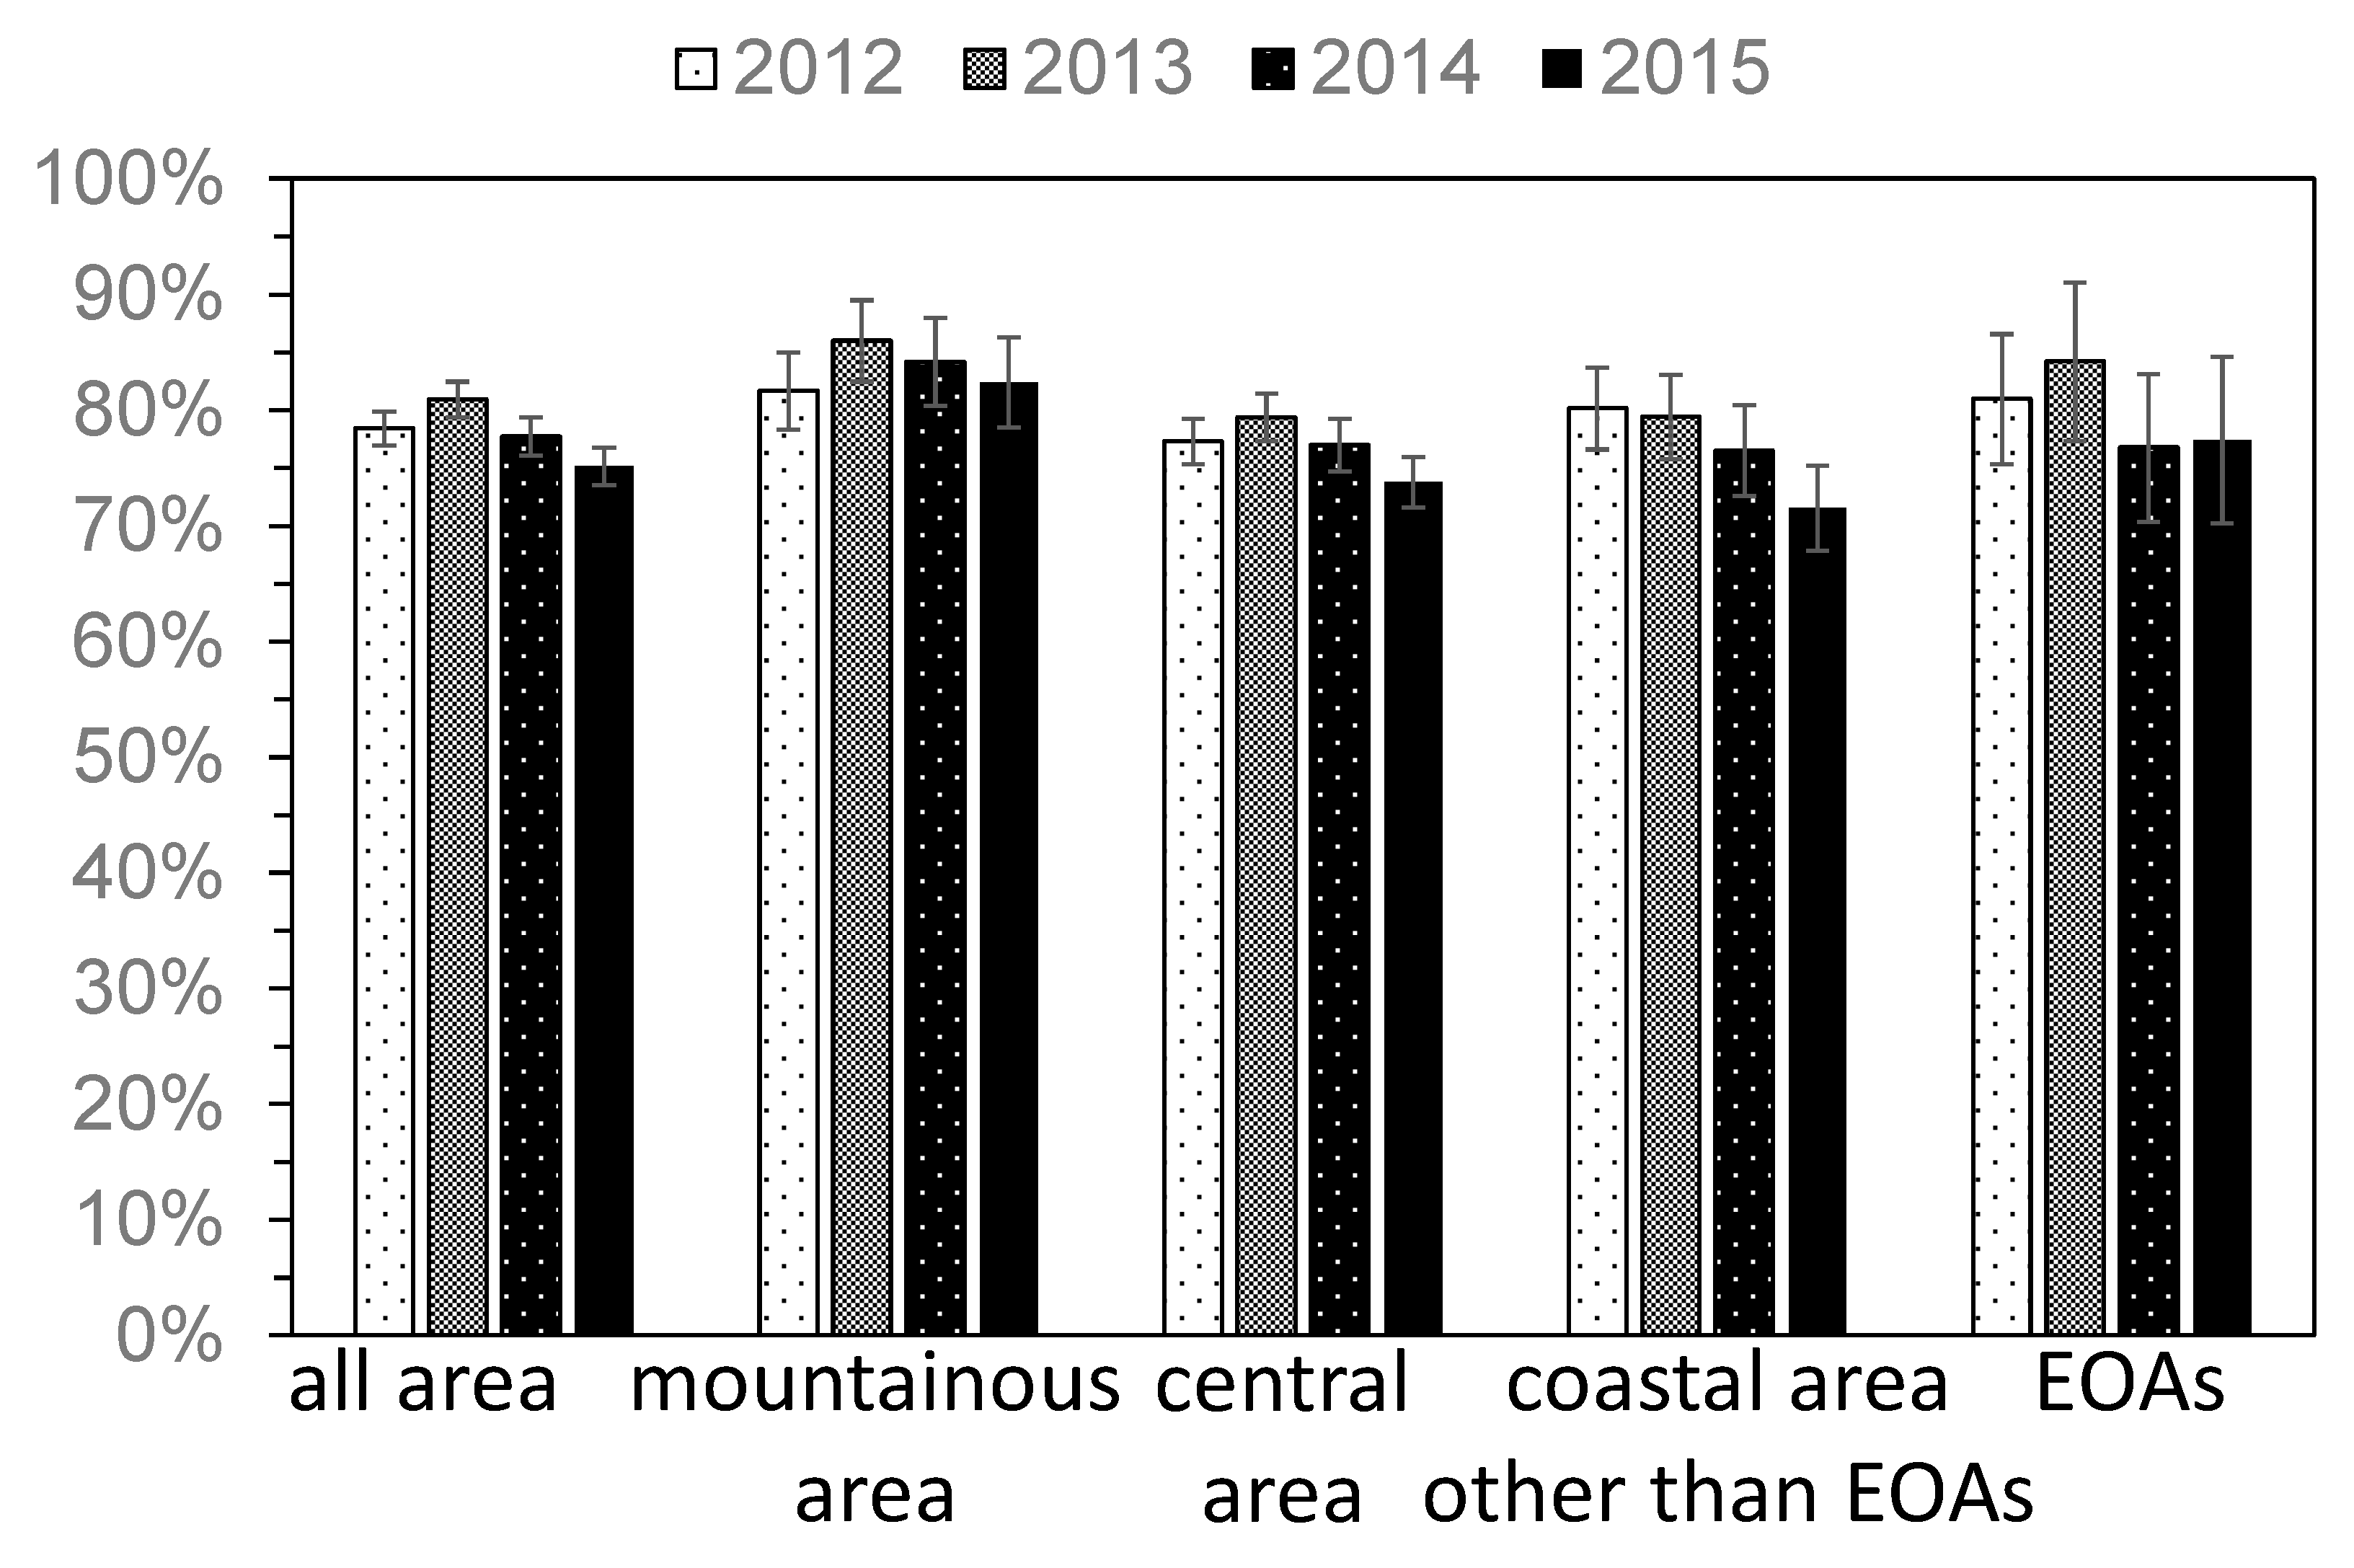
Figure 3.
The yearly change in the percentage of people who utilized health checkups (A2). Error bar represents standard error. EOA = evacuation order areas.
Figure 3.
The yearly change in the percentage of people who utilized health checkups (A2). Error bar represents standard error. EOA = evacuation order areas.
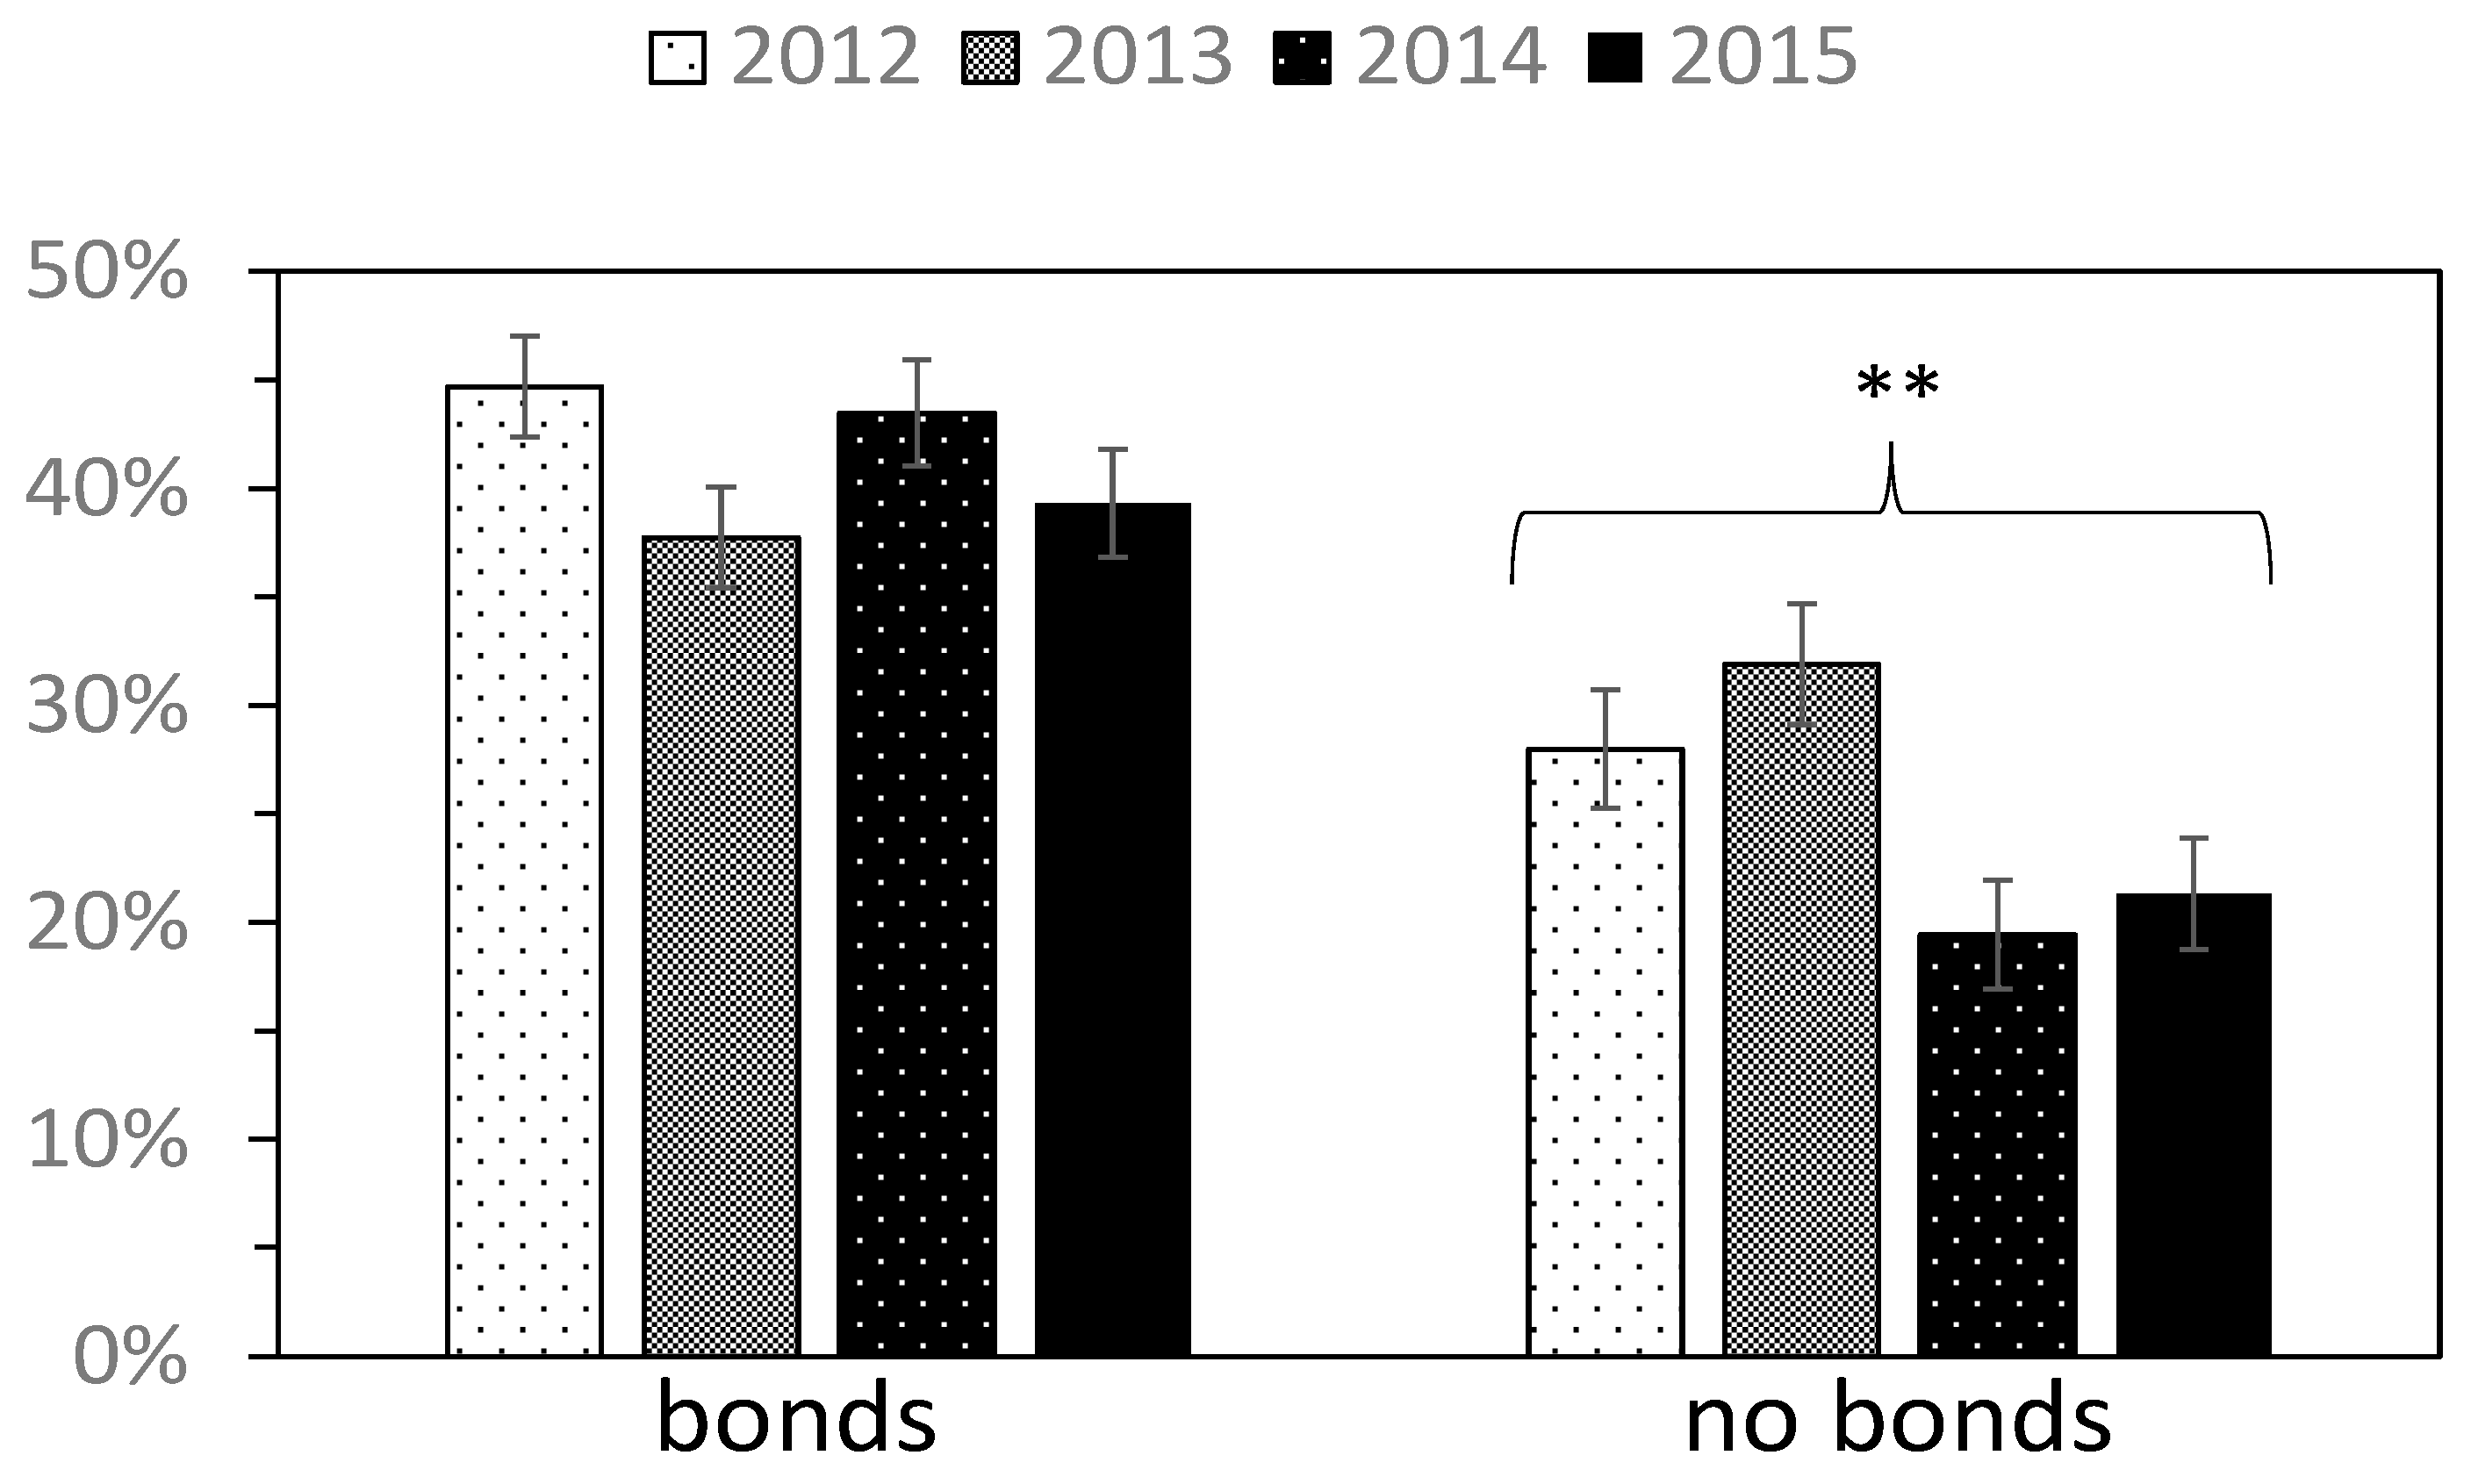
Figure 4.
The yearly change in the percentage of people who prepared for disasters (A1) (respondents were divided into two categories according to the presence or absence of bonds with other local people). Error bar represents standard error. ** p ≤ 0.01. We separately conducted trend analysis to those who felt bonds with other local people and those who did not.
Table 1.
Basic information on respondents. EOAs = evacuation order areas.
Table 1.
Basic information on respondents. EOAs = evacuation order areas.
| Year | | 2011 | 2012 | 2013 | 2014 | 2015 |
| Valid respondents | | 779 | 749 | 760 | 705 | 677 |
| (Ratio %) | | (59.9%) | (57.6%) | (58.5%) | (54.2%) | (52.1%) |
| Sex | Men | 319 | 324 | 332 | 280 | 286 |
| Women | 454 | 422 | 421 | 421 | 388 |
| No response | 6 | 3 | 7 | 4 | 3 |
| Age | 20s | 72 | 46 | 48 | 46 | 39 |
| 30s | 97 | 110 | 84 | 87 | 74 |
| 40s | 115 | 102 | 102 | 89 | 93 |
| 50s | 163 | 144 | 128 | 125 | 112 |
| 60 years and over | 332 | 347 | 398 | 358 | 359 |
| Region | Mountainous area | 108 | 110 | 111 | 106 | 93 |
| Central area | 463 | 428 | 435 | 385 | 385 |
| Coastal area other than EOAs | 141 | 138 | 139 | 137 | 132 |
| EOAs | 46 | 42 | 38 | 44 | 32 |
| No response and others | 21 | 31 | 37 | 33 | 35 |
Table 2.
The association between disaster preparedness (A1) & utilization of health checkups (A2). ns = p > 0.05, *** p ≤ 0.001.
Table 2.
The association between disaster preparedness (A1) & utilization of health checkups (A2). ns = p > 0.05, *** p ≤ 0.001.
| | People Who Did Not Utilize Health Checkups | People Who Utilized Health Checkups | Odds Ratio | |
|---|
| 2012 | People who did not prepare for disasters | 105 | 340 | 1.37 | ns |
| People who prepared for disasters | 50 | 222 | | |
| 2013 | People who did not prepare for disasters | 105 | 348 | 2.06 | *** |
| People who prepared for disasters | 33 | 225 | | |
| 2014 | People who did not prepare for disasters | 116 | 315 | 2.34 | *** |
| People who prepared for disasters | 31 | 197 | | |
| 2015 | People who did not prepare for disasters | 118 | 317 | 1.45 | ns |
| People who prepared for disasters | 42 | 164 | | |
Table 3.
The associations between those who had both disaster preparedness (A1) and utilization of health checkups (A2) and factors (Model 1). CI = confidence interval. ref. = reference. EOA = evacuation order areas. ns = p > 0.05, * p ≤ 0.05, ** p ≤ 0.01, *** p ≤ 0.001.
Table 3.
The associations between those who had both disaster preparedness (A1) and utilization of health checkups (A2) and factors (Model 1). CI = confidence interval. ref. = reference. EOA = evacuation order areas. ns = p > 0.05, * p ≤ 0.05, ** p ≤ 0.01, *** p ≤ 0.001.
| | 2011 | 2012 | 2013 | 2014 | 2015 |
|---|
| Odds Ratio (95% CI) | Odds Ratio (95% CI) | Odds Ratio (95% CI) | Odds Ratio (95% CI) | Odds Ratio (95% CI) |
|---|
| Model 1 | | | | | | | | | | |
| Women (ref) | - | | 1 | | 1 | | 1 | | 1 | |
| Men | - | | 0.73 (0.52–1.03) | ns | 0.84 (0.59–1.20) | ns | 0.92 (0.63–1.34) | ns | 0.93 (0.62–1.40) | ns |
| 20–29 | - | | 1 | | 1 | | 1 | | 1 | |
| 30–39 | - | | 2.30 (0.95–5.55) | ns | 1.67 (0.63–4.46) | ns | 1.42 (0.58–3.49) | ns | 1.00 (0.36–2.81) | ns |
| 40–49 | - | | 2.75 (1.13–6.71) | * | 3.44 (1.36–8.73) | ** | 1.22(0.50–2.96) | ns | 1.03 (0.39–2.72) | ns |
| 50–59 | - | | 1.68 (0.70–4.03) | ns | 2.32 (0.93–5.82) | ns | 1.09 (0.46–2.60) | ns | 1.37 (0.54–3.48) | ns |
| 60 or over | - | | 2.08 (0.92–4.71) | ns | 2.74 (1.16–6.47) | * | 1.85 (0.85–4.02) | ns | 1.35 (0.57–3.17) | ns |
| Mountainous area (ref) | - | | 1 | | 1 | | 1 | | 1 | |
| Central area | - | | 1.03 (0.62–1.71) | ns | 1.04 (0.61–1.79) | ns | 1.94 (1.07–3.53) | * | 1.40 (0.74–2.64) | * |
| Coastal area other than EOAs | - | | 1.58 (0.89–2.82) | ns | 1.78 (0.95–3.33) | ns | 3.63 (1.86–7.08) | *** | 2.45 (1.21–4.96) | *** |
| EOAs | - | | 1.48 (0.65–3.34) | ns | 1.77 (0.73–4.28) | ns | 2.13 (0.85–5.31) | ns | 2.30 (0.85–6.22) | ns |
| Q1 (relief regarding regional disasters) | - | | 1.40 (0.96–2.05) | ns | 1.04 (0.71–1.53) | ns | 0.88 (0.60–1.29) | ns | 1.18 (0.78–1.78) | ns |
| Q2 (relief regarding of radiation) | - | | 0.93 (0.62–1.40) | ns | 1.08 (0.72–1.62) | ns | 1.35 (0.90–2.03) | ns | 0.84 (0.55–1.29) | ns |
| Q3 (familiarity with the medical service) | - | | 1.03 (0.65–1.64) | ns | 1.73 (1.05–2.85) | * | 1.03 (0.62–1.72) | ns | 1.25 (0.65–2.37) | ns |
| Q4 (familiarity with the welfare service) | - | | 1.19 (0.80–1.76) | ns | 0.95 (0.62–1.45) | ns | 1.46 (0.93–2.30) | ns | 1.44 (0.86–2.41) | ns |
| Q5 (evaluation of prefectural reconstruction) | - | | 1.03 (0.66–1.62) | ns | 0.97 (0.61–1.53) | ns | 1.34 (0.86–2.07) | ns | 1.22 (0.80–1.87) | ns |
| Q6 (bonds with other local people) | - | | 1.83 (1.26–2.68) | ** | 2.73 (1.83–4.07) | *** | 2.49 (1.63–3.81) | *** | 2.77 (1.75–4.38) | *** |
Table 4.
The associations between disaster preparedness (A1) and factors (Model 2). CI = confidence interval. ref. = reference. EOAs = evacuation order areas. ns = p > 0.05, * p ≤ 0.05, ** p ≤ 0.01, *** p ≤ 0.001.
Table 4.
The associations between disaster preparedness (A1) and factors (Model 2). CI = confidence interval. ref. = reference. EOAs = evacuation order areas. ns = p > 0.05, * p ≤ 0.05, ** p ≤ 0.01, *** p ≤ 0.001.
| | 2011 | 2012 | 2013 | 2014 | 2015 |
|---|
| Odds Ratio (95% CI) | Odds Ratio (95% CI) | Odds Ratio (95% CI) | Odds Ratio (95% CI) | Odds Ratio (95% CI) |
|---|
| Model 2 | | | | | | | | | | |
| women (ref) | 1 | | 1 | | 1 | | 1 | | 1 | |
| men | 0.67 (0.48–0.91) | * | 0.64 (0.46–0.88) | ** | 0.63 (0.45–0.87) | ** | 0.88 (0.60–1.28) | ns | 0.77 (0.54–1.09) | ns |
| 20–29 | 1 | | 1 | | 1 | | 1 | | 1 | |
| 30–39 | 1.29 (0.67–2.50) | ns | 2.00 (0.92–4.36) | ns | 2.11 (0.88–5.04) | ns | 1.35 (0.56–3.25) | ns | 0.60 (0.26–1.38) | ns |
| 40–49 | 1.03 (0.54–1.97) | ns | 2.11 (0.95–4.66) | ns | 2.97 (1.28–6.87) | * | 1.59 (0.67–3.78) | ns | 0.53 (0.23–1.19) | ns |
| 50–59 | 1.22 (0.66–2.25) | ns | 1.30 (0.60–2.80) | ns | 2.09 (0.92–4.77) | ns | 1.09 (0.46–2.58) | ns | 0.75 (0.34–1.63) | ns |
| 60 or over | 1.09 (0.61–1.95) | ns | 1.56 (0.76–3.19) | ns | 2.64 (1.22–5.69) | * | 2.08 (0.94–4.59) | ns | 0.67 (0.33–1.36) | ns |
| mountainous area (ref) | 1 | | 1 | | 1 | | 1 | | 1 | |
| central area | 1.57 (0.98–2.52) | ns | 1.05 (0.67–1.66) | ns | 1.32 (0.81–2.15) | ns | 2.08 (1.16–3.74) | * | 1.71 (0.98–2.97) | ns |
| coastal area other than EOAs | 3.23 (1.85–5.65) | *** | 1.77 (1.03–3.04) | * | 2.01 (1.14–3.56) | * | 4.27 (2.20–8.30) | *** | 2.50 (1.33–4.67) | ** |
| EOAs | 1.78 (0.83–3.82) | ns | 1.44 (0.68–3.06) | ns | 1.46 (0.64–3.35) | ns | 2.74 (1.13–6.64) | * | 2.44 (0.99–5.98) | ns |
| Q1 (relief regarding regional disasters) | 2.16 (1.53–3.04) | *** | 1.78 (1.27–2.49) | *** | 1.17 (0.83–1.65) | ns | 0.85 (0.58–1.24) | ns | 1.64 (1.14–2.35) | ** |
Table 5.
The associations between disaster preparedness (A1) and factors (Model 3). CI = confidence interval. ref. = reference. EOA = evacuation order areas. ns = p > 0.05, * p ≤ 0.05, ** p ≤ 0.01, *** p ≤ 0.001.
Table 5.
The associations between disaster preparedness (A1) and factors (Model 3). CI = confidence interval. ref. = reference. EOA = evacuation order areas. ns = p > 0.05, * p ≤ 0.05, ** p ≤ 0.01, *** p ≤ 0.001.
| | 2011 | 2012 | 2013 | 2014 | 2015 |
|---|
| Odds Ratio (95% CI) | Odds Ratio (95% CI) | Odds Ratio (95% CI) | Odds Ratio (95% CI) | Odds Ratio (95% CI) |
|---|
| Model 3 | | | | | | | | | | |
| women (ref) | - | | 1 | | 1 | | 1 | | 1 | |
| men | - | | 0.68 (0.49–0.94) | * | 0.74 (0.53–1.04) | ns | 0.86 (0.59–1.24) | ns | 0.84 (0.58–1.21) | ns |
| 20–29 | - | | 1 | | 1 | | 1 | | 1 | |
| 30–39 | - | | 1.98 (0.90–4.38) | ns | 2.14 (0.88–5.20) | ns | 1.29 (0.54–3.08) | ns | 0.72 (0.30–1.72) | ns |
| 40–49 | - | | 2.19 (0.98–4.89) | ns | 3.04 (1.29–7.18) | * | 1.44 (0.62–3.37) | ns | 0.52 (0.23–1.22) | ns |
| 50–59 | - | | 1.36 (0.63–2.97) | ns | 2.05 (0.88–4.77) | ns | 0.99 (0.43–2.29) | ns | 0.77 (0.35–1.73) | ns |
| 60 or over | - | | 1.57 (0.76–3.22) | ns | 2.51 (1.14–5.50) | * | 1.80 (0.85–3.79) | ns | 0.61 (0.29–1.27) | ns |
| mountainous area (ref) | - | | 1 | | 1 | | 1 | | 1 | |
| central area | - | | 1.06 (0.65–1.72) | ns | 1.19 (0.71–2.01) | ns | 1.94 (1.09–3.44) | * | 1.70 (0.94–3.08) | ns |
| coastal area other than EOAs | - | | 1.81 (1.04–3.17) | * | 1.71 (0.93–3.15) | ns | 4.31 (2.24–8.29) | *** | 3.15 (1.61–6.15) | *** |
| EOAs | - | | 1.53 (0.70–3.36) | ns | 1.41 (0.59–3.35) | ns | 2.64 (1.10–6.32) | * | 2.78 (1.08–7.17) | * |
| Q1 (relief regarding regional disasters) | - | | 1.58 (1.09–2.27) | * | 1.05 (0.73–1.52) | ns | 0.81 (0.56–1.19) | ns | 1.40 (0.95–2.06) | ns |
| Q2 (relief regarding of radiation) | - | | 0.85 (0.58–1.25) | ns | 0.94 (0.63–1.39) | ns | 1.45 (0.97–2.17) | ns | 0.93 (0.63–1.38) | ns |
| Q3 (familiarity with the medical service) | - | | 0.89 (0.57–1.38) | ns | 1.40 (0.88–2.22) | ns | 1.19 (0.73–1.97) | ns | 1.46 (0.81–2.64) | ns |
| Q4 (familiarity with the welfare service) | - | | 1.37 (0.93–2.00) | ns | 0.97 (0.64–1.46) | ns | 1.48 (0.95–2.29) | ns | 1.50 (0.93–2.42) | ns |
| Q5 (evaluation of prefectural reconstruction) | - | | 1.09 (0.71–1.68) | ns | 0.90 (0.58–1.41) | ns | 1.37 (0.89–2.11) | ns | 1.19 (0.80–1.77) | ns |
| Q6 (bonds with other local people) | - | | 1.82 (1.27–2.59) | ** | 2.52 (1.74–3.67) | *** | 2.80 (1.85–4.22) | *** | 1.94 (1.30–2.90) | ** |
Table 6.
The associations between health checkups (A2) and factors (Model 4). CI = confidence interval. ref. = reference. EOAs = evacuation order areas. ns = p > 0.05, * p ≤ 0.05, ** p ≤ 0.01, *** p ≤ 0.001.
Table 6.
The associations between health checkups (A2) and factors (Model 4). CI = confidence interval. ref. = reference. EOAs = evacuation order areas. ns = p > 0.05, * p ≤ 0.05, ** p ≤ 0.01, *** p ≤ 0.001.
| | 2011 | 2012 | 2013 | 2014 | 2015 |
|---|
| Odds Ratio (95% CI) | Odds Ratio (95% CI) | Odds Ratio (95% CI) | Odds Ratio (95% CI) | Odds Ratio (95% CI) |
|---|
| Model 4 | | | | | | | | | | |
| women (ref) | - | | 1 | | 1 | | 1 | | 1 | |
| men | - | | 0.99 (0.68–1.46) | ns | 1.08 (0.71–1.64) | ns | 1.57 (1.03–2.39) | * | 1.21 (0.81–1.81) | ns |
| 20–29 | - | | 1 | | 1 | | 1 | | 1 | |
| 30–39 | - | | 1.73 (0.81–3.67) | ns | 1.19 (0.54–2.63) | ns | 2.12 (0.97–4.65) | ns | 2.24 (0.98–5.15) | ns |
| 40–49 | - | | 1.82 (0.84–3.94) | ns | 2.30 (1.02–5.19) | * | 2.56 (1.16–5.66) | * | 2.62 (1.17–5.89) | * |
| 50–59 | - | | 2.53 (1.19–5.34) | * | 2.80 (1.26–6.23) | * | 3.41 (1.55–7.51) | ** | 2.55 (1.16–5.61) | * |
| 60 or over | - | | 3.39 (1.70–6.77) | *** | 2.76 (1.36–5.61) | ** | 3.80 (1.91–7.55) | *** | 4.02 (1.96–8.25) | *** |
| mountainous area (ref) | - | | 1 | | 1 | | 1 | | 1 | |
| central area | - | | 0.69 (0.38–1.23) | ns | 0.57 (0.28–1.16) | ns | 0.85 (0.45–1.59) | ns | 0.60 (0.32–1.13) | ns |
| coastal area other than EOAs | - | | 0.90 (0.45–1.78) | ns | 0.57 (0.25–1.28) | ns | 0.90 (0.44–1.84) | ns | 0.57 (0.28–1.16) | ns |
| EOAs | - | | 0.90 (0.34–2.36) | ns | 0.89 (0.29–2.80) | ns | 0.98 (0.38–2.52) | ns | 0.75 (0.26–2.17) | ns |
| Q1 (relief regarding regional disasters) | - | | 1.02 (0.66–1.58) | ns | 0.95 (0.61–1.48) | ns | 1.02 (0.67–1.55) | ns | 1.10 (0.73–1.65) | ns |
| Q2 (relief regarding of radiation) | - | | 0.70 (0.44–1.10) | ns | 1.53 (0.92–2.56) | ns | 1.35 (0.85–2.15) | ns | 1.06 (0.69–1.61) | ns |
| Q3 (familiarity with the medical service) | - | | 1.10 (0.67–1.80) | ns | 1.76 (1.06–2.91) | * | 1.16 (0.70–1.92) | ns | 1.52 (0.88–2.63) | ns |
| Q4 (familiarity with the welfare service) | - | | 1.49 (0.97–2.28) | ns | 1.40 (0.87–2.26) | ns | 1.92 (1.21–3.06) | ** | 1.18 (0.72–1.94) | ns |
| Q5 (evaluation of prefectural reconstruction) | - | | 1.36 (0.78–2.36) | ns | 1.00 (0.55–1.82) | ns | 0.68 (0.41–1.11) | ns | 0.80 (0.52–1.23) | ns |
| Q6 (bonds with other local people) | - | | 0.93 (0.62–1.39) | ns | 1.94 (1.26–3.00) | ** | 1.09 (0.71–1.66) | ns | 1.46 (0.97–2.21) | ns |
Table 7.
The associations between health checkups (A2) and factors (Model 5, under 50). CI = confidence interval. ref. = reference. EOAs = evacuation order areas. ns = p > 0.05, * p ≤ 0.05, ** p ≤ 0.01.
Table 7.
The associations between health checkups (A2) and factors (Model 5, under 50). CI = confidence interval. ref. = reference. EOAs = evacuation order areas. ns = p > 0.05, * p ≤ 0.05, ** p ≤ 0.01.
| | 2011 | 2012 | 2013 | 2014 | 2015 |
|---|
| Odds Ratio (95% CI) | Odds Ratio (95% CI) | Odds Ratio (95% CI) | Odds Ratio (95% CI) | Odds Ratio (95% CI) |
|---|
| Model 5 (under 50) | | | | | | | | | | |
| women (ref) | - | | 1 | | 1 | | 1 | | 1 | |
| men | - | | 1.02 (0.57–1.83) | ns | 0.93 (0.48–1.81) | ns | 1.50 (0.76–3.00) | ns | 1.39 (0.73–2.62) | ns |
| mountainous area (ref) | - | | 1 | | 1 | | 1 | | 1 | |
| central area | - | | 1.25 (0.55–2.88) | ns | 1.15 (0.44–3.01) | ns | 0.42 (0.13–1.41) | ns | 0.54 (0.18–1.65) | ns |
| coastal area other than EOAs | - | | 2.15 (0.74–6.26) | ns | 1.32 (0.41–4.30) | ns | 0.37 (0.10–1.40) | ns | 0.34 (0.10–1.16) | ns |
| EOAs | - | | 4.15 (0.74–23.34) | ns | 4.37 (0.69–27.72) | ns | 0.55 (0.11–2.62) | ns | 0.26 (0.05–1.37) | ns |
| Q1 (relief regarding regional disasters) | - | | 1.73 (0.83–3.62) | ns | 0.87 (0.44–1.72) | ns | 1.50 (0.78–2.91) | ns | 0.74 (0.38–1.44) | ns |
| Q2 (relief regarding of radiation) | - | | 1.01 (0.48–2.11) | ns | 1.10 (0.49–2.47) | ns | 0.96 (0.45–2.05) | ns | 0.84 (0.42–1.69) | ns |
| Q3 (familiarity with the medical service) | - | | 1.27 (0.63–2.56) | ns | 2.45 (1.15–5.25) | * | 1.75 (0.81–3.75) | ns | 1.28 (0.56–2.90) | ns |
| Q4 (familiarity with the welfare service) | - | | 1.63 (0.86–3.11) | ns | 2.76 (1.28–5.91) | ** | 2.30 (1.12–4.71) | * | 2.01 (0.93–4.33) | ns |
| Q5 (evaluation of prefectural reconstruction) | - | | 0.83 (0.38–1.82) | ns | 0.77 (0.31–1.92) | ns | 0.59 (0.27–1.32) | ns | 0.74 (0.37–1.51) | ns |
| Q6 (bonds with other local people) | - | | 0.57 (0.30–1.06) | ns | 1.57 (0.79–3.11) | ns | 1.61 (0.84–3.08) | ns | 1.69 (0.87–3.30) | ns |
Table 8.
The associations between health checkups (A2) and factors (Model 5, 50 or over). CI = confidence interval. ref. = reference. EOAs = evacuation order areas. ns = p > 0.05, * p ≤ 0.05.
Table 8.
The associations between health checkups (A2) and factors (Model 5, 50 or over). CI = confidence interval. ref. = reference. EOAs = evacuation order areas. ns = p > 0.05, * p ≤ 0.05.
| | 2011 | 2012 | 2013 | 2014 | 2015 |
|---|
| Odds Ratio (95% CI) | Odds Ratio (95% CI) | Odds Ratio (95% CI) | Odds Ratio (95% CI) | Odds Ratio (95% CI) |
|---|
| Model 5 (50 or over) | | | | | | | | | | |
| women (ref) | - | | 1 | | 1 | | 1 | | 1 | |
| men | - | | 0.94 (0.56–1.60) | ns | 1.25 (0.71–2.19) | ns | 1.52 (0.88–2.62) | ns | 1.12 (0.67–1.88) | ns |
| mountainous area (ref) | - | | 1 | | 1 | | 1 | | 1 | |
| central area | - | | 0.42 (0.17–1.02) | ns | 0.10 (0.01–0.79) | * | 1.19 (0.55–2.54) | ns | 0.62 (0.29–1.35) | ns |
| coastal area other than EOAs | - | | 0.49 (0.18–1.31) | ns | 0.10 (0.01–0.83) | * | 1.34 (0.55–3.29) | ns | 0.79 (0.32–1.92) | ns |
| EOAs | - | | 0.31 (0.09–1.07) | ns | 0.11 (0.01–1.06) | ns | 1.35 (0.37–4.96) | ns | 1.83 (0.35–9.50) | ns |
| Q1 (relief regarding regional disasters) | - | | 0.73 (0.41–1.29) | ns | 0.99 (0.55–1.78) | ns | 0.80 (0.46–1.42) | ns | 1.50 (0.89–2.50) | ns |
| Q2 (relief regarding of radiation) | - | | 0.50 (0.27–0.91) | * | 1.91 (0.95–3.84) | ns | 1.84 (1.00–3.40) | ns | 1.07 (0.62–1.84) | ns |
| Q3 (familiarity with the medical service) | - | | 1.22 (0.58–2.53) | ns | 1.13 (0.55–2.30) | ns | 0.79 (0.39–1.59) | ns | 1.85 (0.87–3.94) | ns |
| Q4 (familiarity with the welfare service) | - | | 1.41 (0.78–2.55) | ns | 0.93 (0.49–1.77) | ns | 1.80 (0.97–3.35) | ns | 0.75 (0.38–1.49) | ns |
| Q5 (evaluation of prefectural reconstruction) | - | | 2.27 (0.99–5.21) | ns | 1.18 (0.51–2.71) | ns | 0.72 (0.38–1.36) | ns | 0.84 (0.49–1.46) | ns |
| Q6 (bonds with other local people) | - | | 1.31 (0.76–2.27) | ns | 2.02 (1.12–3.64) | * | 0.85 (0.48–1.50) | ns | 1.45 (0.85–2.47) | ns |

 ,
, 

