3.1. Airflow Rate Measurements and Pressure Differences across the Building Envelope
Total airflow rates before and after the ventilation intervention are shown in
Table 3.
Before balancing, the airflow rates were found to be heavily unbalanced in most classrooms, as well as in the corridor and in the toilets (
Table 3). According to Finnish regulations, the acceptable deviation at room level and system level is 20% and 10%, respectively. At classroom level, the supply airflow rates were within ±20% of the designed values, with two significant exceptions of −36% (Classroom 7) and +57% (Classroom 8). Almost all the classrooms had extract airflow rates over 20% higher than the designed values. The corridor extract was 18% lower than the designed values. The extracts from the toilet and storage units were 55% lower than the designed values, which was found to be caused by the wrong rotation direction of the fan. At a system level, the total extract airflow rate was 18% higher than the designed values. After generating the positive pressure, all classrooms except from Classrooms 4 and 8 received more supply than extract air. Airflow rates were measured as spot checks from some classrooms in spring 2017, and had been maintained at the required level.
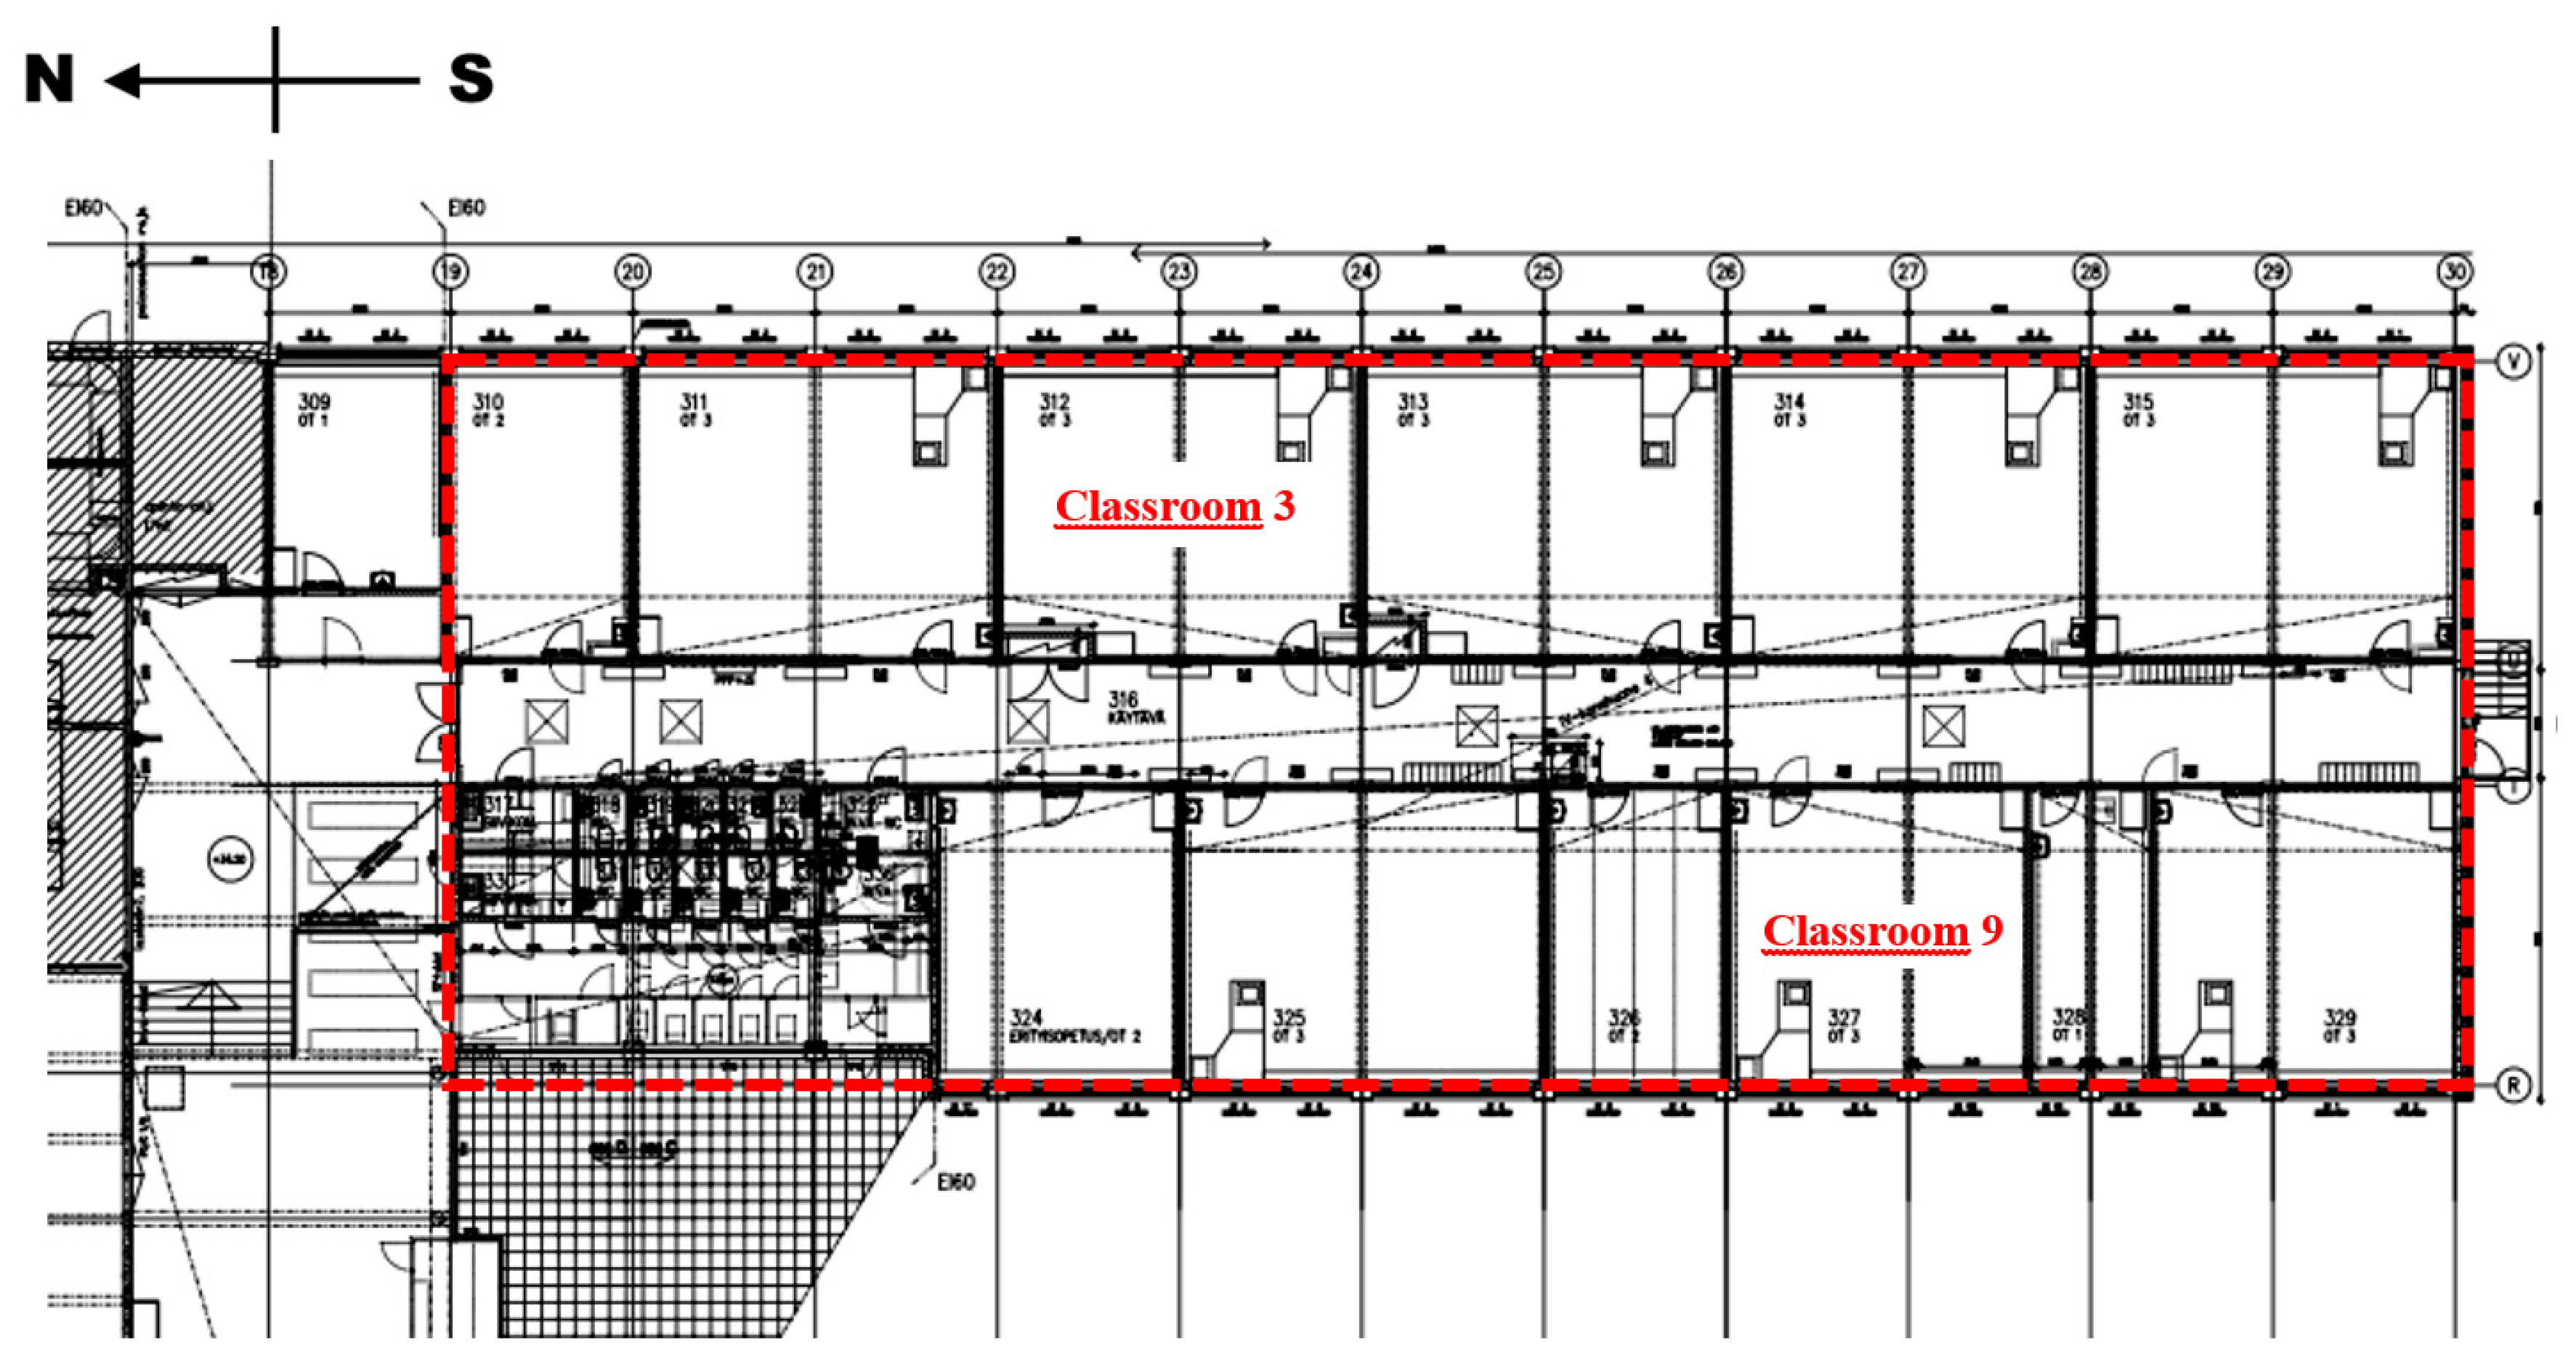
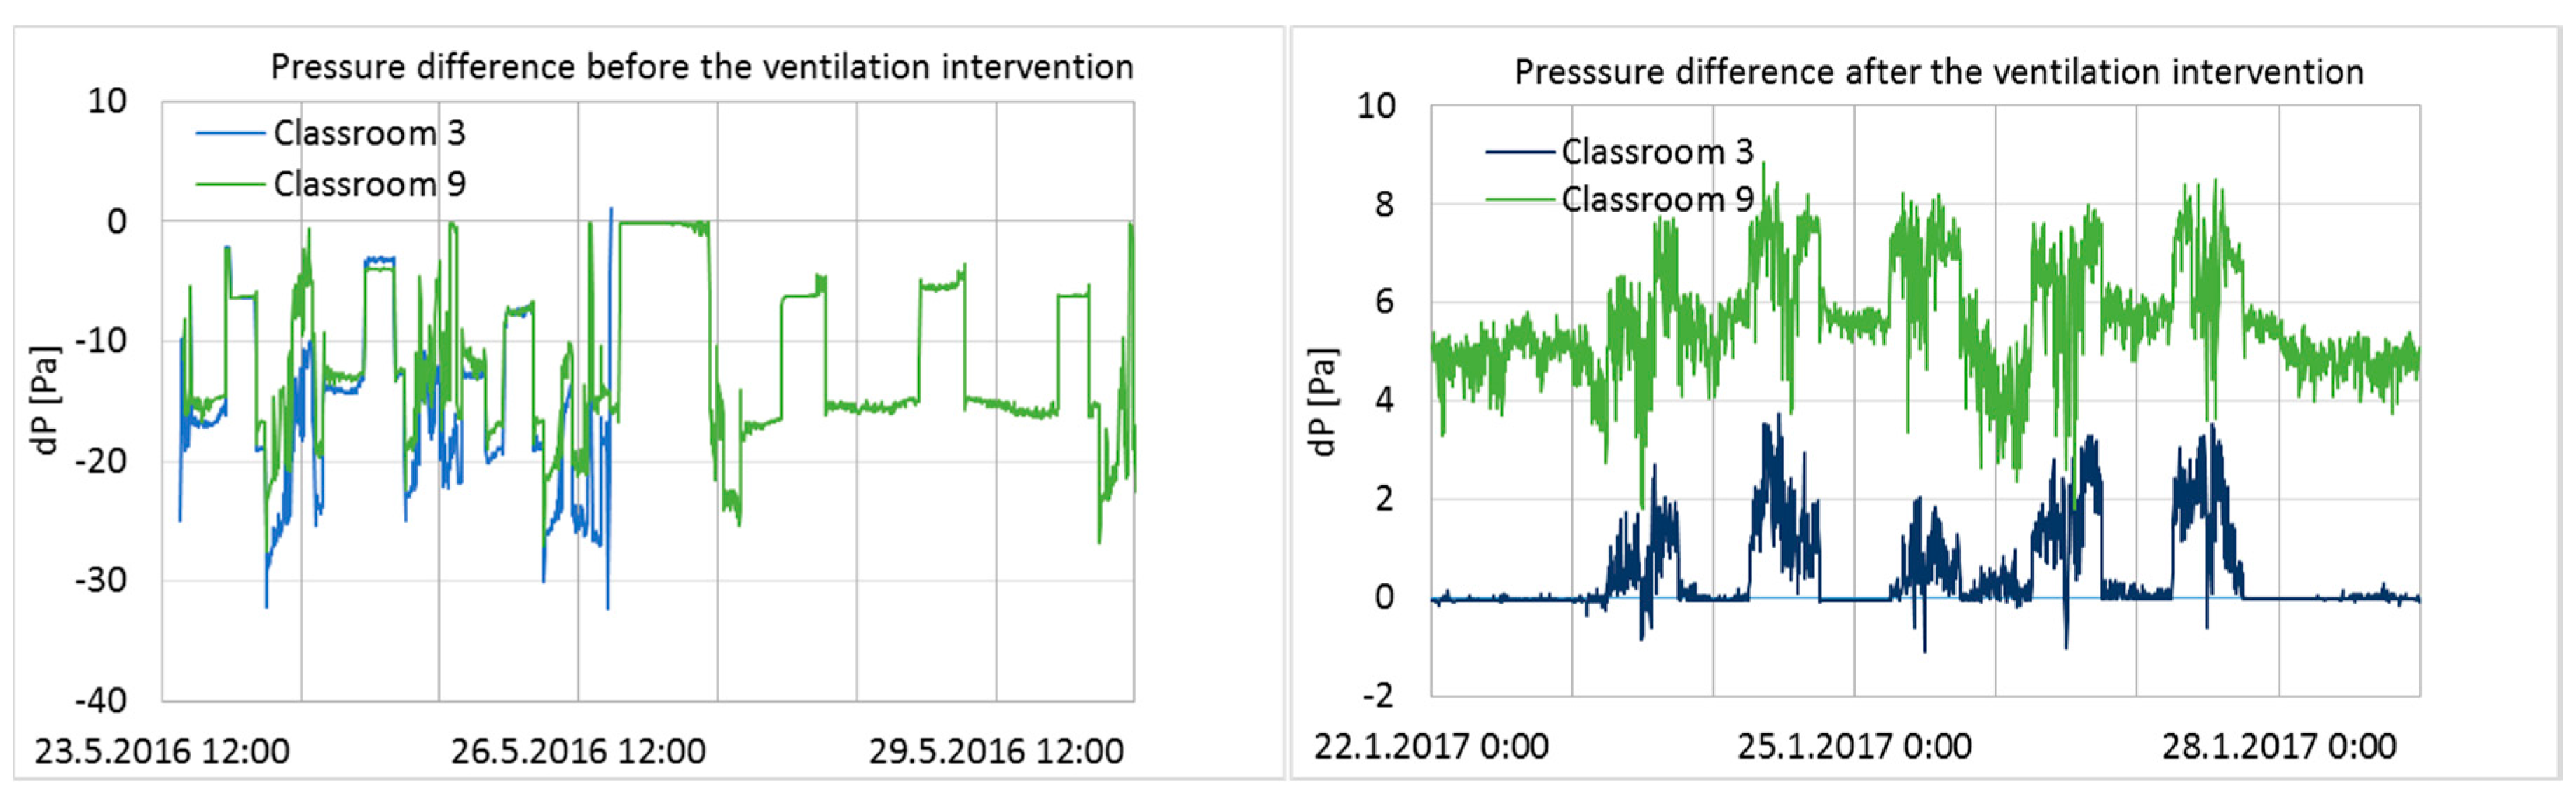
Pressure differences across the building envelope from one week before and after the intervention in Classrooms 3 and 9 are shown in
Figure 3.
Before the ventilation balancing, pressure differences fluctuated within a large range during a one-week period, and both measured rooms had a significant level of negative pressure. After the ventilation balancing, the pressure differences across the envelope were moderately stable and positive, and fluctuation was minimal compared to the conditions before the intervention (
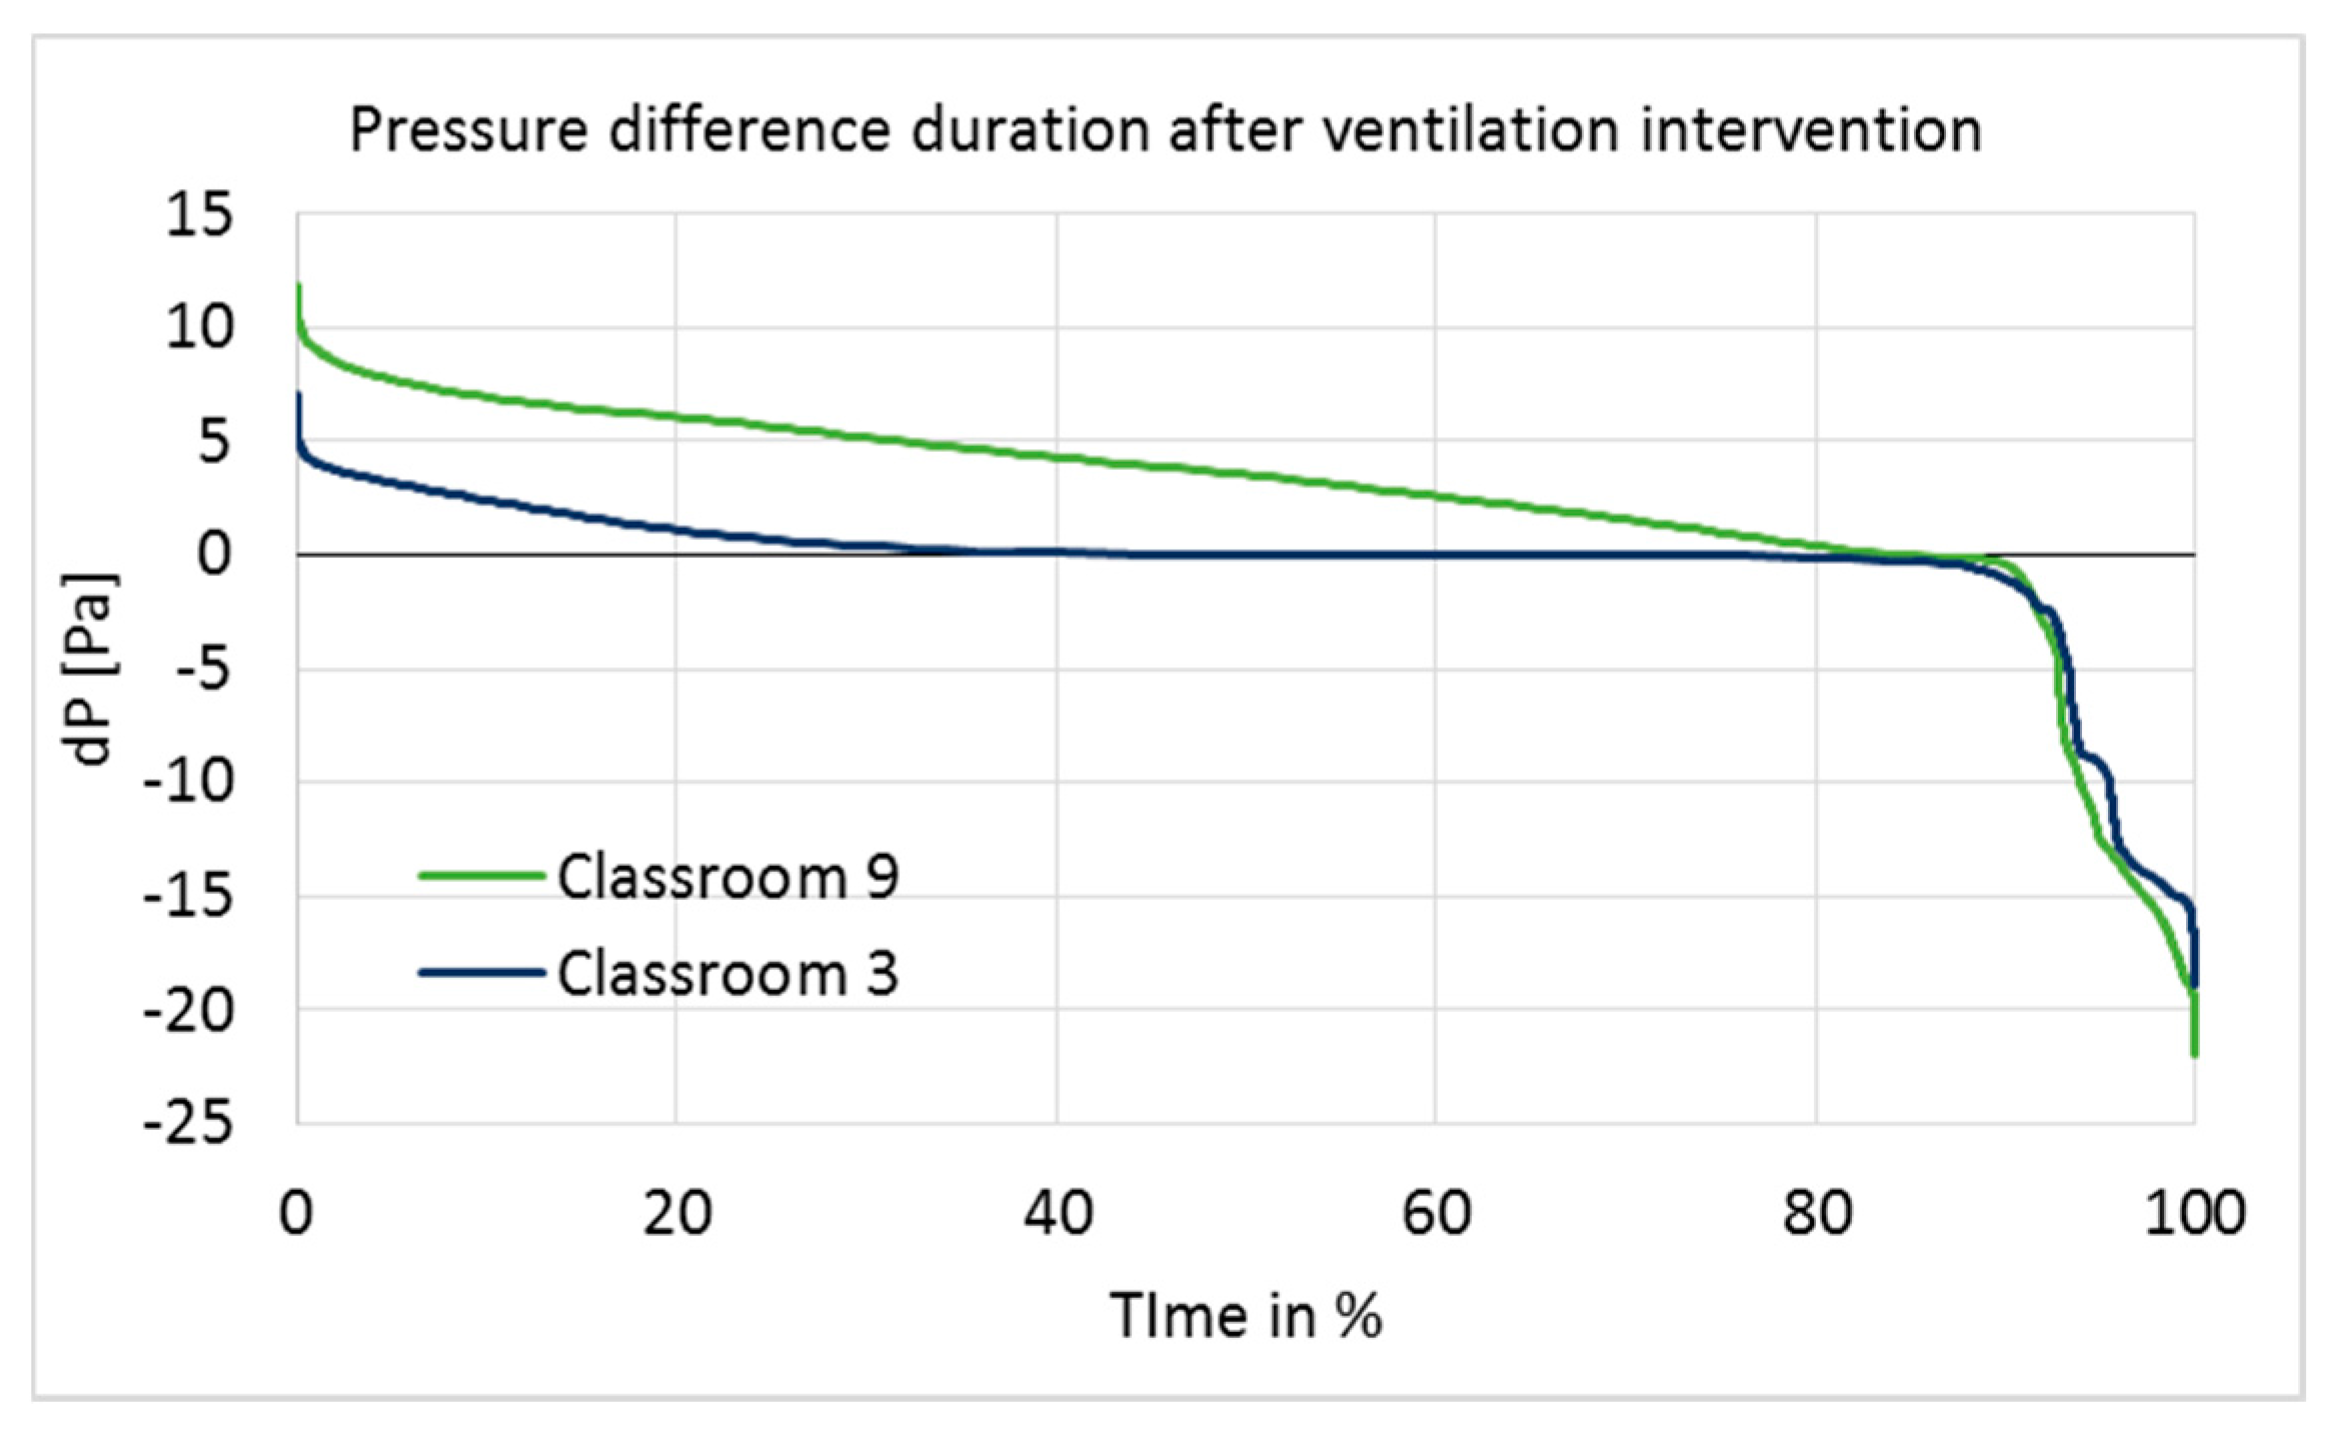
Figure 3). Pressure differences over the entire ventilation intervention period are shown as cumulative frequency curves (duration curves) in
Figure 4.
Positive pressure was maintained rather well in Classroom 9, but poorly in Classroom 3 (
Figure 4). In Classroom 9, the pressure difference was at the optimal level of 5–7 Pa for 23% of the measurement time, and over 0 Pa for 84% of the time. In Classroom 3, it was over 0 Pa for 45% of the time; thus, most of the time, Classroom 3 had a pressure difference very close to 0.
According to the set-up design, positive pressure should have been maintained continuously throughout the entire intervention period. However, the results showed that the ventilation system was turned off at night by the school maintenance or by the automatic remote-control system during school holidays; it was also turned off during other short-term periods for unknown reasons. The longest holiday period was the Christmas holiday, between 21 December 2016 and 7 January 2017, during which time the ventilation system was clearly turned off every day from 4 p.m. to 6 a.m., and the pressure difference became highly negative. Negative pressure differences during that period were significant (up to −18 and −22 Pa in Classrooms 3 and 9; average pressure difference −7.9 and −8.4 Pa), generating unwanted effects on the ventilation intervention.
The building was unoccupied during holiday periods; thus, pressure fluctuation did not have a direct impact on the occupants. Furthermore, if the Christmas holiday period is ignored, then the pressure difference becomes positive (>0) for 46% (Classroom 3) and 88% (Classroom 9) of the time, which does not make a significant difference to the duration of the pressure difference on a longer period of time. However, possible impurities inside the structures may have infiltrated indoors during holiday periods, which would have influenced the indoor conditions and might have affected the user questionnaire responses accordingly. Therefore, holiday times, especially the Christmas holiday, were not excluded from the data.
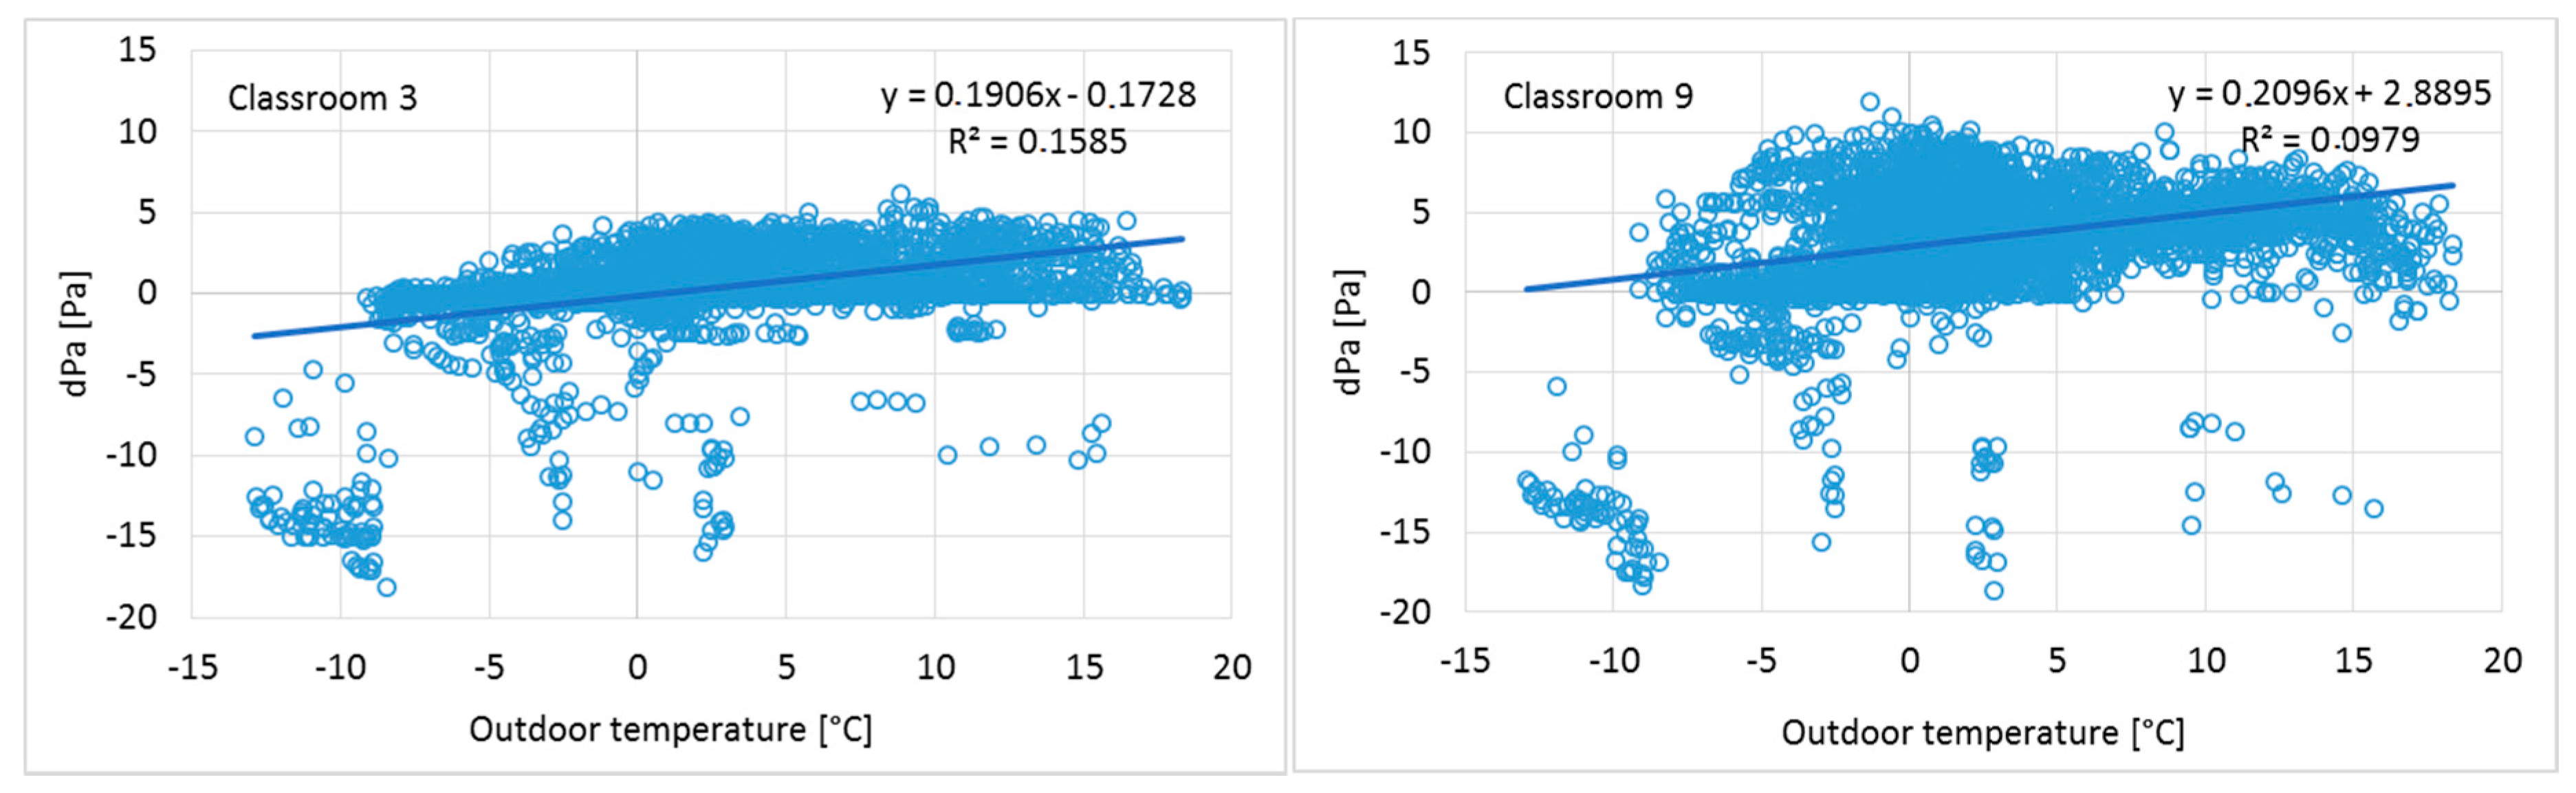
The measured results show an increase of positive pressure when the outdoor temperature increases (
Figure 5), and a corresponding decrease when the outdoor temperature drops. This has provided an additional challenge for positive pressure as adjustments were done during warm season. These results indicate typical phenomena of heat recovery ventilation units: During the cold season, the mass flow of constant volume extract fans becomes higher because the temperature after heat recovery is lower and the density of the air is correspondingly higher. At the same time, the supply air fan operates at stable air temperature conditions and the mass flow does not change. To avoid this phenomenon, an air handling unit with density-corrected air volume flow rate control should be used to maintain a continuous positive pressure in a building.
In a cold climate, water vapor condensation and moisture accumulation inside structures are seen as potential risks when pressure differences across the envelope are positive. To evaluate the risk of condensation inside the structures, excessive moisture in Classrooms 3 and 9 was calculated as the difference of measured absolute humidity of indoor and outdoor air, before the positive pressure period began. To monitor the possible moisture condensation risk in the structures during the ventilation intervention, T and RH probes were installed inside the structures at the most probable leakage paths, as well as in a reference room. According to humidity measurements, the structures were dry, indicating that this moisture risk was not present because of the modest humidity load in well-ventilated classrooms [
23].
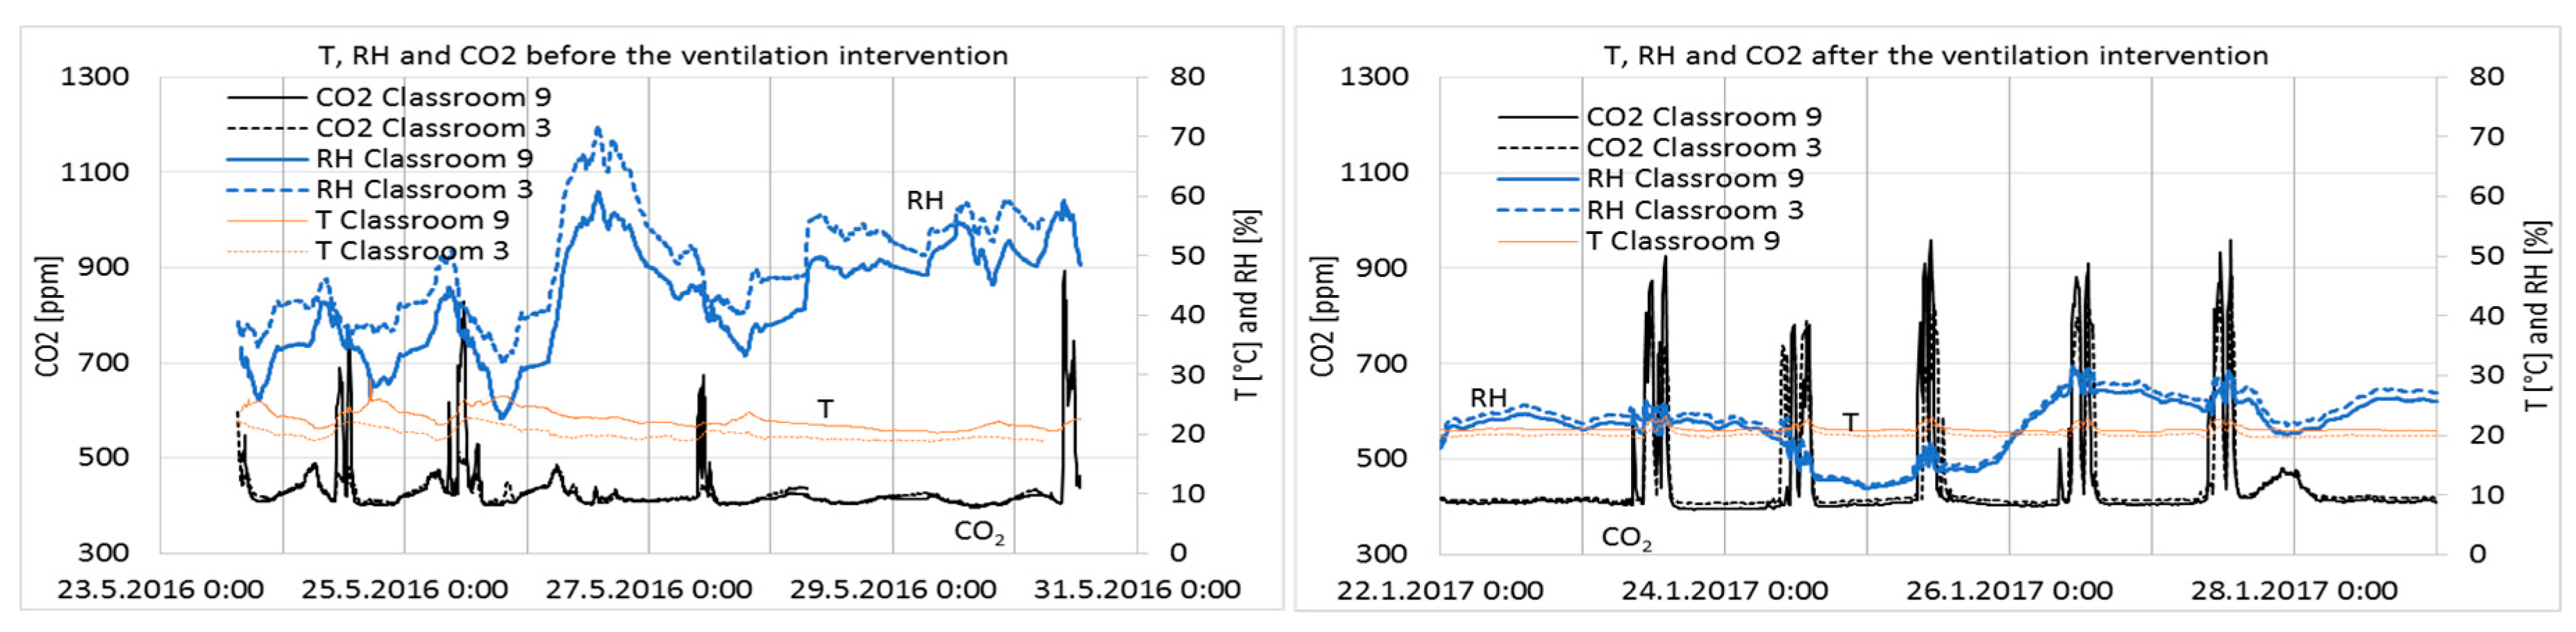
3.2. Temperature, Relative Humidity, and CO2 Concentration of Indoor Air
Results from one week before and after ventilation intervention are shown in
Figure 6.
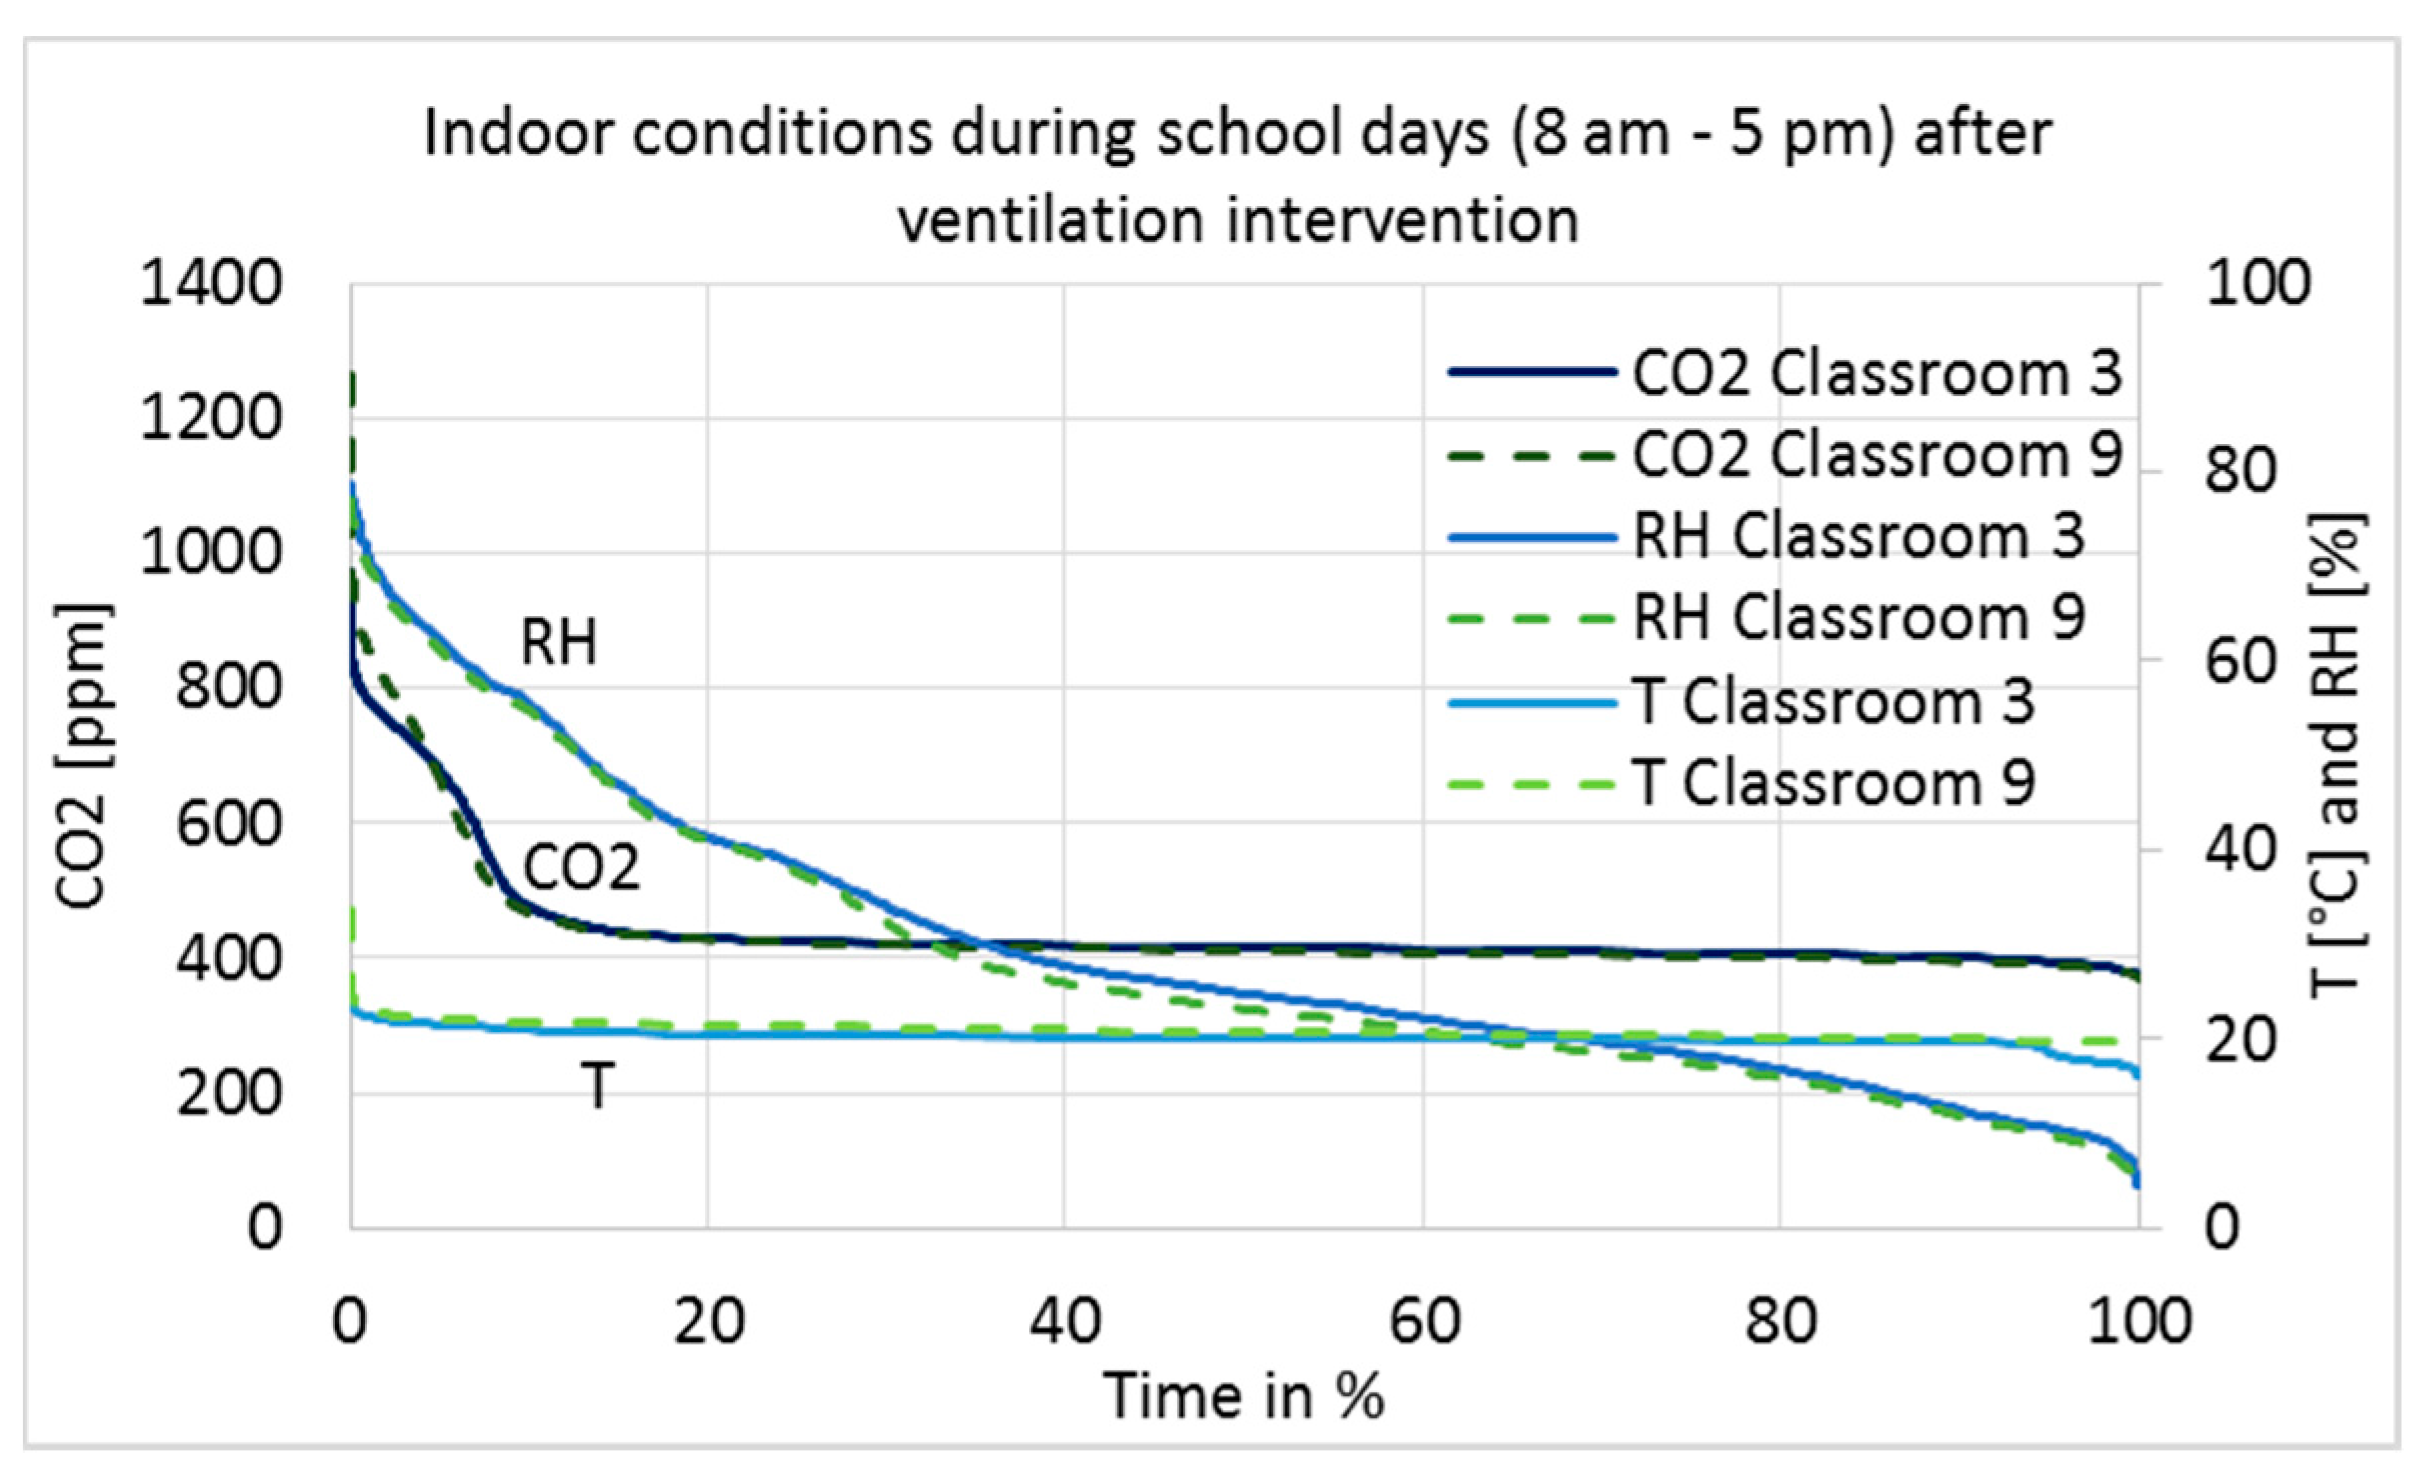
The measurement results after the ventilation intervention are shown as a duration curve in
Figure 7, and average, minimum, and maximum values are described in
Table 4. Only results during school working hours, from 8 a.m. to 5 p.m., are shown to describe conditions during occupancy.
The maximum limit value for CO
2 concentrations in Category I of the Finnish Classification [
24] is 750 ppm; the limit value in Category II is 900 ppm, while in Category III it is 1200 ppm. The stability of the conditions has to be 95% (Category I) and 90% (Category II). Category III meets the minimum requirements of the Finnish regulation, Category II is defined as good and Category I as best possible IAQ. The levels of CO
2 concentrations before and after the intervention were in Category I (
Figure 7 and
Table 4).
The RH of the classrooms closely followed the absolute humidity of the outdoor air, i.e., values are very low in cold winters and reach 75% on summer days. In Category I [
24], it is recommended that RH should not drop for long periods below 20%; no recommendations exist for the other categories. It can be seen in Classrooms 9 and 3 that RH was below 20% for 31% and 26% of the school hours, respectively (
Figure 7). Such dry air causes irritation of the respiratory tract, eyes, and skin [
25]. Indirectly, temperature and RH affect human perceptions of air quality and emissions from building materials [
26,
27,
28] with negative effects associated to higher temperature and RH values. From this point of view, there are some arguments for humidification during cold winter time, but as far as Category II spaces are considered, it is not needed. Contra argument to humidification is to keep the ventilation systems simple and not equipped with humidification components due to cost, hygienic and maintenance issues.
Temperatures were very stable and slightly higher in Classroom 9 (
Table 4), which can be explained by the location of the room on the western side of the building.
3.3. Indoor Air Quality (IAQ) Measurements
TVOC, VOC, formaldehyde, and CO measurement results are shown in
Table 5.
TVOC values decreased 21–55% in the classrooms and in the corridor after ventilation intervention (
Table 5). This result was statistically significant at a 95% confidence interval (
p = 0.045). Besides positive pressure, no other changes were undertaken; therefore, the only known explanation for the decreased concentrations is the positive pressure and infiltration mainly converted to exfiltration. Concentrations were very low in general, compared to the national threshold values [
29], indicating good ventilation and off-gassing of materials.
Concentrations of single VOCs were 1–4 μg/m
3, which is fairly below action level. TVOC concentrations consist mainly of compounds with concentrations below 1 µg/m
3. In addition to the general limit value for single compounds, national limit values for the following VOCs are 2,2,4-trimethyl-1,3-pentanediol di-isobutyrate (TXIB) (10 µg/m
3), 2E1H (10 µg/m
3), naphthalene (10 µg/m
3), and styrene (40 µg/m
3) [
29]. In these samples, only 2E1H was shown, but only as low concentrations from 1 to 3 µg/m
3 (
Table 5).
For formaldehyde, the maximum allowed value is 50 (annual average) or 100 µg/m
3 (30 min average), while for CO it is 7 mg/m
2 (momentary concentration) [
29]. The formaldehyde concentration before and after the ventilation balancing was below 10 ppb (equivalent to approx. 12 µg/m
3), which is the detection limit of the meter. After balancing, there was a concentration of 12–26 ppb during two hours on one day, which was probably due to some specific action in the classroom, e.g., art lecture. The CO concentration varied from 0.3 to 1.3 mg/m
2.
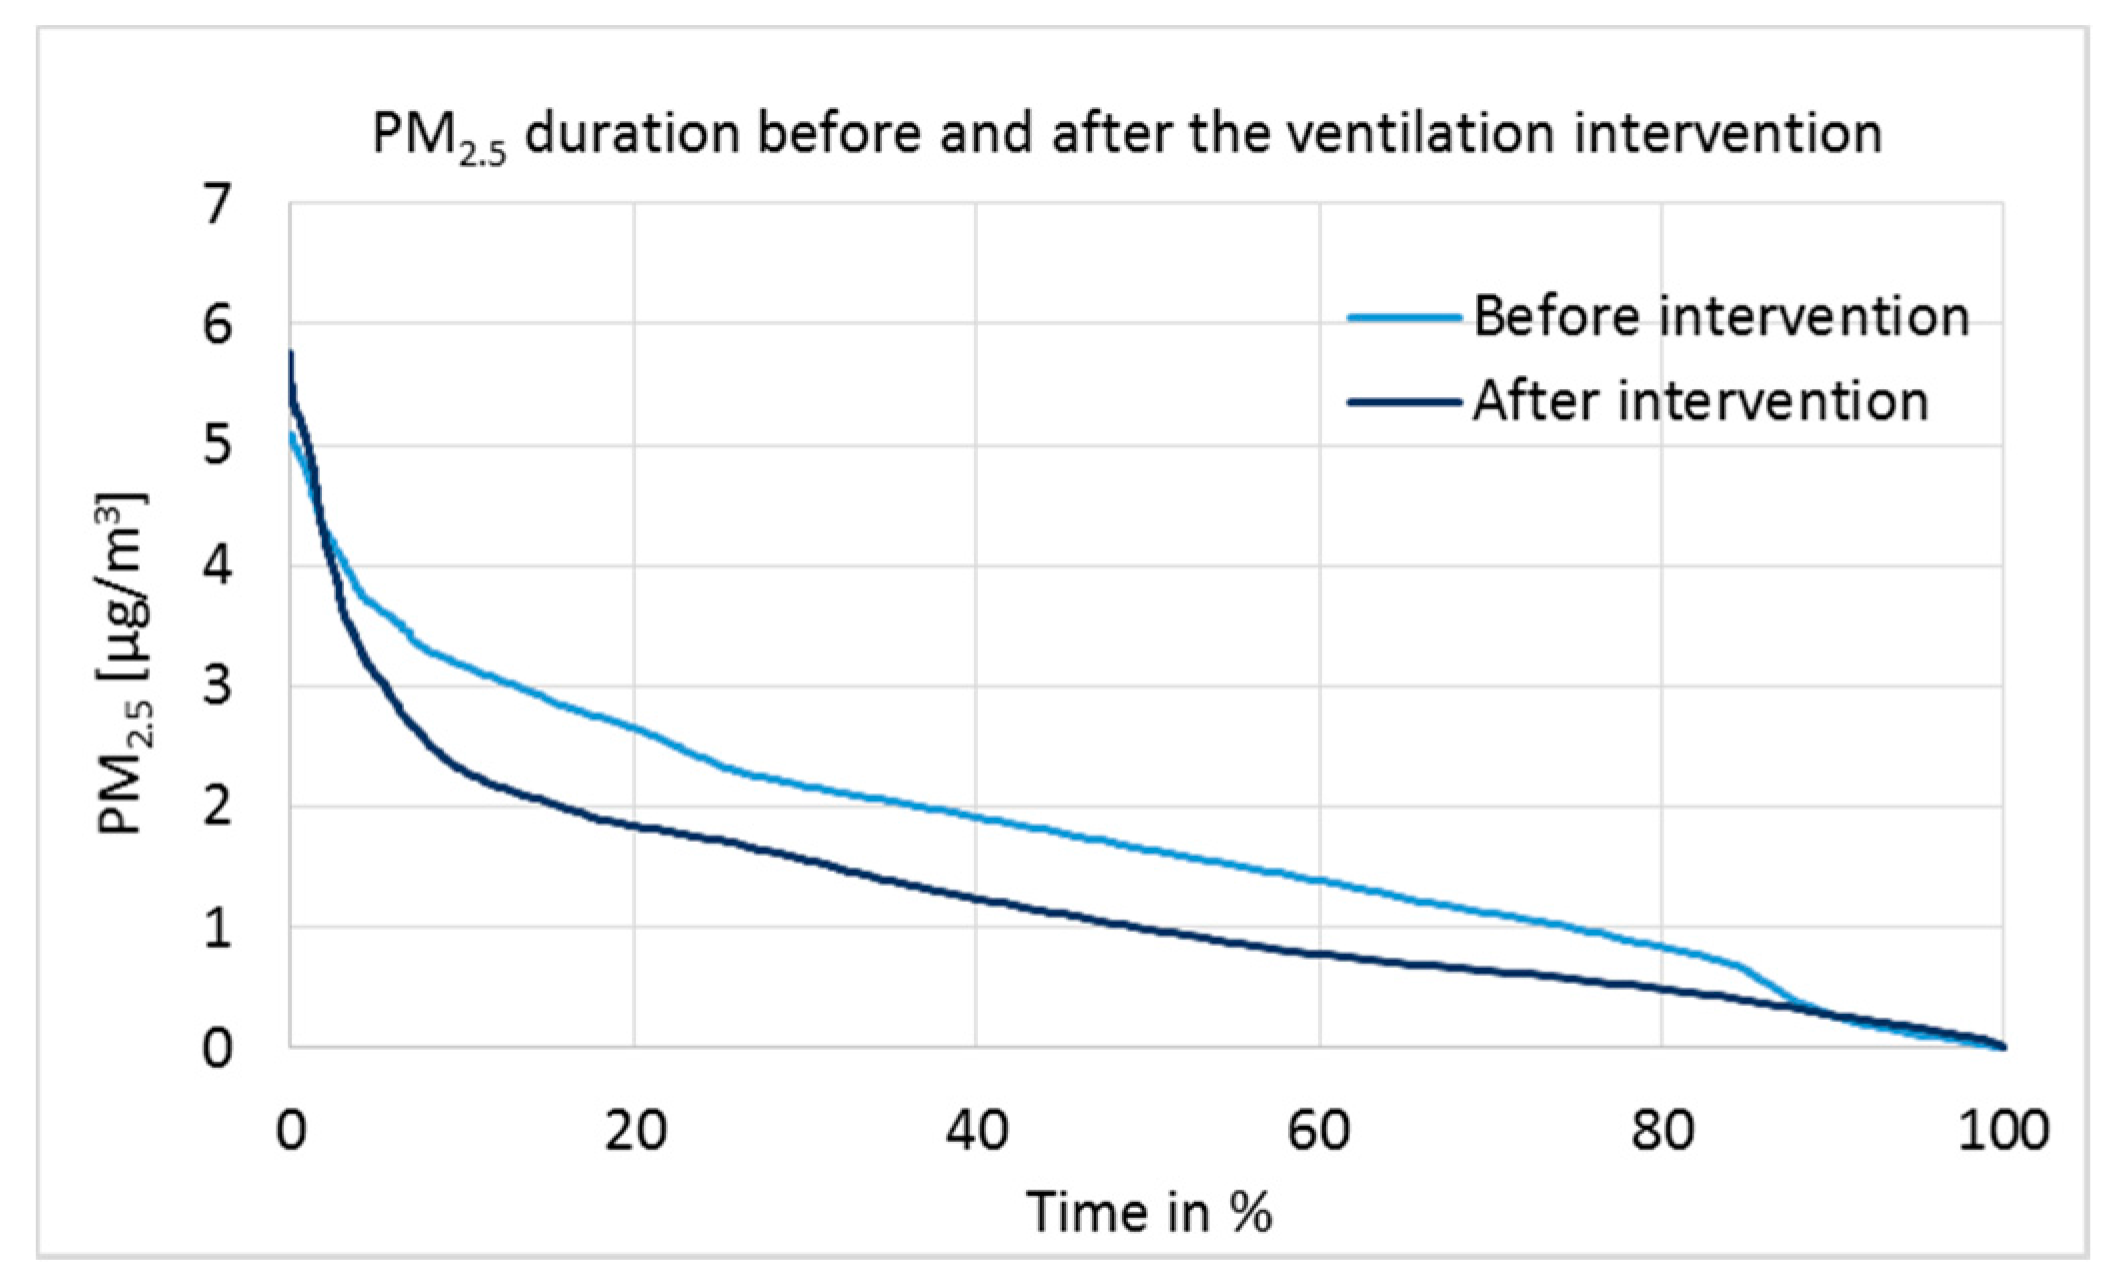
Particulate matter 2.5 µm measurement results are presented as a duration curve in
Figure 8, and parameters for statistical analysis are given in
Table 6.
The limit value for the PM
2.5 mean concentration following 24 h in indoor air is 25 µg/m
3 [
29]. All known PM
2.5 sources in the studied building are outdoor sources; for example, traffic and burning products. PM
2.5 concentrations were very low before and after the intervention (
Figure 8). However, tested by the independent two-sample
t-test (
Table 6), the difference in medians was statistically extremely significant at the 100% confidence interval (
p = 0.000, 2-tailed). Daily actions can affect the PM
2.5 concentrations temporarily; but due to the one-week measurement time, the results are reliable and show a clear correlation with the positive pressure.
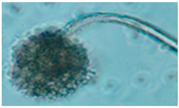
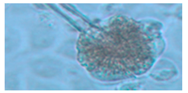
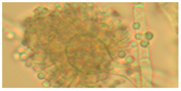
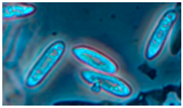
3.4. Characterization of the Mycobiota in the Indoor Dust
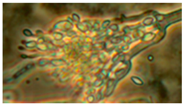
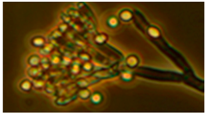
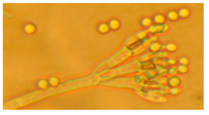
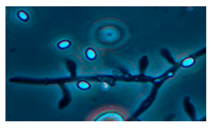
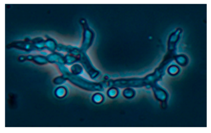
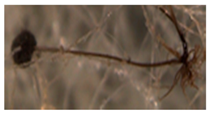
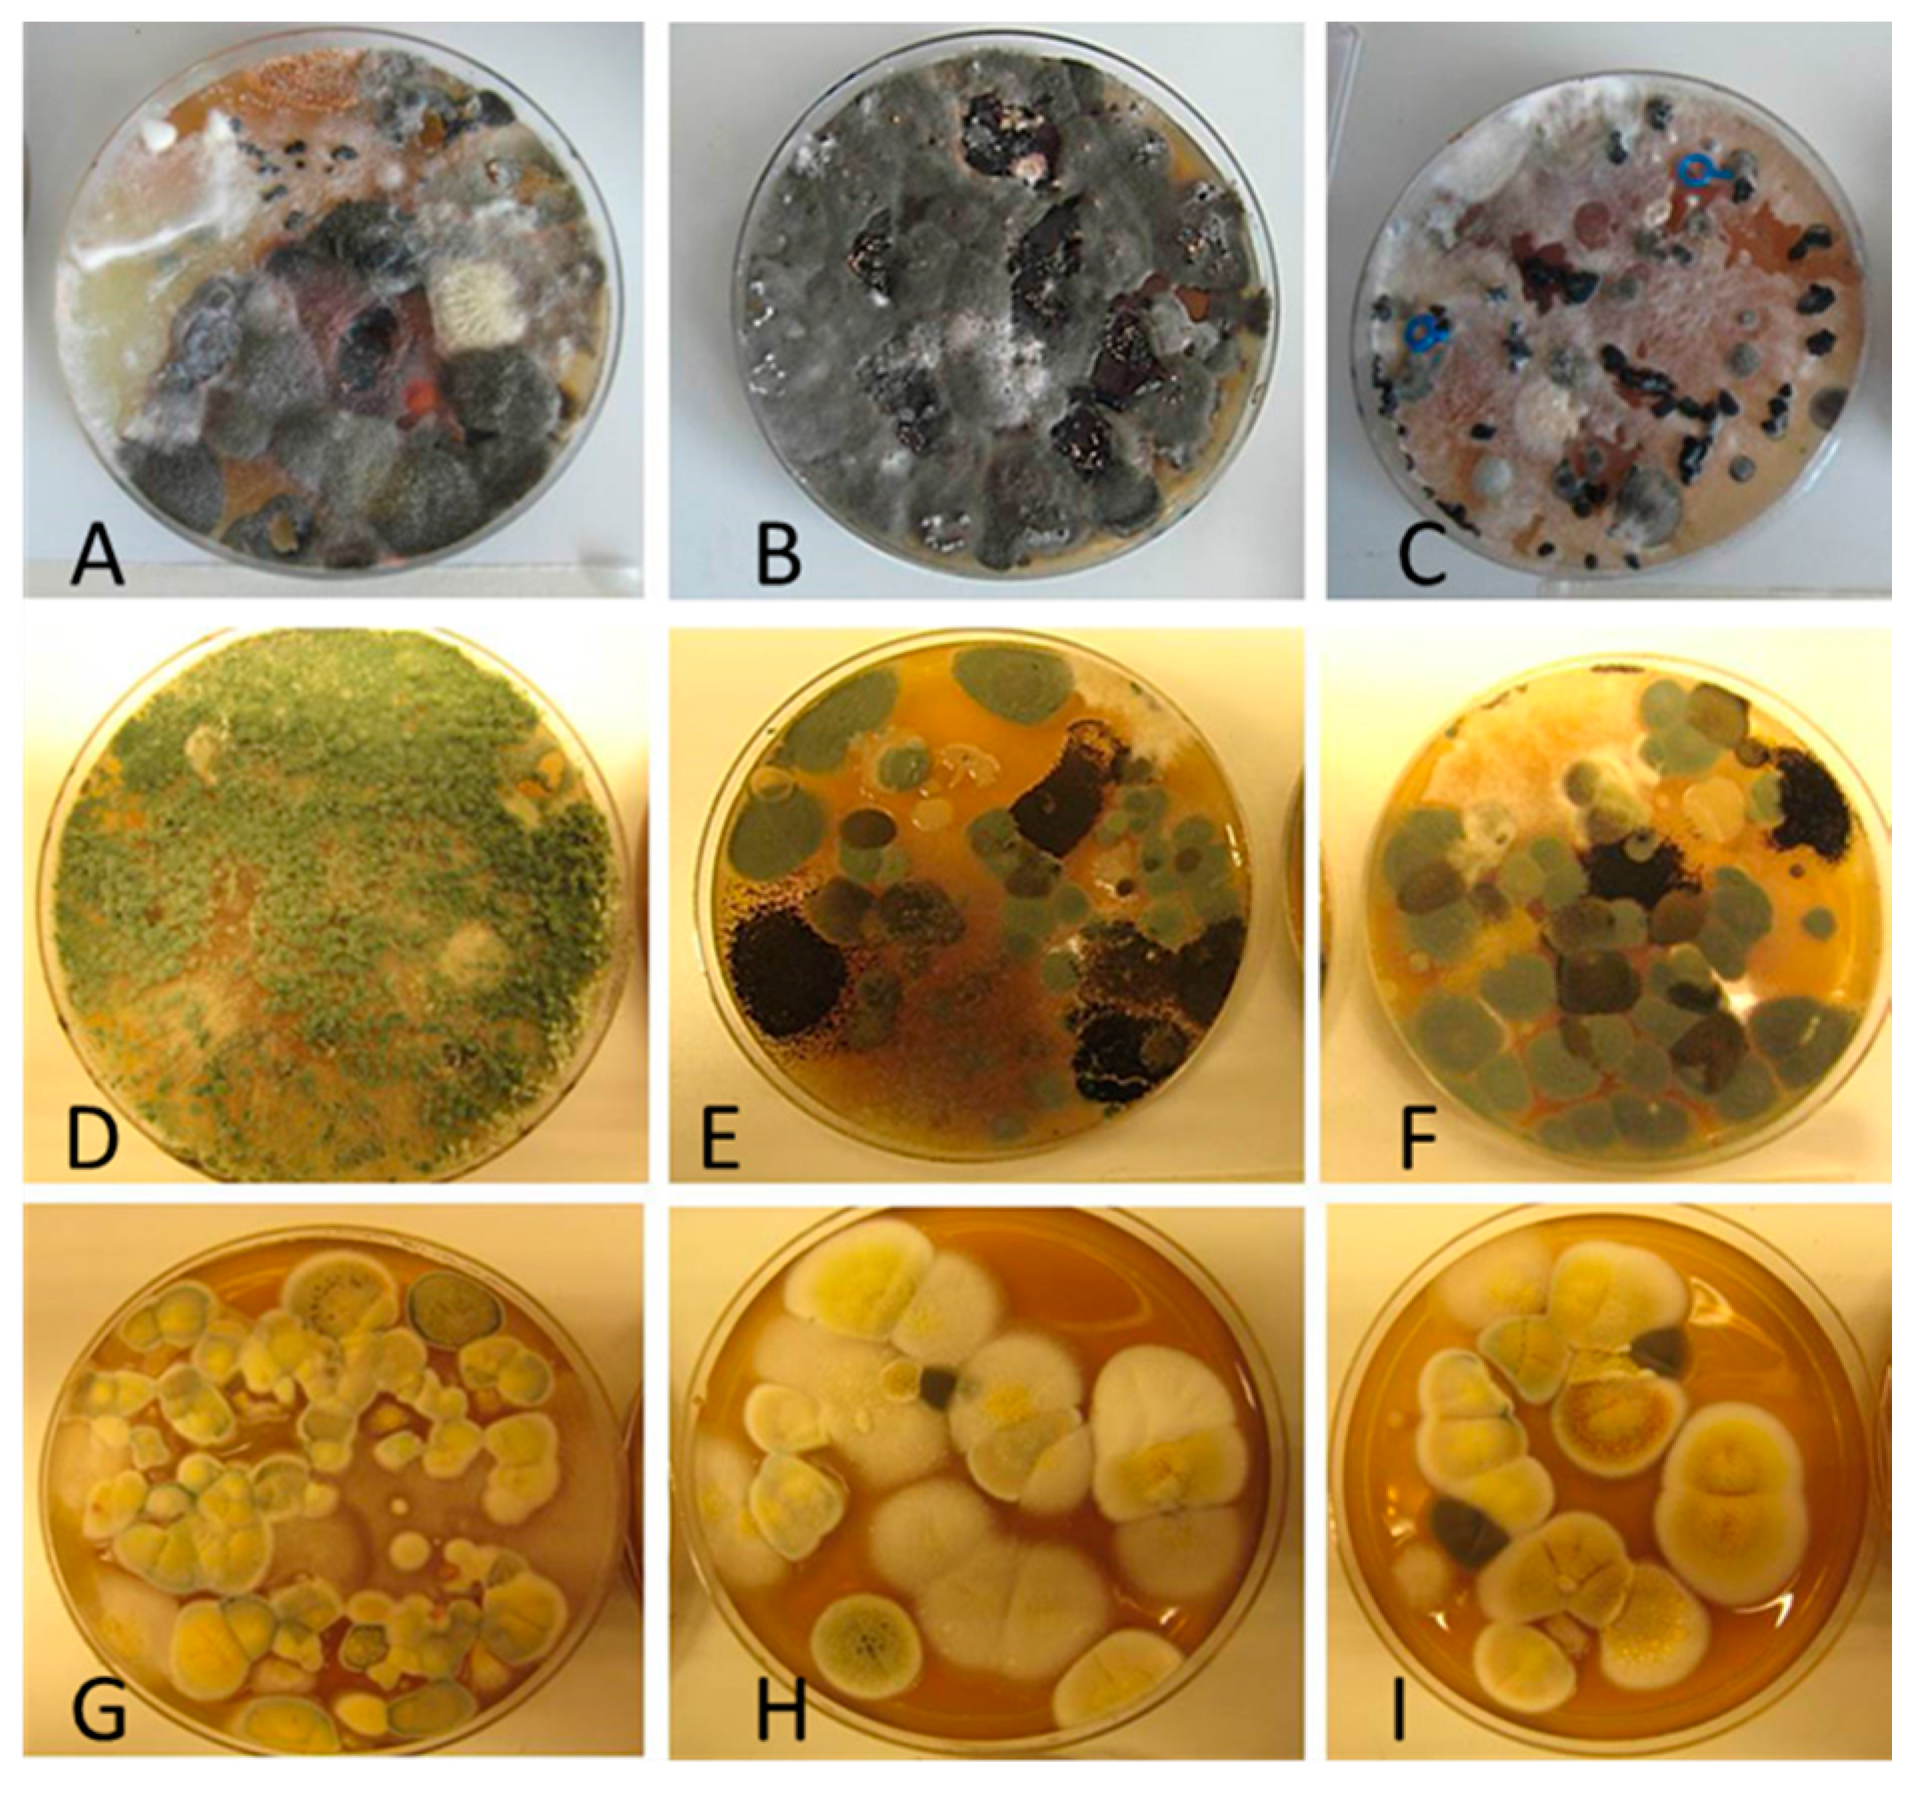
Diversity and the pathogenic and toxigenic potential of the mycobiota cultivable from indoor dust were characterized. Dust from extract filters and surfaces above floor levels were sampled and cultivated before and after the ventilation intervention. Outdoor dust and air were sampled as references. The fungal colonies are shown in
Figure 9.
The fungal colonies representing the dominant morphotypes after four weeks of incubation were characterized to genus or species level (
Table 7). The results in
Table 8 show that
Rhizopus sp. strains unable to grow at 37 °C were the most commonly isolated fungi in filter dust and settled dust collected before and after ventilation intervention. The results also show that toxigenic, potentially mycoparasitic
Trichoderma atroviride strains represented the dominant morphotype, as shown in
Figure 9D, on the three plates in both extract filter dust and settled dust collected before the ventilation intervention (
Table 8). The dominant morphotypes in this dust contained potentially pathogenic
Aspergillus and toxigenic
Penicillium species.
In dust collected after the ventilation intervention, the dominant mycobiota (except
Rhizopus sp.) consisted mainly of nontoxigenic
Penicillium strains and toxigenic
Aspergillus species unable to grow at 37 °C (
Table 8). One toxigenic
Trichoderma longibrachiatum strain able to grow at 37 °C, one toxigenic
T. trixiae and one toxigenic
Penicillium expansum colony were found on one plate each. Reference samples collected outside of the school contained toxigenic
Curvularia sp.—like colonies, rendering these outdoor samples the highest number of toxigenic colonies. The hay barn dust did not contain toxigenic species or potentially pathogenic
Aspergillus strains. The indoor mycobiota differed in species composition from the outdoor one, and changed simultaneously with the ventilation intervention. Interestingly, no mycoparasitic
Trichoderma atroviride strains were cultivable from the outdoor samples or barn dust. This indicates that this species, isolated from the extract filter and settled dust before the ventilation intervention, may have emanated from an indoor source.
It should be noted that the dust collected from the extract air filter represents the air collected from the studied building part during a several months’ period of time, thus being an exceptionally encompassing sample. However, the filter may have been impacted also by outdoor air if the classroom windows have been kept open, which needs to be considered when assessing the representativeness of the results for indoor air of a given building.
3.5. Indoor Air Questionnaire
Indoor air questionnaire results from the studied building section and from the other building sections are presented in
Table 9. Occupants answered the questionnaire in the studied building section before the ventilation intervention (May 2016) and after the intervention (January 2017), as well as simultaneously in the other building sections where no ventilation or other changes had taken place. Because of the low amount of data, Fisher’s exact test was used in the statistical analysis of several factors instead of the chi-squared test.
In the studied building section, the known changes in the conditions between the 2016 and 2017 questionnaires were outdoor conditions (seasons) and the ventilation intervention. In other building sections, the only known change was the season. Also, psychosocial factors have an impact on perceptions [
25]. In the studied building section, conclusions about the effect of psychosocial factors on IAQ perceptions could not be drawn compared to other building parts.
The first questionnaire (May 2016) was conducted during the spring when pollen may increase the symptoms of allergic diseases and thus effect the perception of indoor climate; however, the air handling unit had effective fine F7 class filters. The second questionnaire (January 2017) was conducted during the winter when the indoor air was very dry because of the low absolute humidity of the outdoor air. Dry air typically increases the prevalence of cough, nose and eye irritation, and skin symptoms [
25]. Mechanical ventilation is shown to increase symptom prevalence, related especially to air dryness [
2,
6,
33]. The impact of the season (spring/winter) can be seen from the results of other parts of the school that were not under intervention.
Due to the low number of occupants and the low response rate (58% and 62%) in the studied building section, individual answers were emphasized and significant differences (
p-value < 0.05) were mostly not found in the statistical analysis (
Table 9). The unwanted negative pressure differences, especially during holidays, might have affected indoor conditions and occupants’ perceptions. Between 2016 and 2017, the prevalence of hoarse, dry throat (
p = 0.118), heavy-feeling head (
p = 0.183), cough (
p = 0.321), and headache, as well as difficulties concentrating (
p = 0.444), increased. Also, the prevalence of varying temperature (
p = 0.162), draft (
p = 0.275), and insufficient ventilation (
p = 0.372) increased.
However, when comparing the changes in the studied building section to changes in the other building sections, a different trend emerged. The perception of low temperature (p = 0.345), stuffy air (p = 0.085), dry air (p = 0.103), and visible dust (p = 0.408) increased between 2016 and 2017 in other building sections; however, the increase was not statistically significant. This can be explained by seasonal changes. However, in the studied building section, no worsening in the same factors (p = 1.000) was reported.
A decrease in the perceptions of too high temperature (p = 0.477) was reported in the studied building section, while in other sections the number of perceptions was already very low in the first place. Perception of unpleasant odor decreased (p = 0.638) in the studied section to the same level as it was in the other sections. An increase in the perception of draft (p = 0.275, p = 0.253) and insufficient ventilation (p = 0.342, p = 0.352) was reported correspondingly in both sectors.
In the other building sections, tiredness (p = 0.077), nose irritation (p = 0.085) and dryness of facial skin (p = 0.036) increased, while no change in the studied section was seen (p = 1.000). The same tendency was seen in the factors which were statistically not significant, i.e., hand skin symptoms (p = 0.352) and shortness of breath (p = 0.491) increased as well. This is an interesting result considering that, simultaneously, reported asthma decreased (p = 0.253) in the other sections but not in the studied section. In addition, the prevalence of hay fever increased (p = 0.188) in the studied section, and the perceptions of heavy-feeling head (p = 0.183) and cough (p = 0.381) also increased more than in the other sections (p = 0.706 for both).
It can be concluded that IAQ in the building was perceived as being worse more frequently in 2017. In the studied building section, major improvements in occupants’ perceptions were not reported; however, neither was reported significant worsening in many of the factors that worsened in the other building parts during the follow-up time.

 ,
, 


