Children’s Blood Lead Concentrations from 1988 to 2015 in Mexico City: The Contribution of Lead in Air and Traditional Lead-Glazed Ceramics

 , , , ,
Abstract
:1. Introduction
2. Methods
3. Results
4. Discussion
5. Conclusions
Author Contributions
Funding
Acknowledgments
Conflicts of Interest
References
- Needleman, H.L. The Removal of Lead from Gasoline: Historical and Personal Reflections. Environ. Res. 2000, 84, 20–35. [Google Scholar] [CrossRef] [PubMed]
- Driscoll, W.; Mushak, P.; Garfias, J.; Rothenberg, S.J. Reducing lead in gasoline. Mexico’s experience. Environ. Sci. Technol. 1992, 26, 1702–1705. [Google Scholar] [CrossRef]
- Schnaas, L.; Rothenberg, S.J.; Flores, M.-F.; Martínez, S.; Hernández, C.; Osorio, E.; Perroni, E. Blood lead secular trend in a cohort of children in Mexico City (1987–2002). Environ. Health Perspect. 2004, 112, 1110–1115. [Google Scholar] [CrossRef] [PubMed]
- Ruíz Sandoval, G. Envenenamiento lento por plomo en los habitantes de Oaxaca. Gac Méd Méx Periódico la Acad. Med. México Hig. Pública 1878, 13, 393–403. [Google Scholar]
- Hernandez Avila, M.; Romieu, I.; Rios, C.; Rivero, A.; Palazuelos, E. Lead-glazed ceramics as major determinants of blood lead levels in Mexican women. Environ. Health Perspect. 1991, 94, 117–120. [Google Scholar] [CrossRef] [PubMed]
- Diaz-Ruiz, A.; Tristán-López, L.A.; Medrano-Gómez, K.I.; Torres-Domínguez, J.A.; Ríos, C.; Montes, S. Glazed clay pottery and lead exposure in Mexico: Current experimental evidence. Nutr. Neurosci. 2017, 20, 513–518. [Google Scholar] [CrossRef] [PubMed]
- Searle, A.K.; Baghurst, P.A.; van Hooff, M.; Sawyer, M.G.; Sim, M.R.; Galletly, C.; Clark, L.S.; McFarlane, A.C. Tracing the long-term legacy of childhood lead exposure: A review of three decades of the Port Pirie Cohort study. Neurotoxicology 2014, 43, 46–56. [Google Scholar] [CrossRef] [PubMed]
- Centers for Disease Control and Prevention. Low Level Lead Exposure Harms Children: A Renewed Call for Primary Prevention; CDC: Atlanta, GA, USA, 2012. Available online: https://www.cdc.gov/nceh/lead/acclpp/final_document_030712.pdf (accessed on 9 January 2017).
- DOF—Diario Oficial de la Federación. Available online: http://dof.gob.mx/nota_detalle.php?codigo=5495551&fecha=30/08/2017 (accessed on 27 July 2018).
- Lanphear, B.P.; Rauch, S.; Auinger, P.; Allen, R.W.; Hornung, R.W. Low-level lead exposure and mortality in US adults: A population-based cohort study. Lancet Public Health 2018, 3, e177–e184. [Google Scholar] [CrossRef]
- Caravanos, J.; Dowling, R.; Téllez-Rojo, M.M.; Cantoral, A.; Kobrosly, R.; Estrada, D.; Orjuela, M.; Gualtero, S.; Ericson, B.; Rivera, A.; et al. Blood lead levels in Mexico and pediatric burden of disease implications. Ann. Glob. Health 2014, 80, 269–277. [Google Scholar] [CrossRef] [PubMed]
- Tsoi, M.-F.; Cheung, C.-L.; Cheung, T.T.; Cheung, B.M.Y. Continual Decrease in Blood Lead Level in Americans: United States National Health Nutrition and Examination Survey 1999–2014. Am. J. Med. 2016, 129, 1213–1218. [Google Scholar] [CrossRef] [PubMed]
- Téllez-Rojo, M.M.; Bautista-Arredondo, L.F.; Richardson, V.; Estrada-Sánchez, D.; Ávila-Jiménez, L.; Ríos, C.; Cantoral-Preciado, A.; Romero-Martínez, M.; Flores-Pimentel, D.; Melo-Zurita, M.D.C.; et al. Intoxicación por plomo y nivel de marginación en recién nacidos de Morelos, México. Salud Publica Mex. 2017, 59, 218–226. [Google Scholar] [CrossRef] [PubMed]
- Hernandez-Avila, M.; Peterson, K.E.; Gonzalez-Cossio, T.; Sanin, L.H.; Aro, A.; Schnaas, L.; Hu, H. Effect of Maternal Bone Lead on Length and Head Circumference of Newborns and 1-Month-Old Infants. Arch. Environ. Health Int. J. 2002, 57, 482–488. [Google Scholar] [CrossRef] [PubMed]
- Hu, H.; Téllez-Rojo, M.M.; Bellinger, D.; Smith, D.; Ettinger, A.S.; Lamadrid-Figueroa, H.; Schwartz, J.; Schnaas, L.; Mercado-García, A.; Hernández-Avila, M. Fetal lead exposure at each stage of pregnancy as a predictor of infant mental development. Environ. Health Perspect. 2006, 114, 1730–1735. [Google Scholar] [CrossRef] [PubMed] [Green Version]
- Ettinger, A.S.; Téllez-Rojo, M.M.; Amarasiriwardena, C.; Bellinger, D.; Peterson, K.; Schwartz, J.; Hu, H.; Hernández-Avila, M. Effect of breast milk lead on infant blood lead levels at 1 month of age. Environ. Health Perspect. 2004, 112, 1381–1385. [Google Scholar] [CrossRef] [PubMed] [Green Version]
- Ettinger, A.S.; Téllez-Rojo, M.M.; Amarasiriwardena, C.; Peterson, K.E.; Schwartz, J.; Aro, A.; Hu, H.; Hernández-Avila, M. Influence of Maternal Bone Lead Burden and Calcium Intake on Levels of Lead in Breast Milk over the Course of Lactation. Am. J. Epidemiol. 2005, 163, 48–56. [Google Scholar] [CrossRef] [PubMed] [Green Version]
- Claus Henn, B.; Ettinger, A.S.; Schwartz, J.; Téllez-Rojo, M.M.; Lamadrid-Figueroa, H.; Hernández-Avila, M.; Schnaas, L.; Amarasiriwardena, C.; Bellinger, D.C.; Hu, H.; et al. Early postnatal blood manganese levels and children’s neurodevelopment. Epidemiology 2010, 21, 433–439. [Google Scholar] [CrossRef] [PubMed]
- Braun, J.M.; Wright, R.J.; Just, A.C.; Power, M.C.; Tamayo Y Ortiz, M.; Schnaas, L.; Hu, H.; Wright, R.O.; Tellez-Rojo, M.M. Relationships between lead biomarkers and diurnal salivary cortisol indices in pregnant women from Mexico City: A cross-sectional study. Environ. Health 2014, 13, 50. [Google Scholar] [CrossRef] [PubMed]
- Bases de datos—Red Automática de Monitoreo Atmosférico (RAMA), Secretaría de Medio Ambiente de la Ciudad de México. Available online: http://www.aire.cdmx.gob.mx/default.php?opc=%27aKBh%27 (accessed on 28 July 2018).
- Hanna-Attisha, M.; LaChance, J.; Sadler, R.C.; Champney Schnepp, A. Elevated Blood Lead Levels in Children Associated With the Flint Drinking Water Crisis: A Spatial Analysis of Risk and Public Health Response. Am. J. Public Health 2016, 106, 283–290. [Google Scholar] [CrossRef] [PubMed] [Green Version]
- Tamayo-Ortiz, M.; Navia-Antezana, J. Reduced Lead Exposure Following a Sensitization Program in Rural Family Homes Producing Traditional Mexican Ceramics. Ann. Glob. Health 2018, 84, 285–291. [Google Scholar] [CrossRef]
- Jones, D.E.; Pérez, M.C.; Ericson, B.; Sánchez, D.E.; Gualtero, S.; Smith-Jones, A.; Caravanos, J. Childhood Blood Lead Reductions Following Removal of Leaded Ceramic Glazes in Artisanal Pottery Production: A Success Story. J. Health Pollut. 2013, 3, 23–29. [Google Scholar] [CrossRef] [Green Version]
- Official Mexican Standard, NOM-231-SSA1-2002, Secretaría de Salud, Mexico City, Mexico. 2002. Available online: http://www.salud.gob.mx/unidades/cdi/nom/231ssa102.pdf (accessed on 28 September 2018).
- Olympio, K.P.K.; Gonçalves, C.G.; Salles, F.J.; da Silva Ferreira, A.P.S.; Soares, A.S.; Buzalaf, M.A.R.; Cardoso, M.R.A.; Bechara, E.J.H. What are the blood lead levels of children living in Latin America and the Caribbean? Environ. Int. 2017, 101, 46–58. [Google Scholar] [CrossRef] [PubMed]
- Haley, V.B.; Talbot, T.O. Seasonality and trend in blood lead levels of New York State children. BMC Pediatr. 2004, 4, 8. [Google Scholar] [CrossRef] [PubMed] [Green Version]
- Centers for Disease Control and Prevention, Lead—Home Page. Available online: https://www.cdc.gov/nceh/lead/default.htm (accessed on 20 August 2018).
- INEGI ¿Cuántos son como tú? Available online: http://cuentame.inegi.org.mx/monografias/informacion/df/poblacion/comotu.aspx?tema=me&e=09 (accessed on 29 August 2018).


| Characteristic | Cohort | Total | ||||
|---|---|---|---|---|---|---|
| A | B | C | D | E | ||
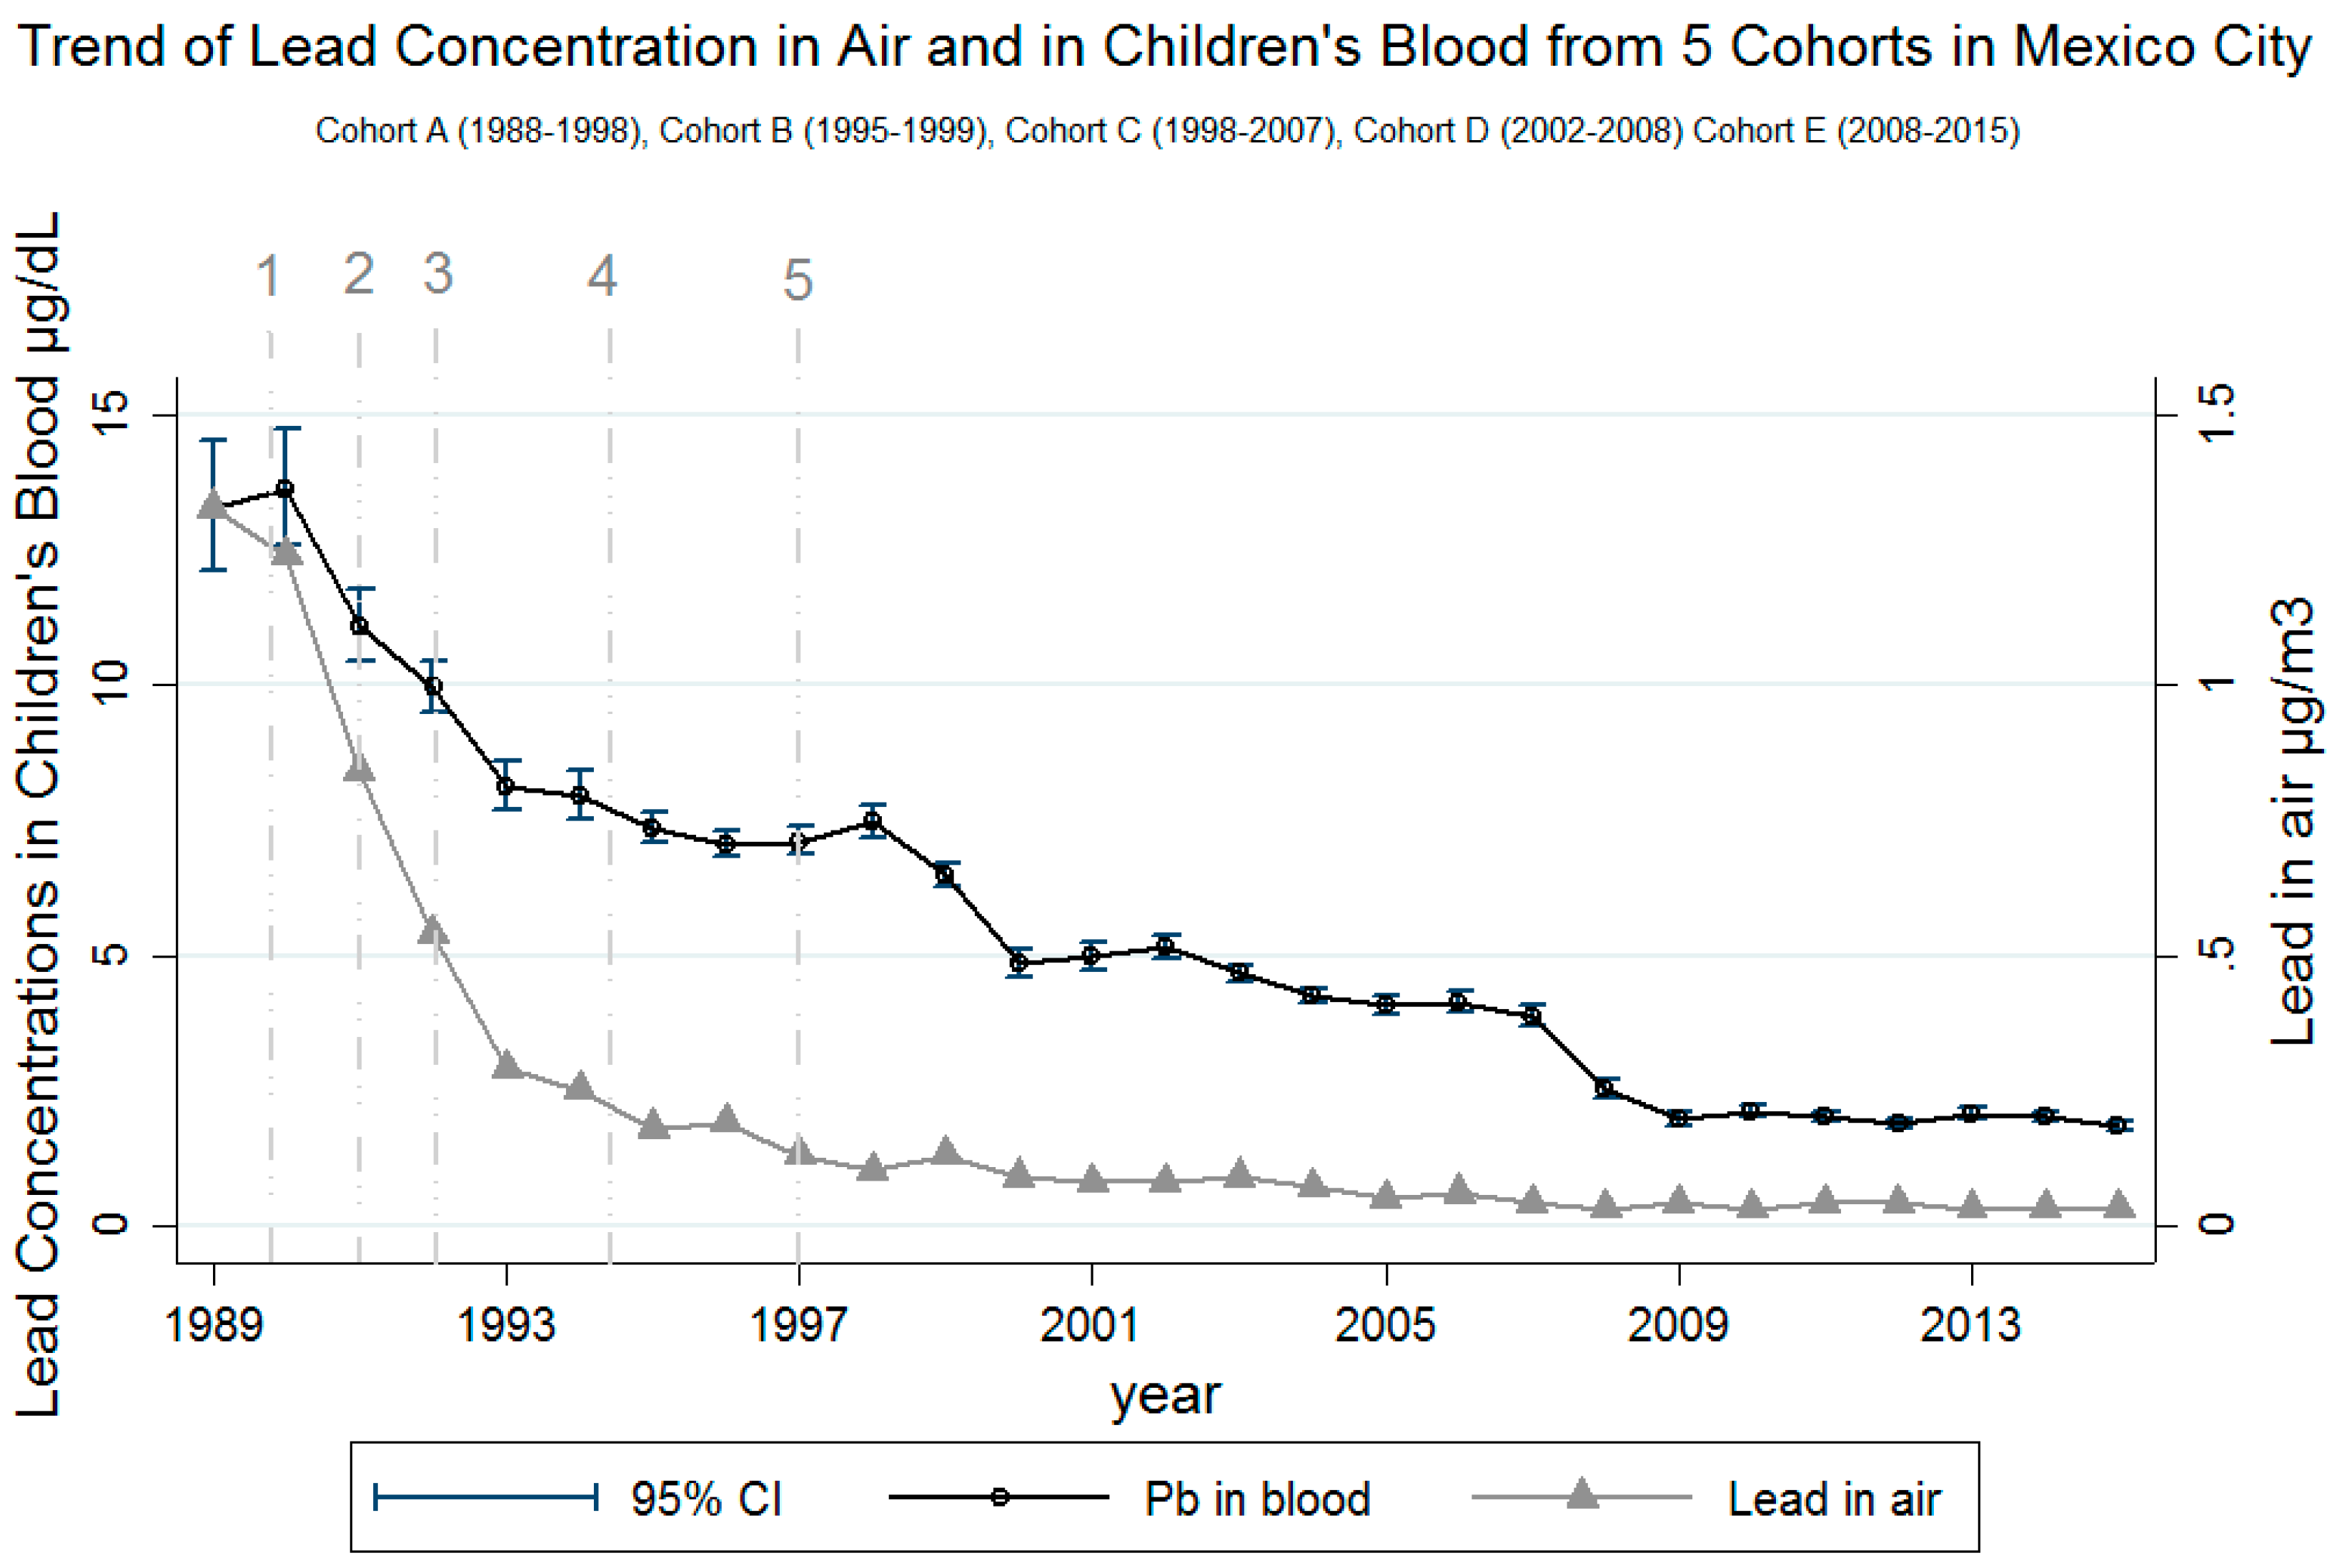
| Recruitment start year | 1987 | 1994 | 1997 | 2001 | 2007 | |
| Years included in study | 1988–1998 | 1995–1999 | 1998–2007 | 2002–2008 | 2008–2015 | |
| Number of participants | 291 | 457 | 240 | 382 | 593 | 1963 |
| Girls, n (%) | 129 (44) | 202 (44) | 122 (51) | 190 (50) | 293 (49) | 936 (48) |
| Maternal Education, n (%) | ||||||
| Primary | 55 (19) | 94 (21) | 27 (11) | 28 (7) | 17 (3) | 219 (11) |
| Technical secondary | 107 (38) | 239 (53) | 113 (47) | 212 (56) | 229 (39) | 900 (46) |
| Secondary | 74 (26) | 69 (15) | 68 (29) | 89 (23) | 212 (36) | 512 (26) |
| Technical high school | 42 (15) | 43 (10) | 27 (11) | 49 (13) | 128 (22) | 289 (15) |
| High school or college | 3 (1) | 7 (1) | 4 (2) | 2 (1) | 7 (1) | 23 (2) |
| Number of Blood Samples for Each Age | ||||||
| 1 year old | 247 | 212 | 199 | 268 | 165 | 1091 |
| 2 years old | 219 | 306 | 206 | 318 | 245 | 1294 |
| 3 years old | 191 | 228 | 179 | 251 | - | 849 |
| 4 years old | 185 | 263 | 194 | 188 | 251 | 1081 |
| 5 years old | 151 | - | 184 | 80 | 245 | 660 |
| Total number of samples | 993 | 1009 | 962 | 1105 | 906 | 4975 |
| Main Exposures | ||||||
| Pb in air, mean (µg/m3), (SD) * | 0.56 (0.41) | 0.14 (0.04) | 0.08 (0.01) | 0.06 (0.01) | 0.03 (0.00) | |
| Use of Pb-glazed ceramics, yes (%) | 115 (41) | 200 (47) | 82 (35) | 88 (23) | 193 (33) | 678 (36) |
| Age | Cohort | Total | ||||
|---|---|---|---|---|---|---|
| A | B | C | D | E | ||
| 1988–1998 | 1995–1999 | 1998–2007 | 2002–2008 | 2008–2015 | ||
| GM (SD) (µg/dL) | ||||||
| 1 year old | 9.9 (1.8) | 6.7 (1.6) | 4.3 (1.9) | 3.6 (1.8) | 2.2 (1.8) | 4.9 (2.2) |
| 2 years old | 10.7 (1.7) | 7.3 (1.6) | 4.1 (1.9) | 3.9 (1.8) | 2.4 (1.7) | 4.9 (2.1) |
| 3 years old | 9.9 (1.7) | 7.3 (1.7) | 6.2 (1.7) | 4.0 (1.6) | - | 6.3 (1.8) |
| 4 years old | 8.9 (1.6) | 7.4 (1.5) | 5.8 (1.6) | 4.8 (1.7) | 1.9 (1.9) | 5.0 (2.1) |
| 5 years old | 7.8 (1.7) | - | 4.4 (1.6) | 4.9 (1.4) | 1.8 (1.8) | 3.6 (2.2) |
| GM (SD) | 9.5 (1.7) | 7.2 (1.6) | 4.8 (1.8) | 4.0 (1.7) | 2.0 (1.8) | 4.9 (2.1) |
| Variable | Coefficient | Standard Error | 95% Confidence Interval |
|---|---|---|---|
| No use of Pb-glazed ceramics | −0.11 | 0.02 | −0.15, −0.07 *** |
| Lead in air | 0.32 | 0.07 | 0.18, 0.44 *** |
| Child’s age | |||
| 2 years old | 0.11 | 0.02 | 0.07, 0.16 *** |
| 3 years old | 0.28 | 0.03 | 0.21, 0.35 *** |
| 4 years old | 0.33 | 0.05 | 0.24, 0.42 *** |
| 5 years old | 0.19 | 0.06 | 0.08, 0.31 *** |
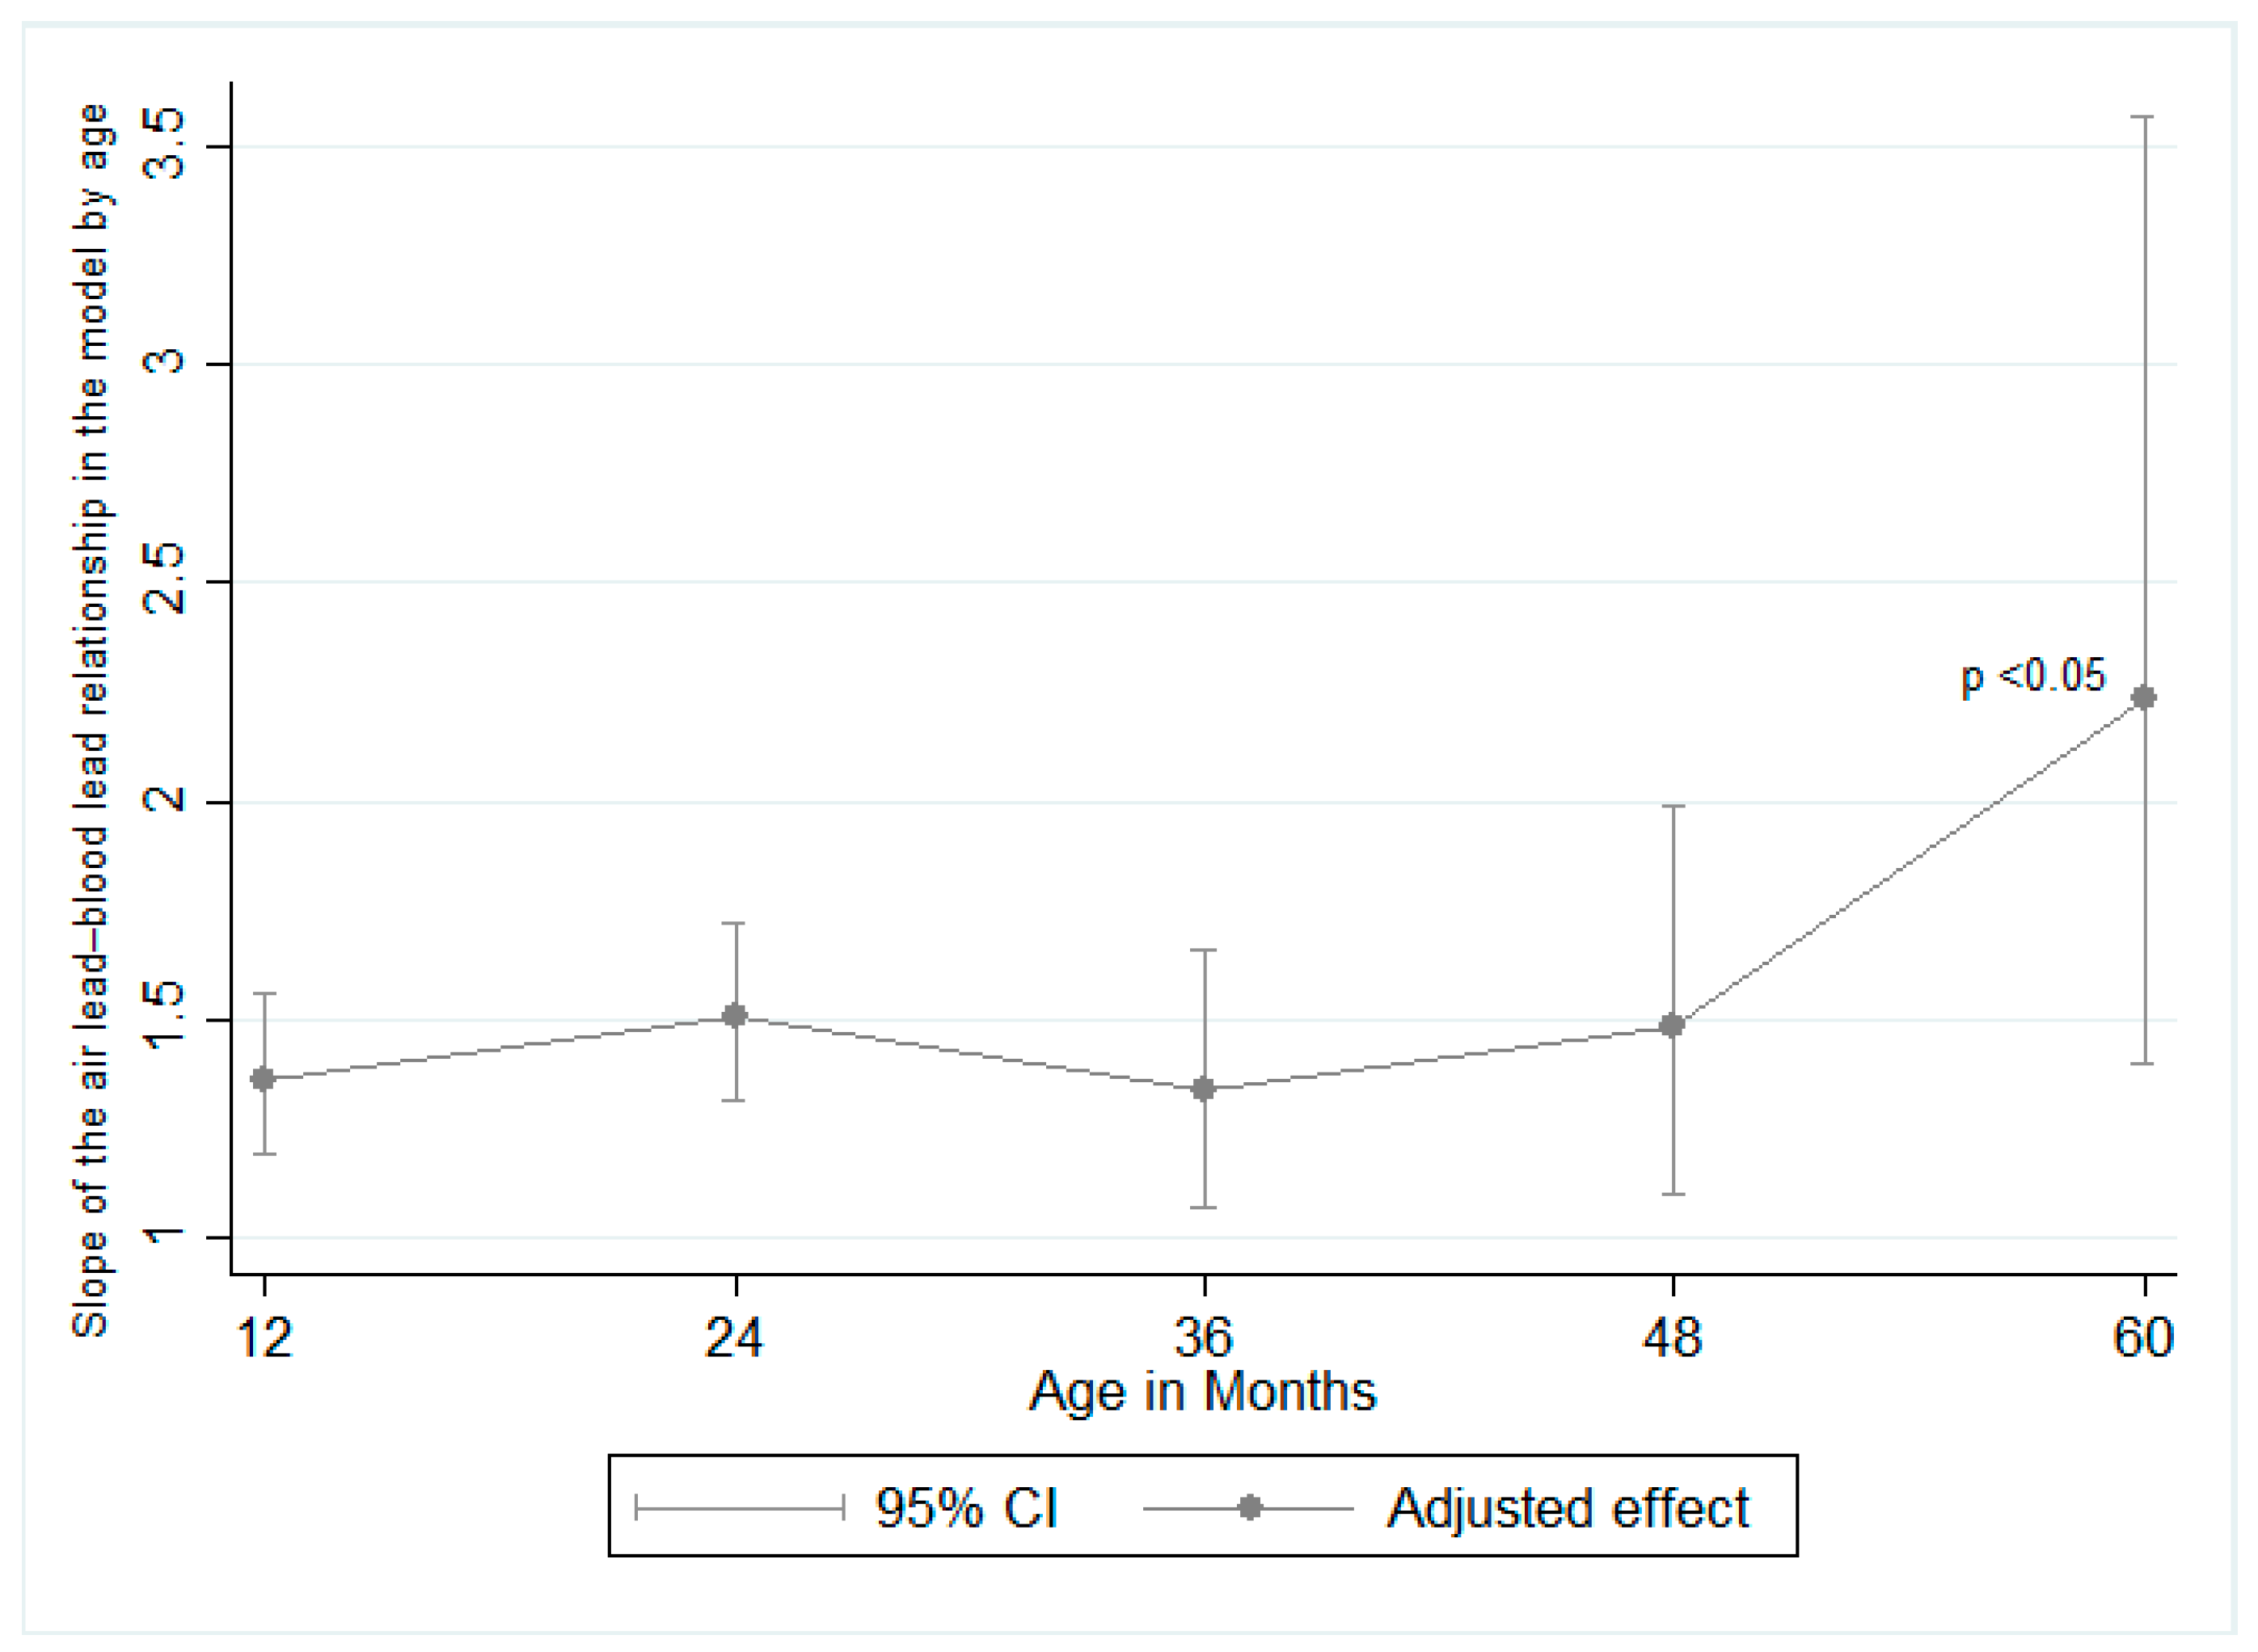
| Lead in air × child’s age | |||
| 2 years old | 0.09 | 0.05 | −0.01, 0.20 * |
| 3 years old | −0.02 | 0.09 | −0.19, 0.15 |
| 4 years old | 0.08 | 0.12 | −0.15, 0.31 |
| 5 years old | 0.49 | 0.20 | 0.09, 0.89 ** |
| Year of sample collection | −0.07 | 0.01 | −0.09, −0.05 *** |
| Cohort | |||
| Cohort B | 0.17 | 0.05 | 0.06, 0.28 ** |
| Cohort C | 0.18 | 0.10 | −0.02, 0.37 * |
| Cohort D | 0.27 | 0.14 | −0.00, 0.53 * |
| Cohort E | 0.11 | 0.22 | −0.32, 0.53 |
| Maternal education | |||
| Elementary | 0.32 | 0.27 | −0.21, 0.86 |
| Technical elementary | 0.27 | 0.27 | −0.26, 0.80 |
| Middle school | 0.22 | 0.27 | −0.31, 0.75 |
| Technical middle school | 0.07 | 0.27 | −0.46, 0.61 |
| Highs school or college | −0.09 | 0.29 | −0.67, 0.47 |
| Sex (female) | −0.03 | 0.02 | −0.07, 0.01 |
© 2018 by the authors. Licensee MDPI, Basel, Switzerland. This article is an open access article distributed under the terms and conditions of the Creative Commons Attribution (CC BY) license (http://creativecommons.org/licenses/by/4.0/).
Share and Cite
Pantic, I.; Tamayo-Ortiz, M.; Rosa-Parra, A.; Bautista-Arredondo, L.; Wright, R.O.; Peterson, K.E.; Schnaas, L.; Rothenberg, S.J.; Hu, H.; Téllez-Rojo, M.M. Children’s Blood Lead Concentrations from 1988 to 2015 in Mexico City: The Contribution of Lead in Air and Traditional Lead-Glazed Ceramics. Int. J. Environ. Res. Public Health 2018, 15, 2153. https://doi.org/10.3390/ijerph15102153
Pantic I, Tamayo-Ortiz M, Rosa-Parra A, Bautista-Arredondo L, Wright RO, Peterson KE, Schnaas L, Rothenberg SJ, Hu H, Téllez-Rojo MM. Children’s Blood Lead Concentrations from 1988 to 2015 in Mexico City: The Contribution of Lead in Air and Traditional Lead-Glazed Ceramics. International Journal of Environmental Research and Public Health. 2018; 15(10):2153. https://doi.org/10.3390/ijerph15102153
Chicago/Turabian StylePantic, Ivan, Marcela Tamayo-Ortiz, Antonio Rosa-Parra, Luis Bautista-Arredondo, Robert O. Wright, Karen E. Peterson, Lourdes Schnaas, Stephen J. Rothenberg, Howard Hu, and Martha María Téllez-Rojo. 2018. "Children’s Blood Lead Concentrations from 1988 to 2015 in Mexico City: The Contribution of Lead in Air and Traditional Lead-Glazed Ceramics" International Journal of Environmental Research and Public Health 15, no. 10: 2153. https://doi.org/10.3390/ijerph15102153