
Geographic Variations in Cardiometabolic Risk Factors in Luxembourg

Abstract
:1. Introduction
2. Methods
2.1. Studied Population
2.2. Outcome Measurement
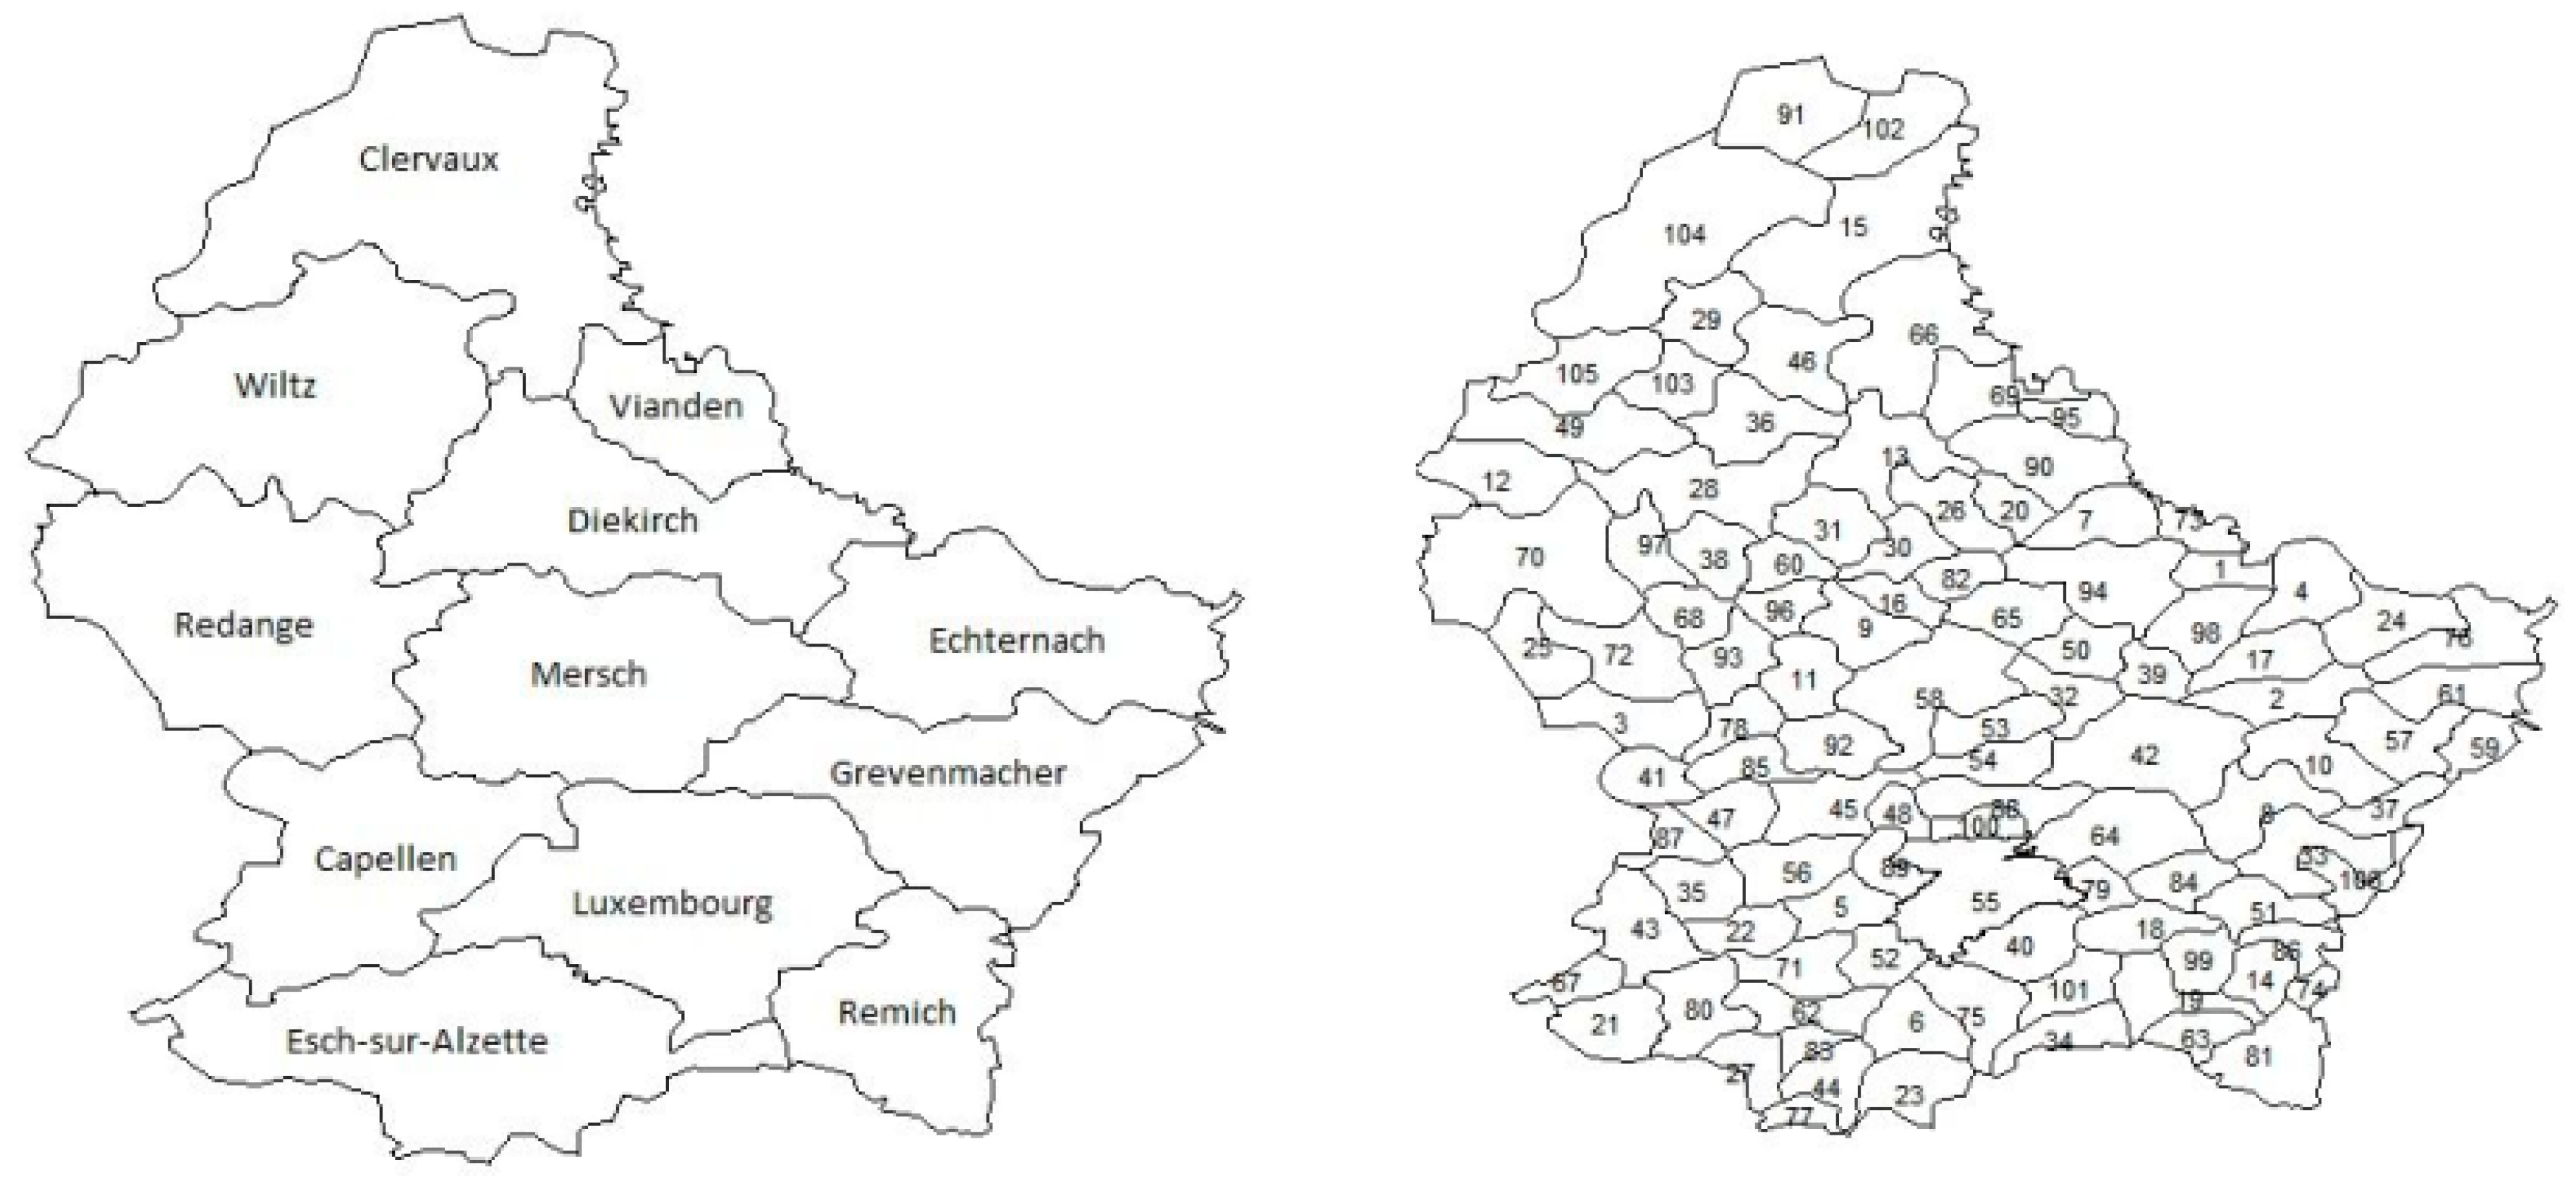
2.3. Geographical Variables
2.4. Statistical Analysis
3. Results
3.1. Subjects’ Characteristics
3.2. Geographical Distribution of Top Leading Behavioural and Metabolic Risk Factors
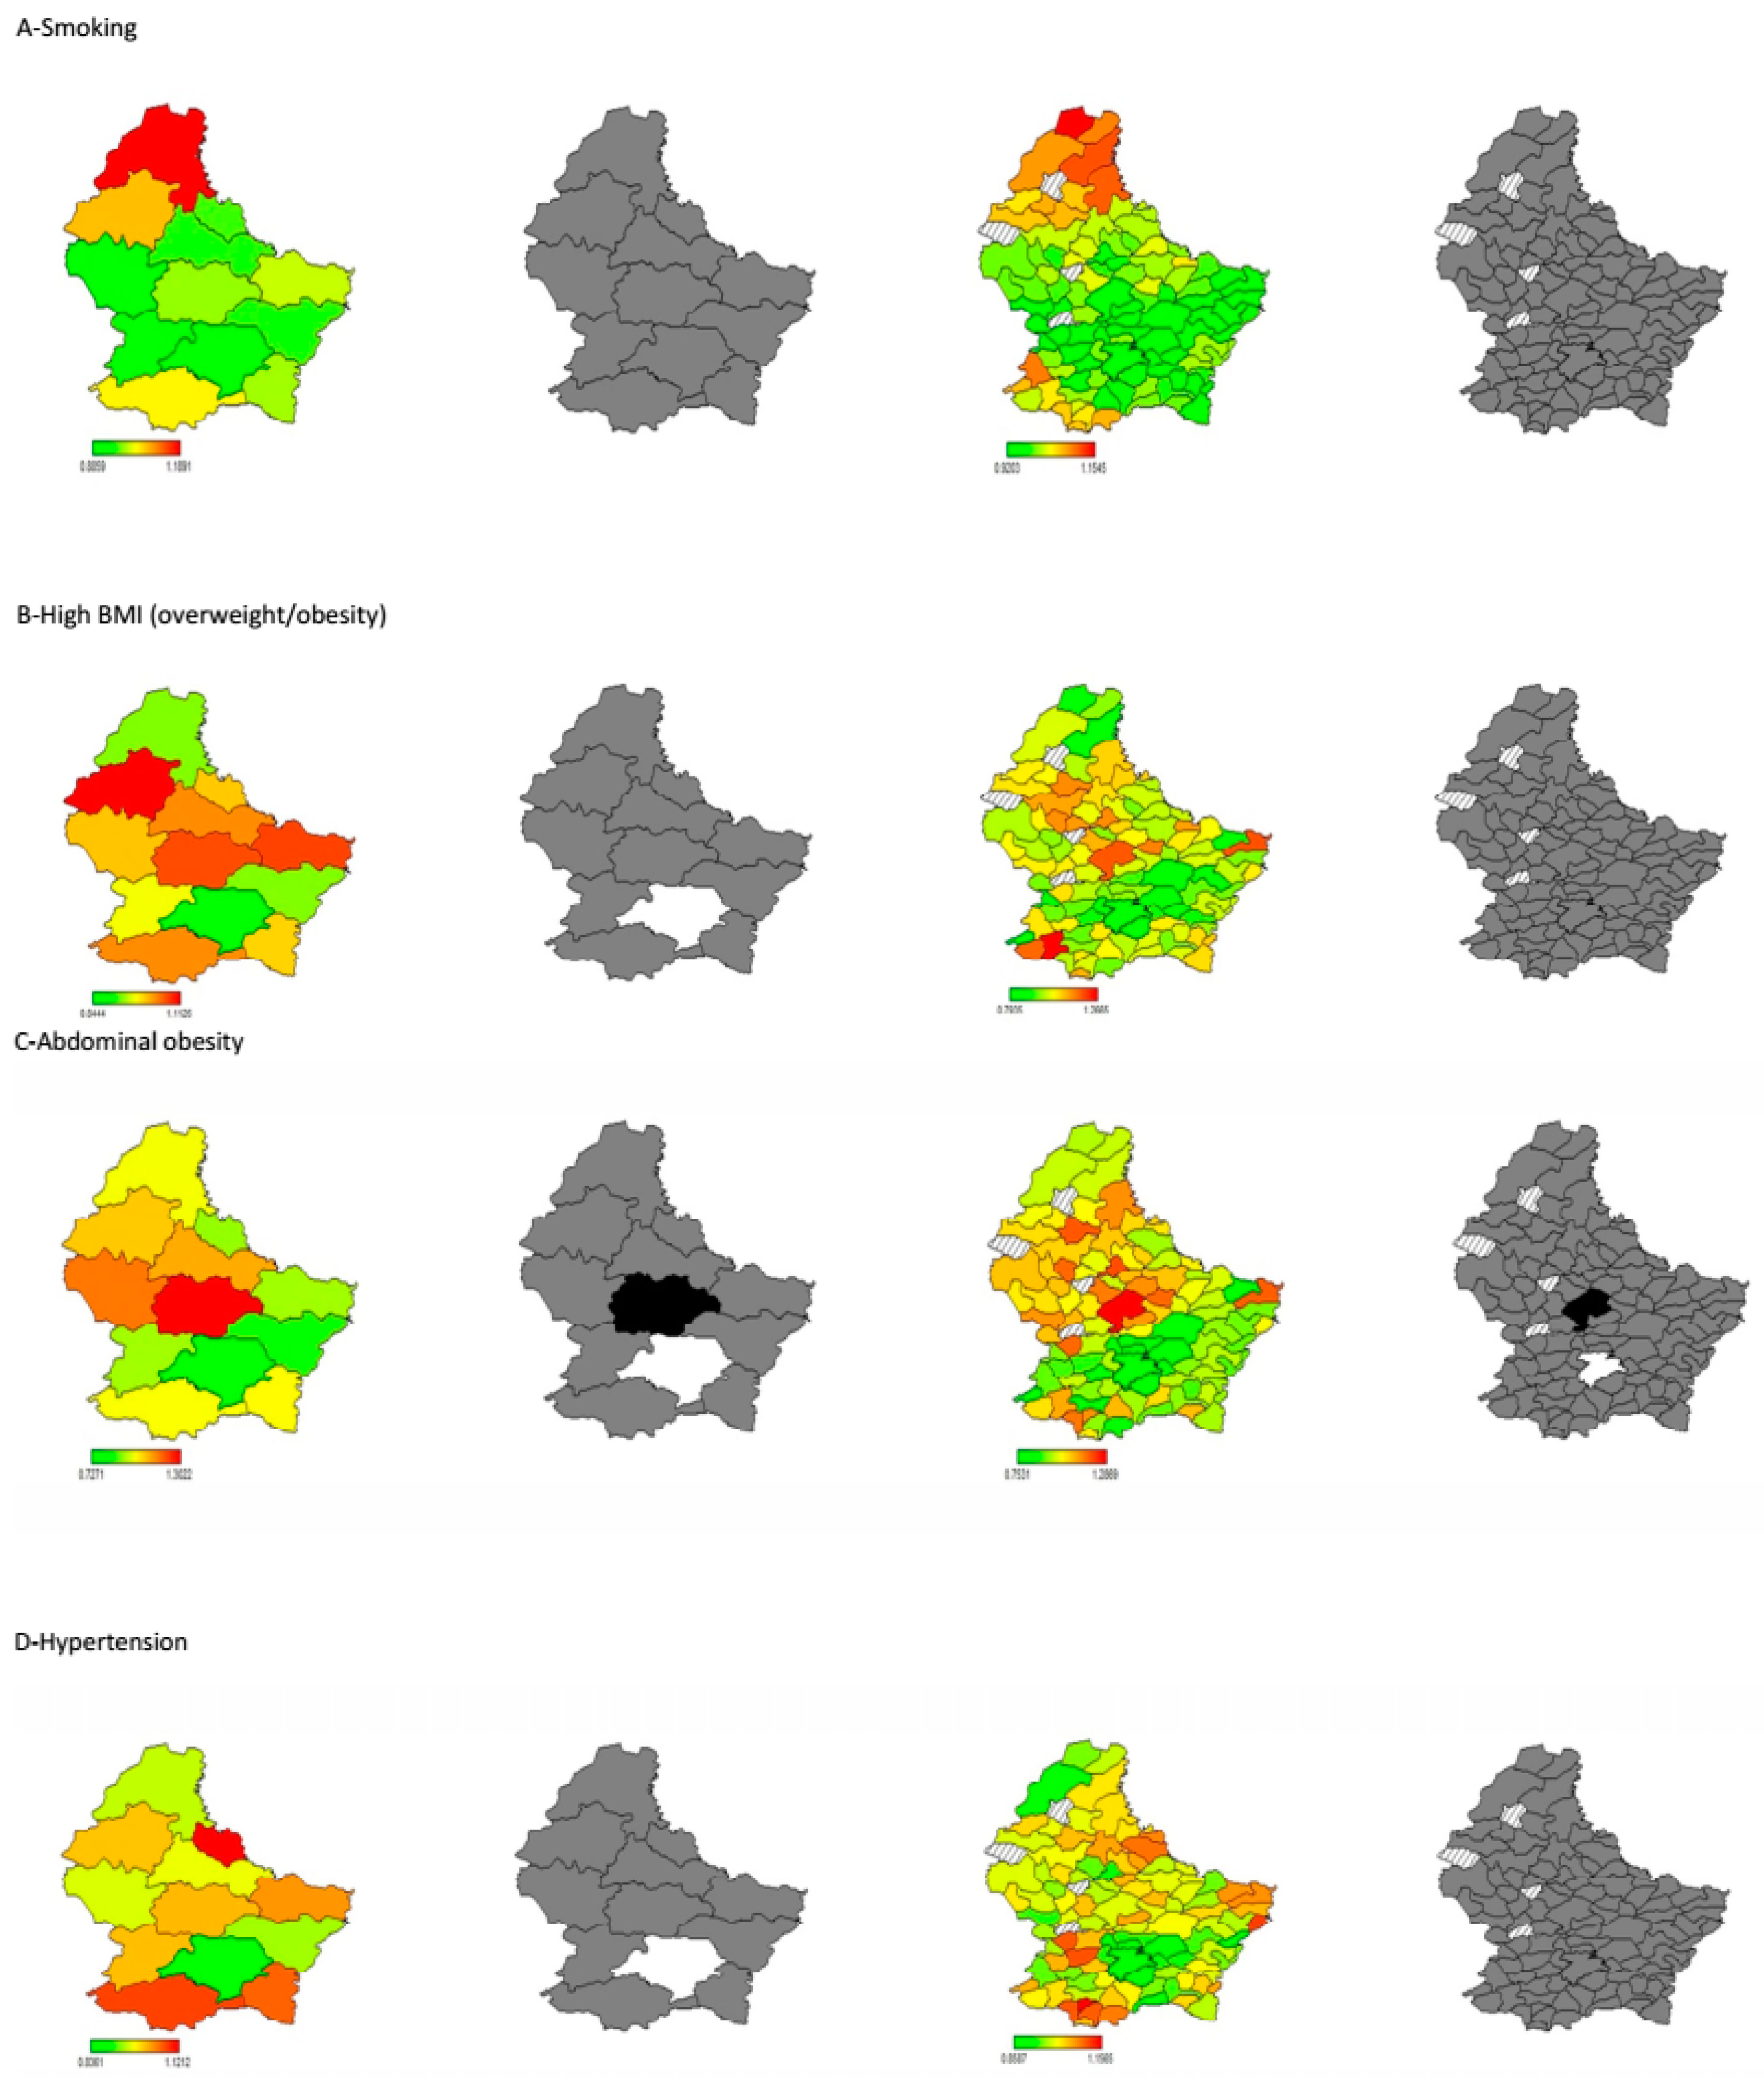
3.2.1. Smoking
3.2.2. High BMI
3.2.3. Abdominal Obesity
3.2.4. Hypertension
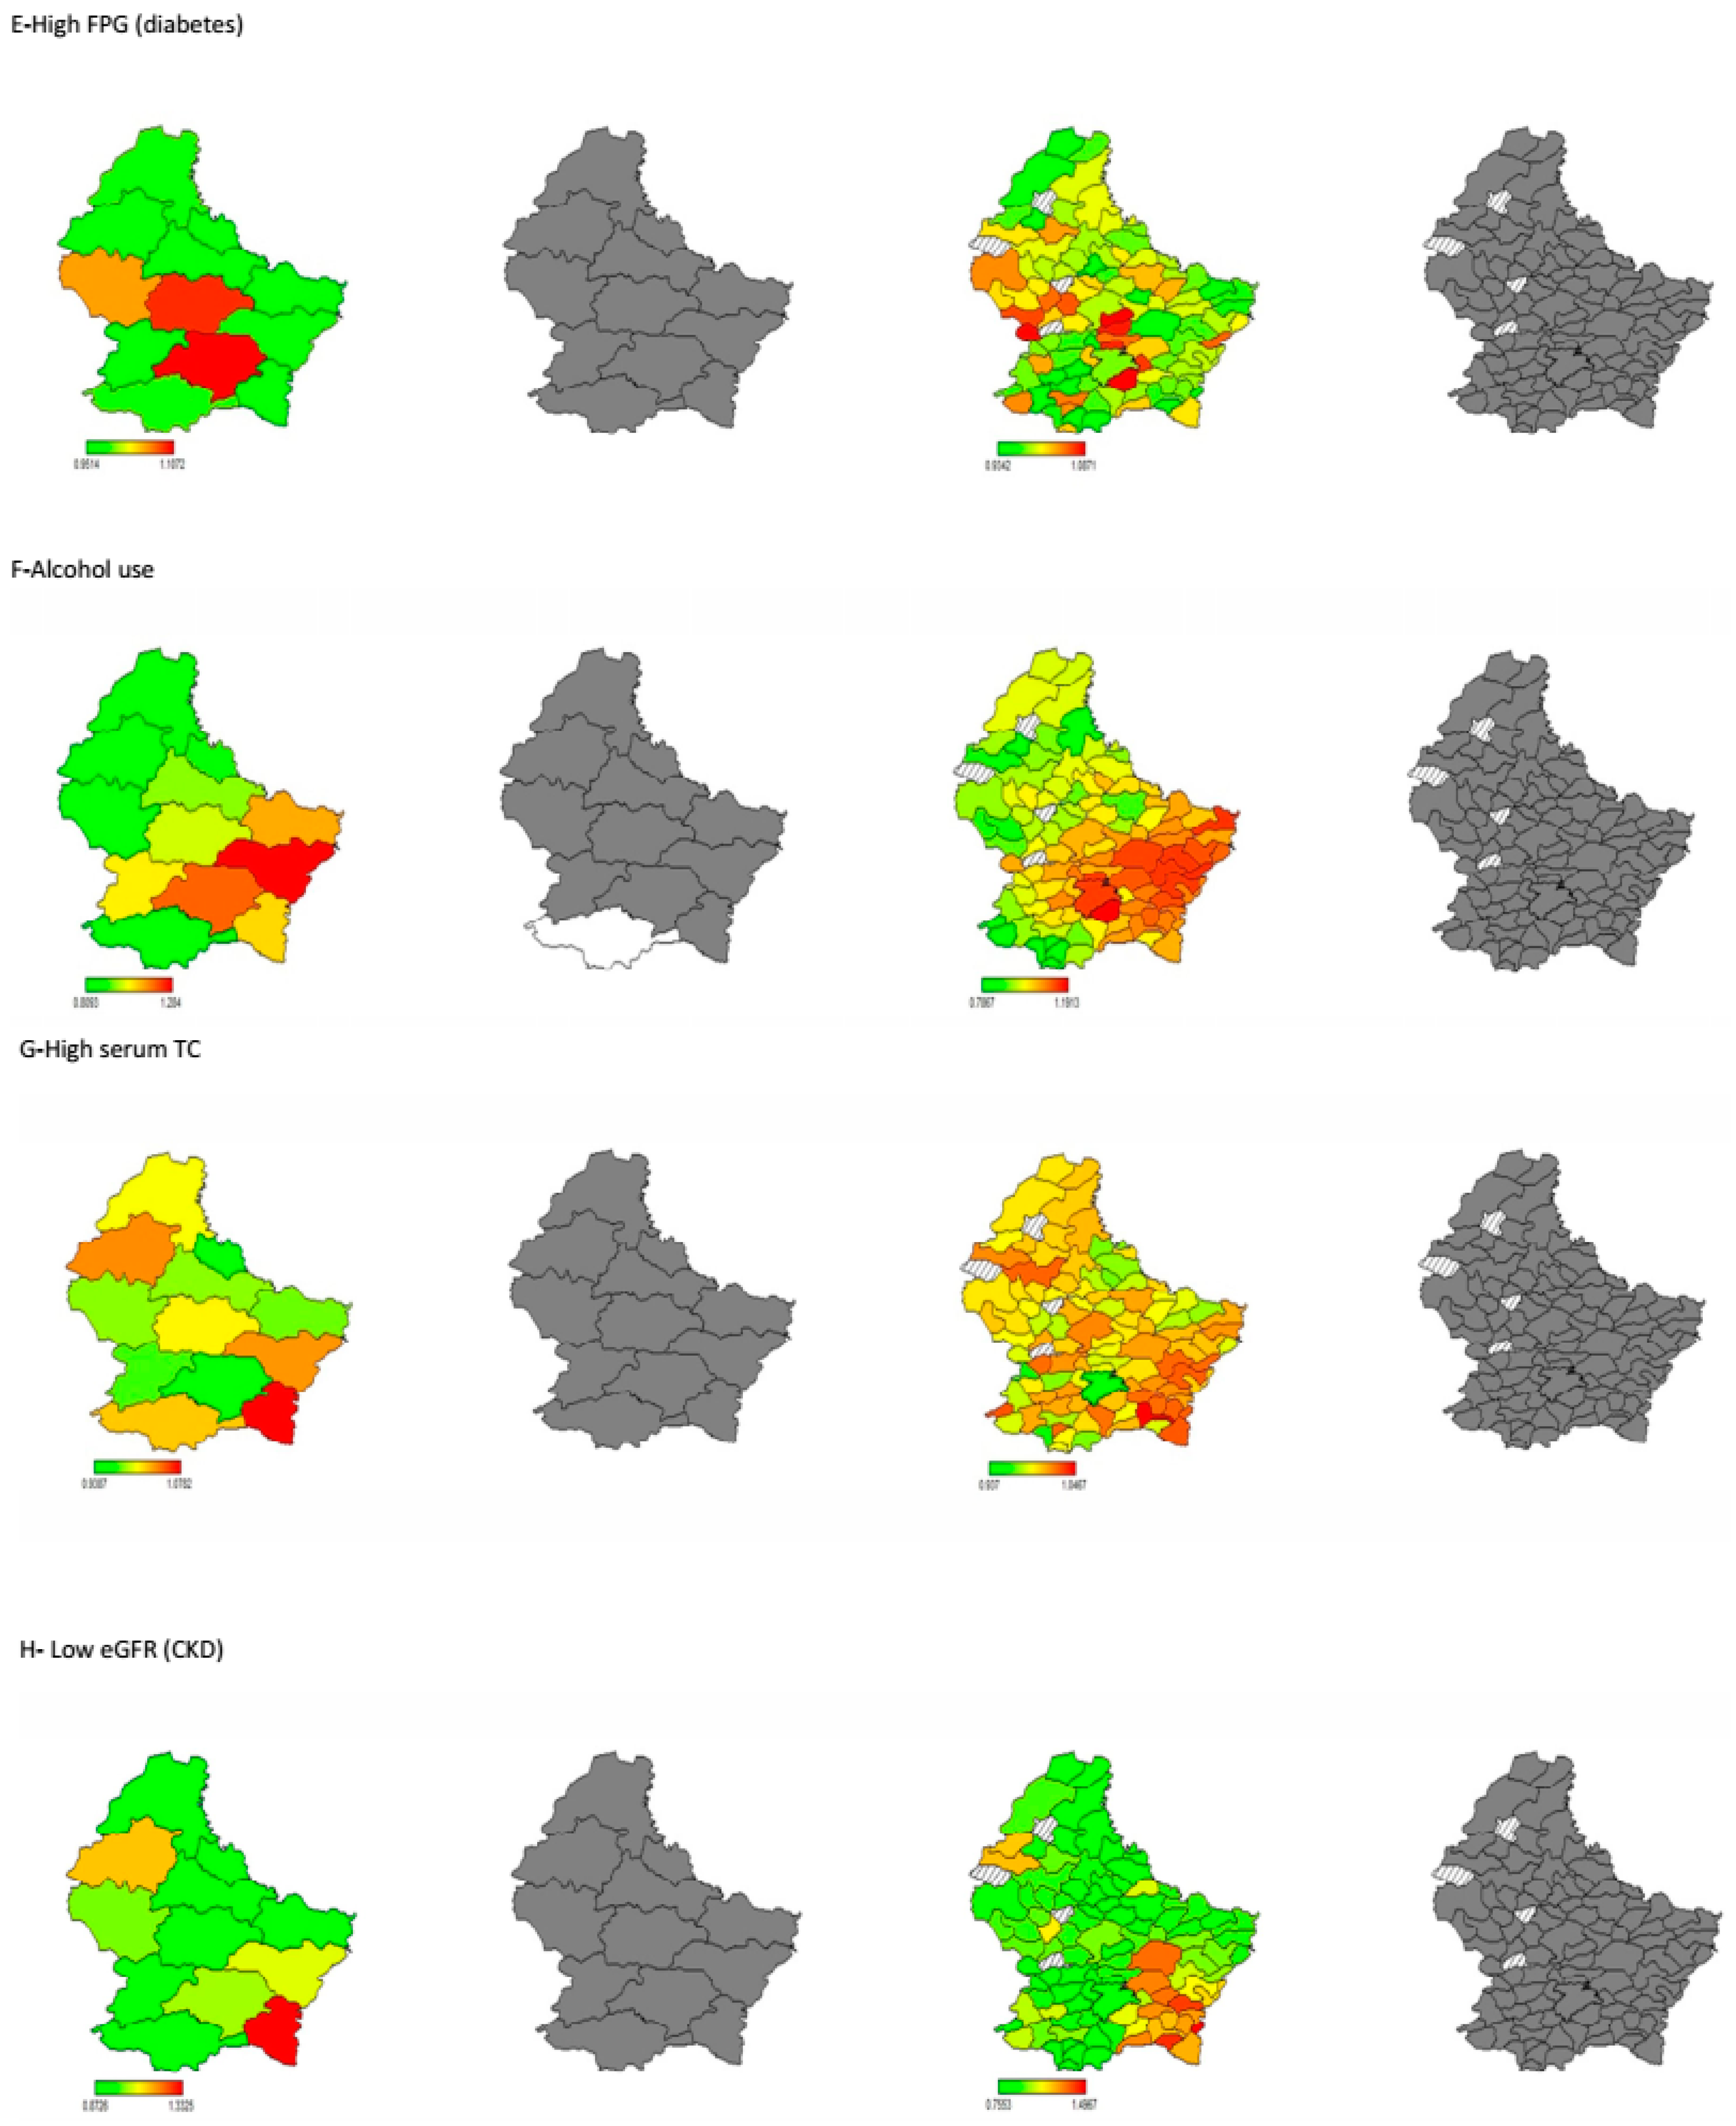
3.2.5. Diabetes
3.2.6. Alcohol Use
3.2.7. High Serum Total Cholesterol
3.2.8. Low eGFR
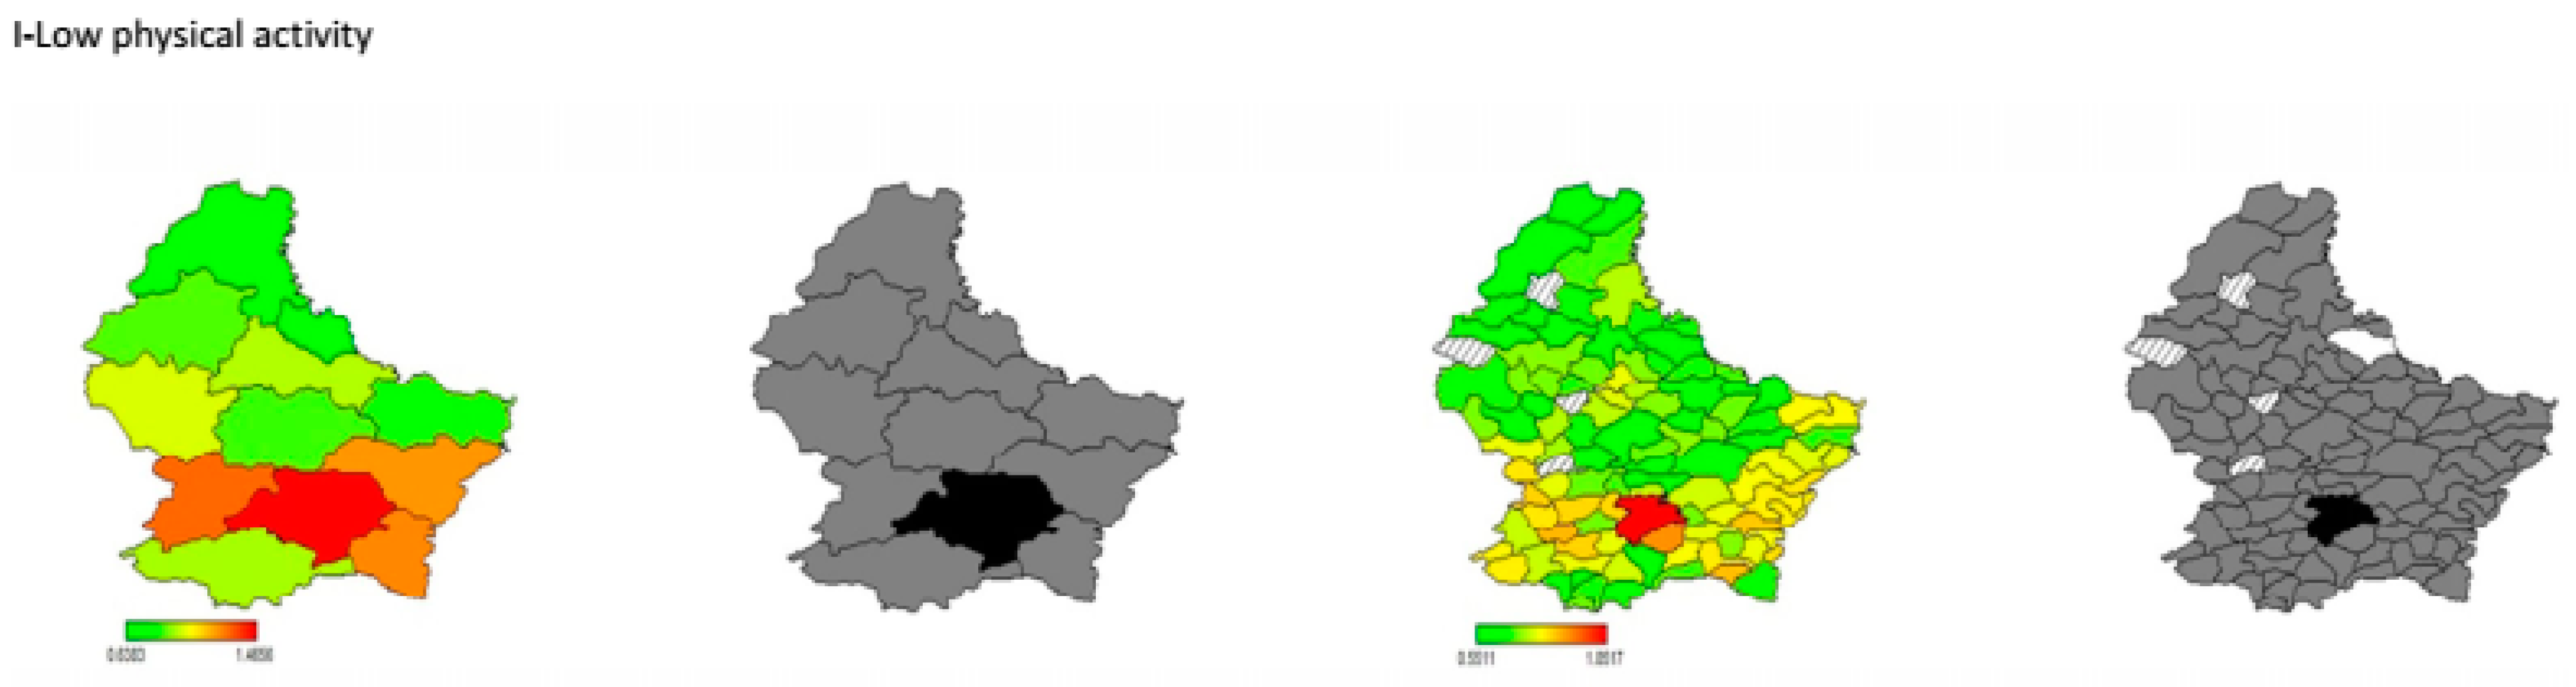
3.2.9. Low Physical Activity
4. Discussion
5. Conclusions
Supplementary Materials
Author Contributions
Conflicts of Interest
References
- Lozano, R.; Naghavi, M.; Foreman, K.; Lim, S.; Shibuya, K.; Aboyans, V.; Abraham, J.; Adair, T.; Aggarwal, R.; Ahn, S.Y.; et al. Global and regional mortality from 235 causes of death for 20 age groups in 1990 and 2010: A systematic analysis for the Global Burden of Disease Study 2010. Lancet 2012, 380, 2095–2128. [Google Scholar] [CrossRef]
- Murray, C.J.; Lopez, A.D. Measuring the global burden of disease. N. Engl. J. Med. 2013, 369, 448–457. [Google Scholar] [CrossRef] [PubMed]
- Forouzanfar, M.H.; Alexander, L.; Anderson, H.R.; Bachman, V.F.; Biryukov, S.; Brauer, M.; Burnett, R.; Casey, D.; Coates, M.M.; Cohen, A.; et al. Global, regional, and national comparative risk assessment of 79 behavioural, environmental and occupational, and metabolic risks or clusters of risks in 188 countries, 1990–2013: A systematic analysis for the Global Burden of Disease Study 2013. Lancet 2015, 386, 2287–2323. [Google Scholar] [CrossRef]
- Yang, Z.J.; Liu, J.; Ge, J.P.; Chen, L.; Zhao, Z.G.; Yang, W.Y. Prevalence of cardiovascular disease risk factor in the Chinese population: The 2007–2008 China National Diabetes and Metabolic Disorders Study. Eur. Heart J. 2012, 33, 213–220. [Google Scholar] [CrossRef] [PubMed]
- Greenlund, K.J.; Giles, W.H.; Keenan, N.L.; Croft, J.B.; Casper, M.L.; Matson-Koffman, D. Prevalence of multiple cardiovascular disease risk factors among women in the United States, 1992 and 1995: The Behavioral Risk Factor Surveillance System. J. Womens Health 1998, 7, 1125–1133. [Google Scholar] [CrossRef] [PubMed]
- Ford, E.S.; Li, C.; Zhao, G.; Pearson, W.S.; Capewell, S. Trends in the prevalence of low risk factor burden for cardiovascular disease among United States adults. Circulation 2009, 120, 1181–1188. [Google Scholar] [CrossRef] [PubMed]
- Derby, C.A.; Wildman, R.P.; McGinn, A.P.; Green, R.R.; Polotsky, A.J.; Ram, K.T.; Barnhart, J.; Weiss, G.; Santoro, N. Cardiovascular risk factor variation within a Hispanic cohort: SWAN, the Study of Women’s Health Across the Nation. Ethn Dis. 2010, 20, 396–402. [Google Scholar] [PubMed]
- Alkerwi, A.; Sauvageot, N.; Donneau, A.F.; Lair, M.L.; Couffignal, S.; Beissel, J.; Delagardelle, C.; Wagener, Y.; Albert, A.; Guillaume, M. First nationwide survey on cardiovascular risk factors in Grand-Duchy of Luxembourg (ORISCAV-LUX). BMC Public Health 2010, 10, 468. [Google Scholar] [CrossRef] [PubMed]
- Lee, D.S.; Chiu, M.; Manuel, D.G.; Tu, K.; Wang, X.; Austin, P.C.; Mattern, M.Y.; Mitiku, T.F.; Svenson, L.W.; Putnam, W.; et al. Trends in risk factors for cardiovascular disease in Canada: Temporal, socio-demographic and geographic factors. CMAJ 2009, 181, E55–E66. [Google Scholar] [CrossRef] [PubMed]
- Jarvie, J.L.; Johnson, C.E.; Wang, Y.; Aslam, F.; Athanasopoulos, L.V.; Pollin, I.; Foody, J.M. Geographic variance of cardiovascular risk factors among community women: The national Sister to Sister campaign. J. Womens Health (Larchmt) 2011, 20, 11–19. [Google Scholar] [CrossRef] [PubMed]
- Gu, D.; Gupta, A.; Muntner, P.; Hu, S.; Duan, X.; Chen, J.; Reynolds, R.F.; Whelton, P.K.; He, J. Prevalence of cardiovascular disease risk factor clustering among the adult population of China: Results from the International Collaborative Study of Cardiovascular Disease in Asia (InterAsia). Circulation 2005, 112, 658–665. [Google Scholar] [CrossRef] [PubMed]
- Nuur Amalina, A.G.; Jamaiyah, H.; Selvarajah, S.; NHMS Cohort Study Group. Geographical variation of cardiovascular risk factors in Malaysia. Med. J. Malays. 2012, 67, 31–38. [Google Scholar]
- Kandala, N.B.; Stranges, S. Geographic variation of overweight and obesity among women in Nigeria: A case for nutritional transition in sub-Saharan Africa. PLoS ONE 2014, 9, e101103. [Google Scholar] [CrossRef] [PubMed]
- Kandala, N.B.; Tigbe, W.; Manda, S.O.; Stranges, S. Geographic variation of hypertension in sub-saharan Africa: A case study of South Africa. Am. J. Hypertens. 2013, 26, 382–391. [Google Scholar] [CrossRef] [PubMed]
- Breckenkamp, J.; Mielck, A.; Razum, O. Health inequalities in Germany: Do regional-level variables explain differentials in cardiovascular risk? BMC Public Health 2007, 7, 132. [Google Scholar] [CrossRef] [PubMed]
- Alkerwi, A.; Pagny, S.; Lair, M.L.; Delagardelle, C.; Beissel, J. Level of unawareness and management of diabetes, hypertension, and dyslipidemia among adults in Luxembourg: Findings from ORISCAV-LUX study. PLoS ONE 2013, 8, e57920. [Google Scholar] [CrossRef] [PubMed]
- Glass, G.E. Update: Spatial aspects of epidemiology: The interface with medical geography. Epidemiol. Rev. 2000, 22, 136–139. [Google Scholar] [CrossRef] [PubMed]
- Moore, D.A.; Carpenter, T.E. Spatial analytical methods and geographic information systems: Use in health research and epidemiology. Epidemiol. Rev. 1999, 21, 143–161. [Google Scholar] [CrossRef] [PubMed]
- Rezaeian, M.; Dunn, G.; St Leger, S.; Appleby, L. Geographical epidemiology, spatial analysis and geographical information systems: A multidisciplinary glossary. J. Epidemiol. Community Health 2007, 61, 98–102. [Google Scholar] [CrossRef] [PubMed]
- Alkerwi, A.; Donneau, A.F.; Sauvageot, N.; Lair, M.L.; Scheen, A.; Albert, A.; Guillaume, M. Prevalence of the metabolic syndrome in Luxembourg according to the Joint Interim Statement definition estimated from the ORISCAV-LUX study. BMC Public Health 2011, 11, 4. [Google Scholar] [CrossRef] [PubMed]
- Alkerwi, A.; Donneau, A.F.; Sauvageot, N.; Lair, M.L.; Albert, A.; Guillaume, M. Dietary, behavioural and socio-economic determinants of the metabolic syndrome among adults in Luxembourg: Findings from the ORISCAV-LUX study. Public Health Nutr. 2012, 15, 849–859. [Google Scholar] [CrossRef] [PubMed]
- Alkerwi, A.; Sauvageot, N.; Couffignal, S.; Albert, A.; Lair, M.L.; Guillaume, M. Comparison of participants and non-participants to the ORISCAV-LUX population-based study on cardiovascular risk factors in Luxembourg. BMC Med. Res. Methodol. 2010, 10, 80. [Google Scholar] [CrossRef] [PubMed]
- Heart, T.N. Executive summary of the clinical guidelines on the identification, evaluation, and treatment of overweight and obesity in adults. Arch. Intern. Med. 1998, 158, 1855–1867. [Google Scholar]
- Mancia, G.; De Backer, G.; Dominiczak, A.; Cifkova, R.; Fagard, R.; Germano, G.; Grassi, G.; Heagerty, A.M.; Kjeldsen, S.E.; Laurent, S.; et al. 2007 Guidelines for the management of arterial hypertension: The Task Force for the Management of Arterial Hypertension of the European Society of Hypertension (ESH) and of the European Society of Cardiology (ESC). Eur. Heart J. 2007, 28, 1462–1536. [Google Scholar] [CrossRef] [PubMed]
- Ryden, L.; Standl, E.; Bartnik, M.; Van den Berghe, G.; Betteridge, J.; De Boer, M.J.; Cosentino, F.; Jönsson, B.; Laakso, M.; Malmberg, K.; et al. Guidelines on diabetes, pre-diabetes, and cardiovascular diseases: Executive summary. The Task Force on Diabetes and Cardiovascular Diseases of the European Society of Cardiology (ESC) and of the European Association for the Study of Diabetes (EASD). Eur. Heart J. 2007, 28, 88–136. [Google Scholar] [PubMed]
- Traynor, J.; Mactier, R.; Geddes, C.C.; Fox, J.G. How to measure renal function in clinical practice. BMJ 2006, 333, 733–737. [Google Scholar] [CrossRef] [PubMed]
- National Cholesterol Education Program Expert Panel on Detection, Evaluation, and Treatment of High Blood Cholesterol in Adults. Third Report of the National Cholesterol Education Program (NCEP) Expert Panel on Detection, Evaluation, and Treatment of High Blood Cholesterol in Adults (Adult Treatment Panel III) final report. Circulation 2002, 106, 3143–3421. [Google Scholar]
- Brezger, A.; Kneib, T.; Lang, S. BayesX: Analyzing Bayesian Structured Additive Regression Models. Available online: https://www.jstatsoft.org/article/view/v014i11/v14i11.pdf (accessed on 5 June 2017).
- Griffiths, C.; Goldblatt, P.; Fitzpatrick, J. Geographic variations in health: Main findings and implications for the future. In Geographic Variations in Health; Griffiths, C., Fitzpatrick, J., Eds.; The Stationery Office: London, UK, 2001; pp. 359–368. [Google Scholar]
- Gebreab, S.Y.; Davis, S.K.; Symanzik, J.; Mensah, G.A.; Gibbons, G.H.; Diez-Roux, A.V. Geographic variations in cardiovascular health in the United States: Contributions of state- and individual-level factors. J. Am. Heart Assoc. 2015, 4, e001673. [Google Scholar] [CrossRef] [PubMed]


| Top Leading Risk Factors | Definition |
|---|---|
| Smoking | Current daily or occasional tobacco consumption |
| High BMI (overweight/obesity) | Body-mass index > 25 kg/m2 were considered as overweight/obese [23] |
| High BP (hypertension) | SBP ≥ 140 mmHg and/or DBP ≥ 90 mmHg and/or antihypertensive medications intake [24] |
| High FPG (diabetes) | FPG ≥ 126 mg/dL and/or antidiabetic medications intake [25] |
| Alcohol use | Daily alcohol consumption measured in mL per day |
| High total cholesterol | Total cholesterol >4.8 mmol/L (185.6 mg/dL) [3] |
| Low GFR (CKD) * | eGFR <60 mL per min per 1.73 m2 [26] |
| Low physical activity | Weekly physical activity <8000 Metabolic Equivalent of Task (MET) min per week [3] |
| High abdominal obesity | Waist circumference (WC) ≥ 102 cm for men and ≥88 cm for women [27] |
| Overall Characteristics | N * | Total Sample | Men | Women | p-Value |
|---|---|---|---|---|---|
| Total n (%) | 696 (50.38) | 734 (49.62) | |||
| Age, years | 42.03 (0.04) | 41.89 (0.06) | 42.16 (0.06) | 0.66 | |
| Tobacco Consumption, (%) | 1430 | 0.04 | |||
| Non-smoker | 1123 (77.69) | 531(75.10) | 592 (80.32) | ||
| Smoker | 307 (22.31) | 165 (24.90) | 142 (19.68) | ||
| Body Mass Index, (%) | 1429 | <0.001 | |||
| Low BMI | 621 (46.11) | 227 (36.09) | 394 (56.27) | ||
| High BMI | 808 (53.89) | 468 (63.91) | 340 (43.73) | ||
| Abdominal obesity, (%) | 1429 | <0.001 | |||
| Non-obese | 968 (70.14) | 505 (74.89) | 463 (65.33) | ||
| Obese | 461 (29.86) | 190 (25.11) | 271 (34.67) | ||
| Hypertension, (%) | 1429 | <0.001 | |||
| Non-hypertensive | 889 (65.42) | 373 (58.04) | 516 (72.91) | ||
| Hypertensive | 540 (34.58) | 322 (41.96) | 218 (27.09) | ||
| Diabetes, (%) | 1396 | 0.17 | |||
| Non-diabetic | 1327 (95.64) | 638 (94.82) | 689 (96.46) | ||
| Diabetic | 69 (4.36) | 39 (5.18) | 30 (3.54) | ||
| Alcohol Consumption, (%) | 1350 | <0.001 | |||
| Non-drinker | 229 (17.53) | 68 (10.91) | 161 (24.25) | ||
| Drinker | 1121 (82.47) | 588 (89.09) | 533 (75.75) | ||
| Total Cholesterol, (%) | 1425 | 0.67 | |||
| Low TC | 519 (39.78) | 257 (40.35) | 262 (39.20) | ||
| High TC | 906 (60.22) | 438 (59.65) | 468 (60.80) | ||
| Low eGFR, (%) | 1425 | 0.59 | |||
| ≥60 | 1401 (98.51) | 682 (98.35) | 719 (98.67) | ||
| <60 | 24 (1.49) | 13 (1.65) | 11 (1.33) | ||
| Physical Activity, (%) | 1364 | 0.65 | |||
| Low physical activity | 1225 (89.48) | 592 (88.70) | 633 (90.27) | ||
| High physical activity | 139 (10.52) | 70 (11.30) | 69 (9.73) |
© 2017 by the authors. Licensee MDPI, Basel, Switzerland. This article is an open access article distributed under the terms and conditions of the Creative Commons Attribution (CC BY) license (http://creativecommons.org/licenses/by/4.0/).
Share and Cite
Alkerwi, A.; Bahi, I.E.; Stranges, S.; Beissel, J.; Delagardelle, C.; Noppe, S.; Kandala, N.-B. Geographic Variations in Cardiometabolic Risk Factors in Luxembourg. Int. J. Environ. Res. Public Health 2017, 14, 648. https://doi.org/10.3390/ijerph14060648
Alkerwi A, Bahi IE, Stranges S, Beissel J, Delagardelle C, Noppe S, Kandala N-B. Geographic Variations in Cardiometabolic Risk Factors in Luxembourg. International Journal of Environmental Research and Public Health. 2017; 14(6):648. https://doi.org/10.3390/ijerph14060648
Chicago/Turabian StyleAlkerwi, Ala’a, Illiasse El Bahi, Saverio Stranges, Jean Beissel, Charles Delagardelle, Stephanie Noppe, and Ngianga-Bakwin Kandala. 2017. "Geographic Variations in Cardiometabolic Risk Factors in Luxembourg" International Journal of Environmental Research and Public Health 14, no. 6: 648. https://doi.org/10.3390/ijerph14060648